Article

Deciphering the Tanzanian Ruby–Zoisite Enigma: A Confluence of Geochemistry, Microtextures, and Mineralogy

1
School of Gemology, China University of Geosciences, Beijing 100083, China
2
National Mineral Rock and Fossil Specimens Resource Center, China University of Geosciences, Beijing 100083, China
3
Beijing Key Labroratory of Mineral Environmental Function, School of Earth and Space Sciences, Peking University, Beijing 100871, China
*
Author to whom correspondence should be addressed.
Crystals 2025, 15(11), 926; https://doi.org/10.3390/cryst15110926
Submission received: 19 September 2025 / Revised: 21 October 2025 / Accepted: 23 October 2025 / Published: 28 October 2025
(This article belongs to the Collection Topic Collection: Mineralogical Crystallography)

Abstract

The Longido region (Tanzania) hosts a distinct corundum–zoisite paragenesis, renowned for its ornamental value and geological significance as a tracer of Pan-African tectonothermal events. Through integrated analyses—including electron probe microanalysis (EMPA), LA-ICP-MS, XRF mapping, and SEM-EDS on five representative samples—we posit that the genetic model for the zoisite–corundum is that pargasite and early-stage corundum were the protolith, which experienced zoisitization prior to hydrothermal fluid influx. This fluid event induced the replacement of zoisite and mechanical compression by newly crystallized corundum. Key findings include textural–chemical concordance: rubies exhibit Al2O3 >98 wt.% with Si anomalies (>5000 ppm) in transitional zones, indicative of fluid-mediated replacement of precursor zoisite. Combined mineralogy, this study explored the debated genesis of Longido red corundum–zoisite assemblages, and a rough model was obtained.

1. Introduction

Tanzania, situated in southeastern-central Africa, has experienced prolonged tectonic activity, including terrane accretion and orogenic events, which have resulted in a complex geological setting in mineral resources [1]. The country is globally renowned for its ruby and sapphire deposits, notably from the Longido [2], Umba Valley, Morogoro, Kreb, and Mahenge placer mining areas. However, rubies from these regions (both rough and cut stones) exhibit several inherent limitations. These include a high density of inclusions and fractures, low transparency (leading to poor brilliance), and elevated Fe content. Some specimens also contain excessive Cr concentrations, resulting in a deep red hue that compromises translucency. To improve color saturation and clarity, heat treatment is widely applied to enhance the appearance of most Tanzanian rubies [3].
Current gemological research focuses primarily on gem-grade corundum deposits in the Merelani-Lelatema Belt, Ruvuma, Lindi, and Mtwara regions (e.g., Schwar), while systematic studies of semi-translucent to opaque rubies from the Longido area remain limited. The unique paragenesis of red corundum with zoisite is a distinctive feature of the Longido deposit [4,5,6], although similar red corundum–zoisite assemblages have been sporadically reported in Greece and Japan [7,8]. In broader terms, the occurrence of “red-green gemstone”, such as ruby–zoisite and related materials, has also been documented in analogous deposits in Kenya and other Tanzanian localities [9].
Ruby–zoisite, commonly traded as a “red-green gemstone,” holds significant economic value alongside ruby itself. These distinctive paragenetic assemblages are prized globally as ornamental mineral specimens, renowned for their striking red-green color contrast (Figure 1) and popular among museums, research institutions, and private collectors. A systematic analysis of their mineralogy, texture, chemical composition, and, most importantly, their paragenetic sequence is essential to deciphering the genetic history of the Longido rubies. Such a study would also provide a theoretical basis for exploring new deposits of red corundum and corundum–zoisite assemblages in this region.
While most studies primarily document the geological settings of red corundum–zoisite paragenesis, Yang et al. [5] stand out for proposing a genetic model. This model comprises two key hypotheses: (1) an eclogite protolith underwent subduction-related peak metamorphism under elevated P-T conditions, followed by rapid exhumation via magmatic uplift, which induced retrograde metamorphism and formed zoisite, pargasite, and carbonates; and (2) a multi-stage metamorphic evolution involved initial prograde stages (from amphibolite/blueschist to eclogite facies) before peak metamorphism, succeeded by retrograde overprinting (eclogite → amphibolite → epidote-amphibolite/greenschist facies), with evidence preserved as inclusions and in country rocks [10]. However, Yang’s model is based predominantly on mineral assemblages, lacking analysis of cross-cutting relationships or replacement textures necessary to establish a robust paragenetic sequence. Consequently, the proposed mechanism for the zoisite–corundum relationship remains unconvincing and requires validation through microstructural evidence.

2. Geological Research in Tanzania, Longido

Africa experienced extensive terrain accretion and orogenic events before the Precambrian, followed by a period of post-Precambrian tectonic quiescence that preserved well-defined geological features [11]. In Tanzania (east-central Africa), the tectonic framework consists of two main domains: 1. The Tanzania Archean Craton—composed of Archean granites, gneisses, migmatites, and sporadic greenstone belts and schist zones, all entirely overlain by Proterozoic strata. 2. The surrounding orogenic belts (e.g., Ubendian, Kibaran, and Mozambique belts)—dominated by Proterozoic high-grade metamorphic rocks of sedimentary and igneous origin, with reworked Archean components [11,12].
From the Paleozoic to Cenozoic, sedimentary basins (rift valleys, inland basins, and coastal plains) developed across the Pan-African Mozambique Belt in southeastern Tanzania [13]. Rubies in this region formed predominantly in high-temperature, Al-rich, Si-poor environments.
The Neoproterozoic gemstone metallogenic belt within the Mozambique Belt spans northeastern Tanzania and southern Kenya, dominated by ultramafic rocks (high-grade metamorphic mafic–felsic granulites, gneisses, and quartzites) [11]. The gem deposits in this belt, including the rubies from Longjido (Figure 2), are predominantly of magmatic-hydrothermal-metamorphic origin, with limited occurrences of other gem species (Table 1).
Gem deposits in southern Tanzania (e.g., Kreb) form a southern extension of the gem-rich zones in Kenya (e.g., Namanga, Kassig), sharing geological characteristics with the Longido-type deposits. Key analogs include the following: 1. Namanga (Kenya): This high-temperature hydrothermal deposit occurs within Precambrian gneisses and thin-bedded crystalline limestone. Mineralization, including ruby and demantoid garnet [Ca3Fe2(SiO4)3], is found in graphite schist layers accompanied by epidotization. 2. Kassig and Kreb: These deposits exhibit a similar lithostratigraphy to Namanga. Kassig produces semi-transparent, cabochon-grade rubies and coarse demantoids, while Kreb yields rosy-hued rubies as single crystals, flakes, or fine veinlets [9].
Longido, within the Tanzania Craton and Neoproterozoic Mozambique gem belt, the Longido area underwent intense Pan-African diastrophism that reworked regional structures through thrust stacking, shearing, and widespread schistosity [11]. This polyphase deformation produced irregular ore bodies with magmatic–hydrothermal–metamorphic, magmatic–sedimentary, and low-grade metamorphic affinities. The stratigraphy sequence includes: 1. Paleoproterozoic orthogneiss at the base [15]; 2. Volcanic–sedimentary sequences overlying mafic–ultramafic intrusions. Gem mineralization is predominantly hosted in serpentinized ultramafic bodies and adjacent country rocks, including quartz-feldspar gneiss, Al-rich biotite–kyanite–garnet gneiss, quartzite, marble bands, and minor amphibolite [16].
The Longido terrane displays complex imbricate structures formed by Pan-African thrusting, folding, and shearing (Figure 3). The geological cross-section shows a central ultramafic–mafic core (Units 2, 4) affected by strong deformation, interrupted with discontinuous bands of syenitic gneiss (Unit 3). Corundum mineralization (Unit 6) occurs as thin layers to veinlets.

3. Samples and Methods

3.1. Sample Structure and Mineral Composition

An analysis of the paragenetic sequence was performed on five corundum–zoisite samples (CZ1–CZ5; Figure 4) from Longido, Tanzania.
Examination of hand specimens and thin sections allowed for the identification of mineral abundances and textural relationships (refer to Table 2).

3.2. Analytical Methods

SEM-EDS: Conducted on a Phenom Pro X (Phenom Scientific) desktop FE-SEM (Phenom-World, Eindhoven, The Netherlands) with EDS (carbon-coated samples, BSE mode, high vacuum; WD = 7.1 mm, spot size = 153 μm, 15 kV) (Bruker Corporation, Billerica, MA, USA). SEM is used to capture the microtopography of the mineral surface and conduct qualitative analysis of the transitional parts of the mineral and TR.
Polarized Light Microscopy (Leica, Wetzlar, Germany): Performed using a Leica DM4P system (5.2.0.26130) under transmitted (plane-/cross-polarized) and reflected light. These experiments were tested on the National Rock and Mineral Fossil Specimen Resource Sharing Platform of China University of Geosciences (Beijing).
Electron microprobe analysis (EMPA) was conducted on carbon-coated thin sections of samples CZ2–CZ4 using a Shimadzu EMPA-1720 (Shimadzu Corporation, Kyoto, Japan) at the China University of Geosciences (Beijing) Institute of Geological Analysis, operating at 15 kV accelerating voltage with a 5 μm beam diameter and 10.87 nA probe current, calibrated via ZAF correction. Spot scanning was applied to all sections, supplemented by line scanning for CZ2. An analysis was conducted on the chemical components of several minerals and the distribution of elements in the transitional regions.
Laser ablation inductively coupled plasma mass spectrometry (LA-ICP-MS) employed a 60 μm laser spot (6 Hz, 6 J/cm2) under He/Ar gas flow, with signals collected over 20 s (background) and 50 s (ablation). Data calibration utilized NIST610 [18,19] as the external standard, EMPA-derived Al for corundum, Si for zoisite, pargasite concentrations as the internal standard, and NIST612 for quality control, processed through ICP MS DataCal [18,19]. Analyze the trace chemical components of several minerals.

4. Results

4.1. Mineralogical Composition and Genetic Implications

Corundum, the predominant mineral of economic interest, exhibits semi-gem-grade quality in Longido, characterized by low transparency (hand specimens) and abundant fractures/parting (thin sections) with sparse inclusions. This textural degradation is attributed to Si-enriched crystallization environments (supported by LA-ICP-MS SiO2 data), which promoted lattice distortion through SiO2 overweight (>1000 ppm) and pervasive fracturing. Paragenetic sequence is shown in Table 3 (synthesized from petrography):

4.2. Chemical Geo-Chemical Zoisite–Corundum Paragenesis

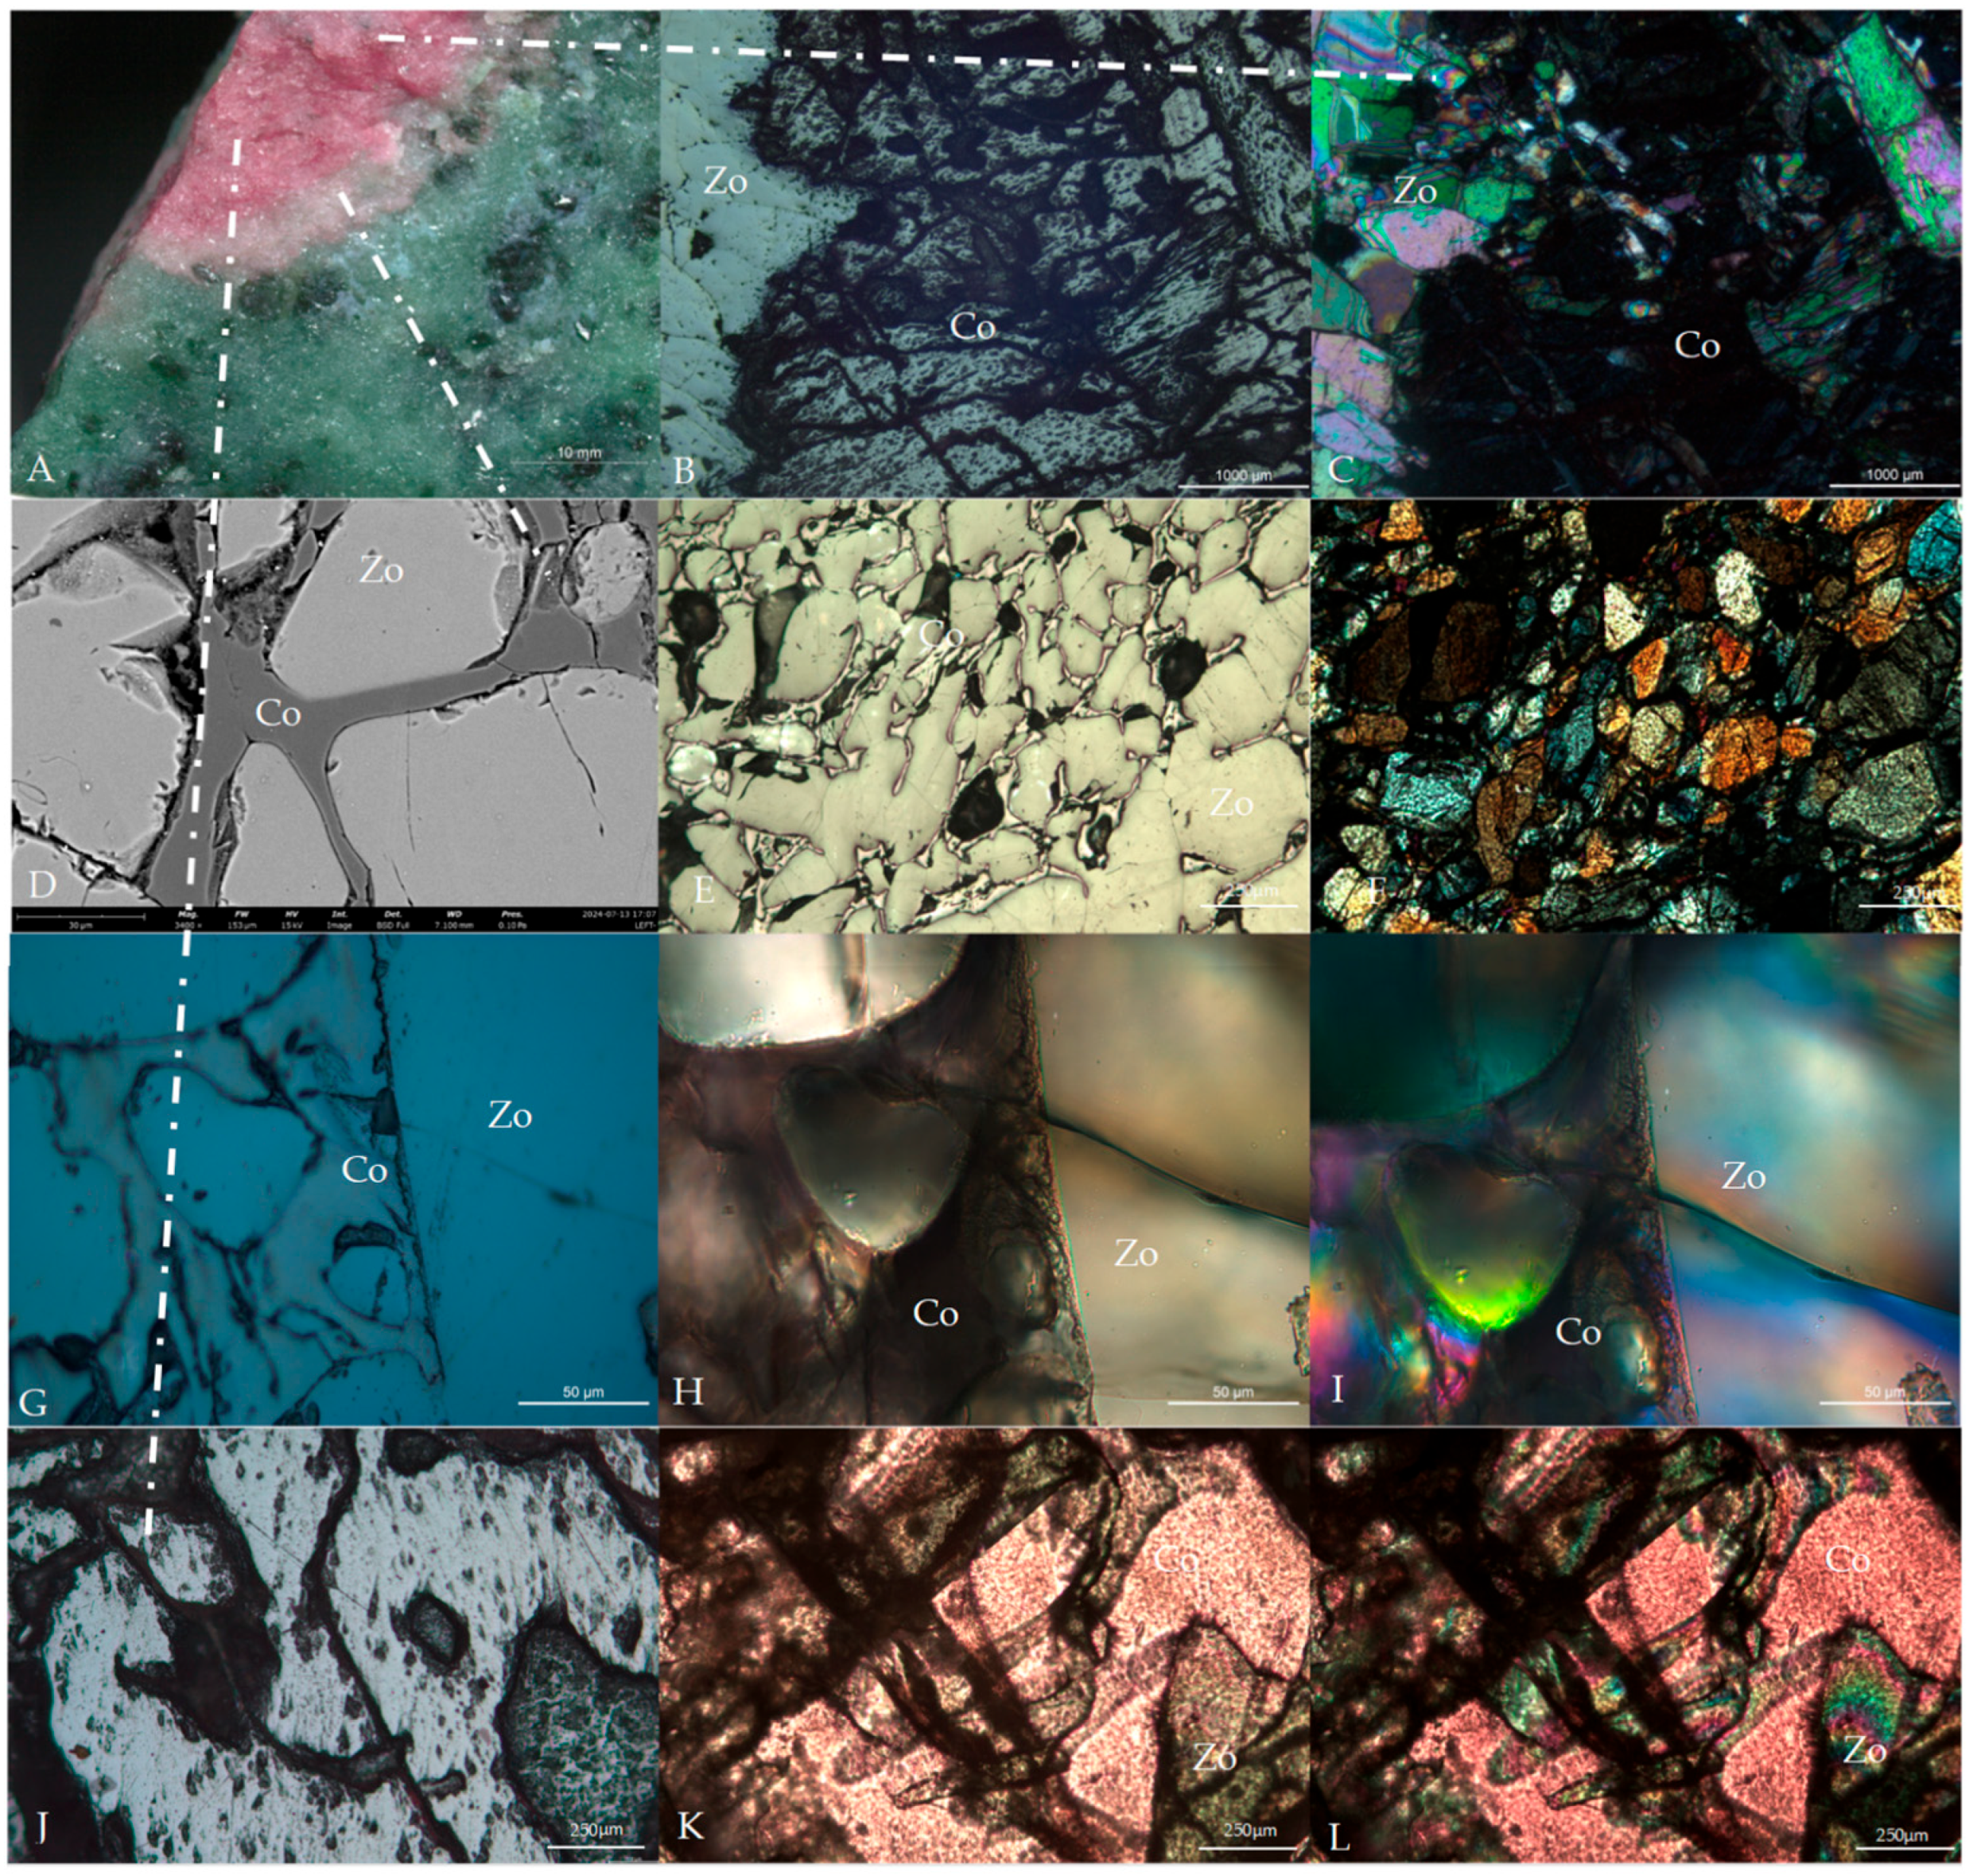
The rubies from the study area exhibit high Al2O3 (>97 wt.%) with spatially variable trace-element concentrations. Matrix corundum (e.g., red corundum matrix 1–2) is enriched in Cr (1986–2006 ppm; Table 4), consistent with a mafic protolith. In contrast, transitional corundum (e.g., transitional red corundum 1–2) shows significant Si enrichment (up to 11,419 ppm; Table 4) [20], correlating with micrometric zoisite inclusions observed microscopically and indicating zoisite replacement by Al-rich fluids (Figure 5 and Figure 6). All analyzed corundum types plot within the mafic–ultramafic field on the FeO–MgO–V2O3–Cr2O3 vs. FeO+TiO2+Ga2O3 diagram of Giuliani [14] (matrix: −0.18/0.30; transitional: −0.28/0.27; Table 5), suggesting a mantle-derived fluid source [21,22]. In contrast, other relevant studies have primarily focused on the roles of Cr and Fe ions, as well as temperature and pressure conditions [23], in corundum crystal growth, while the influence of Si during corundum crystallization has not been addressed.
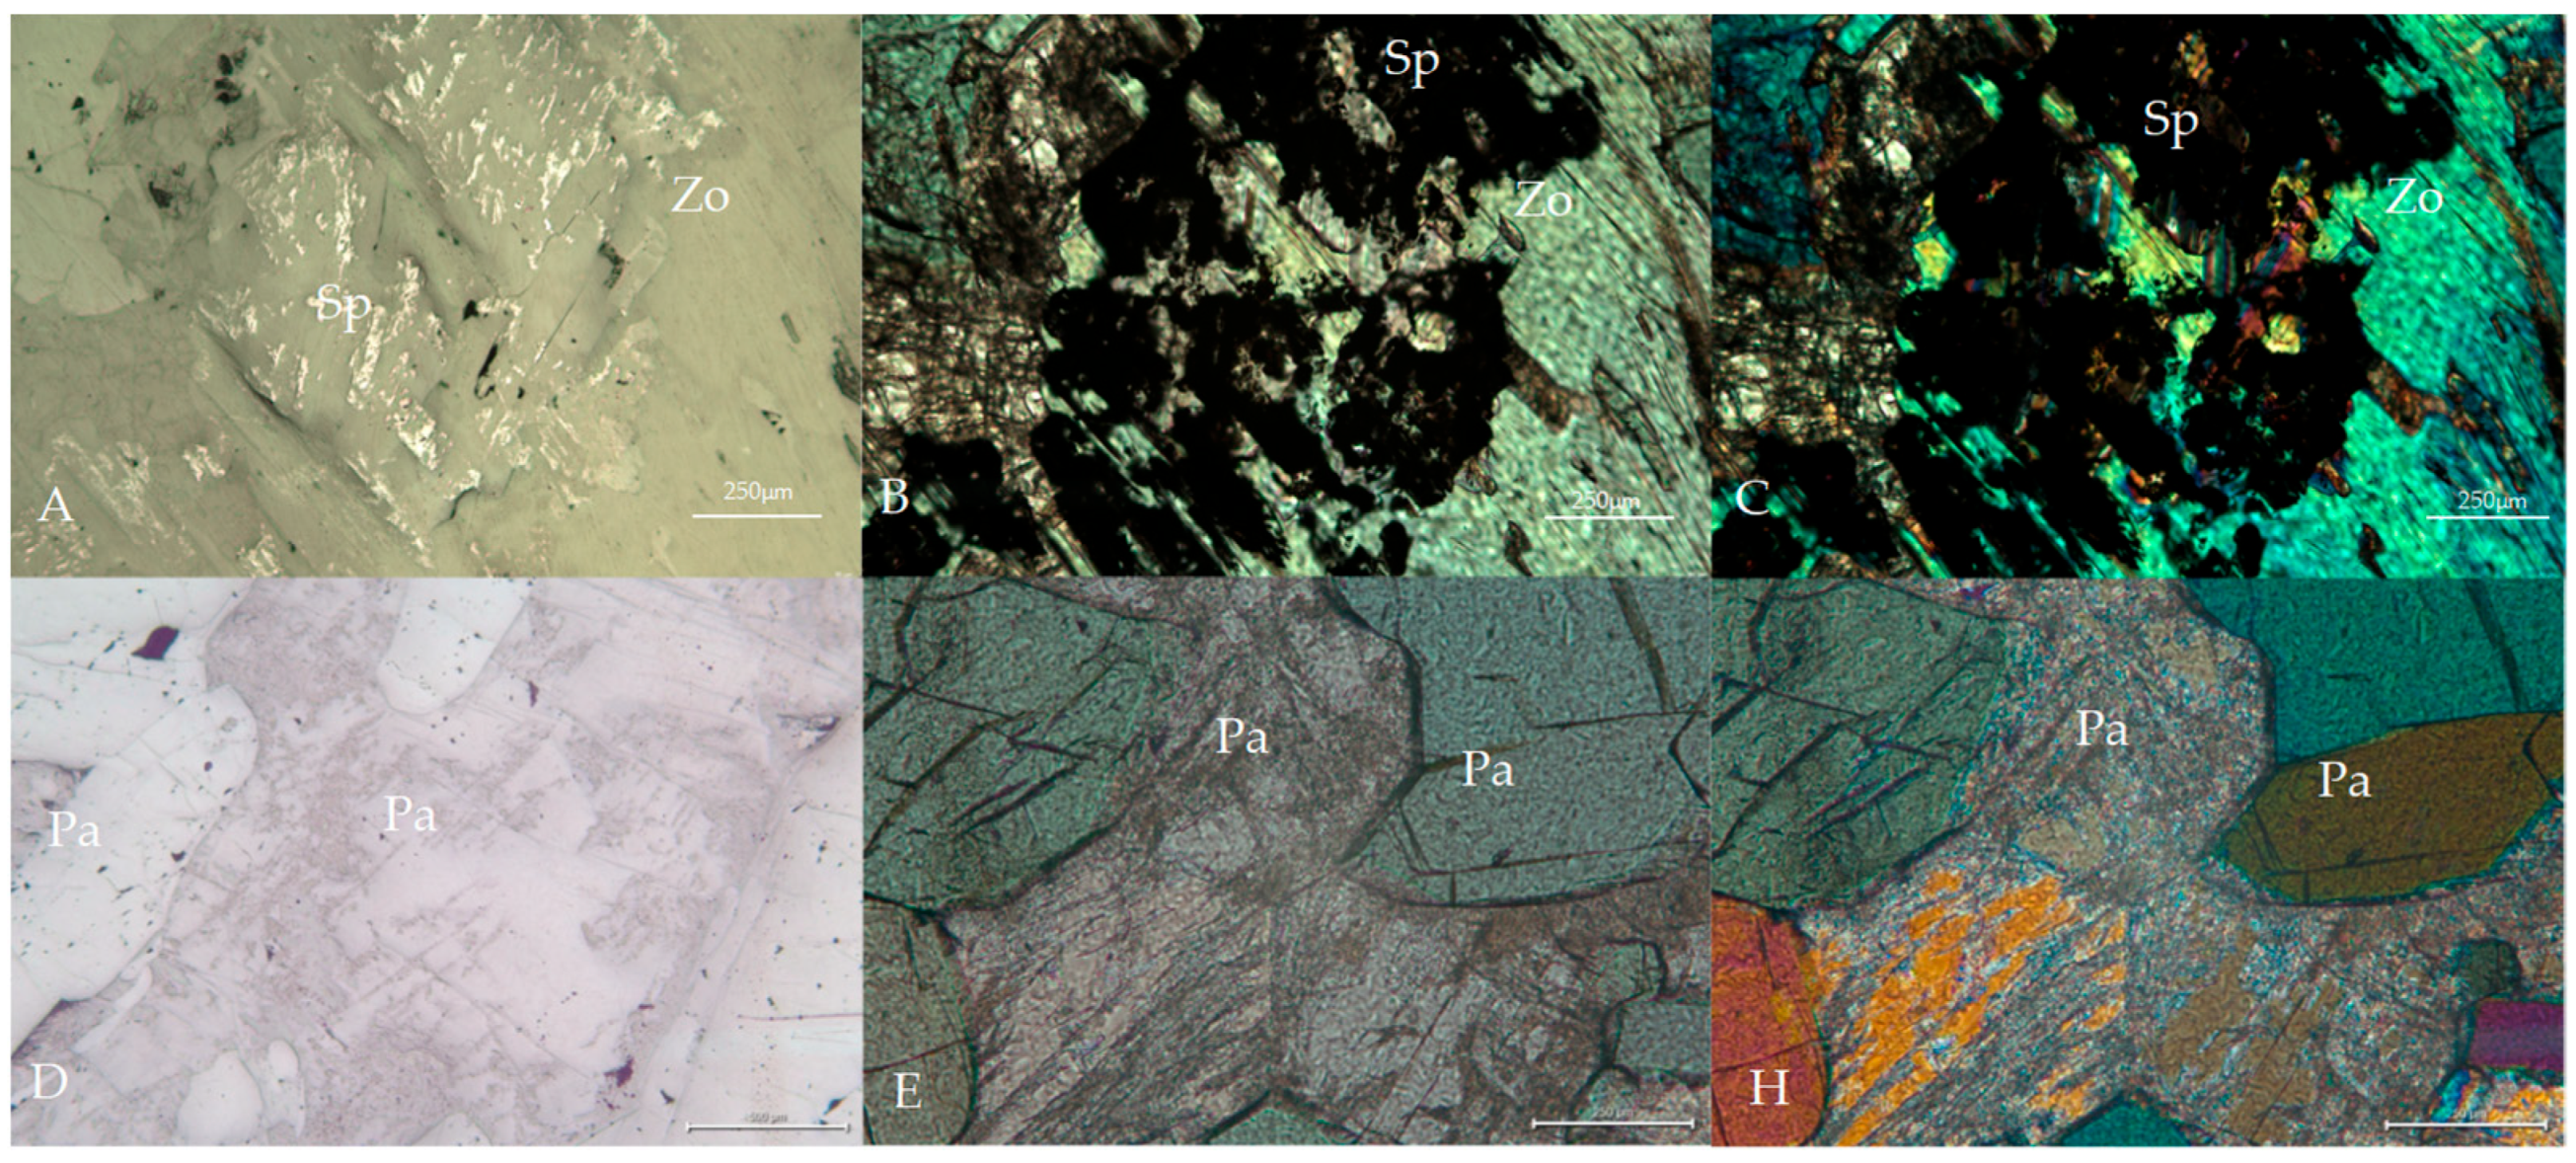
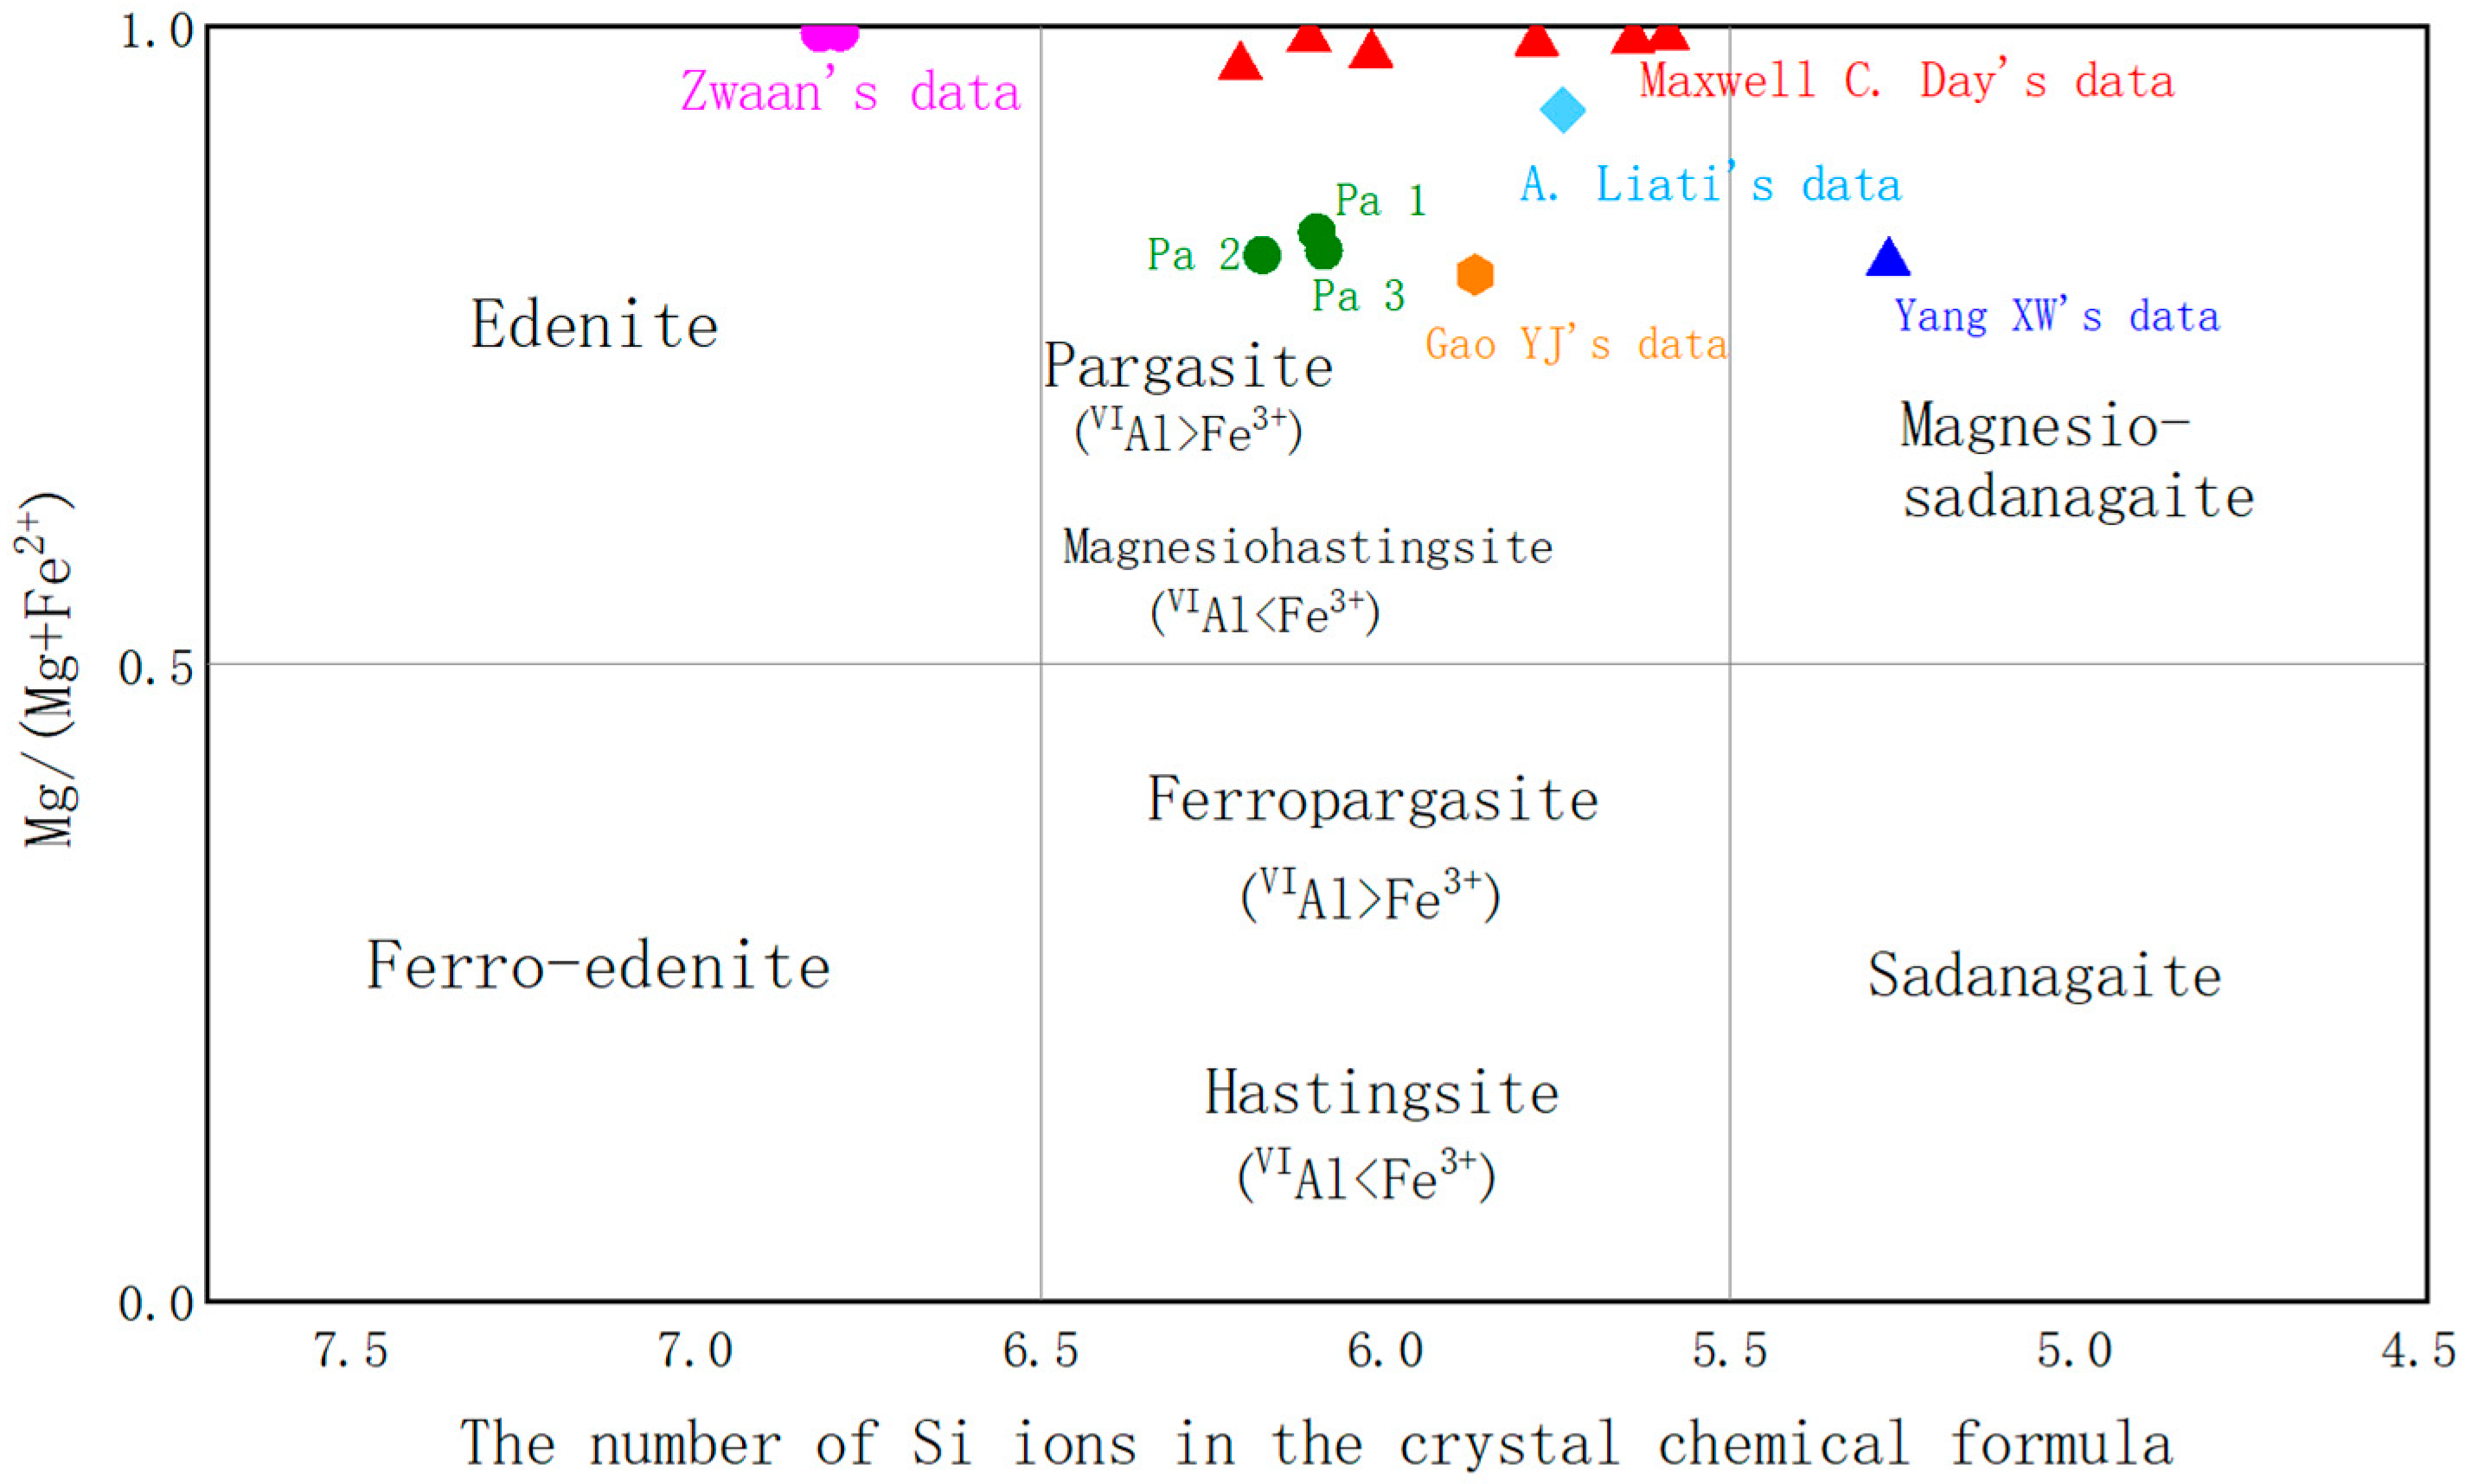
The pink-to-green coloration of zoisite arises primarily from V/Cr substitution (0.28–0.47 wt.% Cr2O3; Table 6) [24], with a secondary contribution from Fe2+ → Ti4+ charge transfer. The coexisting pargasite is chemically characterized by high MgO (14.76–15.71 wt.%) and (Ca+Na) ≥ 1.34 atoms per formula unit (Figure 7), compositions consistent with the amphibole nomenclature for high-P metamorphism [25]. Its Na/K ratios (0.50–0.67) correspond to granulite-facies conditions (T > 600 °C, P > 8 kbar) within the Mozambique Belt, providing direct mineralogical evidence for regional peak metamorphism.
Zoisite is the primary contributor to the green hue in ruby–zoisite assemblages. Its coloration cannot be fully explained by conventional gemological models [28,29]: Elemental correlations: Green varieties exhibit higher TiO2 (avg. 0.06 wt.%) and lower V2O3 (avg. 0.02 wt.%) compared to blue, orange, or yellow types (TiO2: 0.02–0.03 wt.%; V2O3: 0.05–0.06 wt.%). Non-idiochromatic behavior: The color results from complex interactions among substituted elements—such as Al, Cr, V, Fe, and Cu—rather than a single chromophore. This complexity challenges simple classification as “self-color” or allochromatic. In pargasite, the green color derives from highly sensitive iron dynamics: site-specific partitioning. Mössbauer spectroscopy confirms Fe3+ preferentially occupies M(2) sites, while Fe2+ distributes across M(1)/M(3) sites [30], inducing charge-transfer bands.

4.3. Elemental Transport Mechanisms

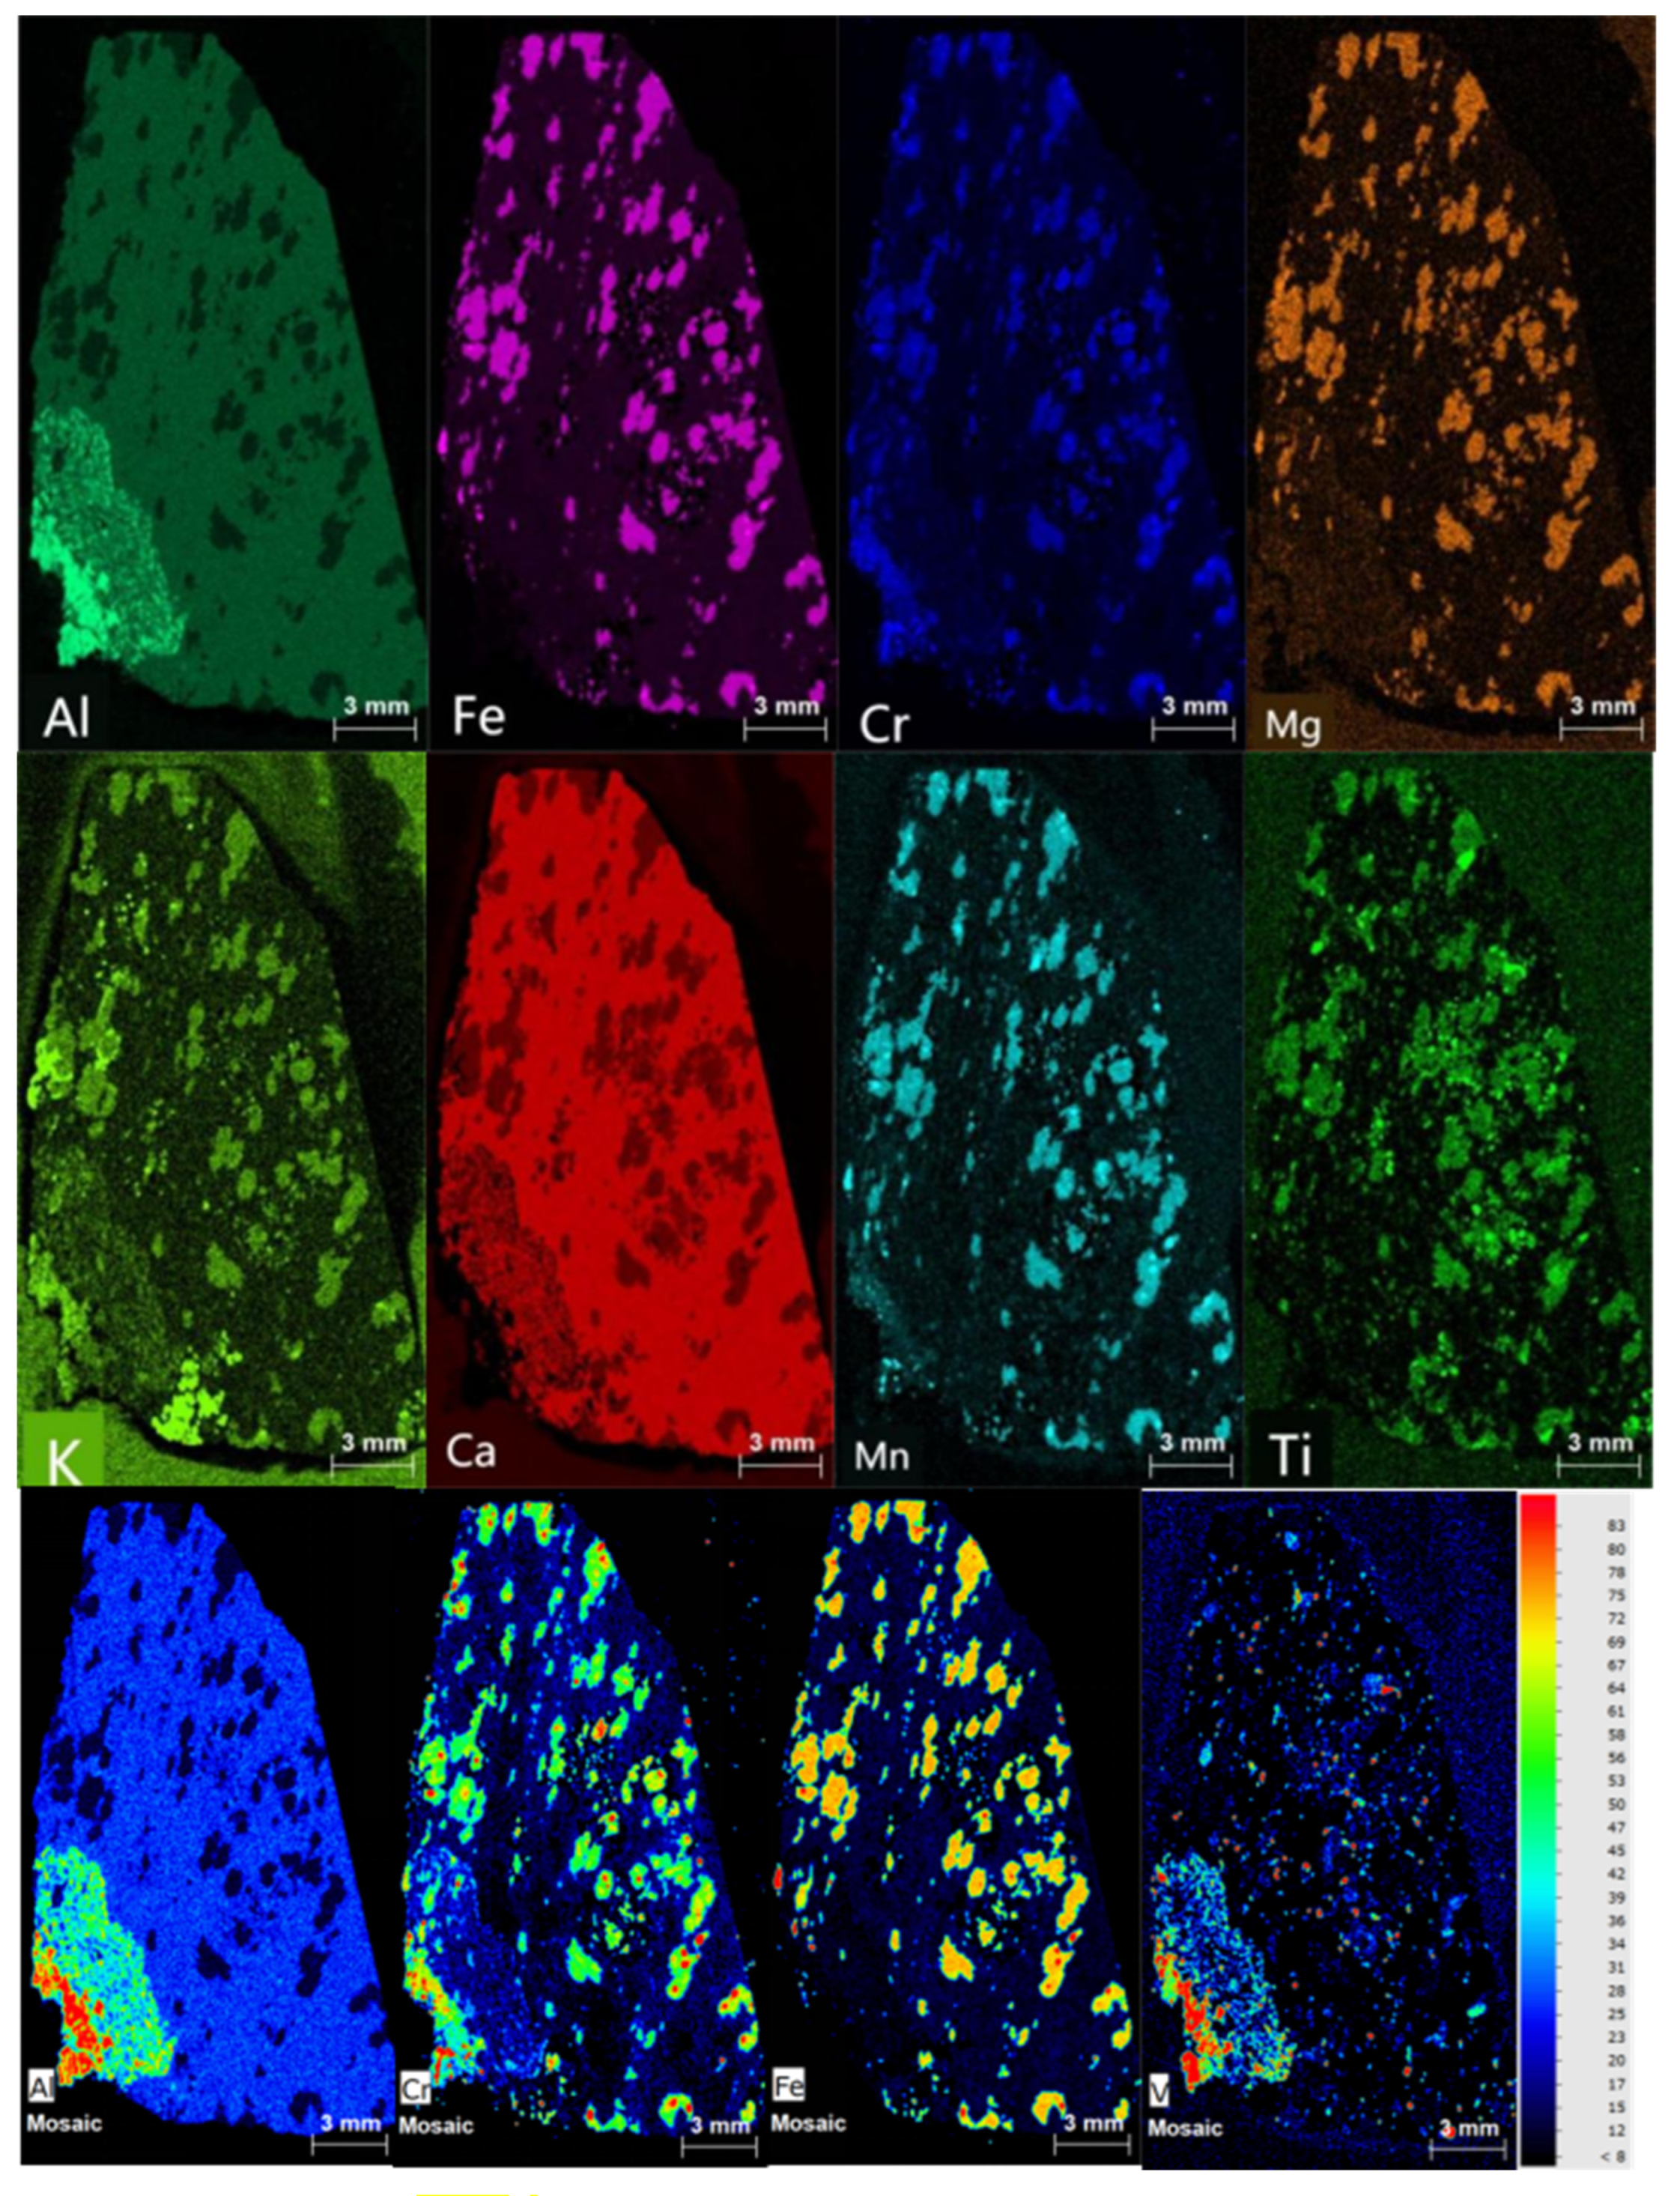
XRF mapping of CZ2 (Figure 8) reveals dominant silicate mineralogy. Key elemental correlations include Al vs. Ca: a strong negative correlation, reflecting alternating corundum (Al-rich) and zoisite (Ca-rich) domains. Fe-Mg-Mn-Cr: Enriched in margarite and disseminated within zoisite/pargasite, aligning with EMPA spot data.
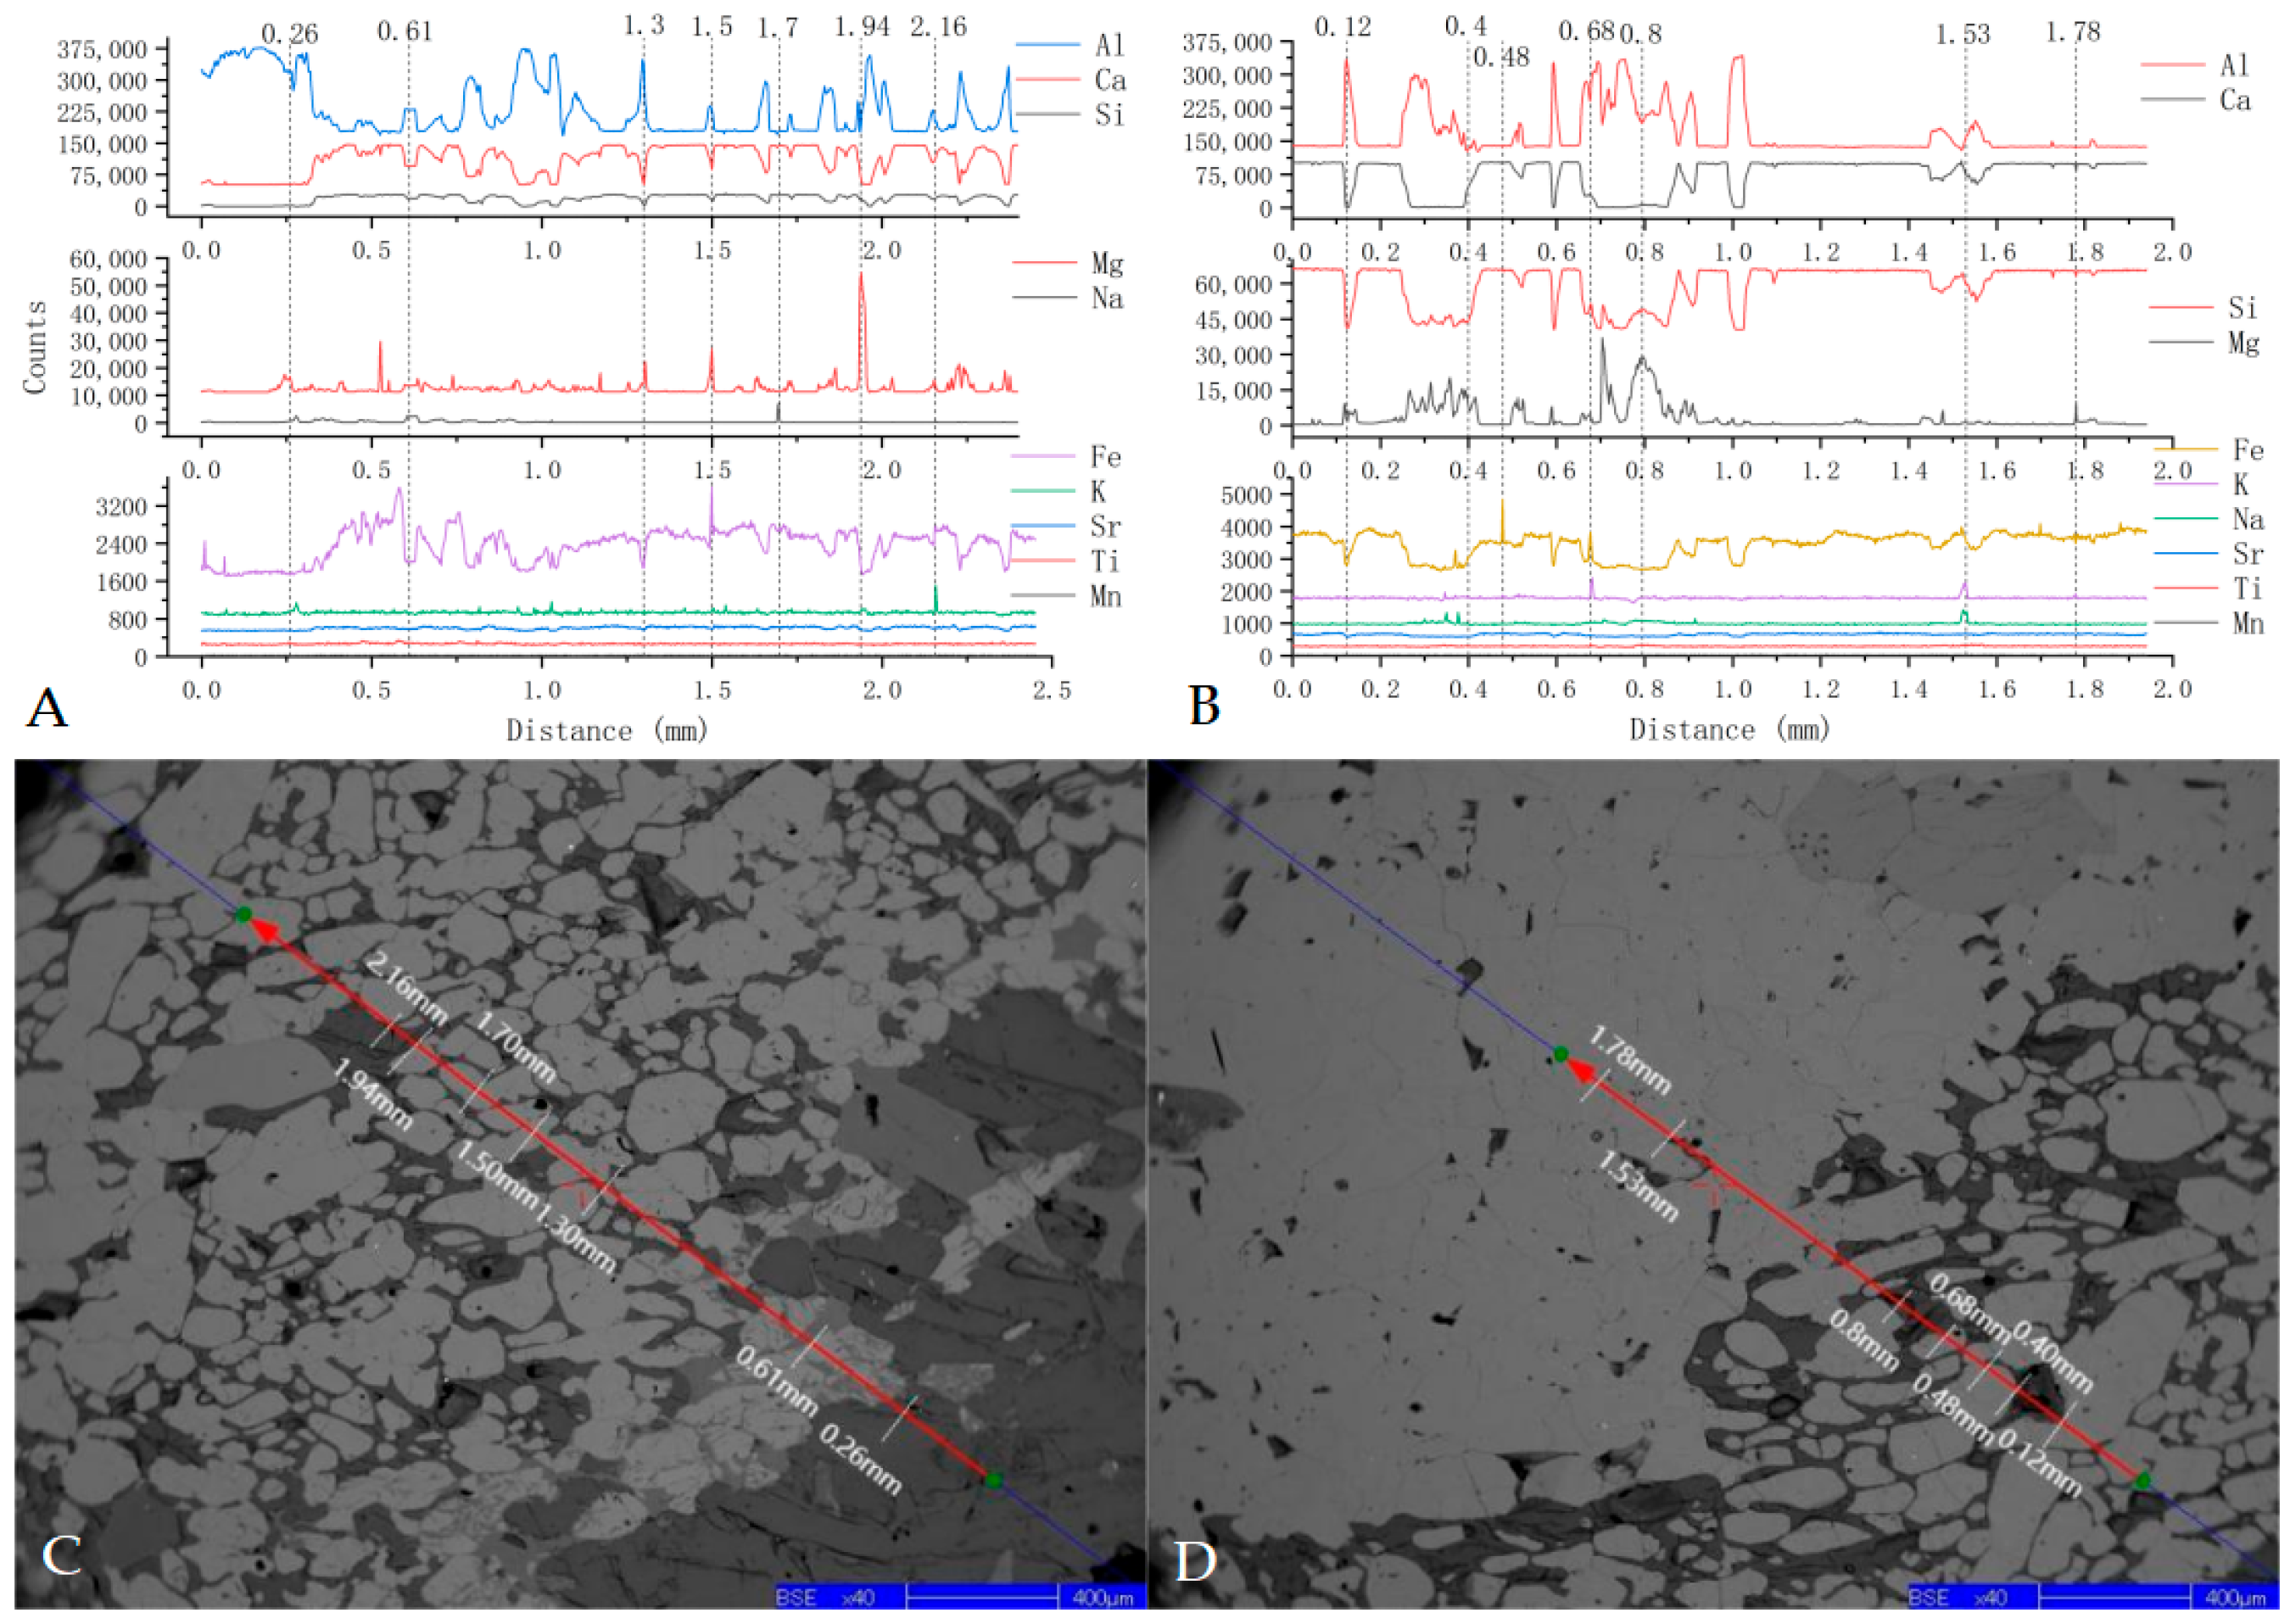
EMPA line scans across transitional zones (Figure 9A,B) further delineate elemental zoning: Al-Ca-Si: controls primary mineral distribution (corundum–zoisite intergrowths). Fe-K-Sr-Ti: Trace levels (<0.1 wt.%) with Fe↑ at corundum–zoisite boundaries (0.26–0.61 mm, Figure 9C), correlating with macroscopic Fe-oxide staining. Metasomatic features: Al-Mg-rich veins (1.3–1.94 mm; Figure 9A,C) host spinel and Mg-calcite, indicative of fluid-mediated dolomite replacement [8]. Ti-Na-K anomalies (2.16 mm, Figure 9A; 1.53 mm, Figure 9B) suggest localized mica-feldspar metasomatism [31]. Discrete mineral phases: spinel, pargasite, and zoisite crystals identified at 0.26–1.7 mm (Figure 9A,C), devoid of transitional textures.

5. Conclusions and Future Work

The Longido gem field (Tanzania) hosts red corundum–zoisite assemblages with accessory pargasite, mica, and pyrope garnet, formed via multistage hydrothermal circulation along shear zones [32]. Tectonic uplift of mantle-derived fluids through the East African Rift [14] enabled Al-rich metasomatism, wherein Phase II corundum crystallized post-zoisite under low-grade metamorphic conditions. Key evidence includes the following: 1. Textural discordance: Corundum predominantly exhibits euhedral growth along zoisite margins, with minor vein-type occurrences showing elevated Si (>5000 ppm) and weak lattice cohesion. The trace elements in corundum are rich in silicon, and the FeO–MgO–V2O3–Cr2O3 versus FeO+TiO2+Ga2O3 diagram also classifies the corundum as of hydrothermal origin. 2. Limited replacement: Absence of reaction rims suggests rapid Al-fluid infiltration without pervasive zoisite alteration. 3. Rare zoisite inclusions within ruby exhibit rounded morphology and partial melting features.
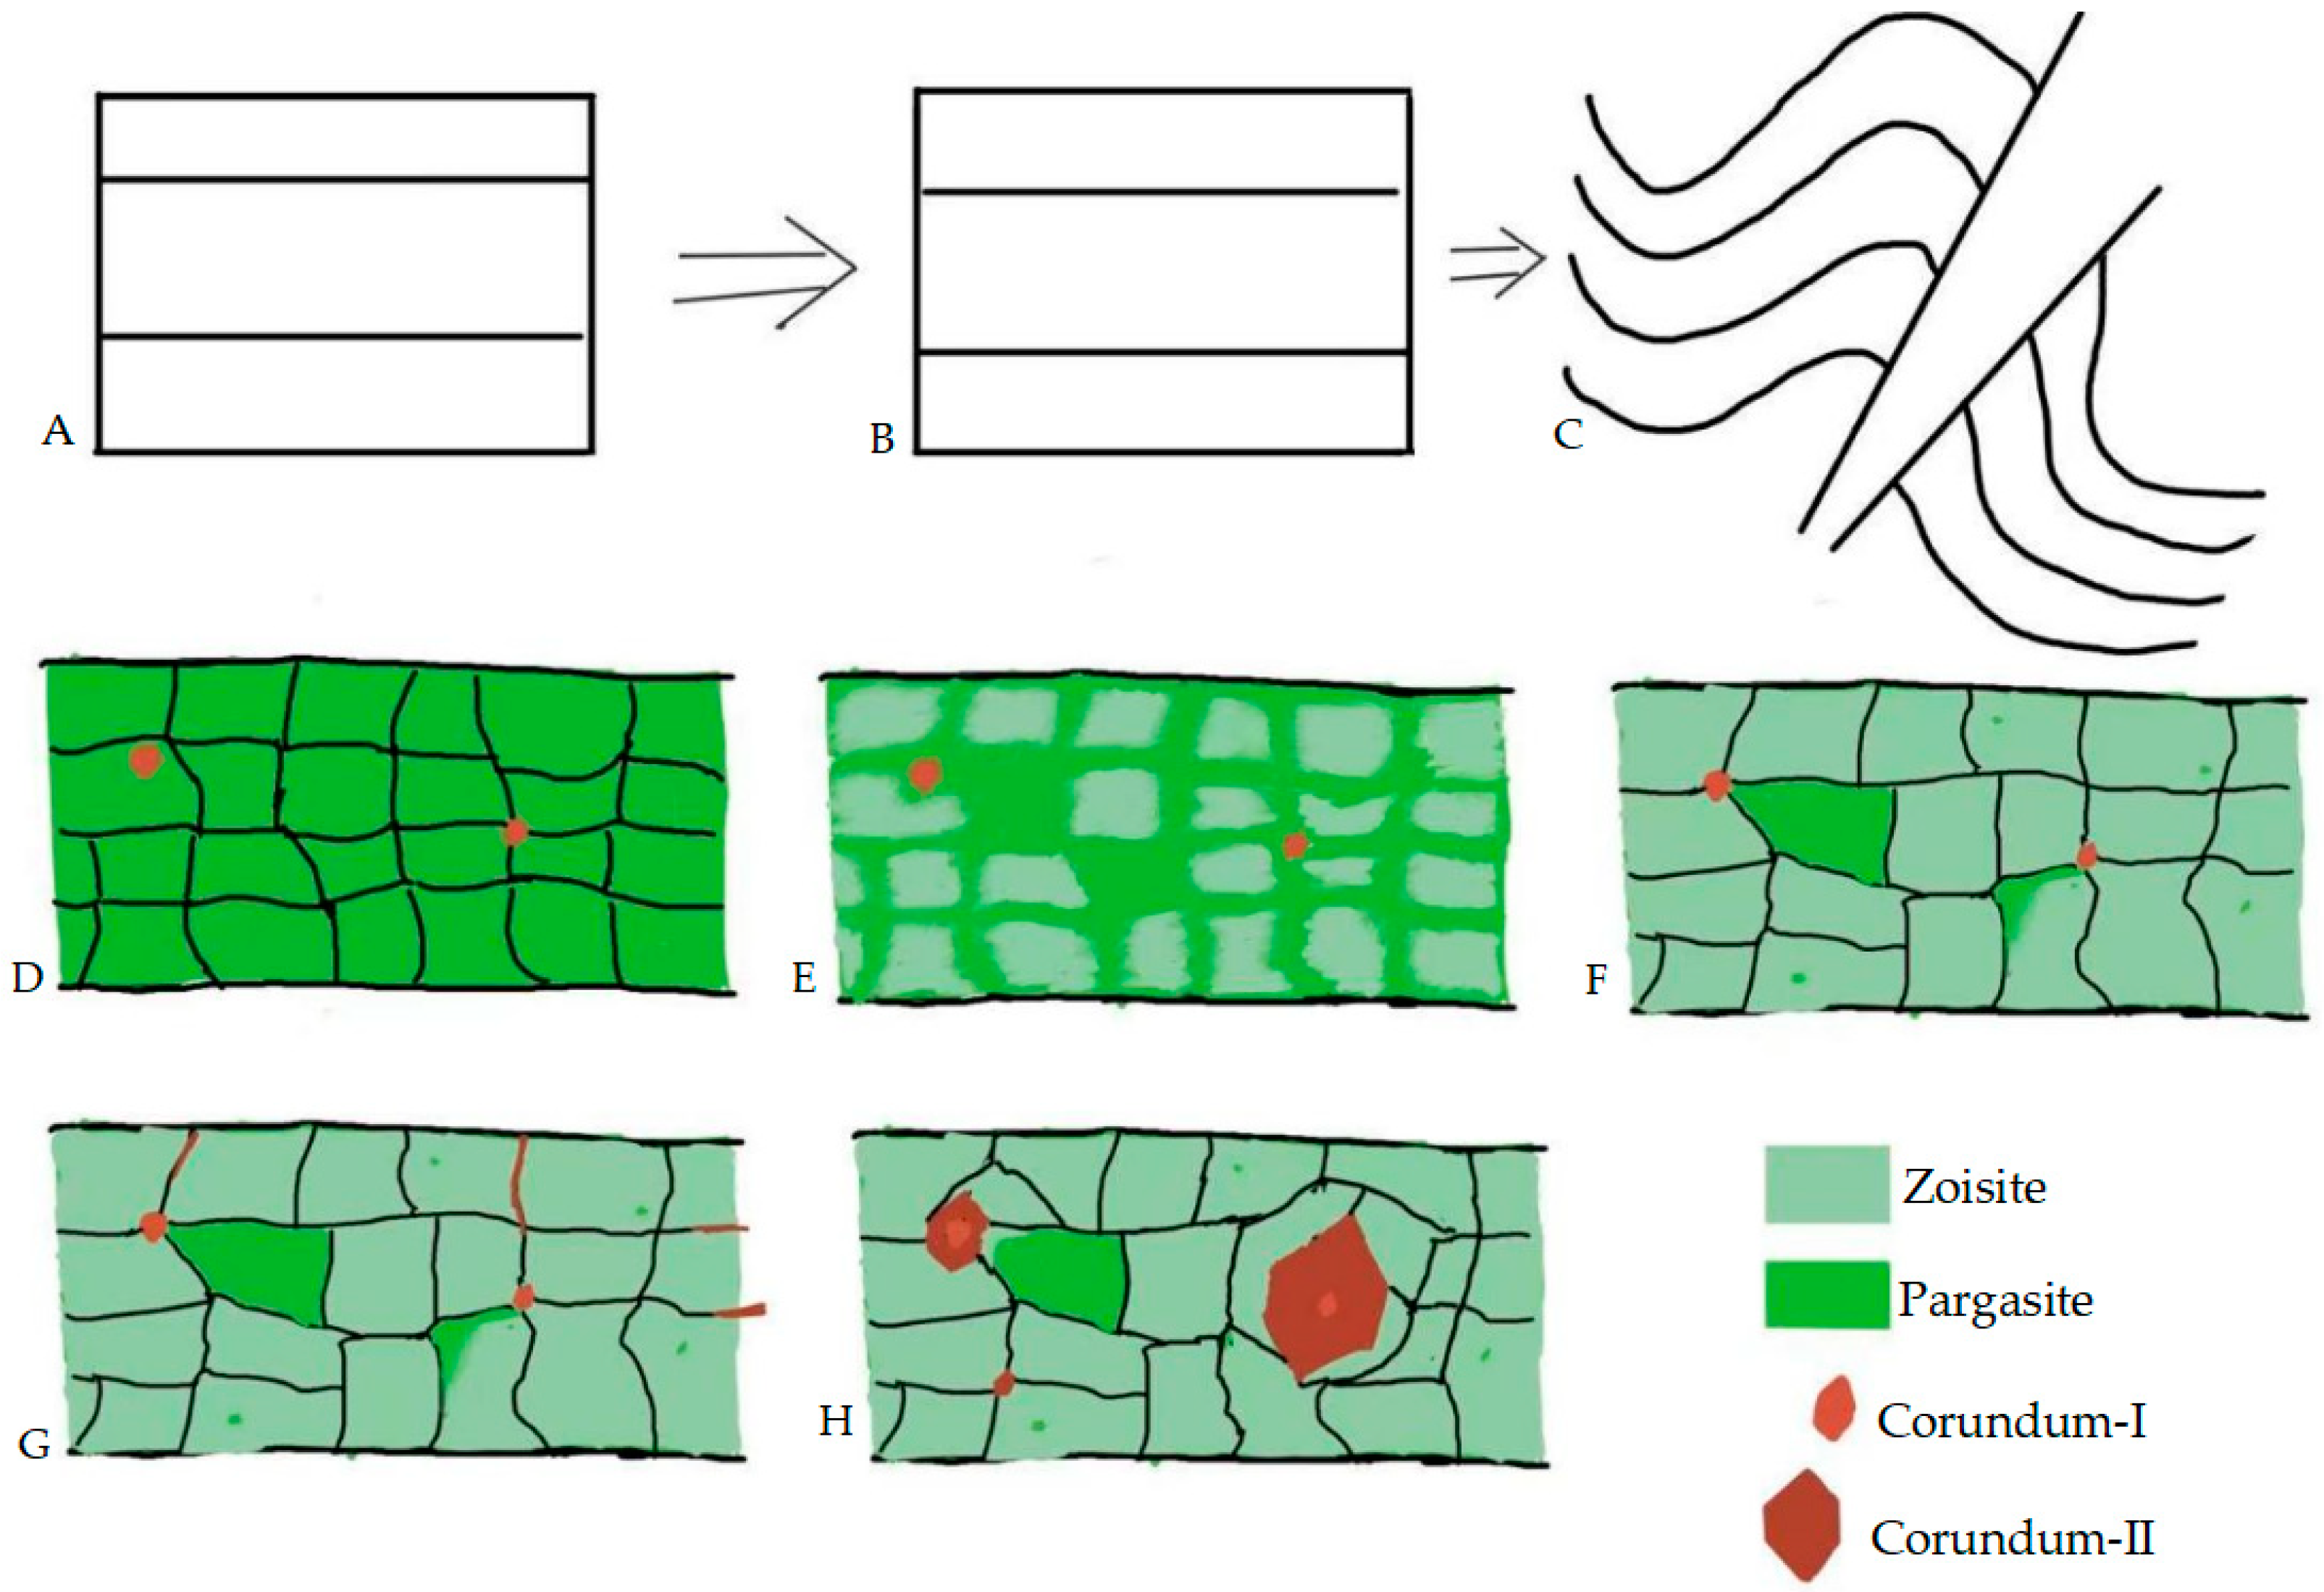
A detailed crystal growth model is proposed (Figure 10). A pre-existing corundum crystal (from any source) acts as a nucleation site for Al-supersaturated hydrothermal fluids. Rather than dissolving zoisite to precipitate corundum locally, aluminum directly accretes onto this seed, promoting outward growth that transforms a small nucleus into a large porphyroblast. In locations where these megacrysts form, zoisite is intensively compressed and fully replaced. In most other areas, however, zoisite remains largely preserved, with only minor portions replaced by corundum. For vein-type corundum, fluids migrate along pathways of least resistance—such as pre-existing or tectonically generated fractures. Within these channels, fluids react with zoisite along fracture walls, forming corundum veinlets via dissolution-reprecipitation. This model of ruby formation shares similarities with the ruby deposits in Tanzania’s Morogoro Region [23].
High-grade ruby–zoisite specimens require sharp color contrast and well-developed corundum megacrysts. Our study identifies two distinctive features of the Longido deposits compared to other global sources: 1. Late-stage ruby morphologies: veinlet, reticulate, and euhedral corundum embedded within zoisite, contrasting with typical late-stage zoisite textures. 2. Diagnostic modal composition: zoisite-dominated assemblages (75 vol.%) with subordinate pargasite (10%) and corundum (5%). 3. Ruby derives its red hue primarily from Cr3+ (assisted by Fe3+); zoisite attains green through multi-ion synergy (V3+/Cr3+/Fe2+ → Ti4+); and pargasite’s green color results from Fe2+/Fe3+ dynamics. These characteristics serve as key identifiers for this unique mineral association [27].
While this study clarifies the genesis of Longido ruby–zoisite deposits through paragenetic sequences, elemental geochemistry, and inclusion assemblages, three key knowledge gaps remain: 1. Color mechanism: Ionic substitution (e.g., Fe2+/Cr3+ in ruby, V3+/Fe3+ in zoisite) and charge-transfer effects require systematic spectroscopic validation. Field context: Current models rely on literature-derived tectonic frameworks. Targeted field mapping of ore-body geometry and shear-zone kinematics is essential to constrain spatial–genetic relationships. Future work should prioritize microbeam isotopic dating and hyperspectral imaging to resolve these multiscale uncertainties.

Author Contributions

Resources, M.H.; writing—original draft preparation, L.Y., C.F., H.Z. and X.L.; writing—review and editing, M.H. and L.Y. All authors have read and agreed to the published version of the manuscript.

Funding

This research was funded by the National Mineral Rock and Fossil Specimens Resource Center (Grant No. NCSTI-RMF202501).

Data Availability Statement

The original contributions presented in this study are included in the article. Further inquiries can be directed to the corresponding author.

Acknowledgments

During the preparation of this manuscript, the author used DeepSeek (https://www.deepseek.com/) for the purposes of translation. The authors have reviewed and edited the output and take full responsibility for the content of this publication.

Conflicts of Interest

The authors declare no conflicts of interest (including DeepSeek).

References

  1. Wang, J.; Liu, X.Y.; Ren, J.P.; Sun, K.; Gong, P.H.; He, F.Q. Pre-Cambrian mineralization in Tanzania. North China Geol. 2022, 45, 101–112. [Google Scholar]
  2. Hauzenberger, C.A.; Sommer, H.; Fritz, H.; Bauernhofer, A.; Kröner, A.; Hoinkes, G.; Wallbrecher, E.; Thöni, M. SHRIMP U–Pb zircon and Sm–Nd garnet ages from the granulite-facies basement of SE Kenya: Evidence for Neoproterozoic polycyclic assembly of the Mozambique Belt. J. Geol. Soc. 2007, 164, 189–201. [Google Scholar] [CrossRef]
  3. Yang, L.; Lu, Q.; Ma, D.; Zheng, H.; Hu, R.; Shi, Z.; Qin, B. Chemical Composition and Spectroscopic Characteristics of Heat-Treated Rubies from Madagascar, Mozambique and Tanzania. Crystals 2023, 13, 1051. [Google Scholar] [CrossRef]
  4. Yang, X.W.; Zhang, L.J.; Jia, Z.Y. Mineral composition characteristics and development prospects of Longjiduo red corundum mine in Tanzania. J. Guilin Univ. Technol. 2012, 2, 173–178. [Google Scholar]
  5. Yang, X.W. Discussion on the Composition Characteristics and Genesis of the Longidou Ruby Mine in Tanzania. Master’s Thesis, Guilin University of Technology, Guilin, China, 2007. [Google Scholar]
  6. Chen, L.; Gan, Y.C.; Meng, Y.L. Research on the Gemological Characteristics of Red Corundum in “Red Green Treasure”. Inf. Wkly. 2019, 18, 349–350. [Google Scholar]
  7. Banno, Y. Mg-rich chloritoid in a corundum-bearing zoisite rock from the Sanbagawa belt, central Shikoku, Japan. J. Mineral. Petrol. Sci. 2009, 104, 148–155. [Google Scholar] [CrossRef]
  8. Liati, A. Corundum- and zoisite-bearing marbles in the Rhodope Zone, Xanthi Area (N. Greece): Estimation of the fluid phase composition. Mineral. Petrol. 1988, 38, 53–60. [Google Scholar] [CrossRef]
  9. Meng, X.L.; Gao, B.Y.; Ma, B.L.; Susan, S. Geological characteristics of gem mines in Kenya and Tanzania. Build. Mater. Geol. 1993, 2, 20–23. [Google Scholar]
  10. Xu, S.K. Eclogite in China. Chem. Miner. Geol. 2004, 4, 193–204. [Google Scholar]
  11. Sun, H.W.; Liu, X.Y.; Tang, W.L.; Wu, X.Y. The division and mineralization characteristics of the main mineralization zones in Tanzania. Geol. Explor. Discuss. Ser. 2015, 30, 18–26. [Google Scholar]
  12. Kabete, J.M.; Groves, D.I.; McNaughton, N.J.; Mruma, A.H. A new tectonic and temporal framework for the Tanzanian Shield: Implications for gold metallogeny and undiscovered endowment. Ore Geol. Rev. 2012, 48, 88–124. [Google Scholar] [CrossRef]
  13. Gu, A.L.; Ren, J.P.; Yuan, Y.S.; Peng, J.; Chen, J.; Bering, A.; Zuo, L.B.; Sun, H.W.; Liu, X.Y.; Sun, K.; et al. Mineral Resources and Mining Investment Environment in Tanzania. Geol. Bull. 2023, 42, 1291–1301. [Google Scholar]
  14. Giuliani, G.; Groat, L.A.; Fallick, A.E.; Pignatelli, I.; Pardieu, V. Ruby Deposits: A Review and Geological Classification. Minerals 2020, 10, 597. [Google Scholar] [CrossRef]
  15. Le Goff, E.; Deschamps, Y.; Guerrot, C. New geochronological data by singlezircon Pb-Pb evaporation method in north-eastern Tanzania: Regionalimplications for the Tanzanian Mozambique belt and gemstones mineralization. In Proceedings of the 33rd International Geological Congress, Oslo, Norway, 6–14 August 2008; pp. 6–14. [Google Scholar]
  16. Curren, H.N.C.; Johnson, S.P. Tectonic evolution of the Mozambique Belt, Eastern Africa. In Proceedings of the 21st Colloquium of African Geology, Maputo, Mozambique, 3–6 July 2006; pp. 33–34. [Google Scholar]
  17. Le Goff, E.; Deschamps, Y.; Guerrot, C. Tectonic implications of new single zircon Pb-Pb evaporation data in the Lossogonoi and Longido ruby-districts, Mozambican metamorphic Belt of north-eastern Tanzania. Comptes Rendus Geosci. 2010, 342, 36–45. [Google Scholar] [CrossRef]
  18. Chen, H.H.; Xu, J.; Hu, Z.C.; Gao, S.; Gunther, D.; Gao, C.G.; Liu, Y.S. In situ analysis of major and trace elements of anhydrous minerals by LA-ICP-MS without applying an internal standard. Chem. Geol. 2009, 257, 34–43. [Google Scholar]
  19. Chen, L.; Liu, Y.S.; Hu, Z.C.; Gao, S.; Zong, K.Q.; Chen, H.H. Accurate determinations of fifty-four major and trace elements in carbonate by LA–ICP-MS using normalization strategy of bulk components as 100%. Chem. Geol. 2011, 284, 283–295. [Google Scholar] [CrossRef]
  20. Akbudak, İ.K.; Gürbüz, M.; Başıbüyük, Z.; Hatipoğlu, M.; Önal, A.Ö.; İşler, F. Mineralogical and Gemological Characteristics of Metaophiolite Hosted Corundum (Malatya-Türkiye). Sak. Univ. J. Sci. 2021, 25, 288–296. [Google Scholar] [CrossRef]
  21. Li, E.Q.; Zhang, Y.F.; Xu, B. Gemological and Chemical Composition Characteristics of Thai Basalt Ruby. Geoscience, 2022; online ahead of print. [Google Scholar] [CrossRef]
  22. Palke, A.C.; Wong, J.; Verdel, C.; Ávila, J.N. A common origin for Thai/Cambodian rubies and blue and violet sapphires from Yogo Gulch, Montana, U.S.A. Am. Mineral. 2019, 103, 469–479. [Google Scholar] [CrossRef]
  23. Sorokina, E.S.; Hofmeister, W.; Häger, T.; Mertz-Kraus, R.; Buhre, S.; Saul, J.M. Morphological and chemical evolution of corundum (ruby and sapphire): Crystal ontogeny reconstructed by EMPA, LA-ICP-MS, and Cr3+ Raman mapping. Am. Mineral. 2016, 101, 2716–2722. [Google Scholar] [CrossRef]
  24. Lu, Q. Optimization and Identification Methods for Common Gemstones; Chemical Industry Press: Beijing, China, 2020. [Google Scholar]
  25. Liu, X.F.; Wang, L.; Li, H.; Liu, J.; Zhao, F.F.; Lu, Q.X.; Hu, L. Systematic mineralogical classification and nomenclature of pyroxene and clinopyroxene minerals. Acta Mineral. Sin. 2015, 1, 19–28. [Google Scholar]
  26. Gao, Y.; He, M.; Lucas, A.C.; Sun, X.; Zhou, D.; Huang, T.; Li, K.; Fortaleché, D.; Lin, M.; Zhu, Y.; et al. Ruby from Longido, Tanzania: Mining, Color, Inclusion, and Chemical Features. Crystals 2024, 14, 383. [Google Scholar] [CrossRef]
  27. Olivier, B. The Geology and Petrology of the Merelani Tanzanite Deposit, NE Tanzania. Ph.D. Thesis, Stellenbosch University, Stellenbosch, South Africa, 2018. [Google Scholar]
  28. Ye, H.J. Analysis and Study on Gemological Mineralogy Characteristics of Tanzanite. Master’s Thesis, China University of Geosciences, Beijing, China, 2020. [Google Scholar]
  29. Semet, M.P. A Crystal-Chemical Study of Synthetic Magnesiohastingsite. Am. Mineral. 1973, 58, 480–494. [Google Scholar]
  30. Emmanuel, O.; Kazimoto, E.; Mshiu, E.E. Reconnaissance assessment of the Stenian-Tonian granitoids of southern Tanzania for metal resources by using geological remote sensing and geochemical techniques. Geochemistry 2020, 80, 125533. [Google Scholar] [CrossRef]
  31. Gomes, C.L. Contrasting Styles of Metamorphic to Metasomatic Deposits of Gemstones in Cabo Delgado, Northern Mozambique. Inżynieria Mineralna 2024, 1, 1. [Google Scholar] [CrossRef]
  32. Balmer, W.A.; Hauzenberger, C.A.; Fritz, H.; Sutthirat, C. Marble-hosted ruby deposits of the Morogoro Region, Tanzania. J. Afr. Earth Sci. 2017, 134, 626–643. [Google Scholar] [CrossRef]
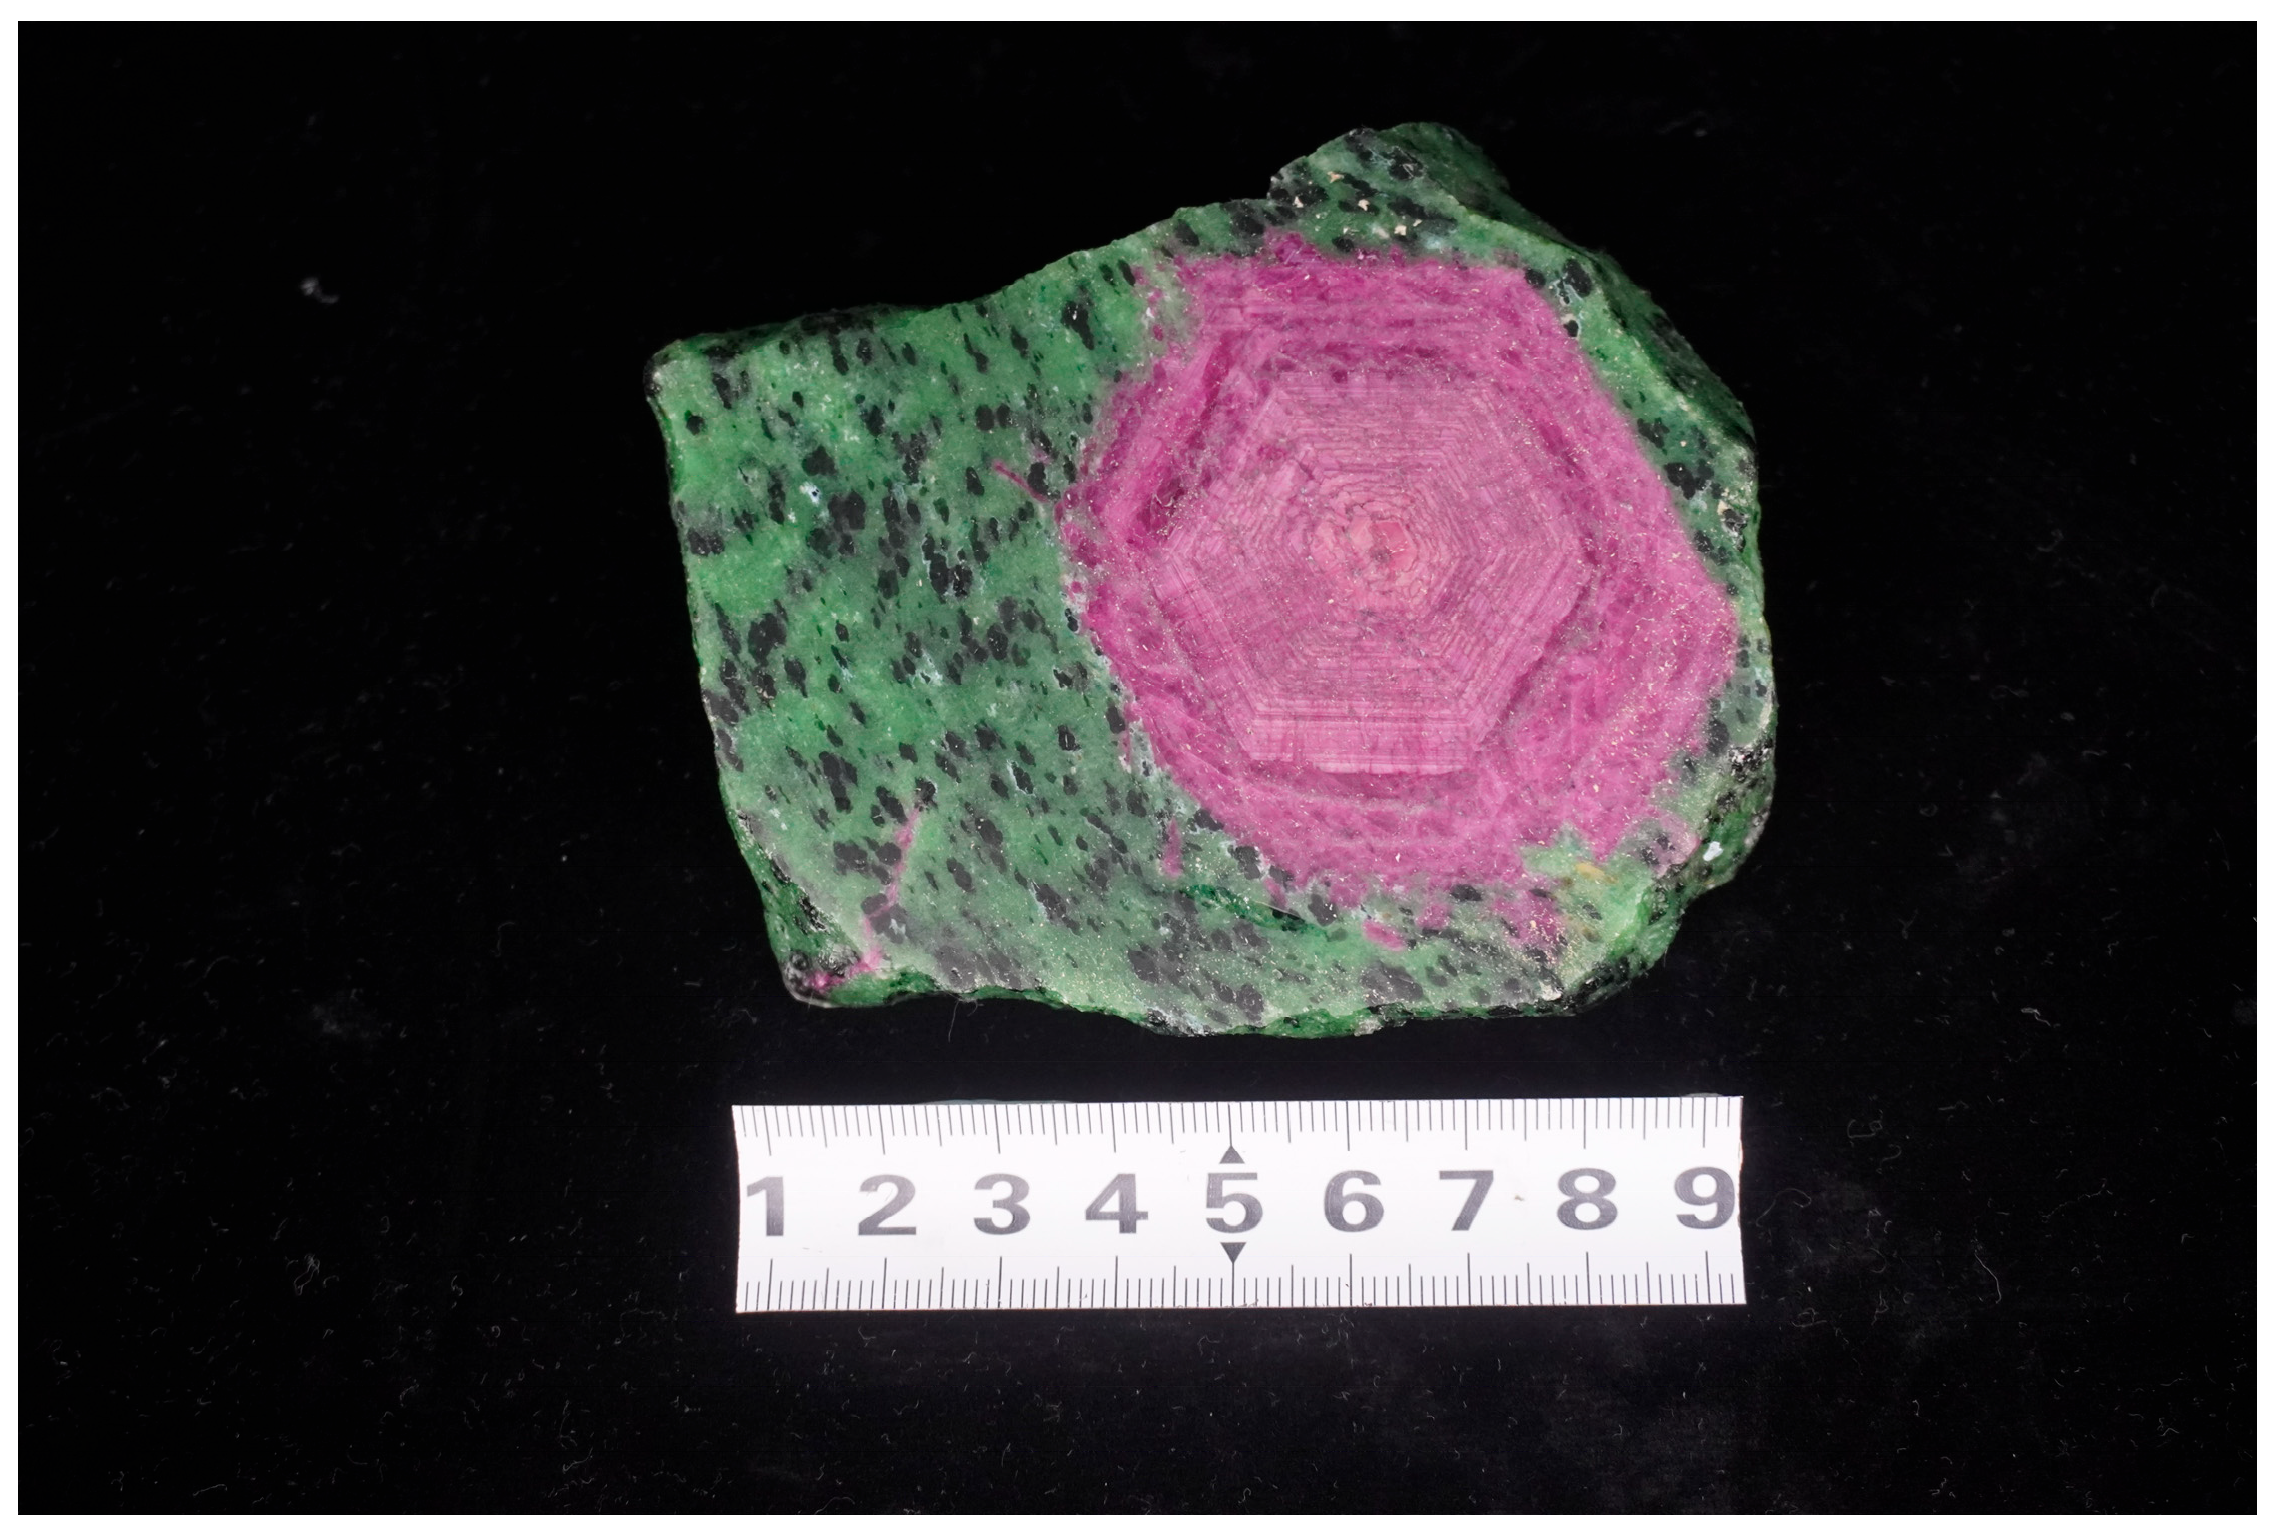
Figure 1. A specimen of Tanzanian red corundum associated with zoisite. The corundum displays a distinct pseudo-hexagonal habit, while the zoisite and pargasite exhibit a parallel intergrowth texture. Minor filamentary red corundum is also present within the matrix. This large corundum crystal is of significant value for both ornamental and geological study.
Crystals 15 00926 g001
Figure 2. The Longido gemstone deposit in northeastern Tanzania is hosted in unmetamorphosed schist with prominent foliation. 1. Neogene–Quaternary volcanic formation; 2. Undifferentiated gneisses; 3. Location of the ruby deposit; 4. Foliation pattern.
Crystals 15 00926 g002
Figure 3. Geological cross-section of Mula and Mundarara mines in the Longido district. 1: Migmatic paragneiss (biotite + garnite ± kyanite); 2: quartzo-feldspathic gneiss; 3: amphibolite, calc-silicate gneiss; 4: serpentinite; 5: orthogneiss; 6: anyolite (ruby ore) vein [17].
Crystals 15 00926 g003
Figure 4. Sample descriptions: CZ1: Pale red corundum characterized by pervasive pargasite. CZ2: Zoisite–corundum interface exhibiting a pale pink transition zone with speckled to banded pargasite. CZ3: Dark brown, Fe-rich staining. CZ4: Large corundum grains in direct contact with pargasite, adjacent to zoisite. CZ5: Distinct banded pargasite structure.
Crystals 15 00926 g004
Figure 5. (AC) Mineral formation inclusion relationships: Chromian spinels were included in zoisite. (DH) Although low-level weathering alteration generated relic replacement textures in some pargasite, EMPA data reveal negligible deviations in bulk composition compared to pristine grains (Table 6).
Crystals 15 00926 g005
Figure 6. (AL) Transition zone: Corundum displays orientational consistency plane-polarized light, (B,C) with stock-work distribution among zoisite grains (D,E). High-magnification observations revealed serrated margins on zoisite grains, indicative of partial melting (GI). There are zoisite inclusions inside the red corundum (JL).
Crystals 15 00926 g006
Figure 7. The chemical composition map of pargasite (synthesized from EMPA and prior studies [4,5,8,26,27]).
Crystals 15 00926 g007
Figure 8. Mirror image and element distribution of CZ2.
Crystals 15 00926 g008
Figure 9. (AD). Line scan element distribution intensity of CZ2*: (A,C), respectively, display elemental line-scan profiles and their magnified counterparts, with identical scan paths and key analytical points annotated (e.g., 0.26 mm/0.61 mm). (B,D) adhere to the same correlative framework. * Analyses conducted by the National Rock and Mineral Specimen Resource Platform.
Crystals 15 00926 g009
Figure 10. During the Paleoproterozoic (2447 ± 4.4 Ma), syenitic gneiss protoliths formed the crystalline basement. (A) Continental collision triggered granulite-facies metamorphism (pre-640 Ma; 12–13 kbar, 670–720 °C). (B) Exhumation and retrograde metamorphism under amphibolite-facies conditions (post-640 Ma). (C) Shear zone development (610 Ma) facilitated ruby crystallization in ultramafic rocks via fluid influx. (DF) (within B): Pargasite-dominated basement formed with mica, spinel, and corundum; retrograde metasomatism replaced pargasite with zoisite. (G,H) Hydrothermal fluids corroded zoisite and precipitated new corundum.
Crystals 15 00926 g010
Table 1. Types of deposits in major mining areas of Tanzania [14].
Ore Deposit TypeOccurrenceGeological BackgroundOre District
Metamorphic typeMarble-typeIn calcareous crystalline graniteThe interpolation of marble or the contact between marble and gneiss in metamorphic rock series in orogenic zoneMorogoro
Mahenge
Desilicated pegmatite typeIn syenite
pegmatite and
granite pegmatite, desilicated pegmatite cuts
ultramafic rock
Desilicification aluminum-rich metasomatismUmba
Metasomatic metamorphic typeIn metasomatic M-UMRFluid–rock interaction and metasomatismMorogoro
Mahenge
M-UMRIn metamorphic amphibolite-
Granulite, etc.
Metamorphism occurs in the desilicated aluminous or gneiss adjacent to ultramafic rocksWinza
In the zoisite Longido
Sedimentary type Songea
Tunduru
Winza
Note: Basic–ultrabasic rocks are indicated using M-UMR in all descriptions above.
Table 2. Summary of specimen observation.
MineralTextureStructureAdditional NotesChemical Formula
ZoisiteMassive, schistoseEuhedral-subhedralDominant phase (~75 vol.%)Ca2Al3(SiO4)3(OH)
PargasiteDisseminated, bandedEuhedral/anbhedral~10 vol.%NaCa2(Mg4Al)(Si6Al2)O22(OH)2
CorundumBanded, massiveEuhedral/anhedral~5% vol.%Al2O3
Omphacite-Euhedral-subhedralInclusions(Ca,Na)(Mg,Fe2+,Fe3+,Al)(Si2O6)
Margarite-Relic replacementInclusionsCaAl2[Si2Al2O10](OH)2
Spinel-EuhedralInclusionsFe(Al,Cr,Fe)2O4
Table 3. Paragenetic sequence of mineral assemblages.
MineralPre MineralizationMain Mineralization
Mica 1Crystals 15 00926 i001
SpinelCrystals 15 00926 i002
PargasiteCrystals 15 00926 i003
Epidote Crystals 15 00926 i004
Zoisite Crystals 15 00926 i005
Corundum Crystals 15 00926 i006
1 Line thickness corresponds to content abundance, and the positions of the line endpoints signify the general period of mineral formation.
Table 4. LA-ICP-MS of red corundums, zoisites, and pargasites (ppm).
SampleCrFeGaMgNaVTiSi
R 11986.25651.499.005.67-1.5340.13859.30
R 22006.25635.518.01754.77-1.7611.731174.00
TR 11232.491457.959.764.313.554.2616.8711,419.63
TR 28105.322997.5029.275.08-4.7793.047153.84
Zo 135,696.36202.07466.3513.366.59147.1884.07-
Zo 23857.4015,202.0917.53318.43-34.3776.00-
Zo 34610.1916,624.6717.69895.0081.8630.1275.52-
Zo 42479.2113,133.1916.85233.068.1628.3282.90-
Pa 13374.1839,947.059.8369,128.54 18,442.3862.49764.38-
Pa 24832.4637,489.0779.0958,315.183808.95 45.96333.11-
Table 5. Contents of FeO–MgO–V2O3–Cr2O3 and FeO+TiO2+Ga2O3 of red corundum (wt.%).
Sample NumberFeO–MgO–V2O3–Cr2O3FeO+TiO2+Ga2O3
R 1−0.300.27
R 2−0.070.33
TR 1−0.290.25
TR 2−0.280.29
Table 6. The composition analysis of red corundum, zoisite, and pargasite (wt.%).
Sample NumberAl2O3SiO2MgOCaOFeOCr2O3Na2OK2ONiOZnOTiO2SrOTotal
Red corundum matrix 198.360.03--0.240.540.01-0.060.010.03-99.28
Red corundum matrix 298.510.11--0.330.40.02-0.020.05--99.44
Transitional red corundum 197.790.04--0.250.54-----0.0298.64
Transitional red corundum 297.760.01--0.270.550.01--0.150.020.0898.85
Zoisite131.5140.750.0623.951.280.470.020.010.030.040.060.1398.31
Zoisite232.0839.280.0523.40.920.36-0.020.040.040.020.1396.34
Zoisite331.5939.810.0623.981.290.28--0.070.040.020.1397.27
Pargasite117.542.7415.7112.595.392.12.520.37-0.060.120.0899.18
Pargasite218.0643.0414.7812.745.761.32.470.41-0.060.140.0898.84
Pargasite318.241.8314.7612.445.631.442.410.420.010.060.150.0897.43
Disclaimer/Publisher’s Note: The statements, opinions and data contained in all publications are solely those of the individual author(s) and contributor(s) and not of MDPI and/or the editor(s). MDPI and/or the editor(s) disclaim responsibility for any injury to people or property resulting from any ideas, methods, instructions or products referred to in the content.