
A Comprehensive Investigation of the Two-Phonon Characteristics of Heat Conduction in Superlattices


Abstract
1. Introduction
2. Methodology
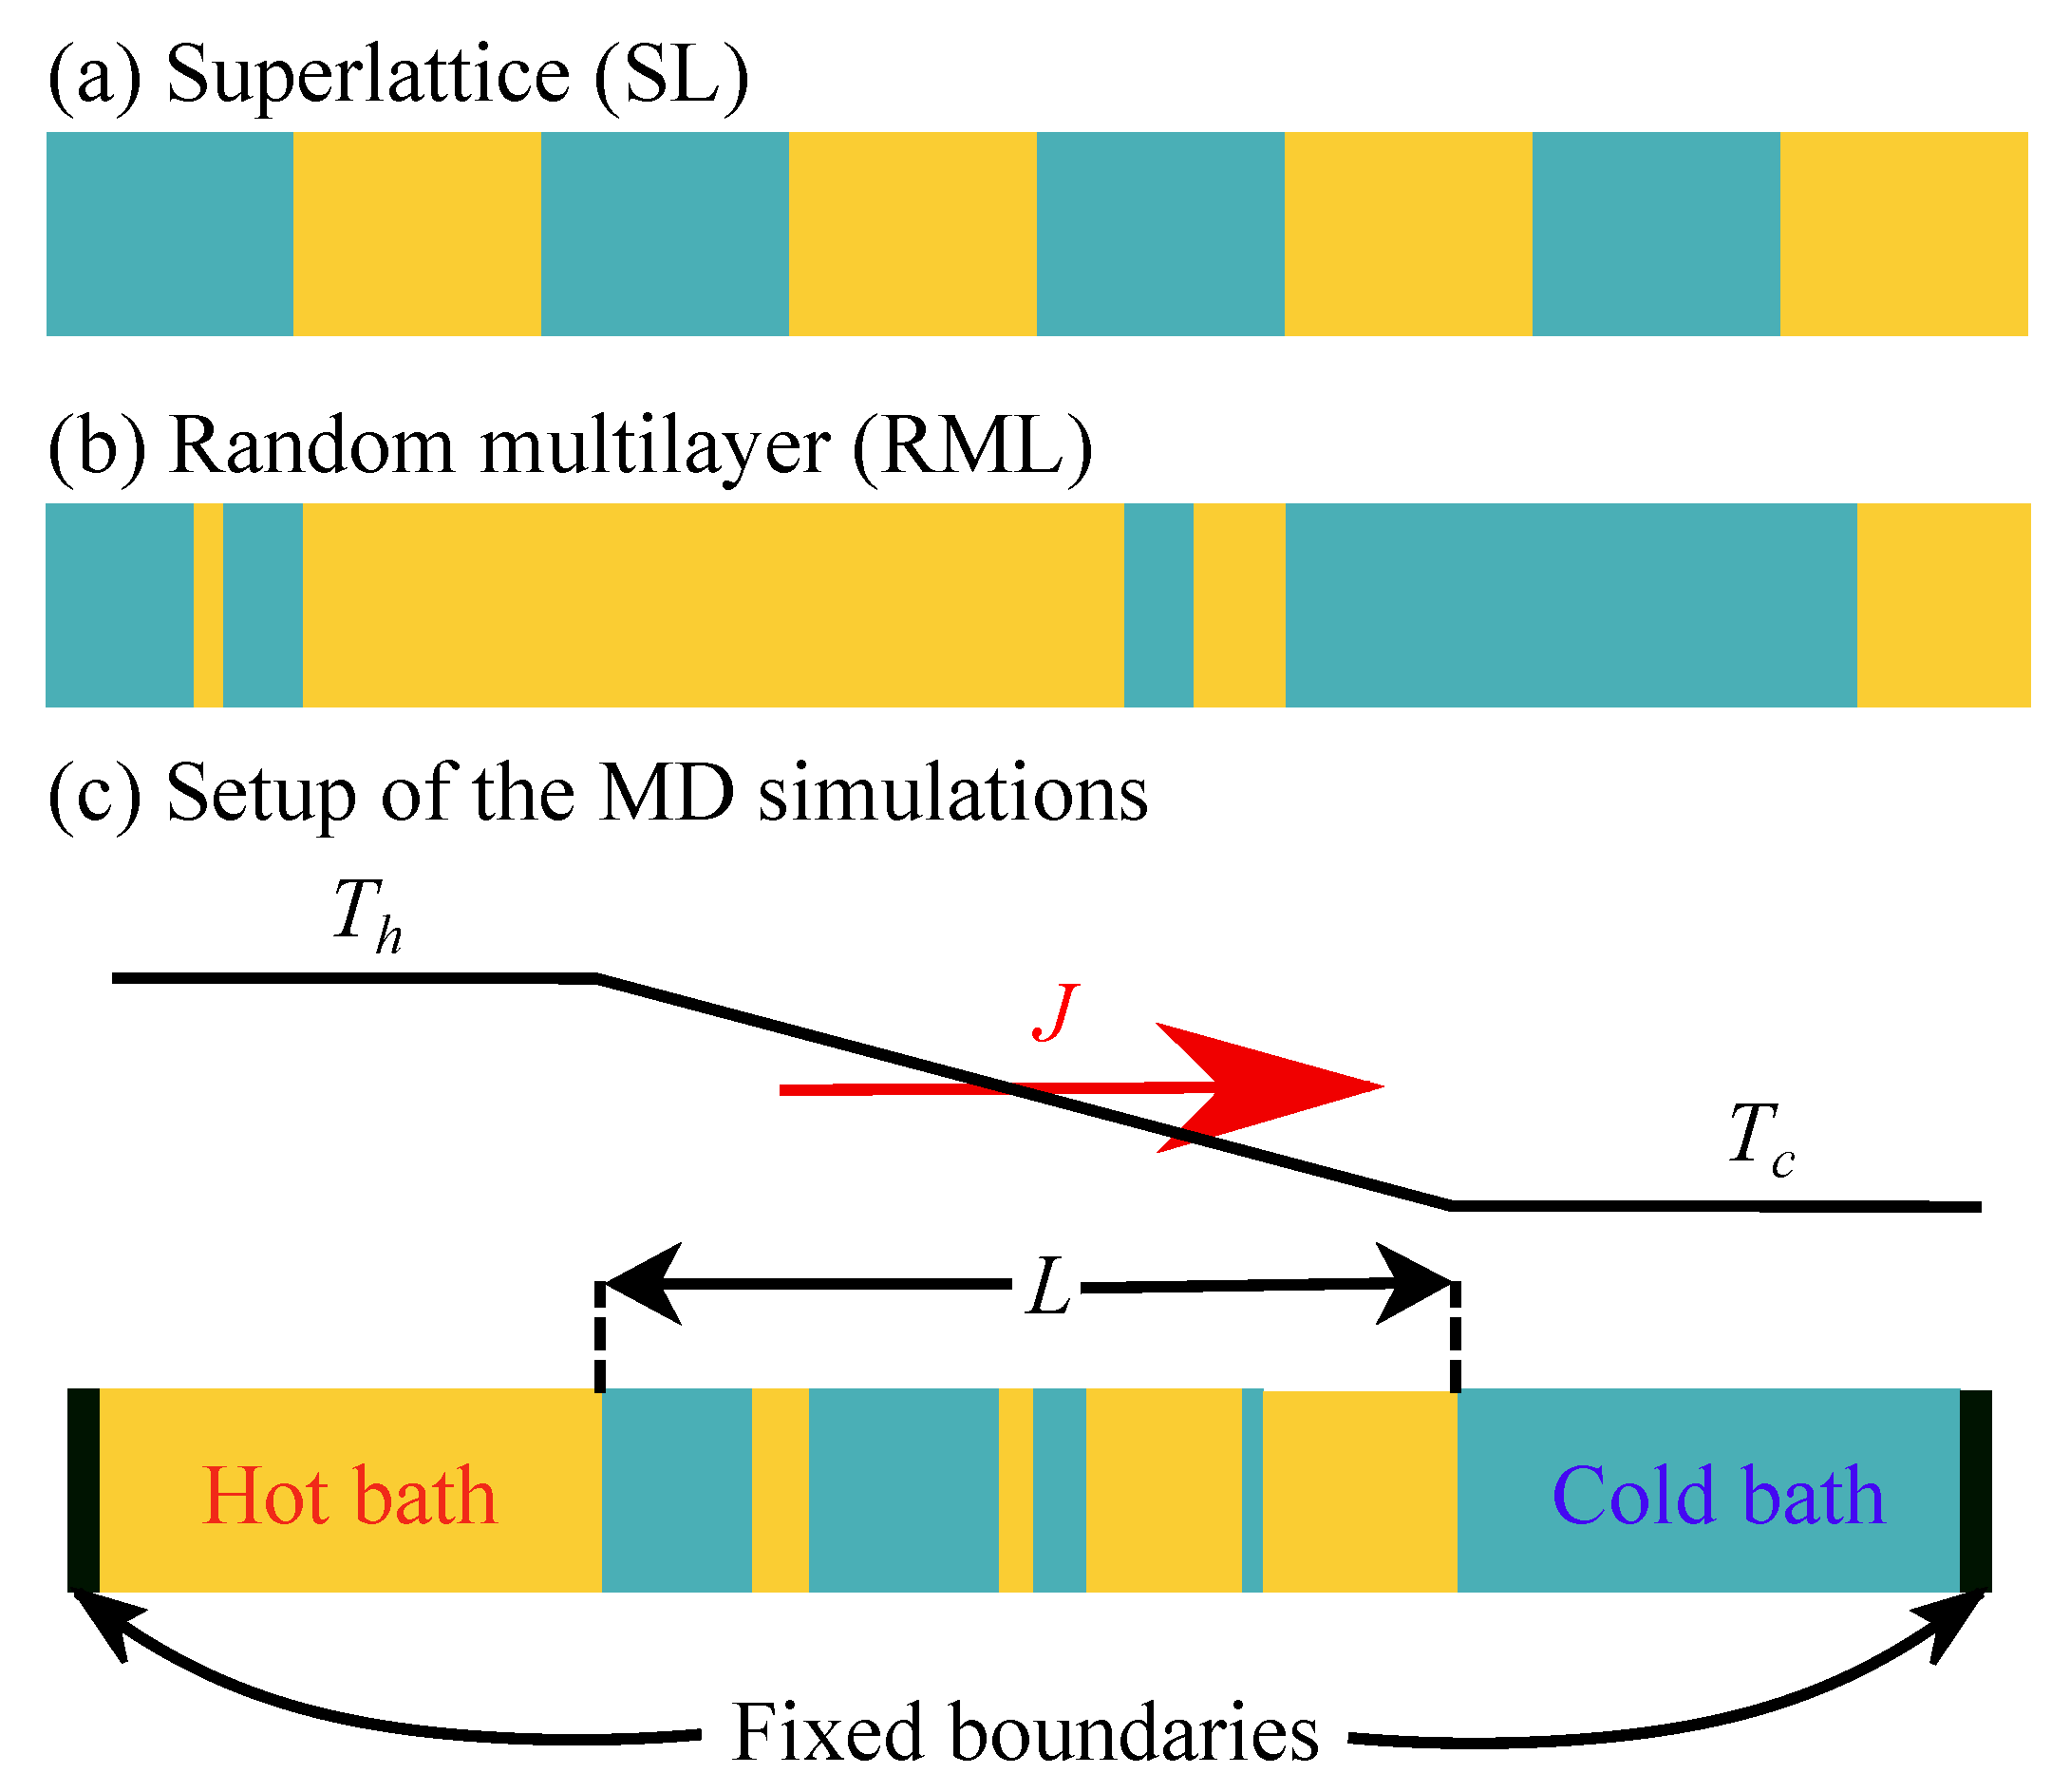
2.1. Model System
2.2. Simulation Setup
2.3. Two-Phonon Model
- 1
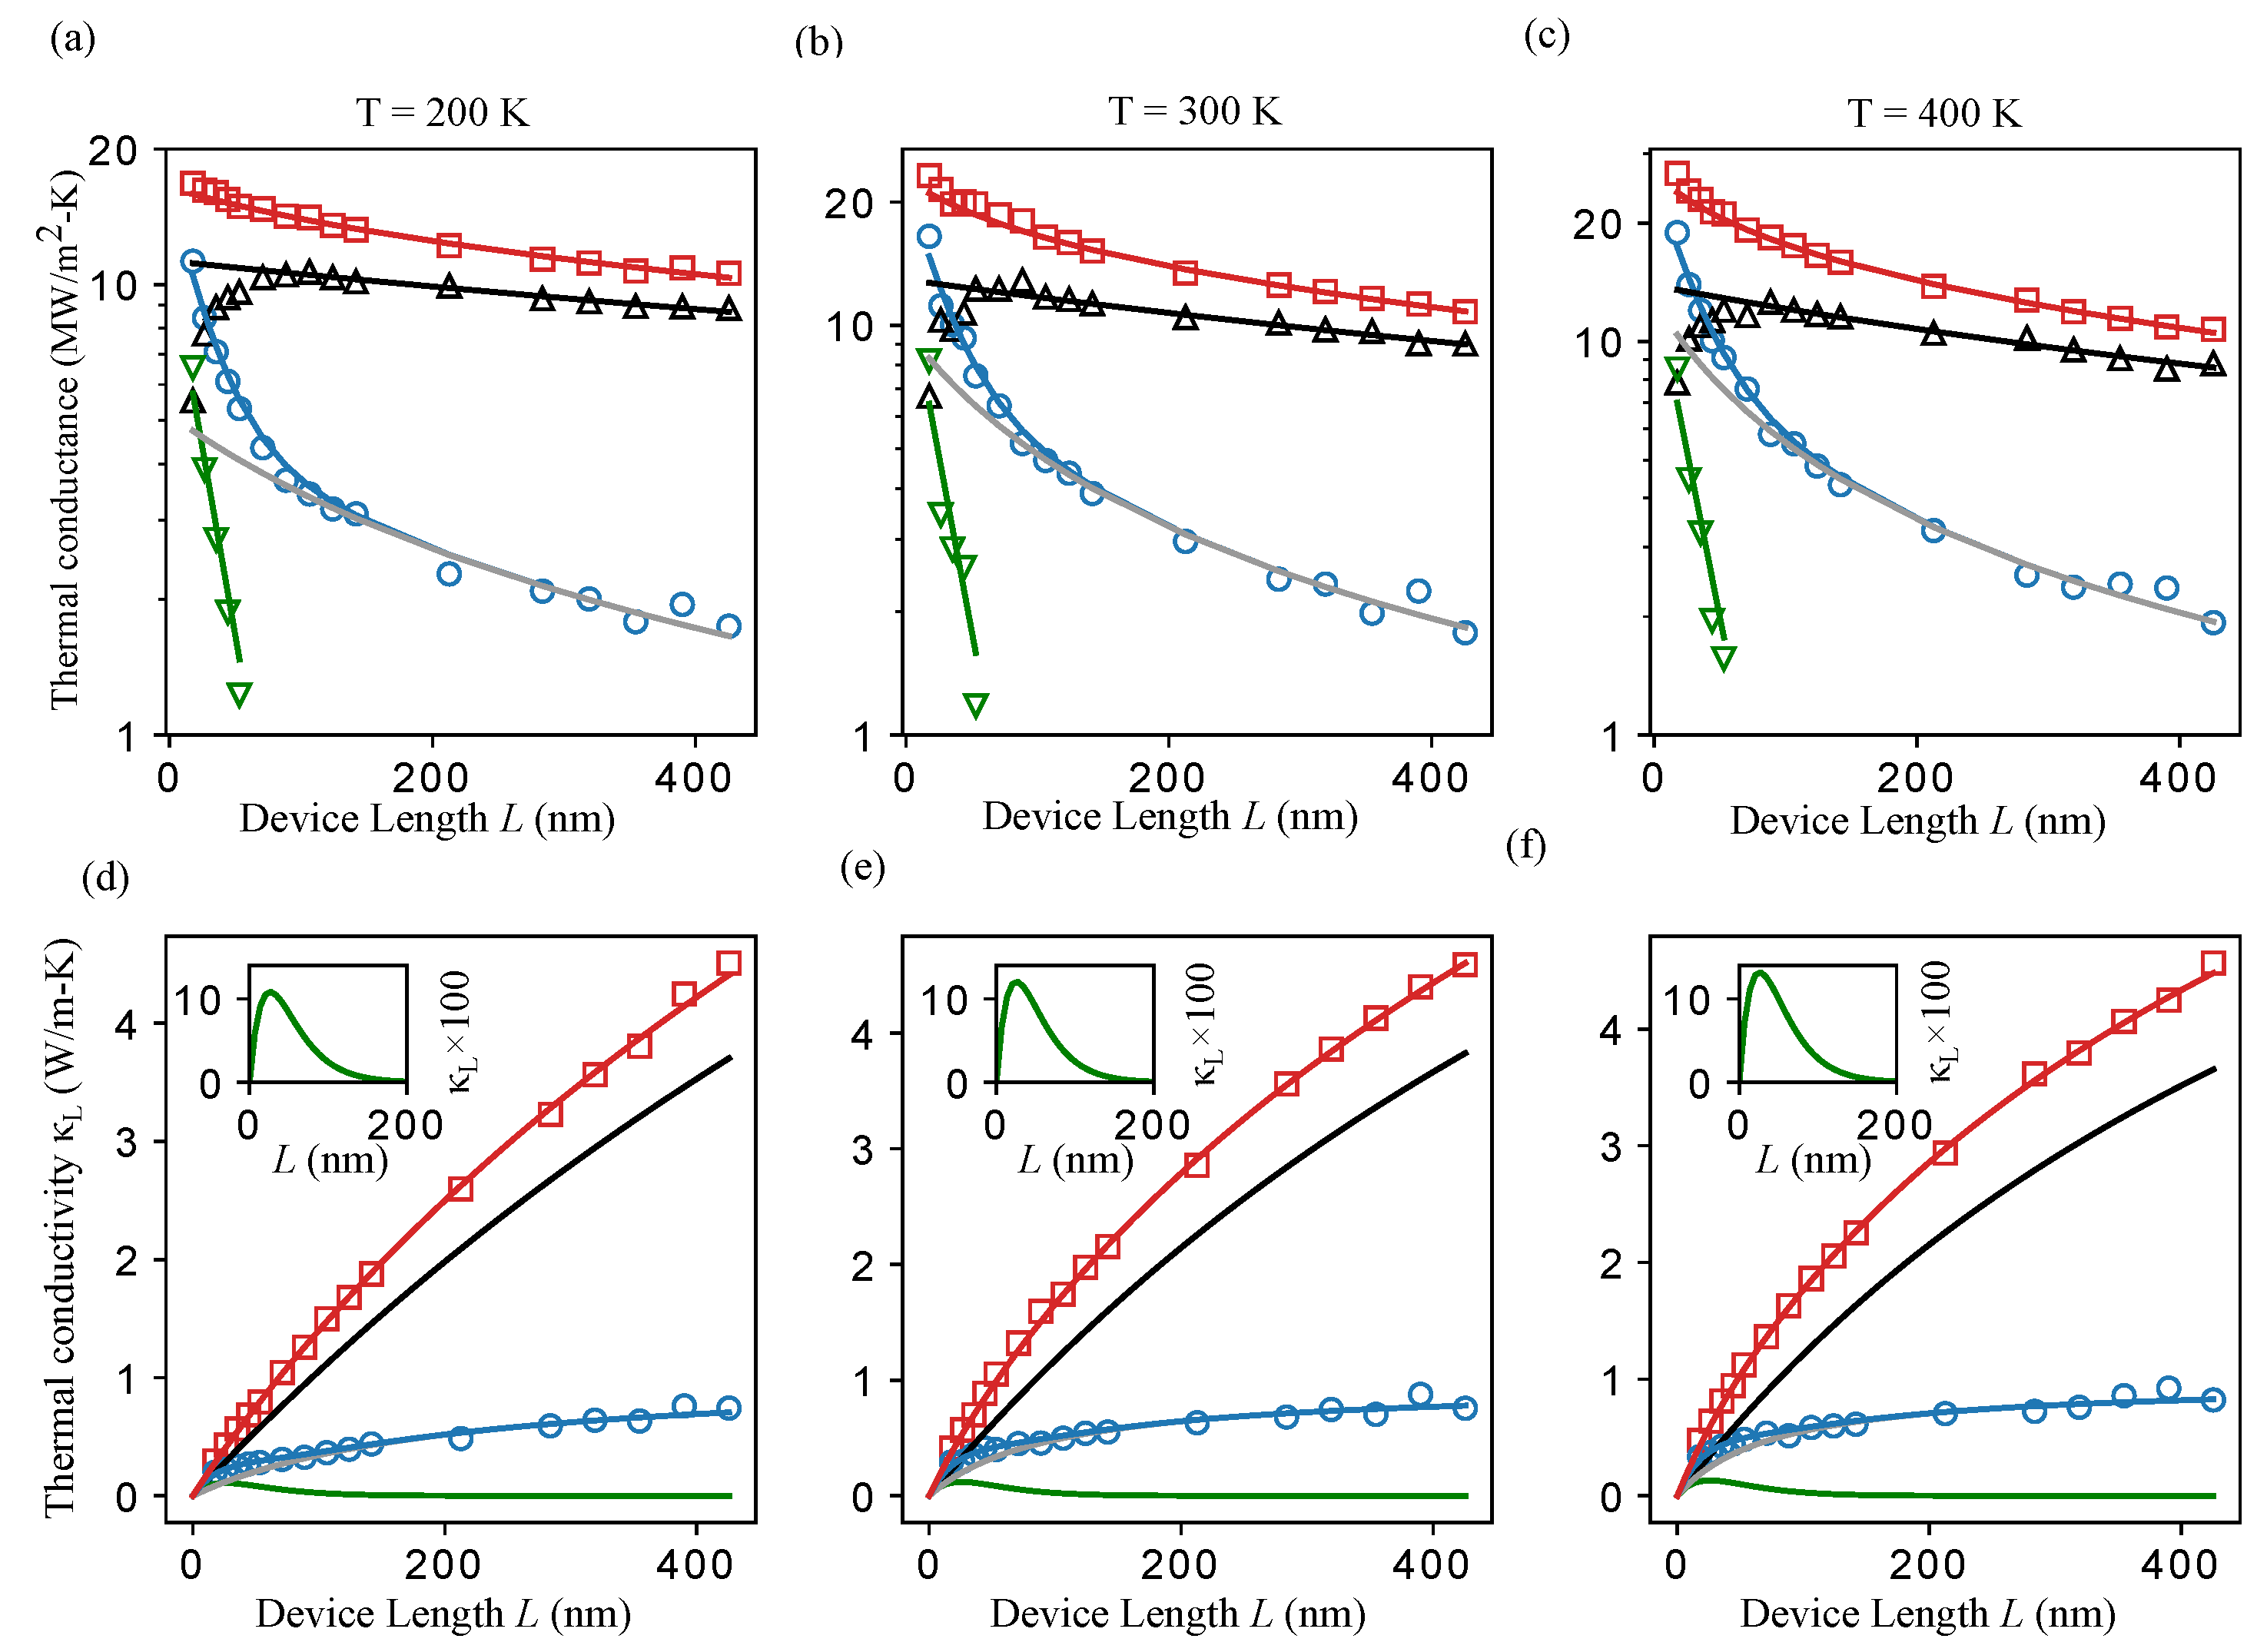
- Extraction of incoherent parameters: Equation (8) is fitted to the raw NEMD data points of for nm to extract and . This yields the full curve.
- 2
- Extraction of coherent parameters: The difference (subtraction between raw NEMD data points) is fitted using Equation (9) for nm, yielding and , and reconstructing .
- 3
- Determination of localization length: Subtracting from provides the localized coherent contribution in RMLs, which is fitted using Equation (10) to extract and generate .
- 4
- Model validation: Using Equation (6), is reconstructed as the sum of and , and can be compared to the NEMD data to validate the fitting quality and, thus, the applicability of the two-phonon model for the system being investigated.
3. Results and Discussion
3.1. Two-Phonon Model Analysis
3.2. NEMD Simulations of Si/Ge Superlattices
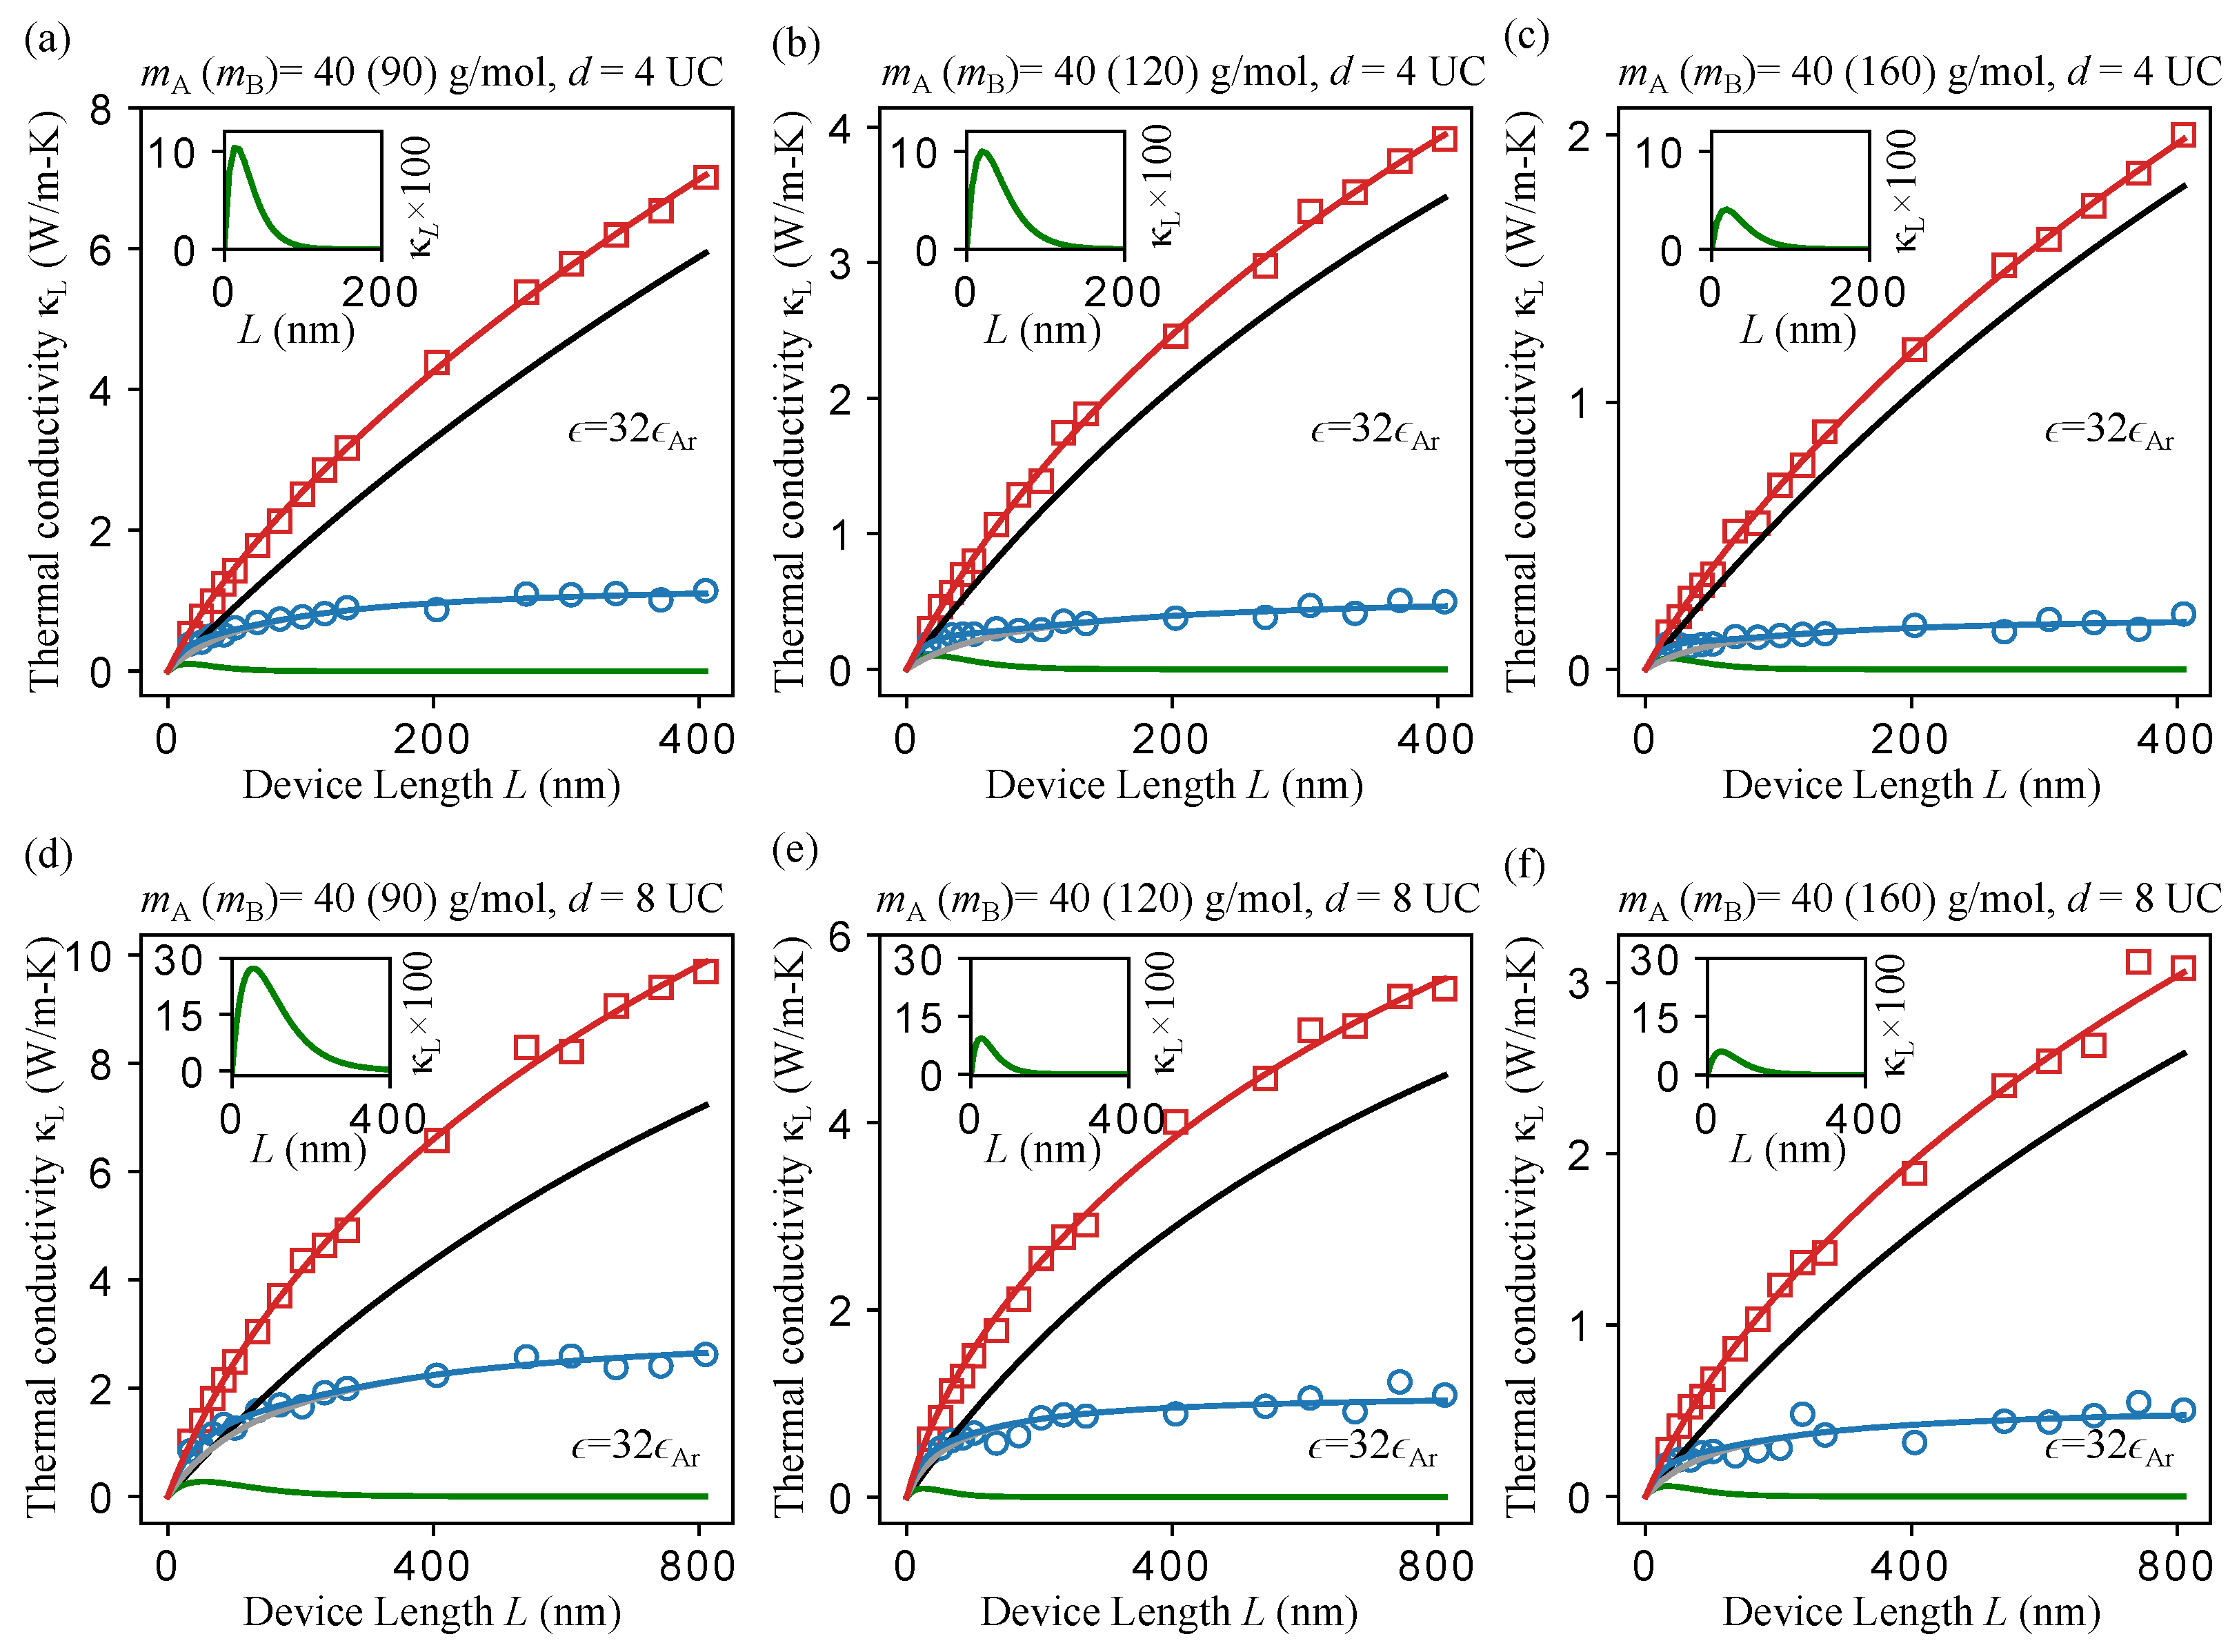
3.3. NEMD Investigation of LJ Systems with Controlled Acoustic Contrasts and Bond Strengths
4. Conclusions
Author Contributions
Funding
Data Availability Statement
Acknowledgments
Conflicts of Interest
References
- Chakraborty, P.; Ma, T.; Zahiri, A.H.; Cao, L.; Wang, Y. Carbon-Based Materials for Thermoelectrics. Adv. Condens. Matter Phys. 2018, 2018, 3898479. [Google Scholar] [CrossRef]
- Qian, X.; Zhou, J.; Chen, G. Phonon-engineered extreme thermal conductivity materials. Nat. Mater. 2021, 20, 1188–1202. [Google Scholar] [CrossRef] [PubMed]
- Han, H.; Zhao, L.; Wu, X.; Zuo, B.; Bian, S.; Li, T.; Liu, X.; Jiang, Y.; Chen, C.; Bi, J.; et al. Advancements in thermoelectric materials: Optimization strategies for enhancing energy conversion. J. Mater. Chem. A 2024, 12, 24041–24083. [Google Scholar] [CrossRef]
- Wang, Y.; Huang, H.; Ruan, X. Decomposition of coherent and incoherent phonon conduction in superlattices and random multilayers. Phys. Rev. B 2014, 90, 165406. [Google Scholar] [CrossRef]
- Mendoza, J.; Chen, G. Anderson localization of thermal phonons leads to a thermal conductivity maximum. Nano Lett. 2016, 16, 7616–7620. [Google Scholar] [CrossRef] [PubMed]
- Luckyanova, M.N.; Mendoza, J.; Lu, H.; Song, B.; Huang, S.; Zhou, J.; Li, M.; Dong, Y.; Zhou, H.; Garlow, J.; et al. Phonon localization in heat conduction. Sci. Adv. 2018, 4, eaat9460. [Google Scholar] [CrossRef] [PubMed]
- Juntunen, T.; Vänskä, O.; Tittonen, I. Anderson localization quenches thermal transport in aperiodic superlattices. Phys. Rev. Lett. 2019, 122, 105901. [Google Scholar] [CrossRef] [PubMed]
- Hu, R.; Iwamoto, S.; Feng, L.; Ju, S.; Hu, S.; Ohnishi, M.; Nagai, N.; Hirakawa, K.; Shiomi, J. Machine-learning-optimized aperiodic superlattice minimizes coherent phonon heat conduction. Phys. Rev. X 2020, 10, 021050. [Google Scholar] [CrossRef]
- Hu, R.; Tian, Z. Direct observation of phonon Anderson localization in Si/Ge aperiodic superlattices. Phys. Rev. B 2021, 103, 045304. [Google Scholar] [CrossRef]
- Wang, Y.; Gu, C.; Ruan, X. Optimization of the random multilayer structure to break the random-alloy limit of thermal conductivity. Appl. Phys. Lett. 2015, 106. [Google Scholar] [CrossRef]
- Manley, M.E.; Lynn, J.W.; Abernathy, D.L.; Specht, E.D.; Delaire, O.; Bishop, A.R.; Sahul, R.; Budai, J.D. Phonon localization drives polar nanoregions in a relaxor ferroelectric. Nat. Commun. 2014, 5, 3683. [Google Scholar] [CrossRef] [PubMed]
- Manley, M.E.; Hellman, O.; Shulumba, N.; May, A.F.; Stonaha, P.J.; Lynn, J.W.; Garlea, V.O.; Alatas, A.; Hermann, R.P.; Budai, J.D.; et al. Intrinsic anharmonic localization in thermoelectric PbSe. Nat. Commun. 2019, 10, 1928. [Google Scholar] [CrossRef] [PubMed]
- Lagendijk, A.; Tiggelen, B.v.; Wiersma, D.S. Fifty years of Anderson localization. Phys. Today 2009, 62, 24–29. [Google Scholar] [CrossRef]
- Lahini, Y.; Avidan, A.; Pozzi, F.; Sorel, M.; Morandotti, R.; Christodoulides, D.N.; Silberberg, Y. Anderson Localization and Nonlinearity in One-Dimensional Disordered Photonic Lattices. Phys. Rev. Lett. 2008, 100, 013906. [Google Scholar] [CrossRef] [PubMed]
- Segev, M.; Silberberg, Y.; Christodoulides, D.N. Anderson localization of light. Nat. Photonics 2013, 7, 197–204. [Google Scholar] [CrossRef]
- Sarkar, S.; Krajčí, M.; Sadhukhan, P.; Singh, V.K.; Gloskovskii, A.; Mandal, P.; Fournée, V.; de Weerd, M.C.; Ledieu, J.; Fisher, I.R.; et al. Anderson localization of electron states in a quasicrystal. Phys. Rev. B 2021, 103, L241106. [Google Scholar] [CrossRef]
- Ma, T.; Lin, C.T.; Wang, Y. The dimensionality effect on phonon localization in graphene/hexagonal boron nitride superlattices. 2D Mater. 2020, 7, 035029. [Google Scholar] [CrossRef]
- Mu, X.; Wang, L.; Yang, X.; Zhang, P.; To, A.C.; Luo, T. Ultra-low Thermal Conductivity in Si/Ge Hierarchical Superlattice Nanowire. Sci. Rep. 2015, 5, 16697, Correction in Sci. Rep. 2016, 6, 32904. https://doi.org/10.1038/srep32904. [Google Scholar] [CrossRef] [PubMed]
- Chakraborty, P.; Cao, L.; Wang, Y. Ultralow lattice thermal conductivity of the random multilayer structure with lattice imperfections. Sci. Rep. 2017, 7, 8134. [Google Scholar] [CrossRef] [PubMed]
- Chakraborty, P.; Liu, Y.; Ma, T.; Guo, X.; Cao, L.; Hu, R.; Wang, Y. Quenching thermal transport in aperiodic superlattices: A molecular dynamics and machine learning study. ACS Appl. Mater. Interfaces 2020, 12, 8795–8804. [Google Scholar] [CrossRef] [PubMed]
- Liu, Y.; Hu, R.; Wang, Y.; Ma, J.; Yang, Z.; Luo, X. Big-data-accelerated aperiodic Si/Ge superlattice prediction for quenching thermal conduction via pattern analysis. Energy AI 2021, 3, 100046. [Google Scholar] [CrossRef]
- Sääskilahti, K.; Oksanen, J.; Tulkki, J.; Volz, S. Role of anharmonic phonon scattering in the spectrally decomposed thermal conductance at planar interfaces. Phys. Rev. B 2014, 90, 134312. [Google Scholar] [CrossRef]
- Sääskilahti, K.; Oksanen, J.; Volz, S.; Tulkki, J. Frequency-dependent phonon mean free path in carbon nanotubes from nonequilibrium molecular dynamics. Phys. Rev. B 2015, 91, 115426. [Google Scholar] [CrossRef]
- Cui, H.; Ma, T.; Wang, Y. Elucidating optimal nanohole structures for suppressing phonon transport in nanomeshes. 2D Mater. 2024, 11, 035026. [Google Scholar] [CrossRef]
- Cui, H.; Maranets, T.; Ma, T.; Wang, Y. Spectral analysis of coherent and incoherent phonon transport in silicon nanomeshes. Phys. Rev. B 2024, 110, 075301. [Google Scholar] [CrossRef]
- Thomas, J.A.; Turney, J.E.; Iutzi, R.M.; Amon, C.H.; McGaughey, A.J.H. Predicting phonon dispersion relations and lifetimes from the spectral energy density. Phys. Rev. B 2010, 81, 081411, Erratum in Phys. Rev. B 2015, 91, 239905. https://doi.org/10.1103/PhysRevB.91.239905. [Google Scholar] [CrossRef]
- Panneerselvam, I.R.; Cui, H.; Maranets, T.; Wang, Y. Disorder-dominated and scattering-dominated thermal transport in clathrate hydrates. Comput. Mater. Sci. 2024, 244, 113189. [Google Scholar] [CrossRef]
- Nasiri, M.; Wang, Y. Evolution of Phonon Spectral Energy Density in Superlattice Structures. Crystals 2025, 15, 446. [Google Scholar] [CrossRef]
- Cui, H.; Hua, W.; Cao, L.; Jin, Y.; Wang, Y. Deep-neural-network molecular dynamics investigation of phonon thermal transport in polyether ether ketone. Comput. Mater. Sci. 2025, 249, 113641. [Google Scholar] [CrossRef]
- Cui, H.; Maranets, T.; Ma, T.; Wang, Y. Spectral heat flux redistribution upon interfacial transmission. J. Physics Condens. Matter 2025, 37, 115002. [Google Scholar] [CrossRef] [PubMed]
- Landry, E.; McGaughey, A. Effect of interfacial species mixing on phonon transport in semiconductor superlattices. Phys. Rev. B—Condens. Matter Mater. Phys. 2009, 79, 075316. [Google Scholar] [CrossRef]
- Bai, J.; Zhong, X.; Jiang, S.; Huang, Y.; Duan, X. Graphene nanomesh. Nat. Nanotechnol. 2010, 5, 190–194. [Google Scholar] [CrossRef] [PubMed]
- Yang, Y.; Yang, X.; Liang, L.; Gao, Y.; Cheng, H.; Li, X.; Zou, M.; Ma, R.; Yuan, Q.; Duan, X. Large-area graphene-nanomesh/carbon-nanotube hybrid membranes for ionic and molecular nanofiltration. Science 2019, 364, 1057–1062. [Google Scholar] [CrossRef] [PubMed]
- Yu, J.K.; Mitrovic, S.; Tham, D.; Varghese, J.; Heath, J.R. Reduction of thermal conductivity in phononic nanomesh structures. Nat. Nanotechnol. 2010, 5, 718–721. [Google Scholar] [CrossRef] [PubMed]
- Hopkins, P.E.; Reinke, C.M.; Su, M.F.; Olsson, R.H.I.; Shaner, E.A.; Leseman, Z.C.; Serrano, J.R.; Phinney, L.M.; El-Kady, I. Reduction in the Thermal Conductivity of Single Crystalline Silicon by Phononic Crystal Patterning. Nano Lett. 2011, 11, 107–112. [Google Scholar] [CrossRef] [PubMed]
- Zen, N.; Puurtinen, T.A.; Isotalo, T.J.; Chaudhuri, S.; Maasilta, I.J. Engineering thermal conductance using a two-dimensional phononic crystal. Nat. Commun. 2014, 5, 3435. [Google Scholar] [CrossRef] [PubMed]
- Alaie, S.; Goettler, D.F.; Su, M.; Leseman, Z.C.; Reinke, C.M.; El-Kady, I. Thermal transport in phononic crystals and the observation of coherent phonon scattering at room temperature. Nat. Commun. 2015, 6, 7228. [Google Scholar] [CrossRef] [PubMed]
- Wagner, M.R.; Graczykowski, B.; Reparaz, J.S.; El Sachat, A.; Sledzinska, M.; Alzina, F.; Sotomayor Torres, C.M. Two-Dimensional Phononic Crystals: Disorder Matters. Nano Lett. 2016, 16, 5661–5668. [Google Scholar] [CrossRef] [PubMed]
- Lee, J.; Lee, W.; Wehmeyer, G.; Dhuey, S.; Olynick, D.L.; Cabrini, S.; Dames, C.; Urban, J.J.; Yang, P. Investigation of phonon coherence and backscattering using silicon nanomeshes. Nat. Commun. 2017, 8, 14054. [Google Scholar] [CrossRef] [PubMed]
- Maire, J.; Anufriev, R.; Yanagisawa, R.; Ramiere, A.; Volz, S.; Nomura, M. Heat conduction tuning by wave nature of phonons. Sci. Adv. 2017, 3, e1700027. [Google Scholar] [CrossRef] [PubMed]
- Schelling, P.K.; Phillpot, S.R.; Keblinski, P. Phonon wave-packet dynamics at semiconductor interfaces by molecular-dynamics simulation. Appl. Phys. Lett. 2002, 80, 2484–2486. [Google Scholar] [CrossRef]
- Latour, B.; Volz, S.; Chalopin, Y. Microscopic description of thermal-phonon coherence: From coherent transport to diffuse interface scattering in superlattices. Phys. Rev. B 2014, 90, 014307. [Google Scholar] [CrossRef]
- Latour, B.; Chalopin, Y. Distinguishing between spatial coherence and temporal coherence of phonons. Phys. Rev. B 2017, 95, 214310. [Google Scholar] [CrossRef]
- Maranets, T.; Wang, Y. Prominent phonon transmission across aperiodic superlattice through coherent mode-conversion. Appl. Phys. Lett. 2024, 125, 042205. [Google Scholar] [CrossRef]
- Maranets, T.; Wang, Y. How phonon coherence develops and contributes to heat conduction in periodic and aperiodic superlattices. Int. J. Therm. Sci. 2025, 217, 110018. [Google Scholar] [CrossRef]
- Maranets, T.; Nasiri, M.; Wang, Y. Influence of spatial coherence on phonon transmission across aperiodically arranged interfaces. Phys. Lett. A 2024, 512, 129572. [Google Scholar] [CrossRef]
- Chen, G. Non-Fourier phonon heat conduction at the microscale and nanoscale. Nat. Rev. Phys. 2021, 3, 555–569. [Google Scholar] [CrossRef]
- Filho, M.A.M.; Farmer, W.; Hsiao, C.L.; dos Santos, R.B.; Hultman, L.; Birch, J.; Ankit, K.; Gueorguiev, G.K. Density Functional Theory-Fed Phase Field Model for Semiconductor Nanostructures: The Case of Self-Induced Core–Shell InAlN Nanorods. Cryst. Growth Des. 2024, 24, 4717–4727. [Google Scholar] [CrossRef] [PubMed]
- Thompson, A.P.; Aktulga, H.M.; Berger, R.; Bolintineanu, D.S.; Brown, W.M.; Crozier, P.S.; In’t Veld, P.J.; Kohlmeyer, A.; Moore, S.G.; Nguyen, T.D.; et al. LAMMPS-a flexible simulation tool for particle-based materials modeling at the atomic, meso, and continuum scales. Comput. Phys. Commun. 2022, 271, 108171. [Google Scholar] [CrossRef]
- Stillinger, F.H.; Weber, T.A. Computer simulation of local order in condensed phases of silicon. Phys. Rev. B 1985, 31, 5262–5271, Erratum in Phys. Rev. B 1986, 33, 1451. https://doi.org/10.1103/PhysRevB.33.1451. [Google Scholar] [CrossRef] [PubMed]
- Ding, K.; Andersen, H.C. Molecular-dynamics simulation of amorphous germanium. Phys. Rev. B 1986, 34, 6987–6991. [Google Scholar] [CrossRef] [PubMed]
- Lee, S.M.; Cahill, D.G.; Venkatasubramanian, R. Thermal conductivity of Si–Ge superlattices. Appl. Phys. Lett. 1997, 70, 2957–2959. [Google Scholar] [CrossRef]
- Chakraborty, S.; Kleint, C.; Heinrich, A.; Schneider, C.; Schumann, J.; Falke, M.; Teichert, S. Thermal conductivity in strain symmetrized Si/Ge superlattices on Si (111). Appl. Phys. Lett. 2003, 83, 4184–4186, Erratum in Appl. Phys. Lett. 2004, 84, 2000. https://doi.org/10.1063/1.1650559. [Google Scholar] [CrossRef]
- Luckyanova, M.N.; Garg, J.; Esfarjani, K.; Jandl, A.; Bulsara, M.T.; Schmidt, A.J.; Minnich, A.J.; Chen, S.; Dresselhaus, M.S.; Ren, Z.; et al. Coherent phonon heat conduction in superlattices. Science 2012, 338, 936–939. [Google Scholar] [CrossRef] [PubMed]
- Venkatasubramanian, R.; Siivola, E.; Colpitts, T.; O’quinn, B. Thin-film thermoelectric devices with high room-temperature figures of merit. Nature 2001, 413, 597–602. [Google Scholar] [CrossRef] [PubMed]
- Cui, H.; Panneerselvam, I.R.; Chakraborty, P.; Nian, Q.; Liao, Y.; Wang, Y. Significantly enhanced interfacial thermal transport between single-layer graphene and water through basal-plane oxidation. Carbon 2025, 234, 119910. [Google Scholar] [CrossRef]
- Jeong, C.; Datta, S.; Lundstrom, M. Thermal conductivity of bulk and thin-film silicon: A Landauer approach. J. Appl. Phys. 2012, 111, 093708. [Google Scholar] [CrossRef]
- Kruglyak, Y. Landauer-Datta-Lundstrom Generalized Transport Model for Nanoelectronics. J. Nanosci. 2014, 2014, 725420. [Google Scholar] [CrossRef]
- Maassen, J.; Lundstrom, M. (Invited) The Landauer Approach to Electron and Phonon Transport. ECS Trans. 2015, 69, 23. [Google Scholar] [CrossRef]
- Chakraborty, P.; Chiu, I.A.; Ma, T.; Wang, Y. Complex temperature dependence of coherent and incoherent lattice thermal transport in superlattices. Nanotechnology 2020, 32, 065401. [Google Scholar] [CrossRef] [PubMed]
- Maranets, T.; Doe, E.; Wang, Y. Role of interface mixing on coherent heat conduction in periodic and aperiodic superlattices. arXiv 2025, arXiv:2501.17346. [Google Scholar] [CrossRef]
- Swartz, E.T.; Pohl, R.O. Thermal boundary resistance. Rev. Mod. Phys. 1989, 61, 605–668. [Google Scholar] [CrossRef]
- Barakat, N.; Hassan, F.E.H.; Kazan, M. Modification of the Acoustic Mismatch Model and Diffuse Mismatch Model for Accurate Prediction of Interface Thermal Conductance at Low Temperatures. ASME J. Heat Mass Transf. 2024, 146, 041401. [Google Scholar] [CrossRef]
- De Bellis, L.; Phelan, P.E.; Prasher, R.S. Variations of Acoustic and Diffuse Mismatch Models in Predicting Thermal-Boundary Resistance. J. Thermophys. Heat Transf. 2000, 14, 144–150. [Google Scholar] [CrossRef]
- Simkin, M.; Mahan, G. Minimum thermal conductivity of superlattices. Phys. Rev. Lett. 2000, 84, 927. [Google Scholar] [CrossRef] [PubMed]
- Chen, Y.; Li, D.; Lukes, J.R.; Ni, Z.; Chen, M. Minimum superlattice thermal conductivity from molecular dynamics. Phys. Rev. B—Condensed Matter Mater. Phys. 2005, 72, 174302. [Google Scholar] [CrossRef]
- Ravichandran, J.; Yadav, A.K.; Cheaito, R.; Rossen, P.B.; Soukiassian, A.; Suresha, S.; Duda, J.C.; Foley, B.M.; Lee, C.H.; Zhu, Y.; et al. Crossover from incoherent to coherent phonon scattering in epitaxial oxide superlattices. Nat. Mater. 2014, 13, 168–172. [Google Scholar] [CrossRef] [PubMed]


| Material System | Potential | Mass_A (g/mol) | Mass_B (g/mol) | Bond Strength | Avg. Layer Thickness (d) |
|---|---|---|---|---|---|
| Lennard-Jones | Lennard-Jones | 40 | 90 | 1 | 4 UC |
| Lennard-Jones | Lennard-Jones | 40 | 120 | 1 | 4 UC |
| Lennard-Jones | Lennard-Jones | 40 | 160 | 1 | 4 UC |
| Lennard-Jones | Lennard-Jones | 40 | 90 | 1 | 8 UC |
| Lennard-Jones | Lennard-Jones | 40 | 120 | 1 | 8 UC |
| Lennard-Jones | Lennard-Jones | 40 | 160 | 1 | 8 UC |
| Lennard-Jones | Lennard-Jones | 40 | 90 | 16 | 4 UC |
| Lennard-Jones | Lennard-Jones | 40 | 120 | 16 | 4 UC |
| Lennard-Jones | Lennard-Jones | 40 | 160 | 16 | 4 UC |
| Lennard-Jones | Lennard-Jones | 40 | 90 | 16 | 8 UC |
| Lennard-Jones | Lennard-Jones | 40 | 120 | 16 | 8 UC |
| Lennard-Jones | Lennard-Jones | 40 | 160 | 16 | 8 UC |
| Lennard-Jones | Lennard-Jones | 40 | 90 | 32 | 4 UC |
| Lennard-Jones | Lennard-Jones | 40 | 120 | 32 | 4 UC |
| Lennard-Jones | Lennard-Jones | 40 | 160 | 32 | 4 UC |
| Lennard-Jones | Lennard-Jones | 40 | 90 | 32 | 8 UC |
| Lennard-Jones | Lennard-Jones | 40 | 120 | 32 | 8 UC |
| Lennard-Jones | Lennard-Jones | 40 | 160 | 32 | 8 UC |
| Lennard-Jones | Lennard-Jones | 40 | 90 | 64 | 4 UC |
| Lennard-Jones | Lennard-Jones | 40 | 120 | 64 | 4 UC |
| Lennard-Jones | Lennard-Jones | 40 | 160 | 64 | 4 UC |
| Lennard-Jones | Lennard-Jones | 40 | 90 | 64 | 8 UC |
| Lennard-Jones | Lennard-Jones | 40 | 120 | 64 | 8 UC |
| Lennard-Jones | Lennard-Jones | 40 | 160 | 64 | 8 UC |
| Si/Ge | Stillinger–Weber | 28.08 | 72.63 | Default | 4 UC |
| Si/hSi | Stillinger–Weber | 28.08 | 112.3 | Default | 4 UC |
| Si/hSi | Stillinger–Weber | 28.08 | 112.3 | Default | 8 UC |
Disclaimer/Publisher’s Note: The statements, opinions and data contained in all publications are solely those of the individual author(s) and contributor(s) and not of MDPI and/or the editor(s). MDPI and/or the editor(s) disclaim responsibility for any injury to people or property resulting from any ideas, methods, instructions or products referred to in the content. |
© 2025 by the authors. Licensee MDPI, Basel, Switzerland. This article is an open access article distributed under the terms and conditions of the Creative Commons Attribution (CC BY) license (https://creativecommons.org/licenses/by/4.0/).
Share and Cite
Chakraborty, P.; Nasiri, M.; Cui, H.; Maranets, T.; Wang, Y. A Comprehensive Investigation of the Two-Phonon Characteristics of Heat Conduction in Superlattices. Crystals 2025, 15, 654. https://doi.org/10.3390/cryst15070654
Chakraborty P, Nasiri M, Cui H, Maranets T, Wang Y. A Comprehensive Investigation of the Two-Phonon Characteristics of Heat Conduction in Superlattices. Crystals. 2025; 15(7):654. https://doi.org/10.3390/cryst15070654
Chicago/Turabian StyleChakraborty, Pranay, Milad Nasiri, Haoran Cui, Theodore Maranets, and Yan Wang. 2025. "A Comprehensive Investigation of the Two-Phonon Characteristics of Heat Conduction in Superlattices" Crystals 15, no. 7: 654. https://doi.org/10.3390/cryst15070654
APA StyleChakraborty, P., Nasiri, M., Cui, H., Maranets, T., & Wang, Y. (2025). A Comprehensive Investigation of the Two-Phonon Characteristics of Heat Conduction in Superlattices. Crystals, 15(7), 654. https://doi.org/10.3390/cryst15070654