Article

Enhancing Fatigue Life Prediction Accuracy: A Parametric Study of Stress Ratios and Hole Position Using SMART Crack Growth Technology

by
Yahya Ali Fageehi
and
Abdulnaser M. Alshoaibi
*
Department of Mechanical Engineering, College of Engineering and Computer Sciences, Jazan University, Jazan 45142, Saudi Arabia
*
Author to whom correspondence should be addressed.
Crystals 2025, 15(7), 596; https://doi.org/10.3390/cryst15070596
Submission received: 28 May 2025 / Revised: 15 June 2025 / Accepted: 22 June 2025 / Published: 24 June 2025
(This article belongs to the Special Issue Fatigue and Fracture of Crystalline Metal Structures)

Abstract

This study presents a unique and comprehensive application of ANSYS Mechanical R19.2’s SMART crack growth feature, leveraging its capabilities to conduct an unprecedented parametric investigation into fatigue crack propagation behavior under a wide range of positive and negative stress ratios, and to provide detailed insights into the influence of hole positioning on crack trajectory. By uniquely employing an unstructured mesh method that significantly reduces computational overhead and automates mesh updates, this research overcomes traditional fracture simulation limitations. The investigation breaks new ground by comprehensively examining an unprecedented range of both positive (R = 0.1 to 0.5) and negative (R = −0.1 to −0.5) stress ratios, revealing previously unexplored relationships in fracture mechanics. Through rigorous and extensive numerical simulations on two distinct specimen configurations, i.e., a notched plate with a strategically positioned hole under fatigue loading and a cracked rectangular plate with dual holes under static loading, this work establishes groundbreaking correlations between stress parameters and fatigue behavior. The research reveals a novel inverse relationship between the equivalent stress intensity factor and stress ratio, alongside a previously uncharacterized inverse correlation between stress ratio and von Mises stress. Notably, a direct, accelerating relationship between stress ratio and fatigue life is demonstrated, where higher R-values non-linearly increase fatigue resistance by mitigating stress concentration, challenging conventional linear approximations. This investigation makes a substantial contribution to fracture mechanics by elucidating the fundamental role of hole positioning in controlling crack propagation paths. The research uniquely demonstrates that depending on precise hole location, cracks will either deviate toward the hole or maintain their original trajectory, a phenomenon attributed to the asymmetric stress distribution at the crack tip induced by the hole’s presence. These novel findings, validated against existing literature, represent a significant advancement in predictive modeling for fatigue life assessment, offering critical new insights for engineering design and maintenance strategies in high-stakes industries.

1. Introduction

Investigating fatigue crack growth is essential for assessing the durability and reliability of engineering materials under cyclic loading. Fatigue cracks often initiate and propagate in structures experiencing varying stress states, particularly under mixed mode loading with both tensile and shear stresses. This progressive structural damage can occur at stress levels below a material’s yield strength after multiple load cycles, making it a critical concern across industries like aerospace, automotive, and civil engineering. Crack initiation typically arises from microstructural defects or stress concentrations, with failure often stemming from the growth of dominant cracks. The fatigue crack growth (FCG) process is influenced by factors such as cyclic load, material properties, component geometry, and environmental conditions. Understanding and predicting the rate of crack growth is crucial for assessing remaining component life and implementing effective maintenance strategies, thereby ensuring structural integrity and preventing catastrophic failures [1,2,3]. The study of FCG has evolved significantly over the past century, moving from empirical observations to sophisticated theoretical models and advanced numerical techniques. Early investigations focused on establishing S–N curves (stress amplitude versus number of cycles to failure), which provide a macroscopic understanding of fatigue life [4,5]. In contrast to traditional curves, which do not explicitly include crack initiation and growth, fracture mechanics offers a more fundamental understanding of FCG by introducing the stress intensity factor [6,7]. This parameter measures the stress field at the crack tip and acts as a key factor in crack propagation. The behavior of crack growth is intrinsically linked to the durability of engineering structures. Under different loading conditions, cracks can initiate and propagate within materials, substantially affecting the structural integrity and longevity of parts. To accurately predict the lifespan of structures under operational conditions, it is essential to understand how cracks grow, thereby guaranteeing their resistance to fatigue and environmental stresses over time [8,9]. The stress ratio (R), the ratio of minimum to maximum stress within a load cycle, is a key factor in material durability and reliability under cyclic loading [10,11]. A positive stress ratio indicates that the entire fatigue cycle is tensile or oscillates between two tensile stress levels, which is commonly found in various engineering applications. In aerospace structures, components like aircraft wings and landing gear undergo fluctuating tensile loads during flight and ground operations [12,13]. Automotive parts such as suspension systems and engines face cyclic tensile stresses from vibrations and dynamic loading. Similarly, rotating machinery, including turbine blades and shafts, experiences cyclic tensile stresses due to rotation and applied forces. Civil engineering structures like bridges and cranes also encounter fluctuating tensile stresses from wind, traffic, and wave action [14,15], whereas a negative stress ratio occurs when the fatigue cycle involves both tensile and compressive stresses, with the minimum stress being compressive. This is evident in applications such as rolling contact fatigue, where components like bearings and gears experience complex stress states that can lead to subsurface cracking [16,17]. Bending loads also create both tensile and compressive stress across a component’s cross-section, resulting in negative stress ratios in specific areas. Regardless of the broad significance of FCG research across various engineering disciplines, investigations specifically focusing on the impact of negative stress ratios have been comparatively limited, and the findings from these studies have often presented inconsistencies. The fundamental question of how the compressive component of a cyclic stress influences the progression of fatigue cracks remains a vital area of ongoing inquiry [18,19,20,21]. Understanding the effect of stress ratios on fatigue life is paramount in the realm of material science and structural engineering. The fatigue life of a material, specifically the number of cycles it can endure before failure and the onset of crack propagation, is directly impacted by this critical parameter. Cyclic loading typically follows a sinusoidal pattern, determined by the minimum and maximum stress values. However, mean stress and stress amplitude can also be used to represent this cyclic loading. The relationships between these parameters can be expressed through the following formulas:
Mean stress:
σ m = σ max + σ min 2
Stress Amplitude:
σ a = σ max σ min 2
whereas
R = σ min σ max
Despite many investigations [22,23,24,25,26,27] that have attempted to define the relationship between stress ratio and FCG rate across various materials, a complete understanding remains elusive. The finite element method (FEM) has become an essential and powerful tool for analyzing FCG in engineering materials. Its strength lies in its capacity to simulate intricate geometries and loading scenarios, enabling engineers and researchers to predict material behavior under cyclic stress with great accuracy. The finite element method enables a thorough analysis of stress distribution and strain near cracks, leading to a greater comprehension of the mechanisms controlling crack initiation and growth. Moreover, the versatility of FEM makes it applicable across a wide range of materials and structural configurations, from metals to composites. Numerical simulations with FEM allow for a substantial reduction in the time and costs of experimental testing, facilitating more effective design and optimization workflows. Recent advancements, such as automated crack propagation features in software like ANSYS (version 2025 R1) and ABAQUS (version 2025x), further enhance the accuracy and efficiency of FCG analyses. In FCG analysis, several software solutions are available, including ZENCRACK [28,29], ANSYS [30,31,32,33,34], ABAQUS [35,36], COMSOL [37,38], and FRANC3D [39,40,41]. While this study utilizes established finite element methods and the built-in ANSYS SMART feature, its scientific novelty lies in the unprecedented scope of its parametric investigation across a wide range of positive and negative stress ratios, and its detailed elucidation of the fundamental role of hole positioning in controlling crack propagation paths. These comprehensive numerical simulations, though employing existing formulae, have enabled the discovery and quantitative demonstration of previously uncharacterized relationships in fatigue crack growth, providing novel insights that extend beyond a mere application of standard procedures. The rigorous analysis and interpretation of these findings contribute significantly to the understanding of complex fracture mechanics phenomena. Specifically, we leverage SMART’s capabilities to conduct an unprecedentedly comprehensive parametric investigation across a broad spectrum of both positive (R = 0.1 to 0.5) and negative (R = −0.1 to −0.5) stress ratios. This systematic approach allows us to uncover new fundamental relationships in fatigue crack growth that would be computationally prohibitive with traditional methods. Further advancements in crack propagation modeling have been explored by Bouchard et al. [42], who presented a solution based on an advanced, fully automatic remeshing technique capable of handling multiple boundaries and materials, and employing a maximal normal stress criterion for crack direction. Concurrently, the design implications of hole positions and shapes for crack tip stress release have been investigated by Pedersen [43], with a focus on optimizing hole placement and demonstrating that non-circular shapes can significantly improve the stress field at the crack boundary. Recently, Esposito et al. [44] proposed an automated, free-meshing procedure for fracture initiation and propagation in 2D structures, utilizing a hybrid semi-analytical method and a global–local energy criterion. The method uniquely handles structures without initial defects, with its accuracy demonstrated through numerical examples. This efficient approach offers insights for designing hollowed structures and analyzing complex fracture evolution. Furthermore, our work provides a detailed analysis of the fundamental role of hole positioning in controlling crack propagation paths, a phenomenon not as thoroughly investigated or elucidated using this technology in previous literature. Through comprehensive analysis, this study details the relationships between stress ratios, equivalent stress intensity factors, fatigue life, and von Mises stress, yielding practical insights that will contribute to better engineering design and maintenance strategies in industries where fatigue failure prediction is essential for operational safety and reliability. Thus, the SMART feature serves as an enabling technology that facilitates this in-depth and broad-ranging investigation, allowing us to push the boundaries of our current understanding of fracture mechanics.

2. Procedure for Numerical Analysis

To streamline the simulation of crack behavior, ANSYS Mechanical 19.2 incorporates the SMART feature, which automates the creation and growth of cracks. This study employs in-depth numerical simulations to predict crack growth paths in metallic materials that follow linear elastic fracture mechanics (LEFM) principles. This improvement allows for efficient modeling and analysis of FCG for different materials, geometries, and loading scenarios. The SMART crack growth tool specifically utilizes the pre-meshed approach, calculating the stress intensity factor (SIF) along the crack front, which is essential for failure analysis. In addition, ANSYS includes a suite of advanced features called SMART (Separating, Morphing, and Adaptive Remeshing Technology). This technology offers three key functionalities:
  • The ability to separate and reconstruct complex geometric entities.
  • A morphing function that facilitates the smooth and continuous deformation of these entities.
  • Adaptive remeshing, which refines the mesh for accurate and efficient simulations when deformations are substantial.
ANSYS has achieved a significant reduction in pre-processing time and improved accuracy by employing the unstructured mesh method (UMM) along with automated tetrahedral meshing (rather than hex meshes) for the crack front. This methodology allows for automatic crack front updates during simulations, enhancing the overall efficiency and precision of the SMART analysis as the crack grows. The direction of crack growth is a critical aspect of fatigue fracture mechanics, influencing the integrity and lifespan of materials under cyclic loading. Several theories have been proposed to explain how cracks propagate, each addressing different material behaviors and loading conditions. The maximum circumferential stress (MCS) theory, also known as the maximum tangential stress theory, was employed in the present analysis using ANSYS to predict the direction of crack growth in linear elastic materials under mixed-mode loading conditions. This theory is based on the fundamental assumptions of linear elastic behavior, where plastic deformation is considered negligible, and the stress field near the crack tip can be accurately described by linear elastic fracture mechanics (LEFM). According to the MCS criterion, crack propagation is predicted to occur in the direction where the tensile stress acting perpendicular to the potential crack extension (i.e., the circumferential or hoop stress at the crack tip) reaches its maximum value. ANSYS calculates the crack growth path angle, based on the maximum circumferential stress, using the following formula [45,46]:
θ = cos 1 3 K I I 2 + K I K I 2 + 8 K I I 2 K I 2 + 9 K I I 2
where KI and KII represent the modes of SIFs. The modified Paris law is used to compute the rate of crack growth as follows:
d a d N = C ( Δ K e q ) m
where Δ K e q denotes the equivalent stress intensity factor, and C and m are the coefficient and exponent of Paris’ law, respectively. The equivalent stress intensity factor range can be expressed by the following equation [47]:
Δ K e q = 1 2 cos ( θ / 2 ) Δ K I ( 1 + cos θ ) 3 Δ K I I sin θ
Beyond the maximum circumferential stress theory (MTS), several other models exist for estimating equivalent stress intensity factors and predicting crack growth, and several other sophisticated models are employed for estimating equivalent stress intensity factors and forecasting crack growth. The maximum energy release rate (G-Criterion), rooted in the work of Griffith and Irwin, posits that cracks will propagate in the direction that maximizes the energy released per unit of crack extension [48]. This criterion often aligns with directional predictions of MCS in linear elastic materials. Alternatively, the strain energy density (SED) criterion, developed by Sih [49], proposes that crack propagation occurs where the strain energy density factor is minimized. This approach offers a more generalized framework, capable of accounting for complex stress states and anisotropic material behavior. For materials exhibiting significant plastic deformation, the J-Integral Criterion becomes indispensable, extending the concept of energy release rate to elastic-plastic regimes [50], although determining crack direction in such scenarios can be more intricate. More advanced models may also incorporate factors like T-stress for a more accurate description of the crack tip stress field beyond the singular term [51] or utilize sophisticated computational approaches such as cohesive zone models (CZM), which simulate fracture by defining a traction-separation law across the crack surfaces [52], or phase field models [53], which represent cracks as diffuse interfaces within a continuous medium. Ultimately, the selection of the most appropriate model hinges on the material’s constitutive behavior, the specific loading conditions, and the required level of analytical precision, with experimental validation often serving as a crucial complement.

Mesh Sensitivity Analysis

To optimize element size and enhance result accuracy, a mesh sensitivity analysis was conducted. This involved systematically refining the mesh and monitoring the convergence of key parameters, specifically the equivalent stress intensity factor and predicted fatigue life cycles for a stress ratio of R = 0.1. A comprehensive mesh sensitivity analysis was conducted to ascertain the optimal element size for numerical accuracy for the notched plate with a hole as presented in Table 1. The results indicate that mesh convergence is effectively achieved when the element size is set to 1 mm. At this mesh density, the calculated maximum equivalent stress intensity factor is 1347.121 MPa, and the maximum fatigue life cycles are 33,649. Reducing the element size further to 0.5 mm yielded only marginal variations: the maximum equivalent stress intensity factor shifted to 1350.02 MPa (a change of approximately 0.2%), and the maximum fatigue life cycles became 33,670 (a change of approximately 0.06%). These minimal deviations confirm that the 1 mm element size provides sufficiently converged and reliable results for the analysis. This demonstrated that the chosen mesh density provided results independent of further refinement, ensuring the computational efficiency without compromising accuracy. To enhance the intuitive and comprehensive understanding of the mesh sensitivity analysis, a visual representation is presented in Figure 1.

3. Results and Discussions

3.1. Notched Plate with Hole

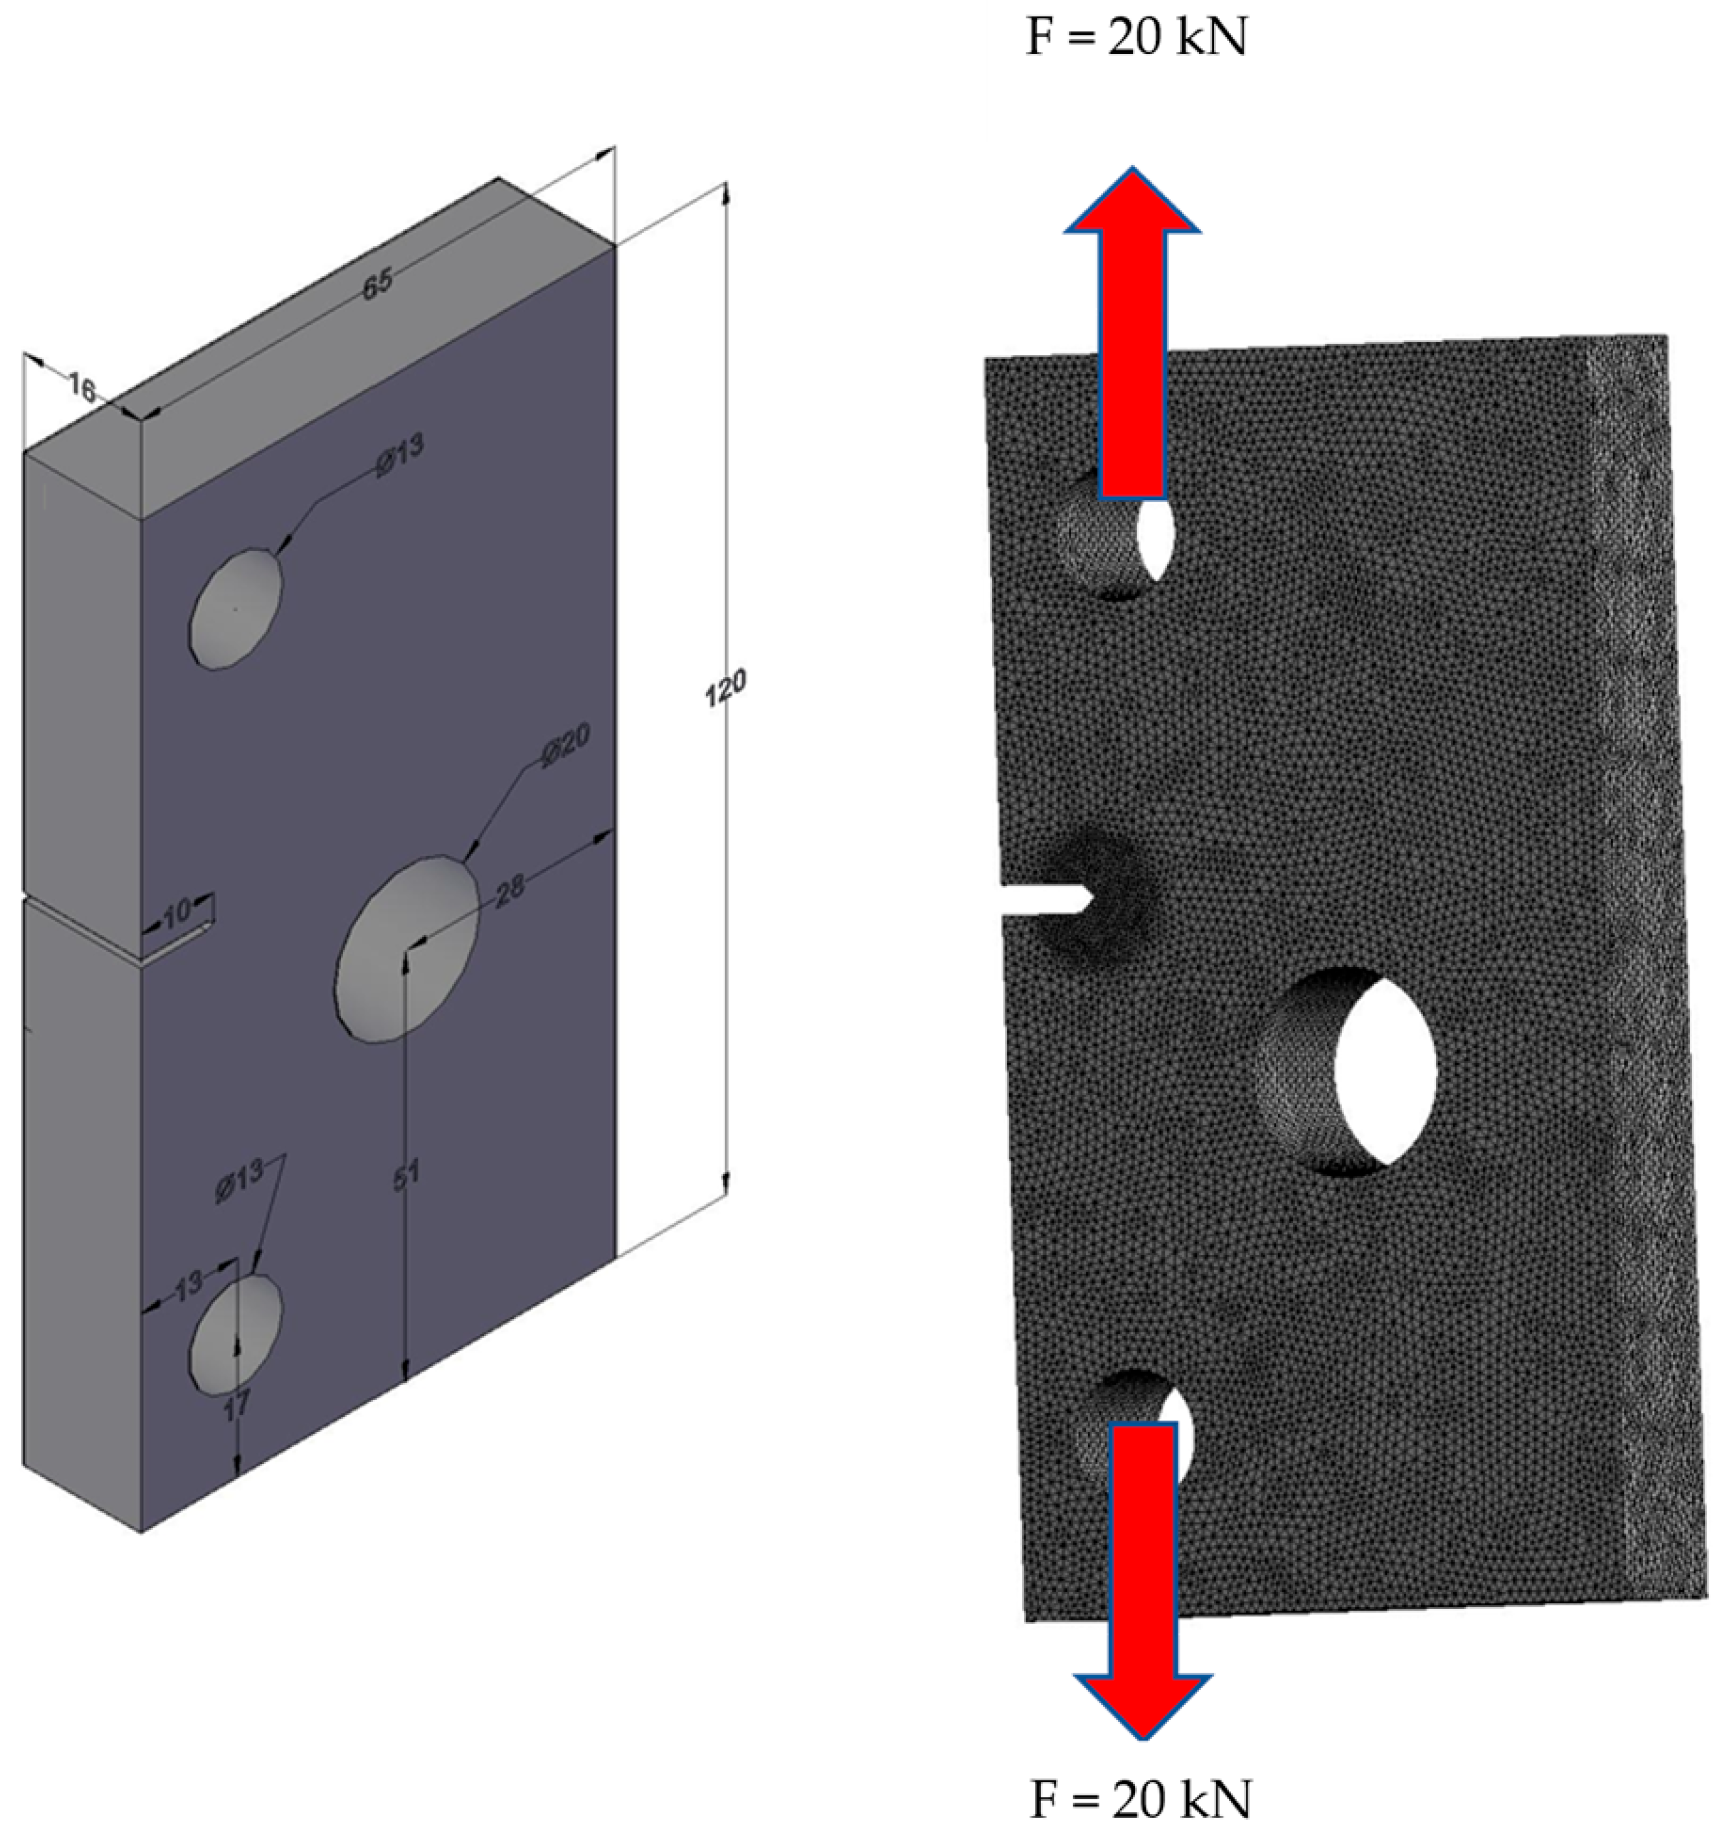
The experimental work of Giner et al. [54], which examined the effect of a hole in a rectangular plate on crack growth, serves as the basis for this example. The geometric configuration and boundary conditions of the plate, made of an aluminum alloy that is a polycrystalline material, with a Young’s modulus of 71.7 GPa and a Poisson’s ratio of 0.33, are illustrated in Figure 2. The initial mesh, shown in Figure 1, was generated by Ansys with a 1 mm element size, resulting in 581,980 nodes and 398,566 elements. In accordance with the original study, the initial crack length is set to 10 mm. The material parameters include a Paris’ law coefficient of 5.27 × 10⁻¹⁰ and a Paris law exponent of 2.947. The upper and lower holes were subjected to a cyclic load of 20 kN, as shown in Figure 1, with a constant amplitude and a load ratio of R = 0.1. Plane strain conditions were maintained throughout the simulation.
It is important to note that while this study focuses on a specific symmetric hole arrangement, this configuration was deliberately chosen to clearly demonstrate the phenomenon of crack deviation towards or away from the hole based on its precise location relative to the crack tip. This controlled setup allowed us to isolate and analyze the impact of the hole on crack propagation without the confounding effects of multiple geometric variations. The insights gained from this foundational investigation lay crucial groundwork for future, more extensive parametric studies involving a wider range of hole and notch geometries.
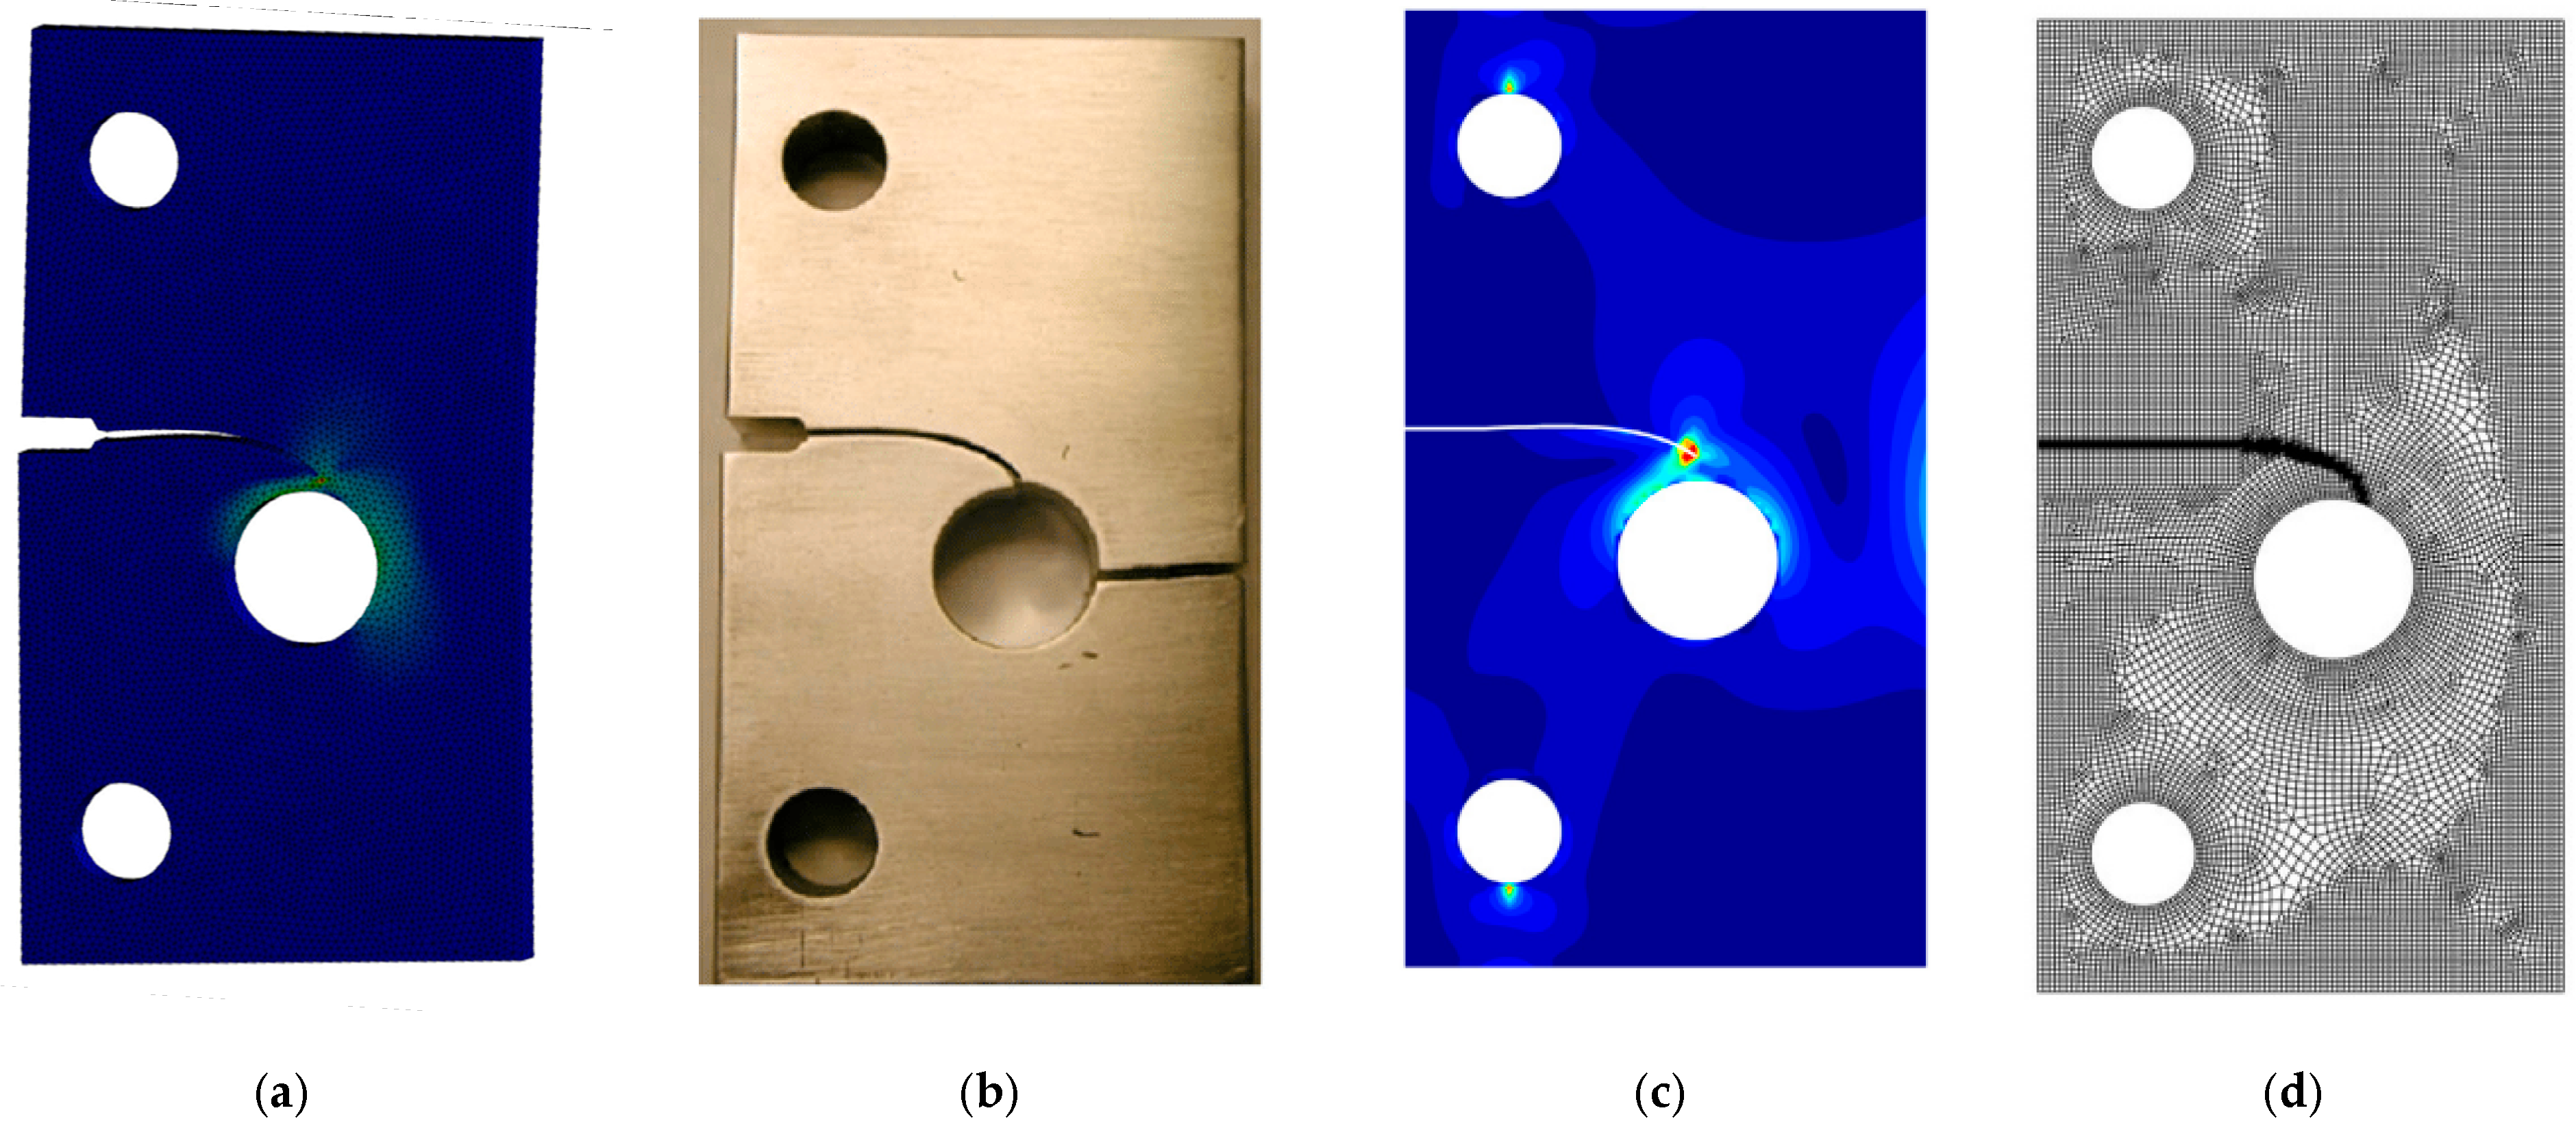
The crack growth path simulated with ANSYS software exhibited remarkable consistency with various sources. It aligned closely with experimental findings from Giner et al. [54] and numerical results from Cheng and Wang [55], who employed XFEM alongside a decomposed updating reanalysis method. Additionally, it corresponded well with the numerical outcomes from Jafari et al. [56], who employed COMSOL software with an enhancement strategy compatible with its framework. This comparison is depicted in Figure 3a–d.
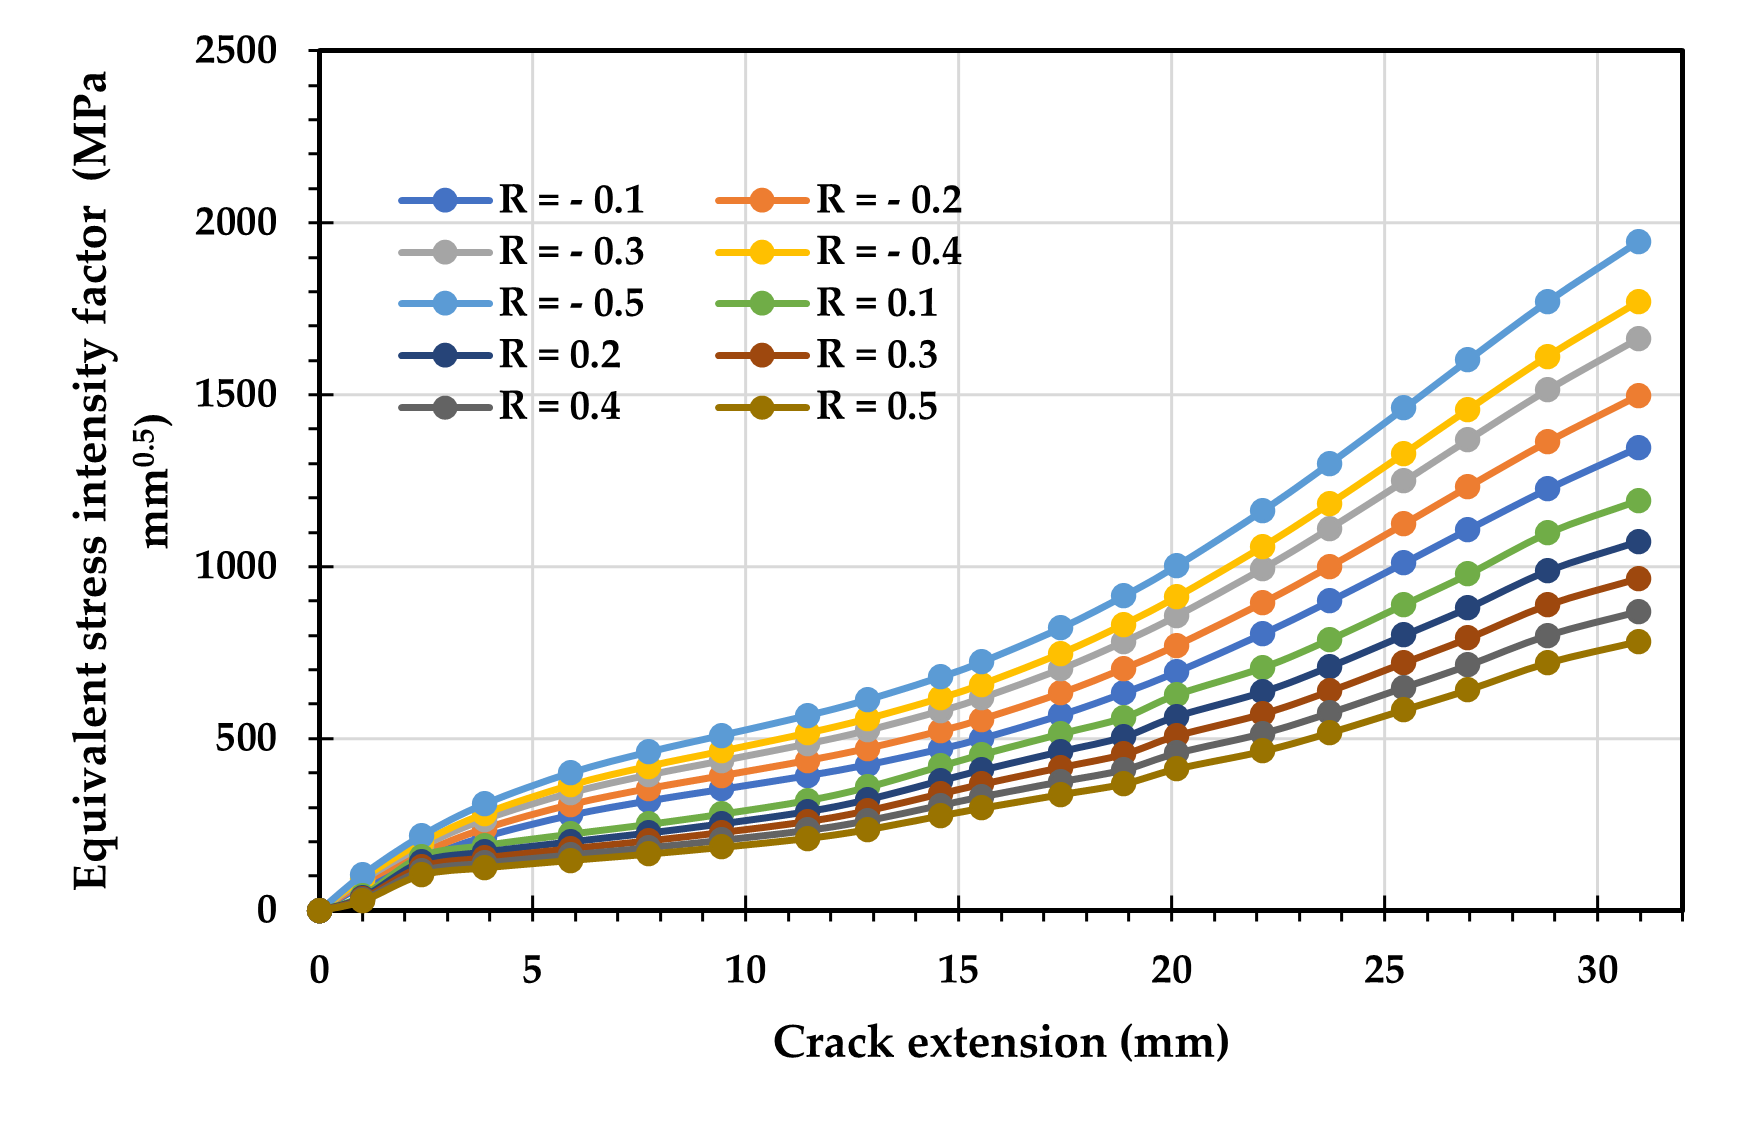
The equivalent stress intensity factor, as defined in Equation (6), was numerically calculated using ANSYS for a notched plate with a hole across a range of stress ratios, both positive and negative (R = −0.1 to −0.5 and R = 0.1 to 0.5). This analysis is depicted in Figure 4, which presents data from ten simulations. The results presented in this figure offer valuable insights into how stress ratios relate to the equivalent stress intensity factor during fatigue crack growth (FCG). Specifically, the finding reveals a significant inverse relationship between the equivalent stress intensity factor and stress ratio, alongside a previously uncharacterized inverse correlation between stress ratio and von Mises stress. This inverse correlation, while algebraically linked to the definition of R, is critically influenced by underlying fracture mechanics phenomena, particularly crack closure mechanisms. This study quantitatively demonstrates how higher R-values, by influencing the effective stress range at the crack tip and potentially reducing crack closure effects, lead to a more effective stress intensity factor range that is lower than the nominally applied ΔK, consequently prolonging fatigue life. For negative stress ratios, the presence of compressive stresses further complicates crack closure behavior, and this study provides novel insights into how these complex stress states influence the effective stress intensity factor range and fatigue life.
While the algebraic definition of the stress ratio (R = σminmax) inherently implies a relationship with the stress intensity factor range, these findings highlight a more profound influence driven by fracture mechanics principles, particularly crack closure. Crack closure occurs when the crack faces come into contact during the unloading portion of a fatigue cycle, effectively reducing the stress intensity factor range experienced at the crack tip. At higher R-values, the crack tends to remain open for a larger portion of the loading cycle, or the degree of crack closure is diminished. This leads to a more effective stress intensity factor range that is lower than the nominally applied ΔK, consequently prolonging fatigue life. The findings provide numerical evidence supporting this phenomenon, demonstrating how the interplay between the applied stress ratio and crack closure mechanisms contributes to the observed non-linear increase in fatigue resistance. For negative stress ratios, the presence of compressive stresses further complicates crack closure behavior, and the present study provides novel insights into how these complex stress states influence the effective stress intensity factor range and fatigue life.
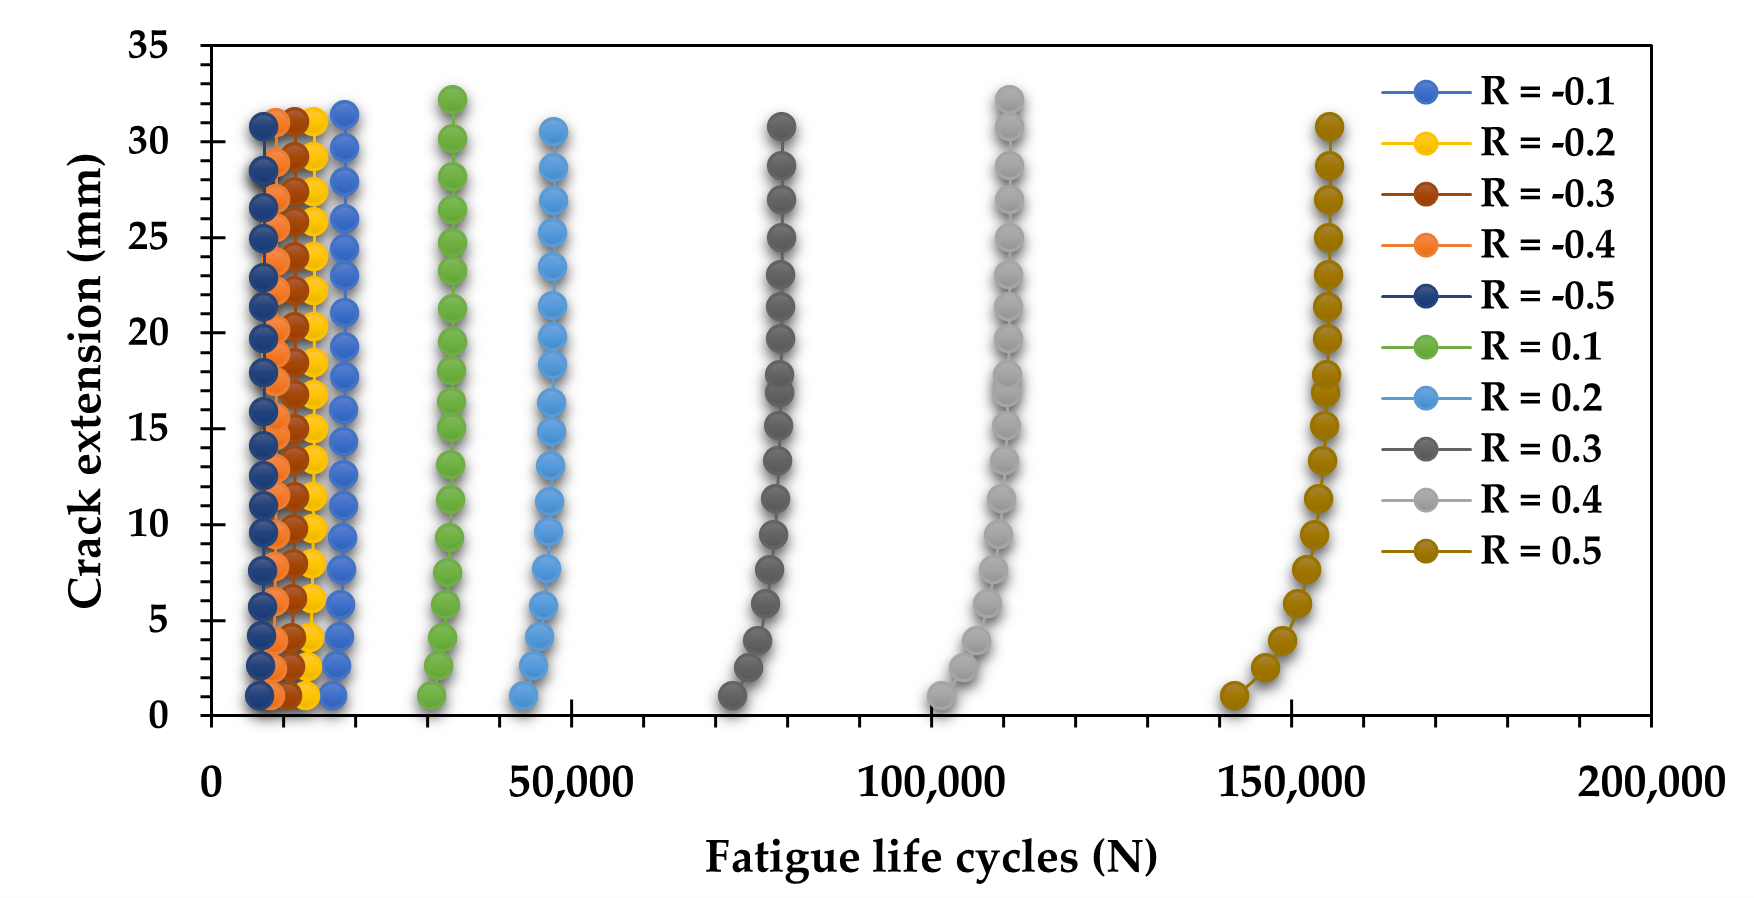
This trend suggests that crack propagation requires less energy at higher stress ratios compared to lower ones. Understanding this relationship is crucial for predicting the fatigue life of materials under cyclic loading, which allows engineers to refine design strategies and enhance the reliability and safety of structural components. Such insights can significantly influence maintenance schedules and material selection in engineering applications. Stress ratios play a critical role in the study of FCG, not only due to their influence on the equivalent stress intensity factor but also because they impact the overall fatigue life of mechanical components. Stress ratios significantly influence a component’s fatigue life by altering the intensity and orientation of the cyclic stress it endures. The fatigue life curves in relation to crack length for various stress ratios are depicted in Figure 5. It is clear that a reduction in the stress ratio leads to a corresponding decrease in the number of cycles to failure. As shown in this figure, a lower stress ratio can decrease the number of cycles to failure, reducing the fatigue life of a component, while a higher stress ratio can increase the fatigue life cycles by reducing the overall load experienced by the material during each cycle. In scenarios with a positive stress ratio, the lowest stress during each cycle remains above zero, resulting in a net tensile load on the material. This condition often leads to an increased likelihood of crack initiation and propagation due to the tensile stresses promoting crack growth. Conversely, a negative stress ratio indicates that the minimum stress falls below zero, leading to a net compressive load acting on the material throughout each cycle. While compressive loads can help close cracks and potentially extend fatigue life, they may also introduce other failure modes, such as buckling or yielding, particularly in brittle materials.
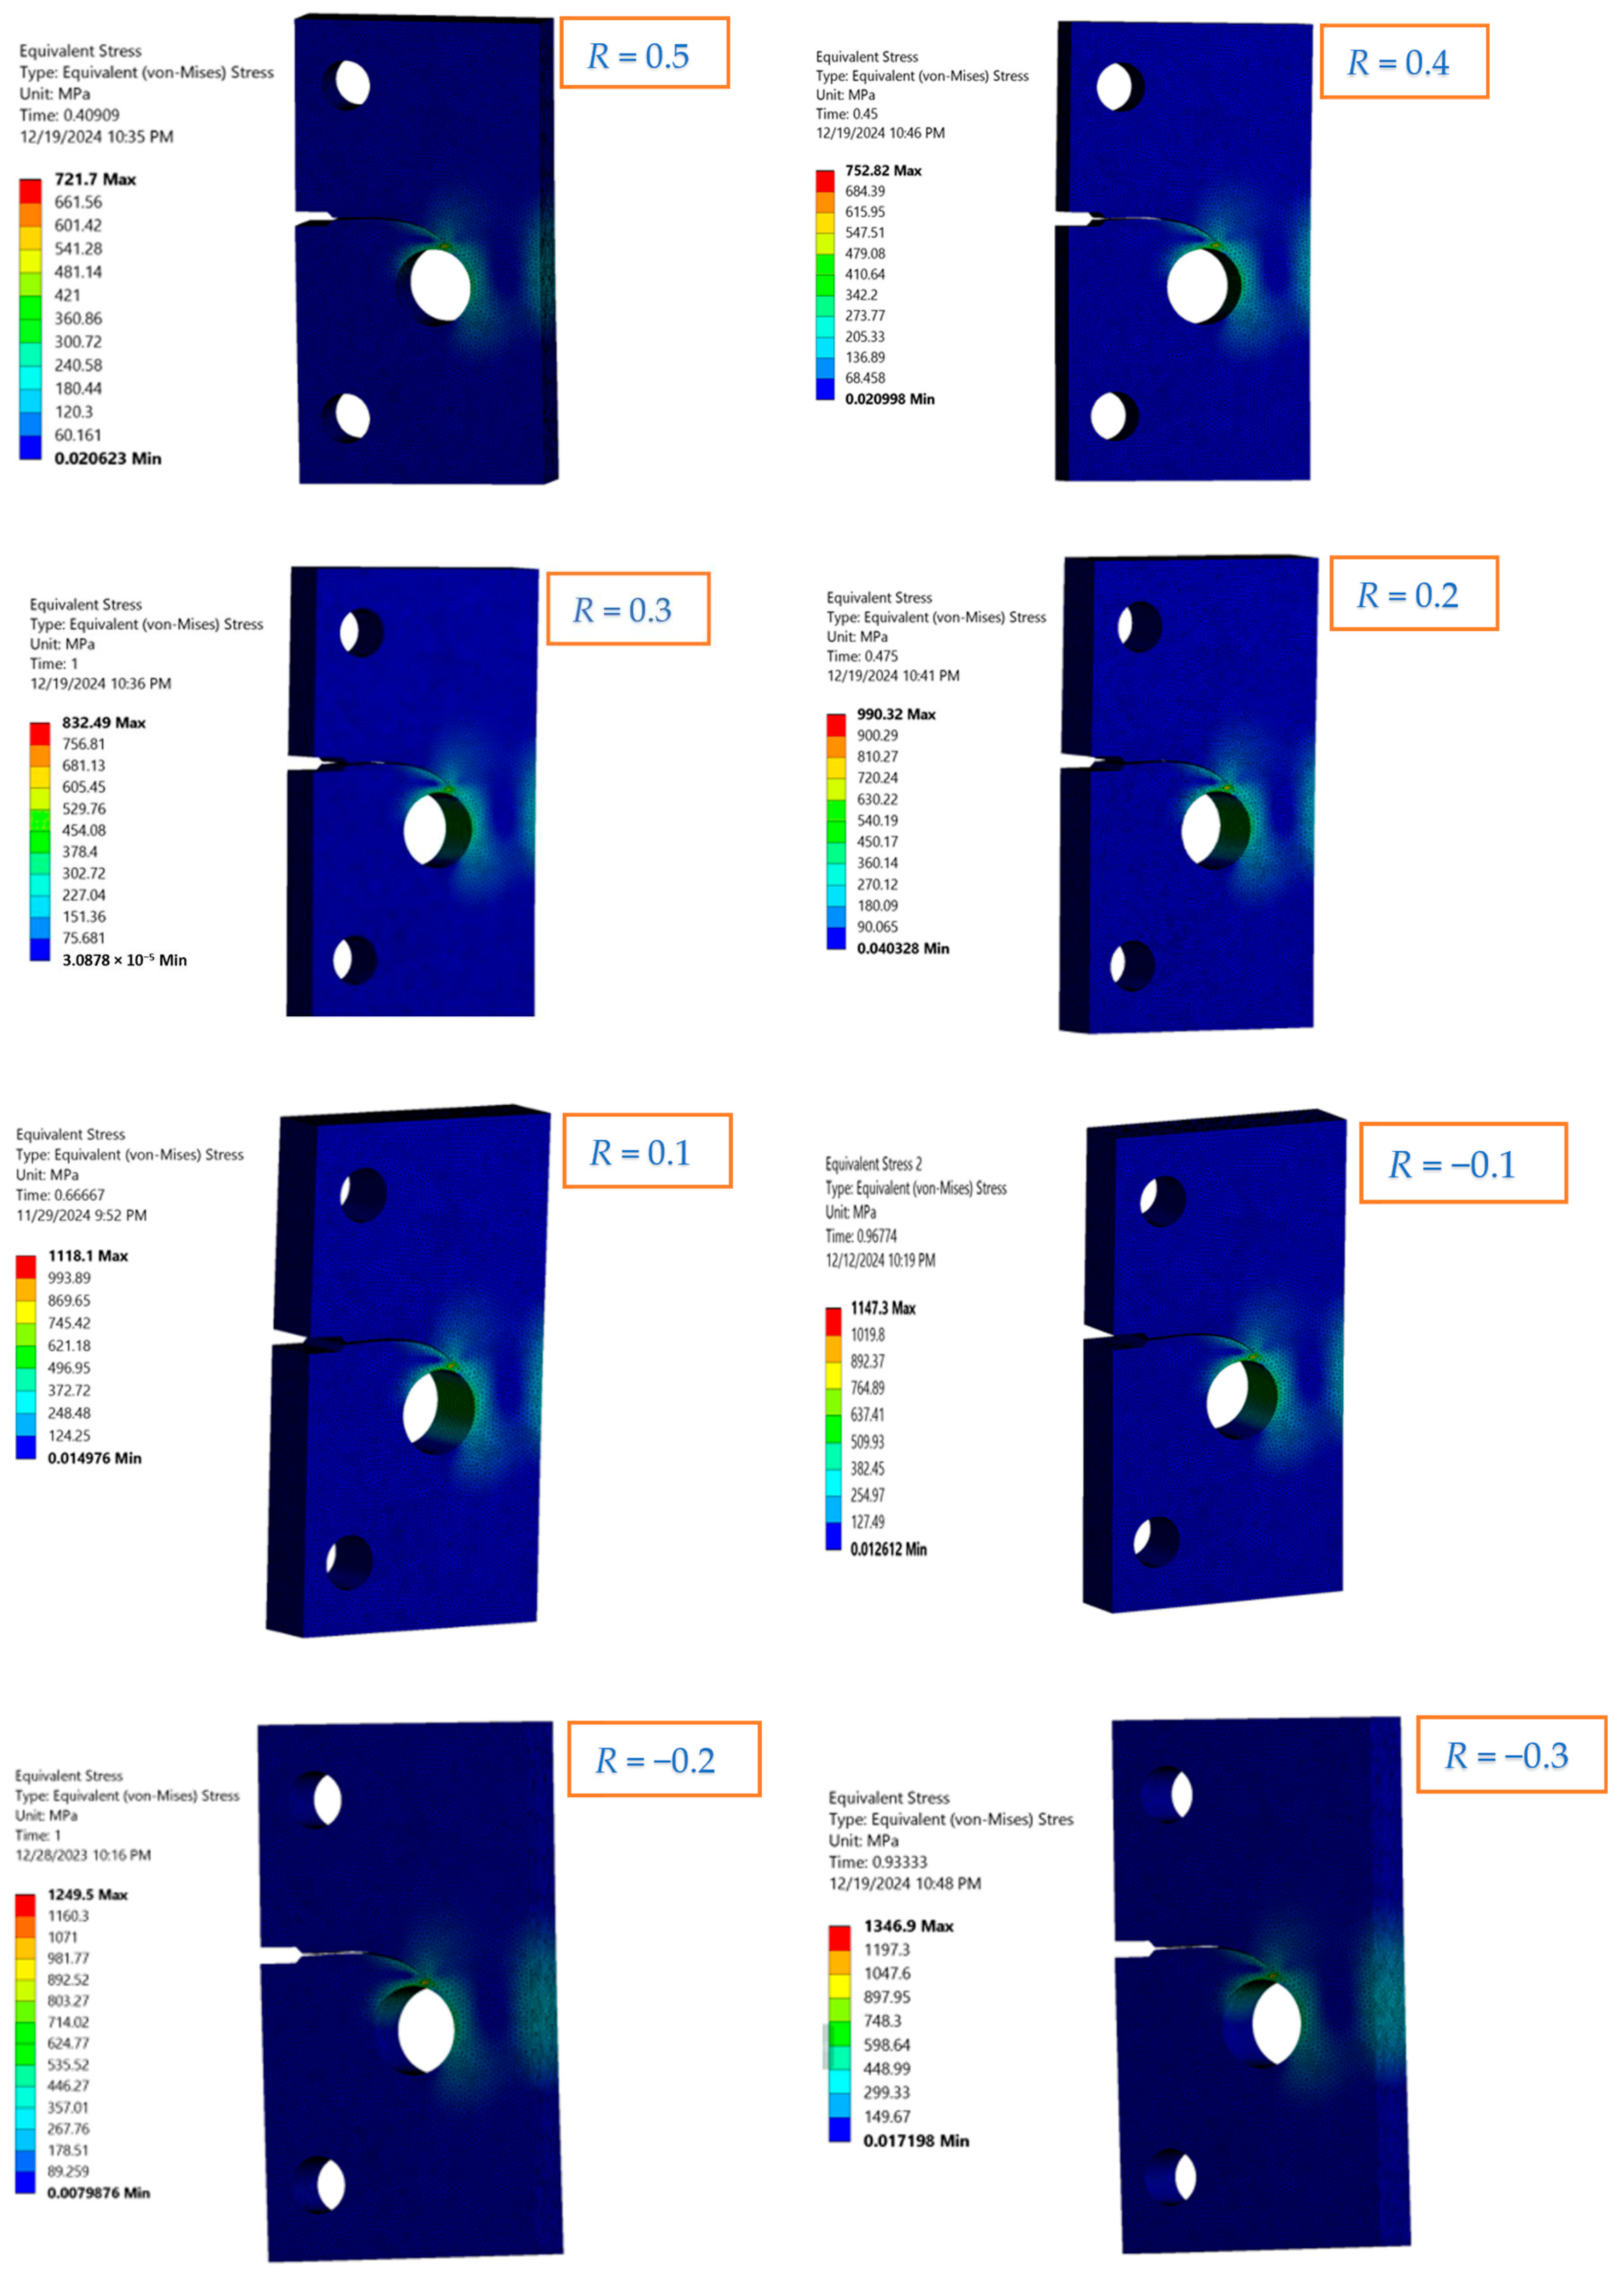
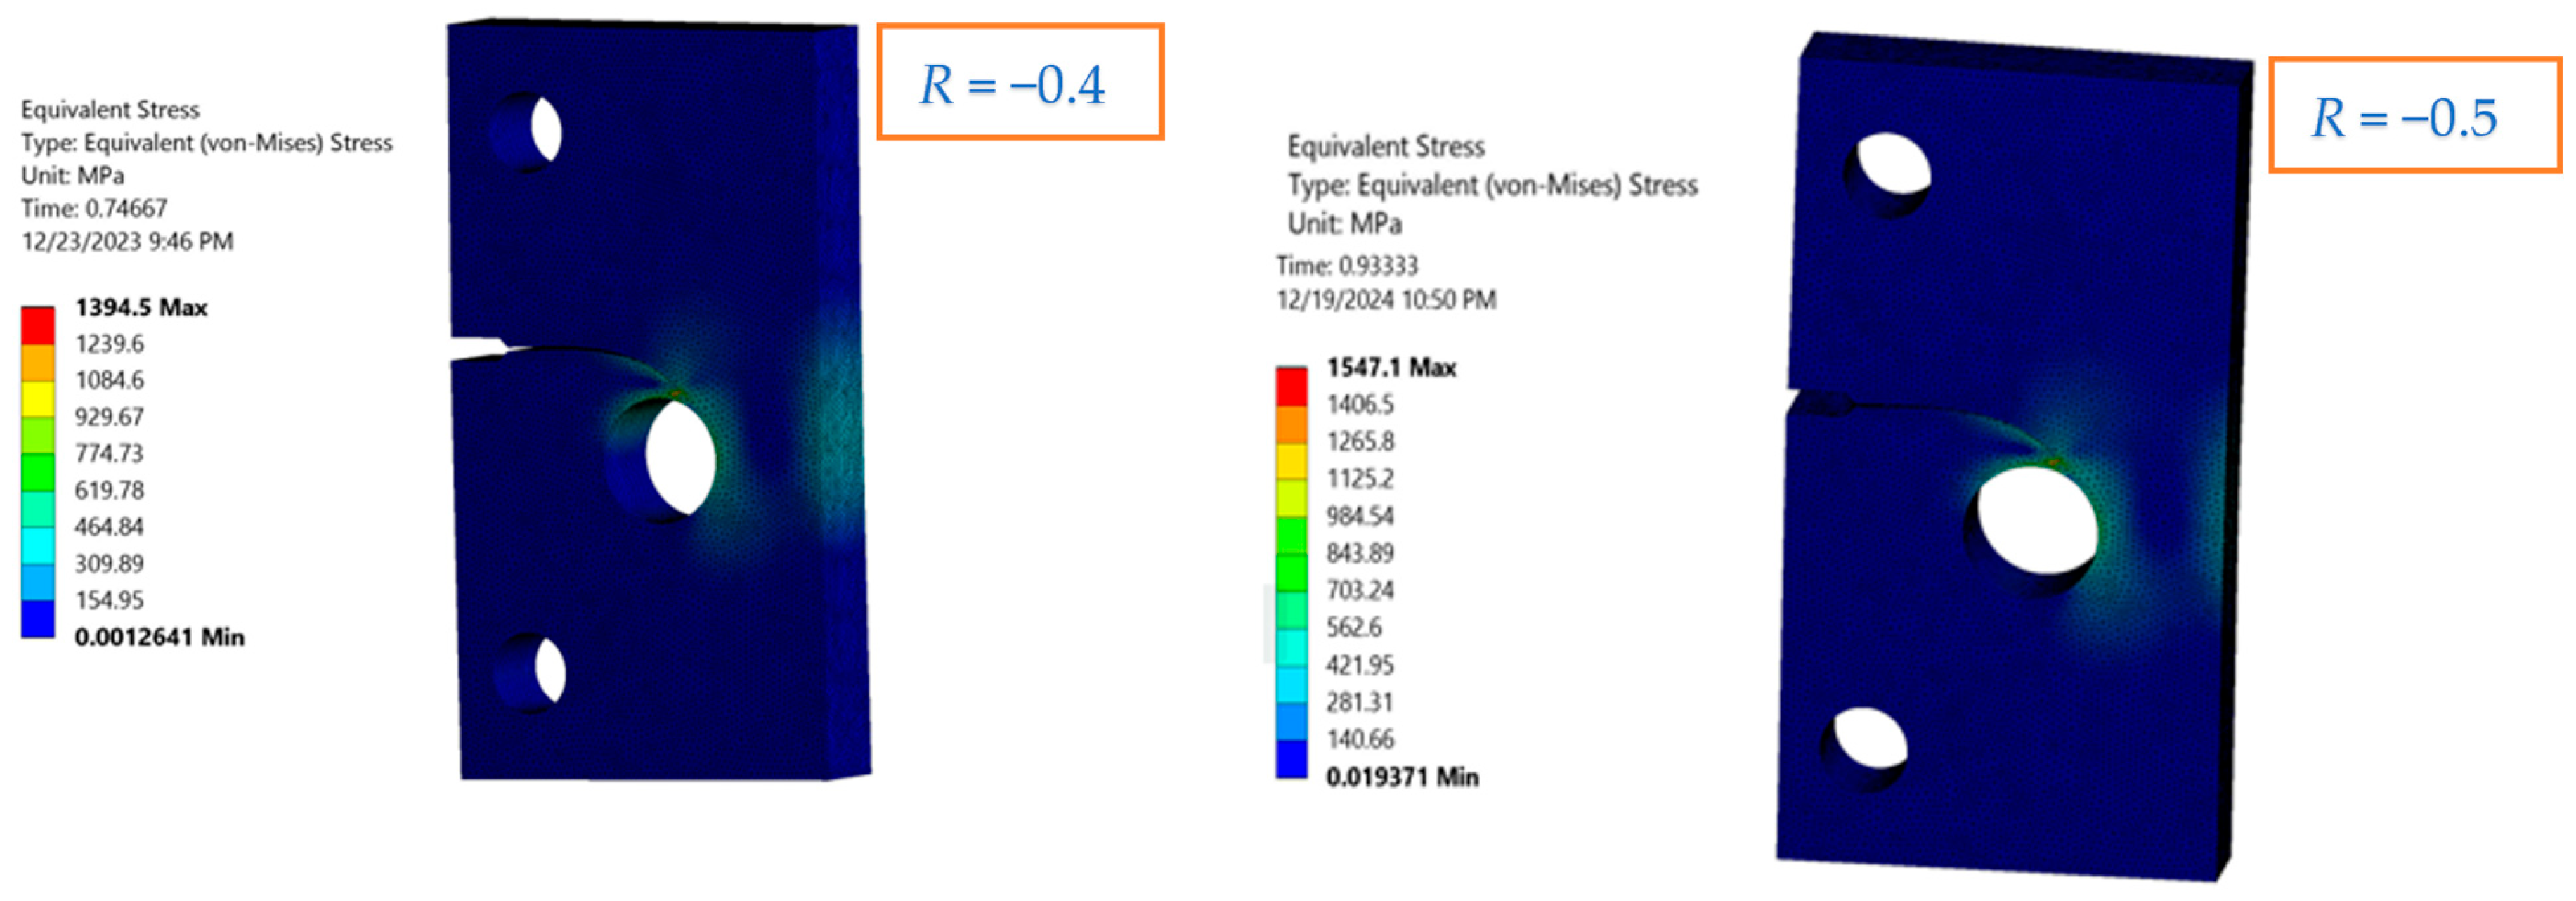
The von Mises stress, which quantifies the three-dimensional stress intensity within a material, can be significantly influenced by the applied stress ratio. When the stress ratio is higher, the material experiences reduced overall loading during each cycle, which typically manifests as a lower von Mises stress. This decrease in von Mises stress can then contribute to an increase in the material’s fatigue life, as there is less cumulative damage accumulation over the progress of the cyclic loading. Conversely, a lower stress ratio tends to result in higher von Mises stresses within the material. This elevated stress state can promote the initiation and propagation of fatigue cracks, ultimately leading to a reduction in the overall fatigue life of the component. The relationship between the stress ratio and the von Mises stress, as depicted in Figure 6, shows that a decrease in stress ratio corresponds to an increase in von Mises stress. This inverse relationship indicates that a lower stress ratio can lead to reduced stress levels in the material. As the plastic zone’s size increases, there is a corresponding increase in von Mises stresses, which may contribute to a reduction in the components’ life due to the negative impact on fatigue performance.

3.2. Cracked Rectangular Plate with Two Holes

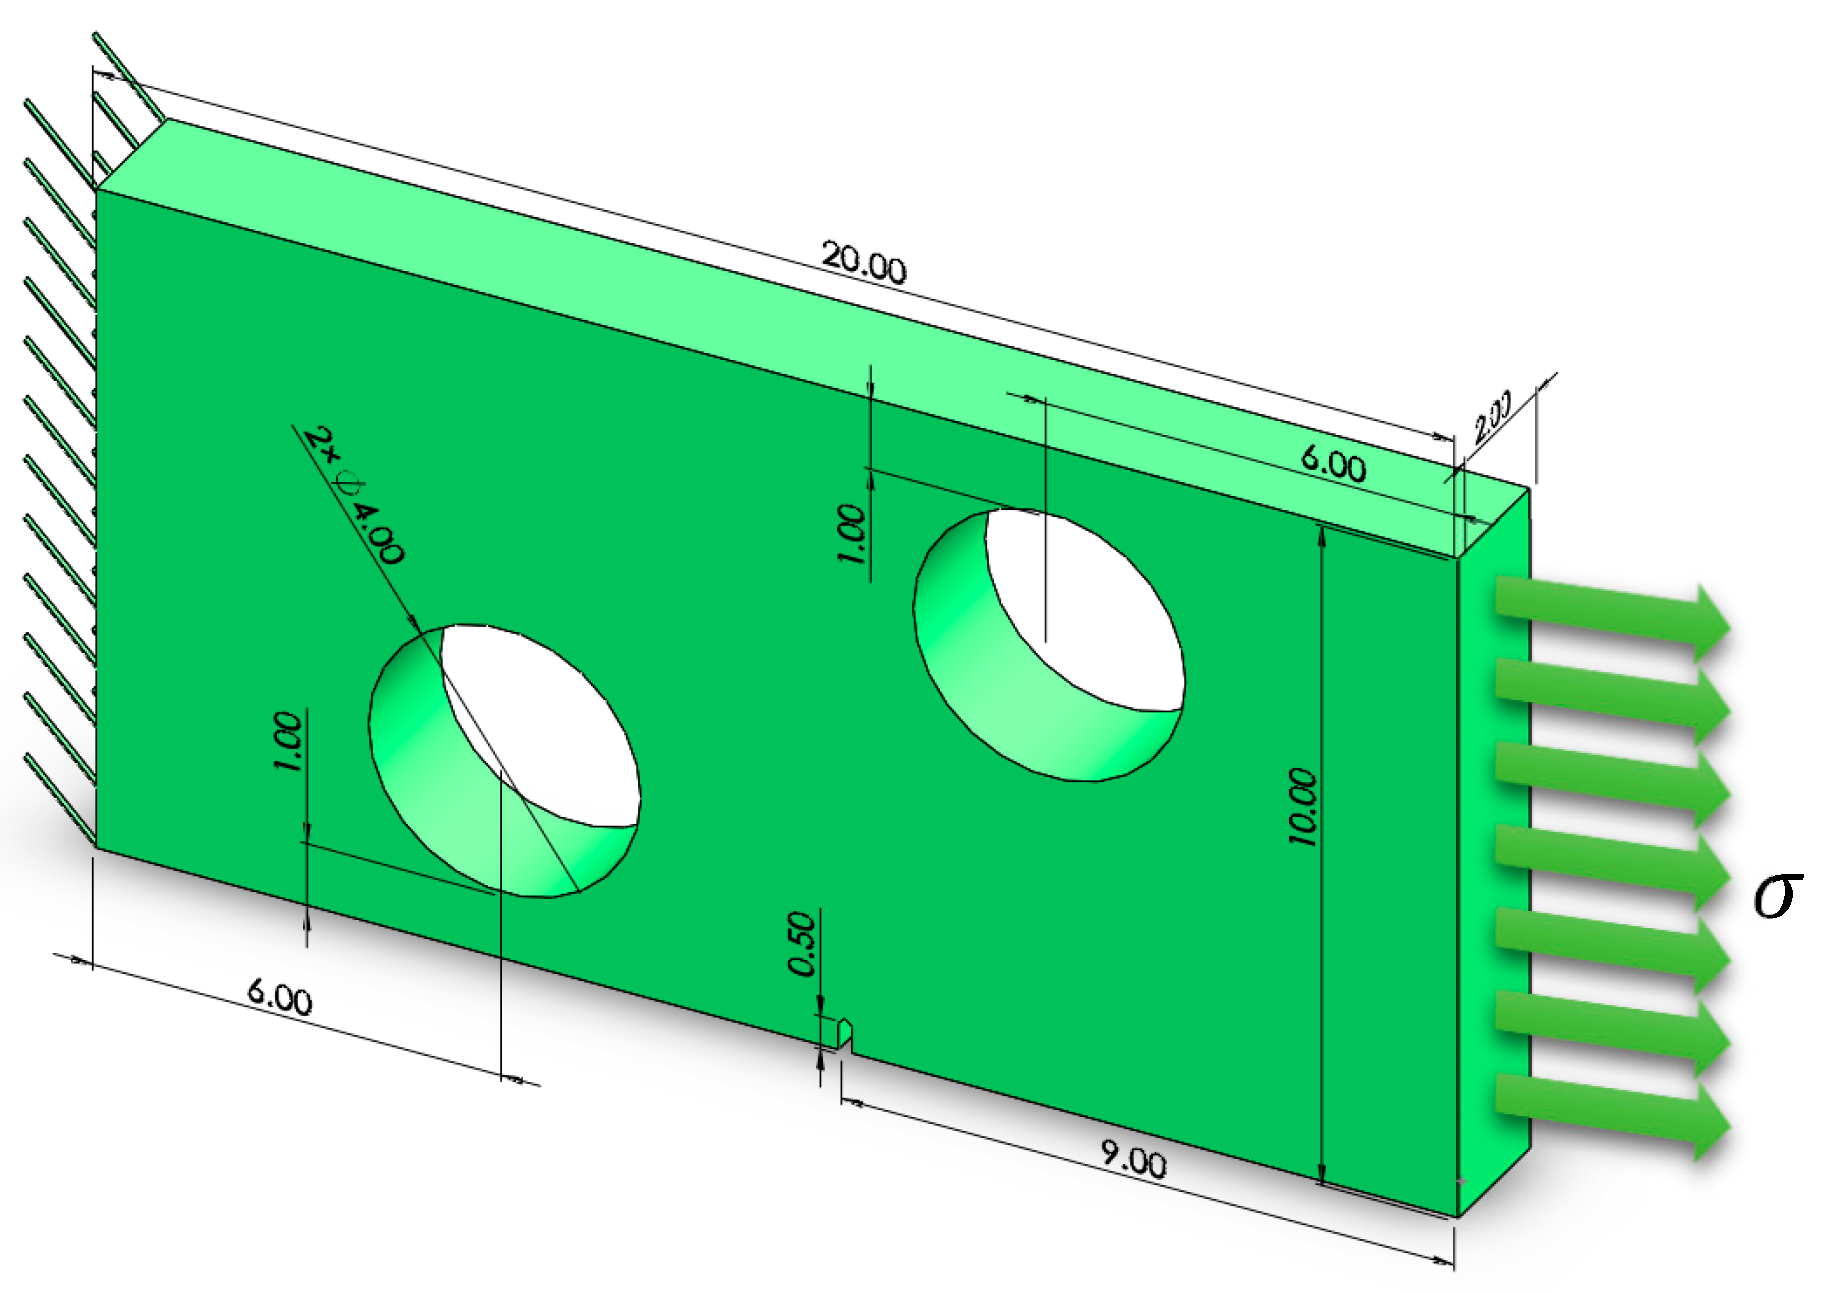
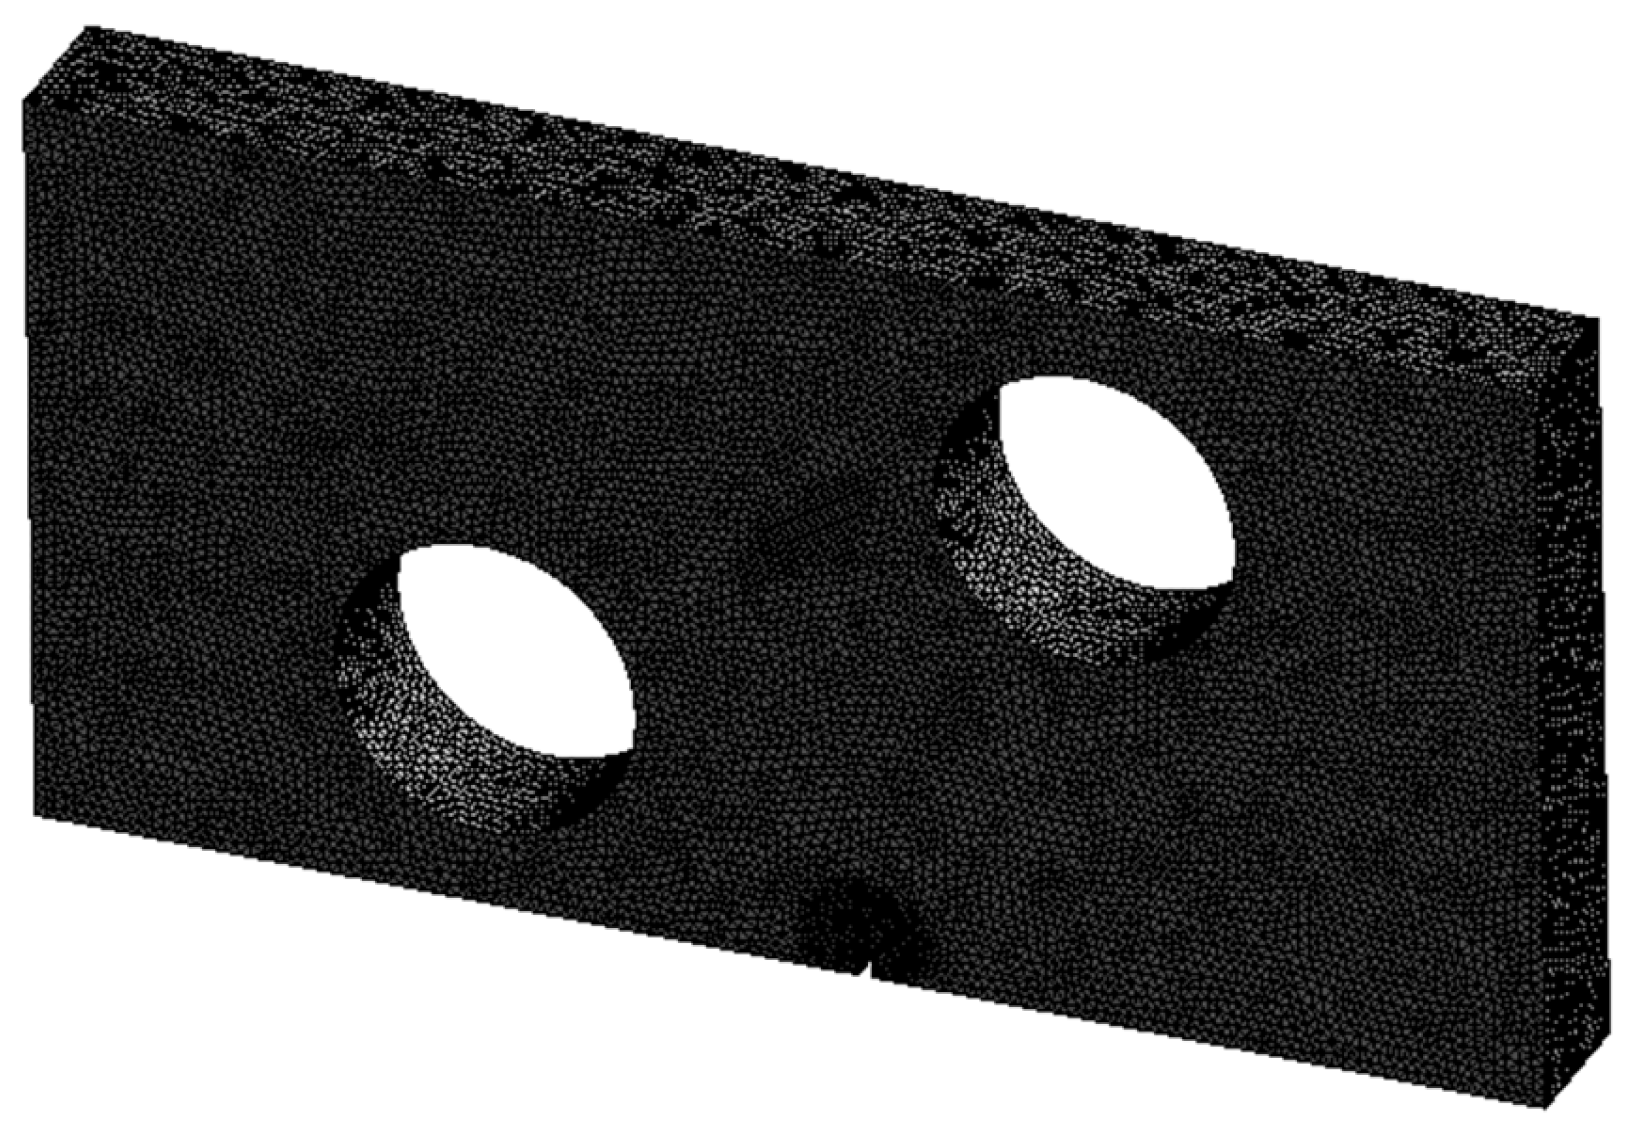
A rectangular plate, measuring 20 cm × 10 cm × 2 cm, is considered in this problem. As illustrated in Figure 7, the plate contains two holes, each with a 4 cm diameter, and a central crack originating from the bottom with an initial length of 0.5 cm. The plate is fixed on its left side, and a stress of 69 MPa is applied to the right edge. The plate is made of an aluminum alloy, a polycrystalline material. The material properties are as follows: E = 69   G P a , v = 0.25   , and σ y = 250   M P a . The initial mesh generated for this geometry, comprising 404,729 elements and 592,270 nodes, is shown in Figure 8.
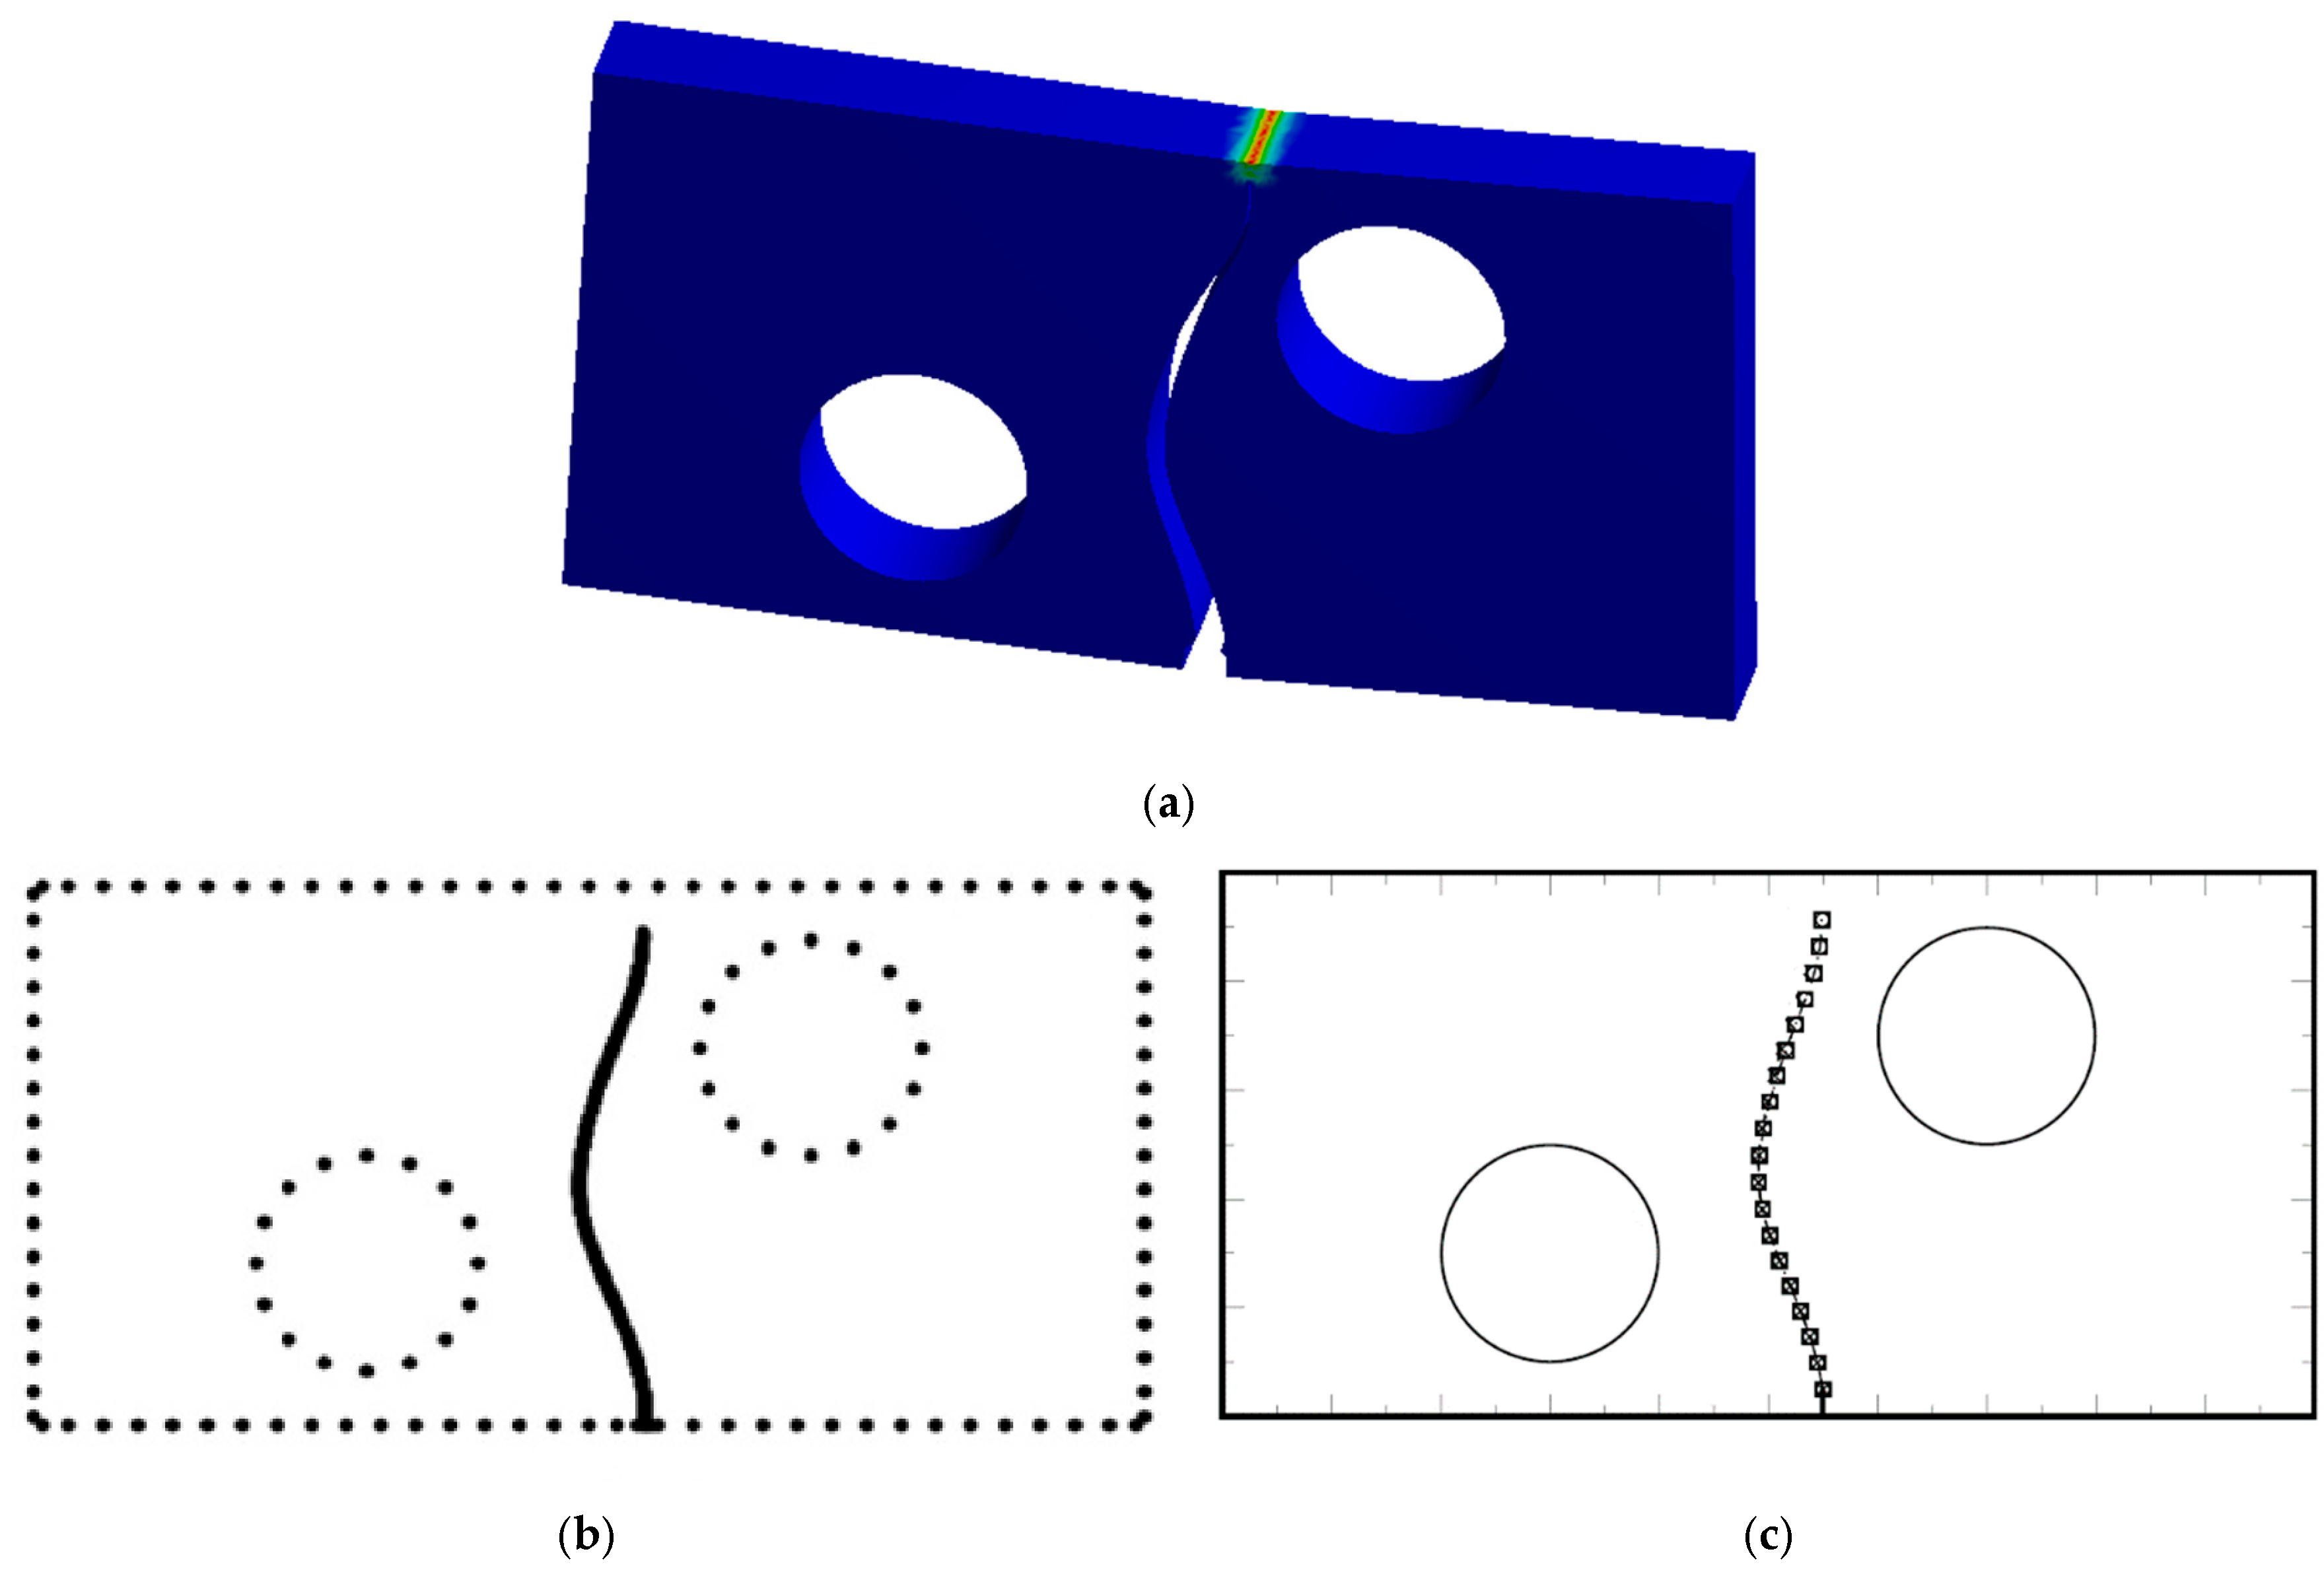
The predicted crack propagation trajectory in the present study is compared in Figure 9 with numerical results from the Franc2D/L finite element program by Cordeiro and Leonel [57] and the numerical results from Rosa et al. [58] using a domain decomposition technique with isogeometric finite element. Initially, the crack growth trajectory is mainly controlled by the first mode of stress intensity factors, leading to linear propagation. Subsequently, the presence of a lower hole caused a slight deviation in the crack propagation trajectory due to the hole’s proximity. However, the crack–hole distance was insufficient to attract the crack and cause it to enter the hole. As a result, the crack bypassed the hole and continued to propagate in a straight line. In the following stage, the crack was influenced by the presence of an upper hole, resulting in a minor deflection towards it. Nevertheless, similar to the previous situation, the crack–hole distance was not close enough to alter the crack’s path into the hole. Consequently, the crack also bypassed the upper hole and maintained its straight propagation trajectory.
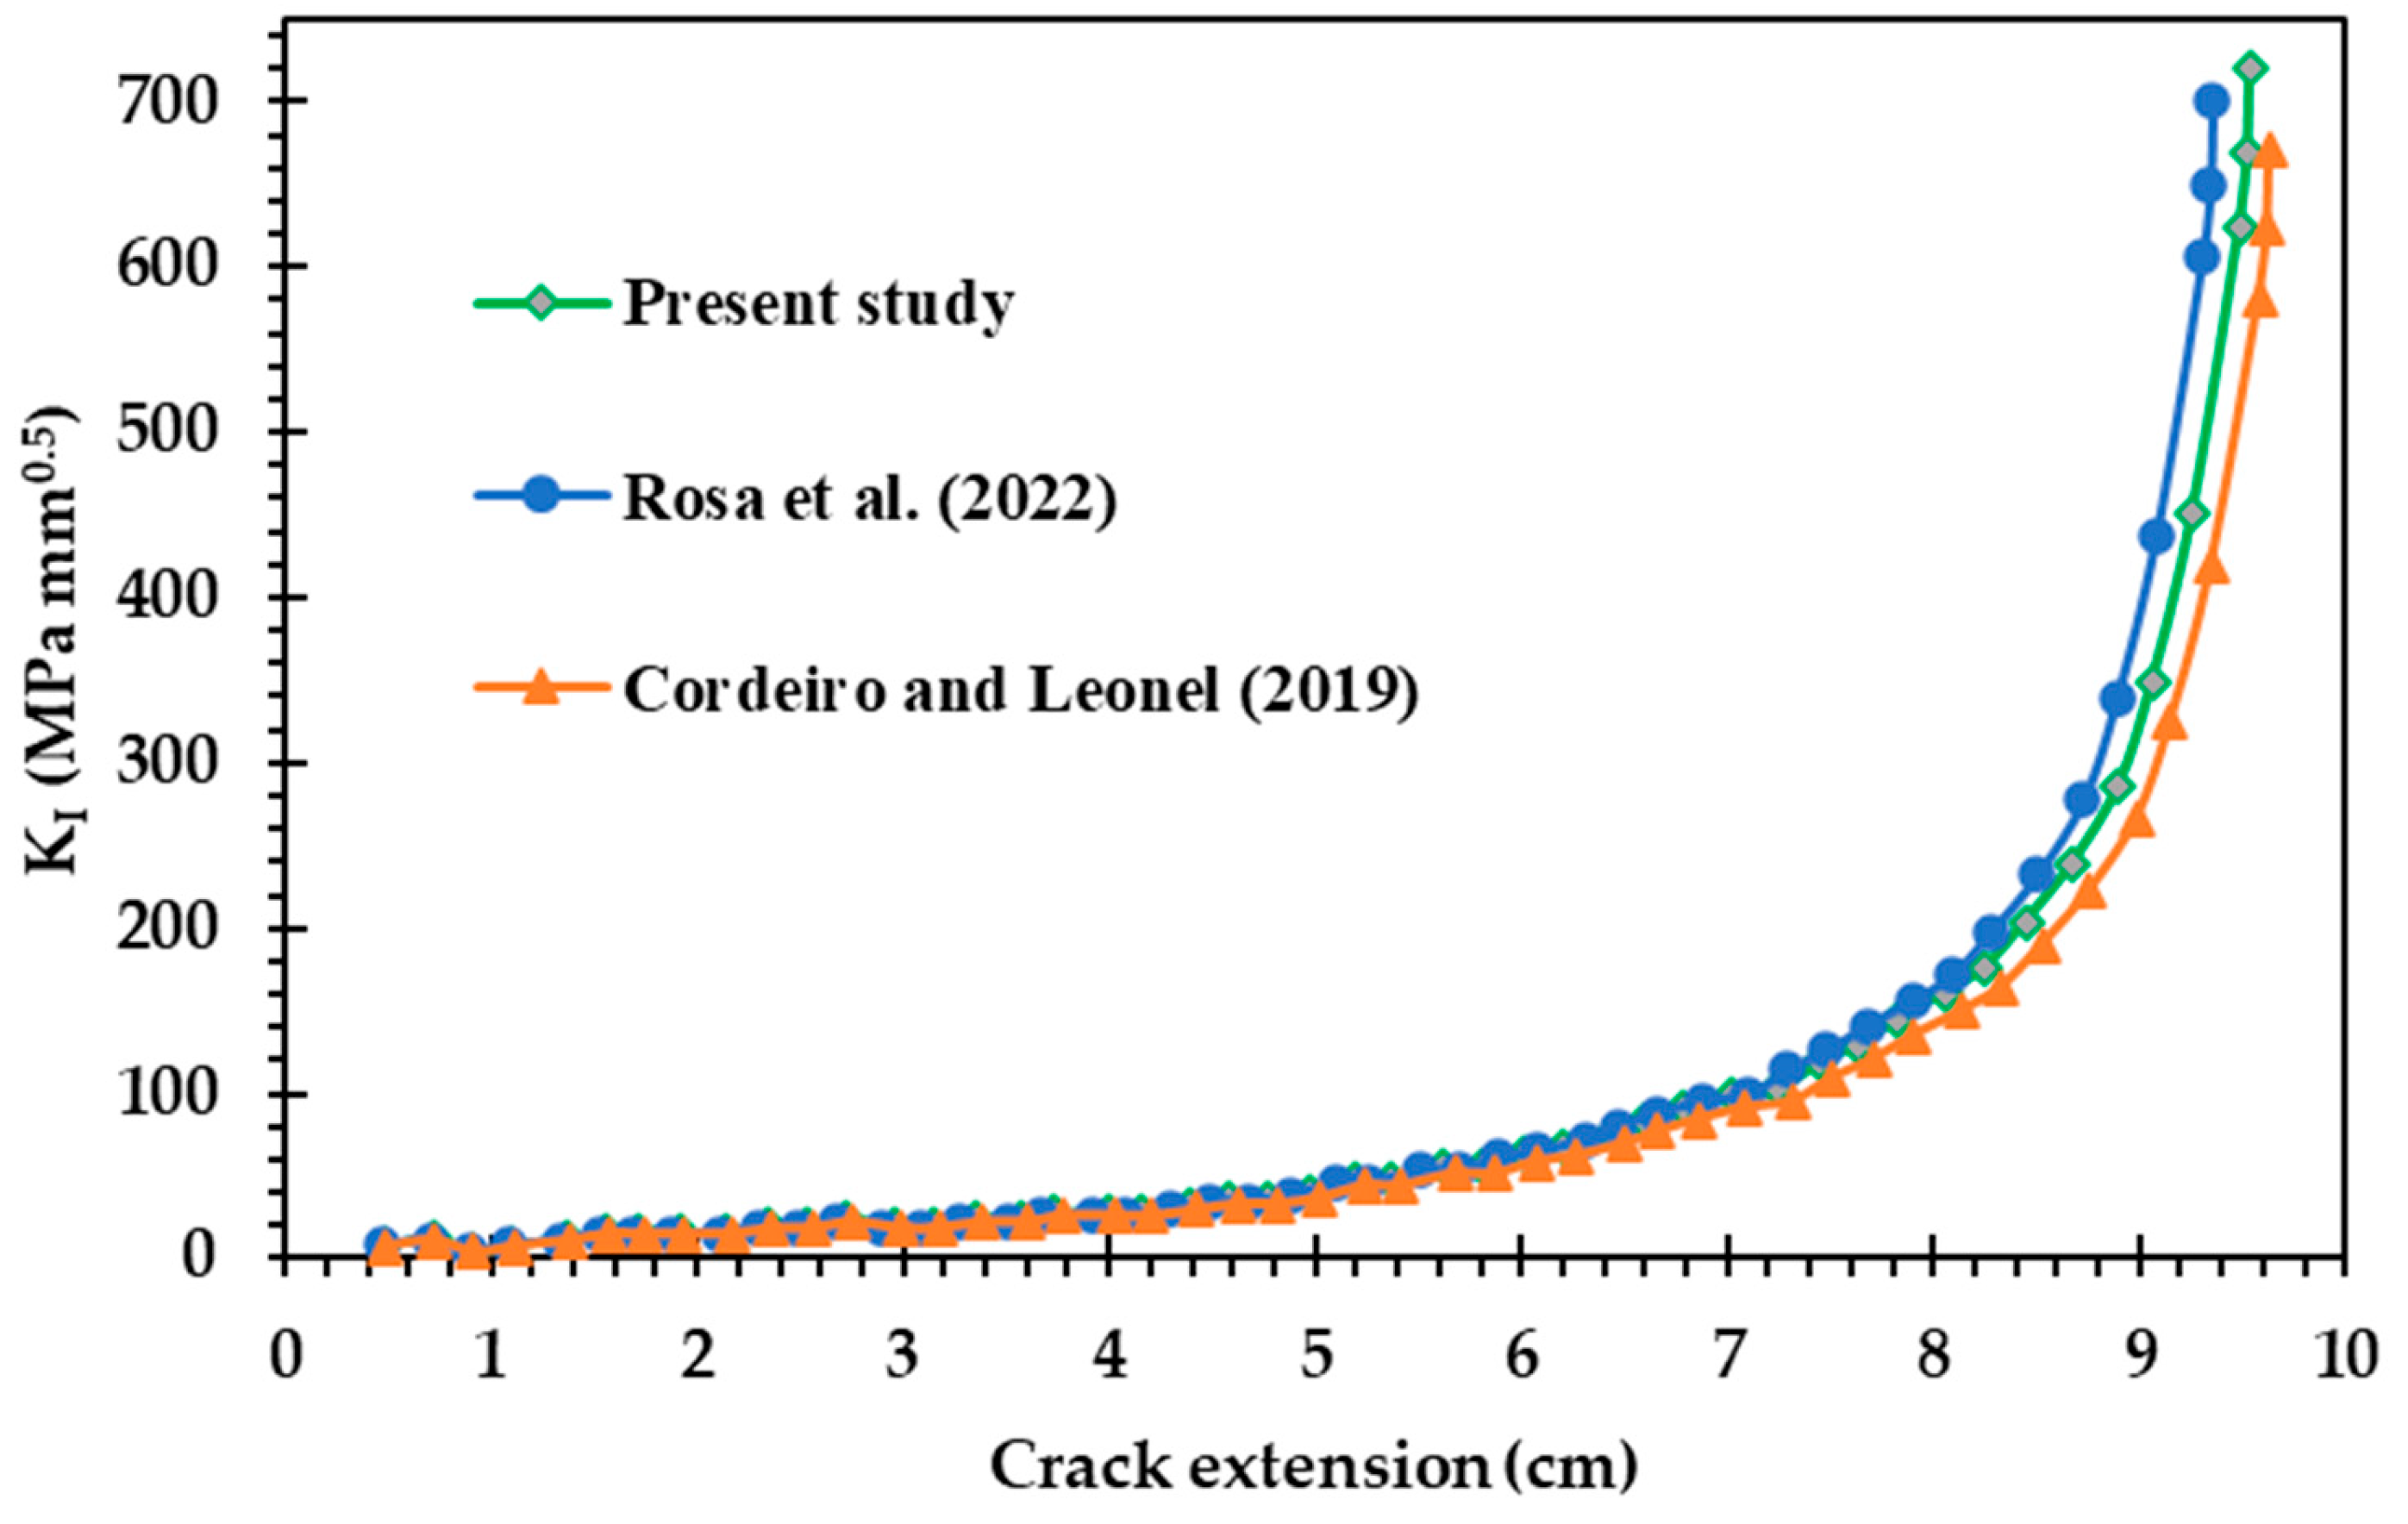
Figure 10 compares the obtained results of the first-mode stress intensity factors with those from two different methods: the dual boundary element method (DBEM) by Cordeiro and Leonel [57] and the domain decomposition technique with isogeometric finite elements by Rosa et al. [58]. This comparison assesses the agreement and consistency between the various approaches.
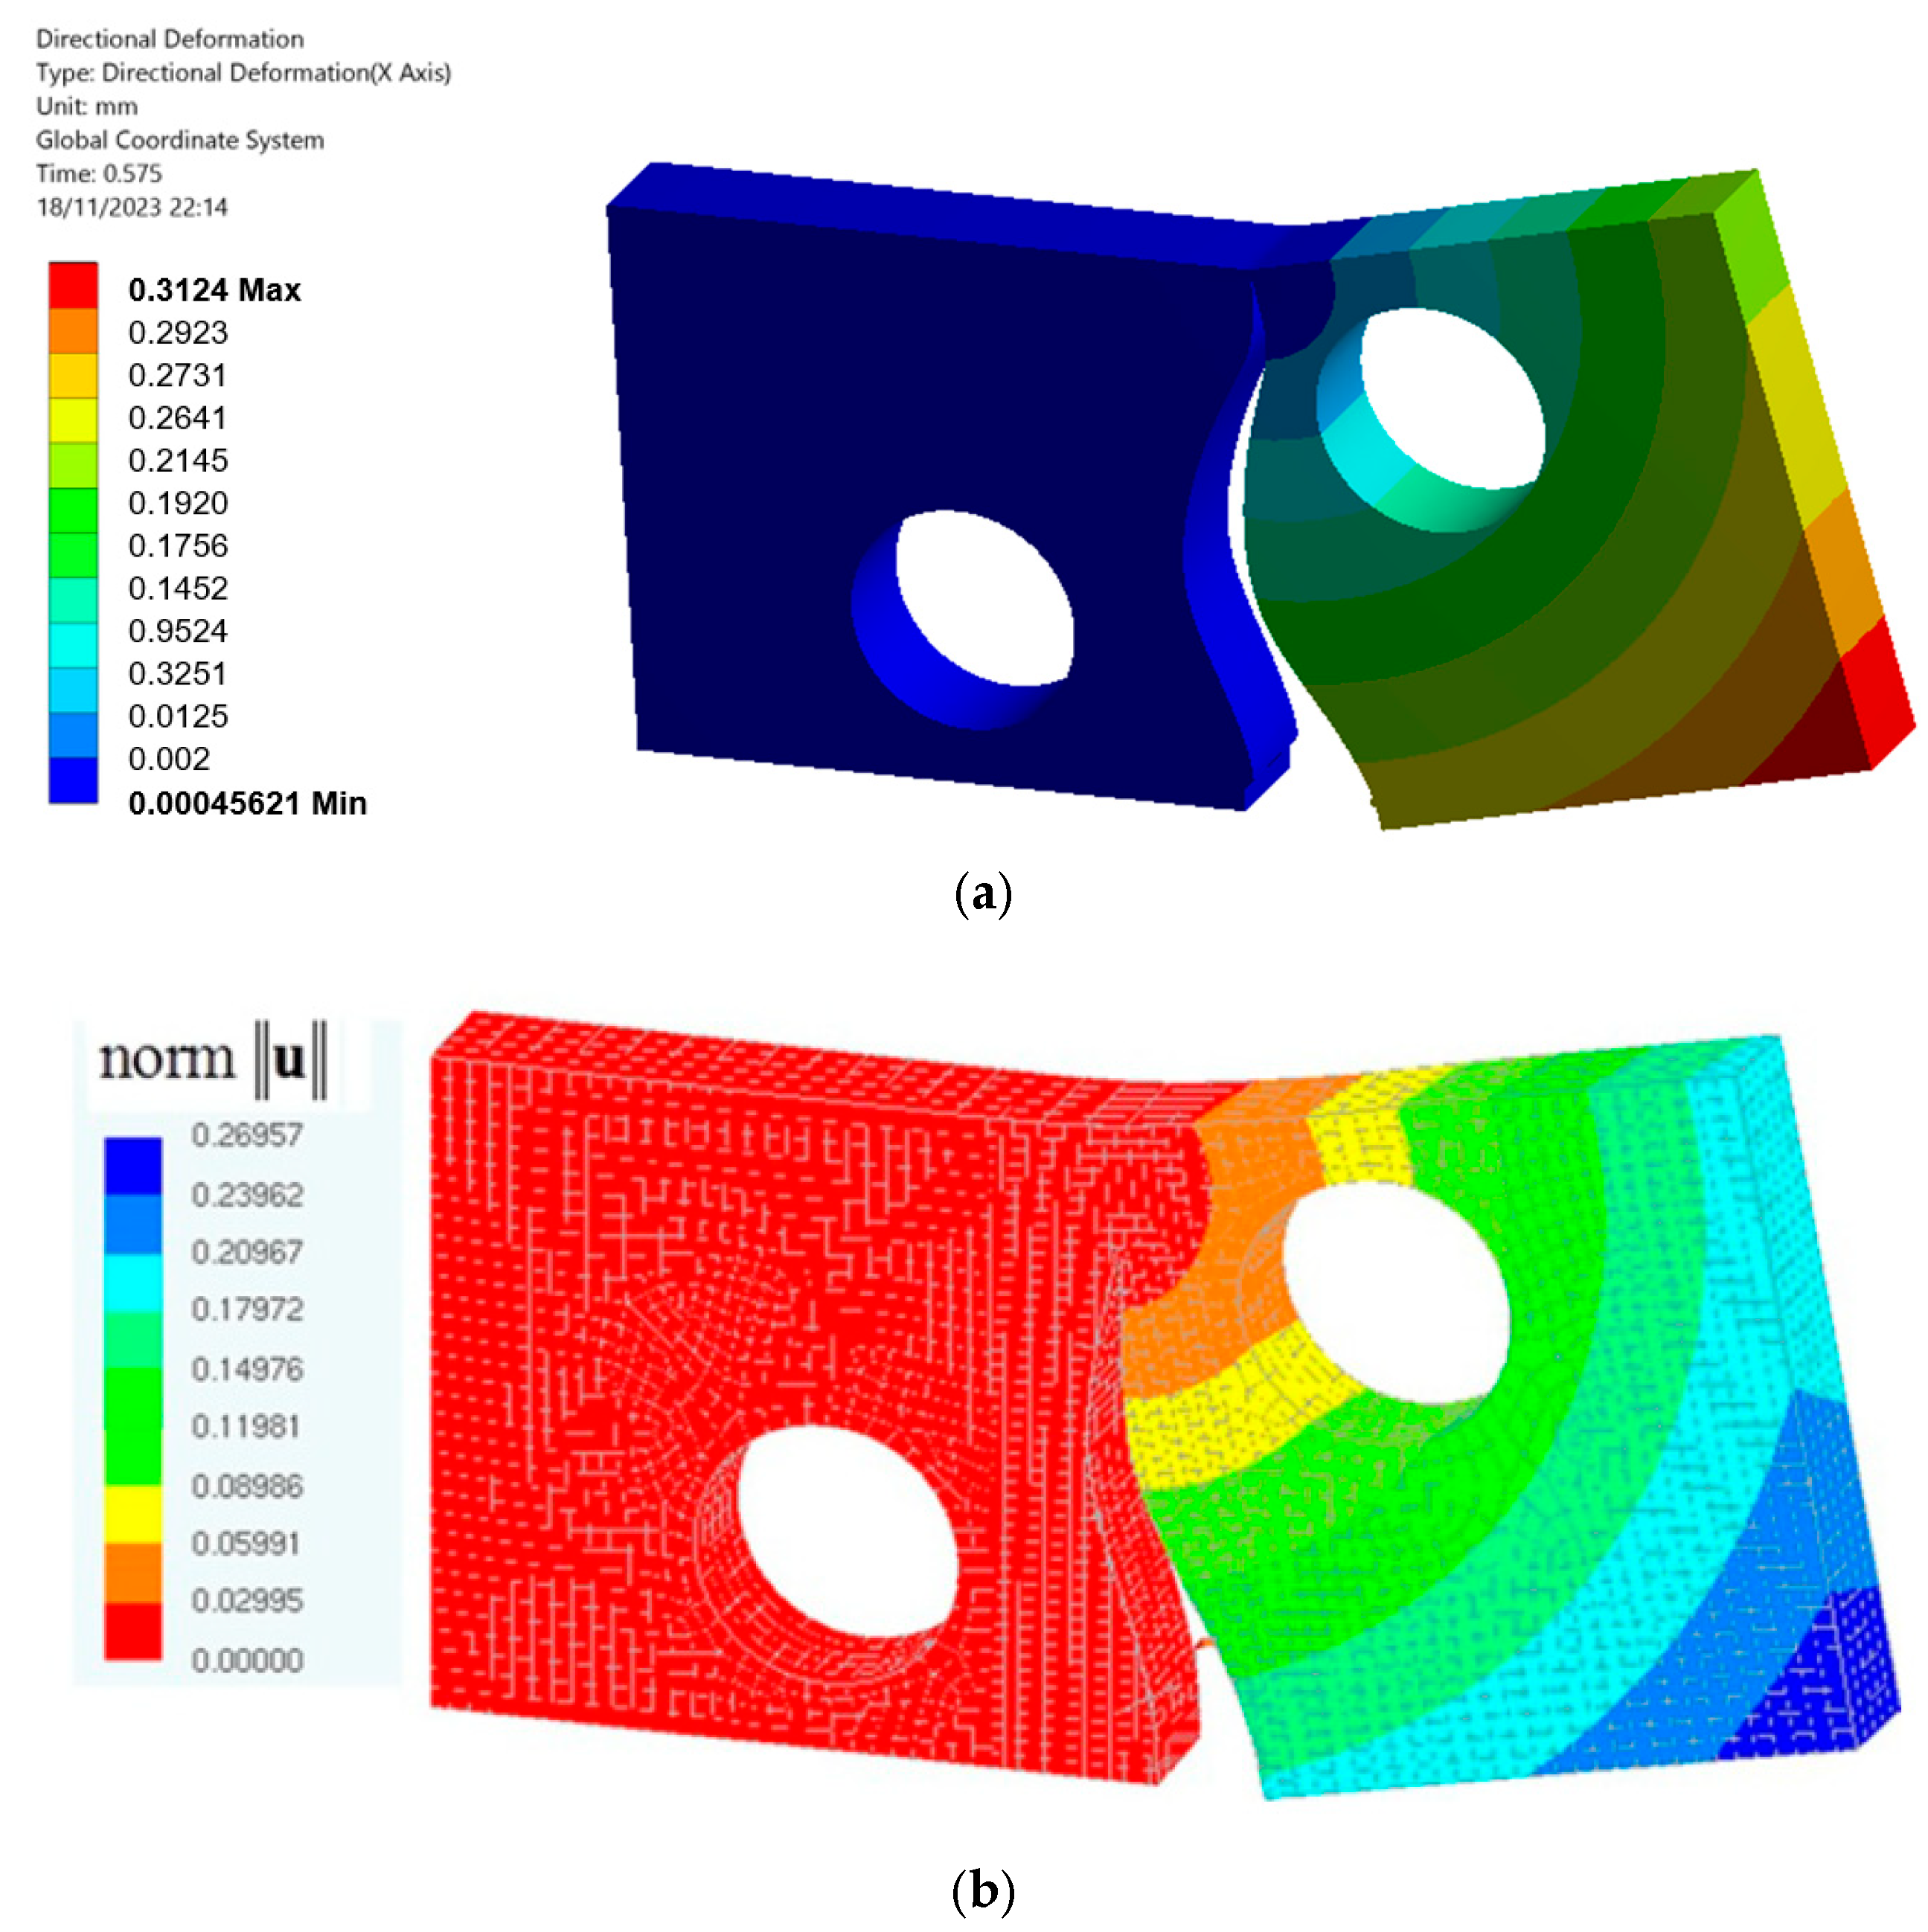
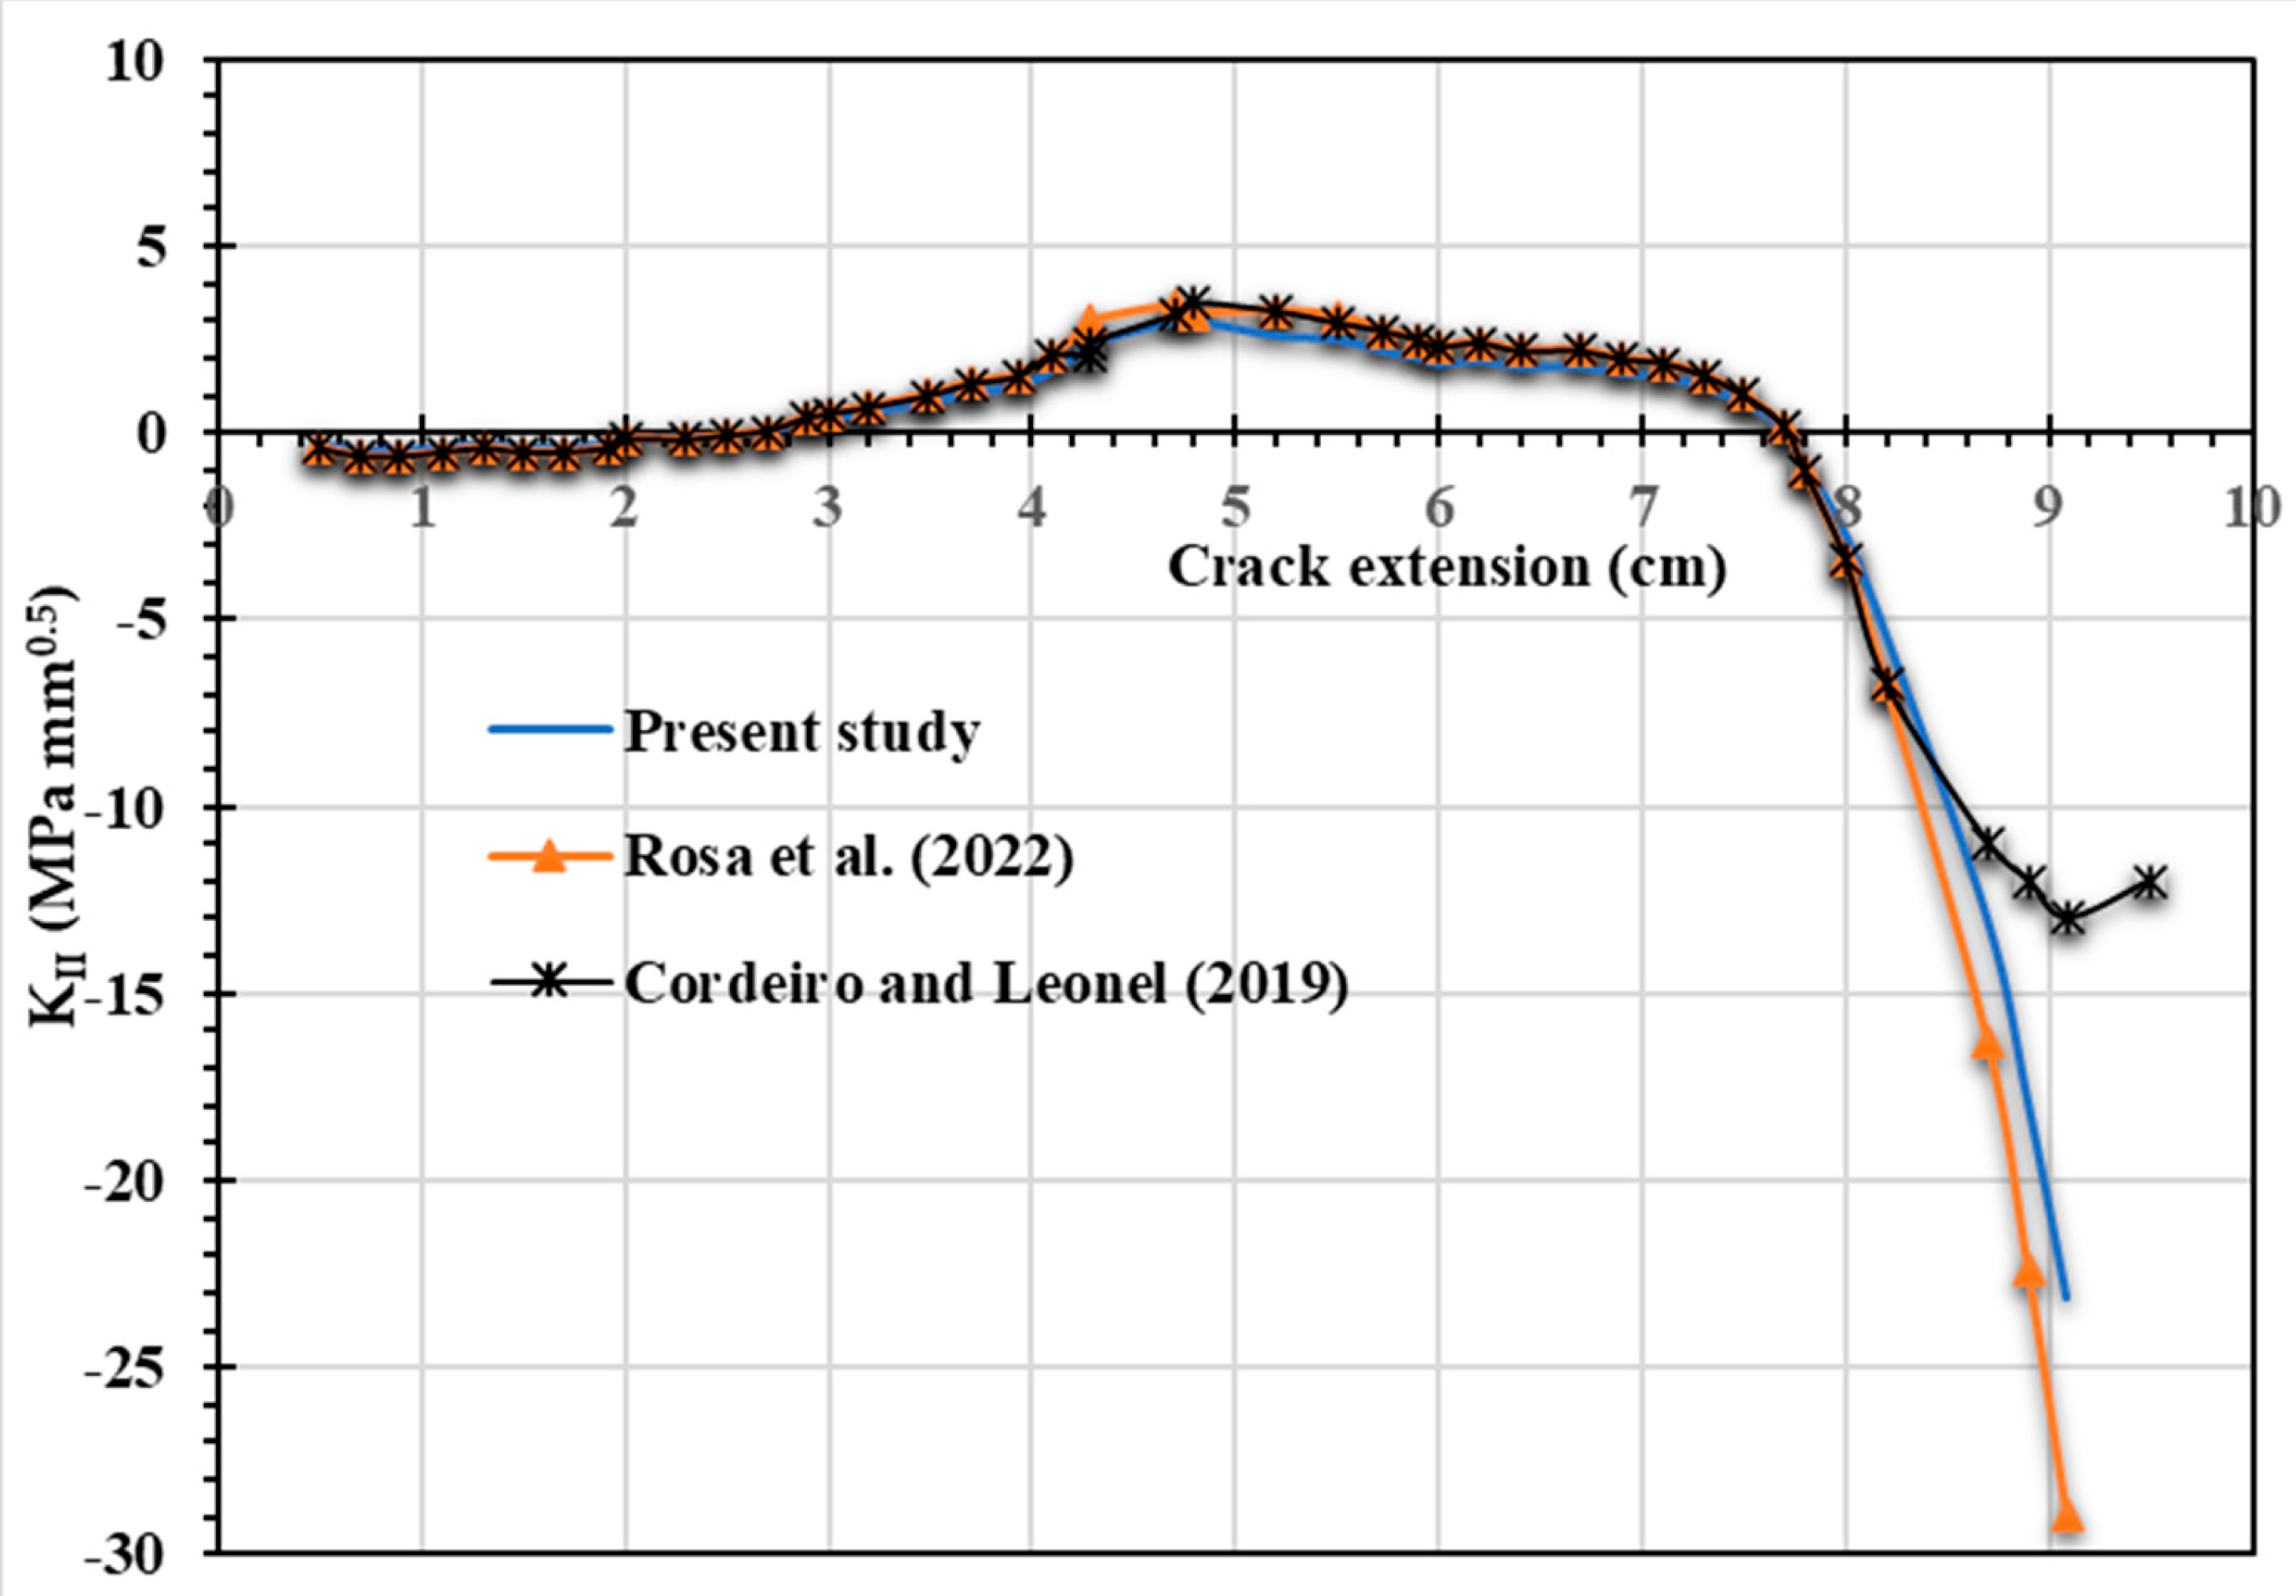
Figure 11 illustrates the predicted values of the second mode of the stress intensity factor, KII. It shows that as the crack growth direction shifted towards the first hole, the KII values increased while the crack trajectory deviated to the left. After missing the first hole and changing its path, the KII values gradually decreased, eventually becoming negative as the crack moved towards the second hole on the right. Finally, when the crack growth bypassed the second hole, the KII values dropped again, as KII influenced the crack to grow in a straight line. This pattern highlights the relationship between crack direction and the second mode of stress intensity factors, emphasizing the influence of nearby holes on crack behavior.Furthermore, as depicted in Figure 12, the final deformation resulting from the present study closely aligns with the x-deformation predicted by Cordeiro and Leonel [57] using a dual boundary element. This observation indicates a strong similarity between the outcomes of the ANSYS software and the predictions made by the dual boundary element method.
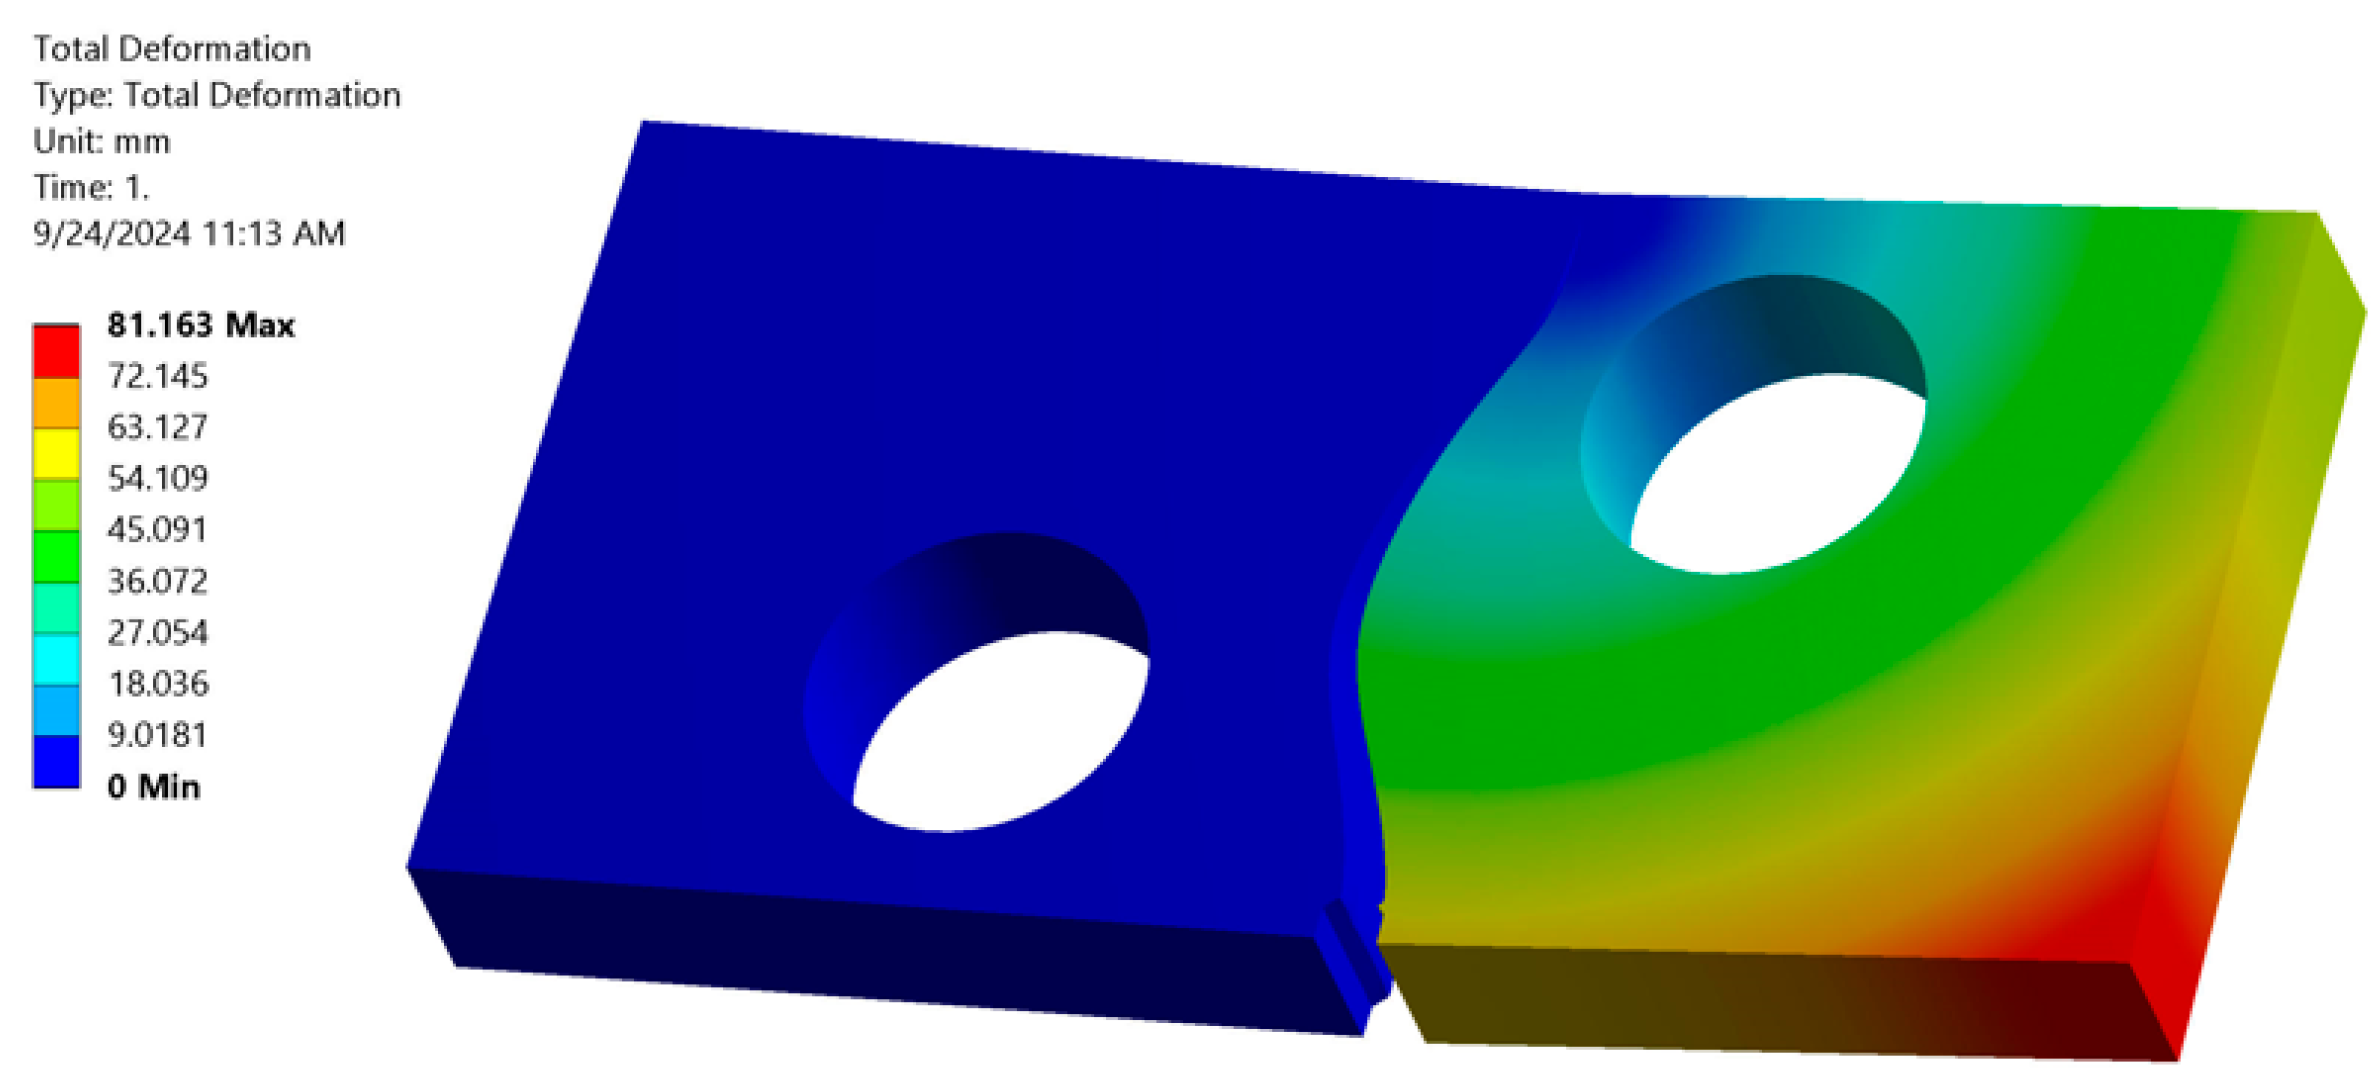
Figure 13 illustrates the total deformation at the final stage of crack growth. The figure indicates that the highest displacement values are concentrated in the bottom right corner of the geometry. This concentration of displacement arises from the combined effect of the edge load applied to the right side and the presence of a crack at the lower edge’s midpoint. These factors together result in substantial deformation in that specific area.
The SMART crack growth method, while useful, has some key limitations [59]:
  • Mesh Dependency: This method is highly dependent on the quality and fineness of the mesh around the crack tip. If the mesh is not fine enough in that critical area, the stress calculations—and thus the results—will be inaccurate.
  • Material and Loading Specificity: It is primarily built for fatigue crack growth in metals that exhibit linear elastic fracture mechanics (LEFM) behavior. This means that it is generally not suitable for other materials like composites or polymers, nor for crack growth driven by factors other than fatigue, such as environmental degradation or creep.
  • Paris’s Law Reliance: SMART’s fatigue crack growth prediction is rooted in Paris’s Law. Consequently, it does not typically account for complexities such as plasticity, nonlinear geometric changes, or load-compression effects, which can significantly influence crack behavior.

4. Conclusions

This study has significantly advanced the understanding of fatigue crack behavior through sophisticated finite element analysis using ANSYS SMART crack growth technology under linear elastic assumptions. Through comprehensive numerical simulations across a spectrum of stress ratios, the impact of hole position on crack propagation paths has been clearly demonstrated for the tested configurations, revealing important implications for structural design. The research revealed a critical relationship: higher stress ratios correlate with reduced stress intensity factors, resulting in substantially prolonged fatigue life. This relationship, coupled with the remarkable efficiency of SMART crack growth technology in predicting crack evolution, underscores the necessity of meticulously accounting for both stress ratio effects and geometric discontinuities when estimating fatigue life in engineering components. The study’s findings, rigorously validated against established literature, illuminate the complex interplay between loading conditions and material response. Particularly noteworthy is the discovery that increased compressive loading (characterized by more negative stress ratios) leads to elevated equivalent stress intensity factors, significantly accelerating damage accumulation and potential failure under cyclic loading conditions. Conversely, it was demonstrated that reducing the stress ratio (making it more negative) diminishes fatigue life, which is a crucial consideration for engineers seeking to ensure structural longevity through appropriate loading parameter selection. Perhaps most valuable for practical engineering applications is the confirmation that managing and reducing maximum von Mises stress within designs directly translates to extended fatigue life. This finding provides engineers across numerous industrial sectors with a concrete, implementable strategy for enhancing structural robustness, operational safety, and long-term reliability in components subjected to cyclic loading. Collectively, these insights represent a significant contribution to fracture mechanics and offer valuable guidance for optimizing design parameters in fatigue-critical applications. Future work will involve a more comprehensive parametric study of varying hole and notch locations, sizes, and geometries to further elucidate their intricate effects on stress distribution and crack deflection.

Author Contributions

Conceptualization, A.M.A.; Methodology, Y.A.F.; Software, A.M.A.; Validation, A.M.A.; Formal analysis, Y.A.F. and A.M.A.; Investigation, Y.A.F. and A.M.A.; Resources, Y.A.F. and A.M.A.; Data curation, A.M.A.; Writing—original draft, A.M.A.; Writing—review & editing, A.M.A.; Visualization, A.M.A.; Supervision, Y.A.F. and A.M.A.; Project administration, Y.A.F. and A.M.A.; Funding acquisition, Y.A.F. and A.M.A. All authors have read and agreed to the published version of the manuscript.

Funding

The authors gratefully acknowledge the funding of the Deanship of Graduate Studies and Scientific Research, Jazan University, Saudi Arabia, through Project number: JU-20250230-DGSSR-RP-2025.

Data Availability Statement

The original contributions presented in this study are included in the article. Further inquiries can be directed to the corresponding author.

Conflicts of Interest

The authors declare no conflict of interest.

References

  1. Bolotin, V.V. Mechanics of Fatigue; CRC Press: Boca Raton, FL, USA, 2020. [Google Scholar]
  2. Richard, H.A.; Sander, M. Fatigue Crack Growth; Springer: Berlin/Heidelberg, Germany, 2016; Volume 18. [Google Scholar]
  3. Jin, P.; Liu, Z.; Chen, H.; Liu, M.; Wang, X.; Chen, X. Mixed-mode I&II fatigue crack growth behaviors of 16MND5 steel: The role of crack driving forces and crack closure. Int. J. Fatigue 2024, 183, 108228. [Google Scholar]
  4. Anderson, T.L. Fracture Mechanics: Fundamentals and Applications; CRC Press: Boca Raton, FL, USA, 2017. [Google Scholar]
  5. Dowling, N.E.; Kampe, S.L.; Kral, M.V. Mechanical Behavior of Materials: Engineering Methods for Deformation, Fracture, and Fatigue; Peaerson Education: London, UK, 2007. [Google Scholar]
  6. Gdoutos, E.E. Fracture Mechanics: An Introduction; Springer Nature: Berlin/Heidelberg, Germany, 2020; Volume 263. [Google Scholar]
  7. Ritchie, R.O.; Liu, D. Introduction to Fracture Mechanics; Elsevier: Amsterdam, The Netherlands, 2021. [Google Scholar]
  8. Alqahtani, I.; Starr, A.; Khan, M. Fracture Behaviour of Aluminium Alloys under Coastal Environmental Conditions: A Review. Metals 2024, 14, 336. [Google Scholar] [CrossRef]
  9. Hultgren, G. Fatigue and Fracture of High-Strength Steels. Ph.D. Thesis, KTH Royal Institute of Technology, Stockholm, Sweden, 2024. [Google Scholar]
  10. Gao, C.; Pang, J.; Hu, D.; Li, S.; Qi, K.; Wang, B.; Zhang, Y.; Nie, L.; Yang, M.; Zhang, Z. A new method for predicting the fatigue strength at various stress ratios based on damage of metallic materials. Fatigue Fract. Eng. Mater. Struct. 2024, 47, 2103–2126. [Google Scholar] [CrossRef]
  11. Yue, P.; Zhou, C.; Zhang, J.; Zhang, X.; Du, X.; Liu, P. A comparative study on combined high and low cycle fatigue life prediction model considering loading interaction. Int. J. Damage Mech. 2024, 10567895241292747. [Google Scholar] [CrossRef]
  12. Solob, A.Y. Fatigue Life Analysis of Damaged Light Aircraft Wing-Fuselage Fitting. Ph.D. Thesis, University of Belgrade, Belgrade, Serbia, 2021. [Google Scholar]
  13. Irving, P. Fatigue-Based Assessments in Aircraft Structures-Designing and Retaining Aircraft Structural Integrity. In Methods for the Assessment of the Structural Integrity of Components and Structures; CRC Press: Boca Raton, FL, USA, 2024; pp. 69–102. [Google Scholar]
  14. Li, Y.; Jin, A.; Dai, Y.; Yang, D.; Zheng, B. Prediction of Remaining Fatigue Life of In-Service Bridge Cranes. Appl. Sci. 2023, 13, 12250. [Google Scholar] [CrossRef]
  15. Pástor, M.; Lengvarský, P.; Hagara, M.; Kuľka, J. Experimental investigation of the fatigue life of a bridge crane girder using SN method. Appl. Sci. 2022, 12, 10319. [Google Scholar] [CrossRef]
  16. Kaimkuriya, A.; Sethuraman, B.; Gupta, M. Effect of physical parameters on fatigue life of materials and alloys: A critical review. Technologies 2024, 12, 100. [Google Scholar] [CrossRef]
  17. Wang, X.; Xiong, X.; Huang, K.; Ying, S.; Tang, M.; Qu, X.; Ji, W.; Qian, C.; Cai, Z. Effects of Deep Rolling on the Microstructure Modification and Fatigue Life of 35Cr2Ni4MoA Bolt Threads. Metals 2022, 12, 1224. [Google Scholar] [CrossRef]
  18. Hasegawa, K.; Dvorak, D.; Mares, V.; Kraus, M.; Usami, S. Fatigue thresholds at negative stress ratios for ferritic steels and aluminium alloys in flaw evaluation procedures. arXiv 2020. [Google Scholar] [CrossRef]
  19. Zhang, P.; Xie, L.-Q.; Zhou, C.-Y.; He, X.-H. Experimental and numerical investigation on fatigue crack growth behavior of commercial pure titanium under I-II mixed mode loading at negative load ratios. Int. J. Fatigue 2020, 138, 105700. [Google Scholar] [CrossRef]
  20. Zhang, P.; Zhou, C.-Y.; Xie, L.-Q.; He, X.-H. Numerical investigation of mechanical behavior of crack tip under mode I and mixed-mode I-II fatigue loading at negative load ratios. Theor. Appl. Fract. Mech. 2020, 108, 102673. [Google Scholar] [CrossRef]
  21. Li, G.; Ke, L.; Ren, X.; Sun, C. High cycle and very high cycle fatigue of TC17 titanium alloy: Stress ratio effect and fatigue strength modeling. Int. J. Fatigue 2023, 166, 107299. [Google Scholar] [CrossRef]
  22. Kumar, M.; Ahmad, S.; Singh, I.V.; Rao, A.; Kumar, J.; Kumar, V. Experimental and numerical studies to estimate fatigue crack growth behavior of Ni-based super alloy. Theor. Appl. Fract. Mech. 2018, 96, 604–616. [Google Scholar] [CrossRef]
  23. Boyce, B.; Ritchie, R. Effect of load ratio and maximum stress intensity on the fatigue threshold in Ti–6Al–4V. Eng. Fract. Mech. 2001, 68, 129–147. [Google Scholar] [CrossRef]
  24. Newman, J., Jr.; Kota, K.; Lacy, T. Fatigue and crack-growth behavior in a titanium alloy under constant-amplitude and spectrum loading. Eng. Fract. Mech. 2018, 187, 211–224. [Google Scholar] [CrossRef]
  25. Arifin, A.; Abdullah, S.; Ariffin, A.; Jamaludin, N.; Singh, S. Characterising the stress ratio effect for fatigue crack propagation parameters of SAE 1045 steel based on magnetic flux leakage. Theor. Appl. Fract. Mech. 2022, 121, 103514. [Google Scholar] [CrossRef]
  26. Bian, J.; Yu, P.; Zhao, Y.; Yao, L.; Wei, P.; Zhao, J. Fatigue crack growth of marine 980 high-strength steel: From standard specimen testing to three-dimensional curved crack life prediction. Ocean Eng. 2024, 296, 116950. [Google Scholar] [CrossRef]
  27. Garcia, C.; Lotz, T.; Martinez, M.; Artemev, A.; Alderliesten, R.; Benedictus, R. Fatigue crack growth in residual stress fields. Int. J. Fatigue 2016, 87, 326–338. [Google Scholar] [CrossRef]
  28. Salehnasab, B.; Marzbanrad, J.; Poursaeidi, E. Conventional shot peening treatment effects on thermal fatigue crack growth and failure mechanisms of a solid solution alloy. Eng. Fail. Anal. 2024, 155, 107740. [Google Scholar] [CrossRef]
  29. Shahani, A.; Farrahi, A. Experimental investigation and numerical modeling of the fatigue crack growth in friction stir spot welding of lap-shear specimen. Int. J. Fatigue 2019, 125, 520–529. [Google Scholar] [CrossRef]
  30. Alshoaibi, A.M.; Fageehi, Y.A. 3D modelling of fatigue crack growth and life predictions using ANSYS. Ain Shams Eng. J. 2022, 13, 101636. [Google Scholar] [CrossRef]
  31. Alshoaibi, A.M.; Fageehi, Y.A. Numerical Analysis on Fatigue Crack Growth at Negative and Positive Stress Ratios. Materials 2023, 16, 3669. [Google Scholar] [CrossRef] [PubMed]
  32. Alshoaibi, A.M.; Fageehi, Y.A. Finite Element Simulation of a Crack Growth in the Presence of a Hole in the Vicinity of the Crack Trajectory. Materials 2022, 15, 363. [Google Scholar] [CrossRef]
  33. Alshoaibi, A.M.; Fageehi, Y.A. Numerical Analysis of Fatigue Crack Growth Path and Life Predictions for Linear Elastic Material. Materials 2020, 13, 3380. [Google Scholar] [CrossRef]
  34. Alshoaibi, A.M. Comprehensive comparisons of two and three dimensional numerical estimation of stress intensity factors and crack propagation in linear elastic analysis. Int. J. Integr. Eng. 2019, 11, 45–52. [Google Scholar] [CrossRef]
  35. Malekan, M.; Khosravi, A.; St-Pierre, L. An Abaqus plug-in to simulate fatigue crack growth. Eng. Comput. 2021, 38, 2991–3005. [Google Scholar] [CrossRef]
  36. Rocha, A.; Akhavan-Safar, A.; Carbas, R.; Marques, E.; Goyal, R.; El-zein, M.; da Silva, L. Numerical analysis of mixed-mode fatigue crack growth of adhesive joints using CZM. Theor. Appl. Fract. Mech. 2020, 106, 102493. [Google Scholar] [CrossRef]
  37. Ammendolea, D.; Greco, F.; Leonetti, L.; Lonetti, P.; Pascuzzo, A. Fatigue crack growth simulation using the moving mesh technique. Fatigue Fract. Eng. Mater. Struct. 2023, 46, 4606–4627. [Google Scholar] [CrossRef]
  38. Zhou, S.; Rabczuk, T.; Zhuang, X. Phase field modeling of quasi-static and dynamic crack propagation: COMSOL implementation and case studies. Adv. Eng. Softw. 2018, 122, 31–49. [Google Scholar] [CrossRef]
  39. Carter, B.; Wawrzynek, P.; Ingraffea, A. Automated 3-D crack growth simulation. Int. J. Numer. Methods Eng. 2000, 47, 229–253. [Google Scholar] [CrossRef]
  40. Nagarajappa, N.; Malipatil, S.G.; Majila, A.N.; Fernando, D.C.; Manjuprasad, M.; Manjunatha, C. Fatigue Crack Growth Prediction in a Nickel-Base Superalloy Under Spectrum Loads Using FRANC3D. Trans. Indian Natl. Acad. Eng. 2022, 7, 533–540. [Google Scholar] [CrossRef]
  41. Kuang, Y.; Wang, Y.; Xiang, P.; Tao, L.; Wang, K.; Fan, F.; Yang, J. Experimental and Theoretical Study on the Fatigue Crack Propagation in Stud Shear Connectors. Materials 2023, 16, 701. [Google Scholar] [CrossRef] [PubMed]
  42. Bouchard, P.-O.; Bay, F.; Chastel, Y.; Tovena, I. Crack propagation modelling using an advanced remeshing technique. Comput. Methods Appl. Mech. Eng. 2000, 189, 723–742. [Google Scholar] [CrossRef]
  43. Pedersen, P. Design study of hole positions and hole shapes for crack tip stress releasing. Struct. Multidiscip. Optim. 2004, 28, 243–251. [Google Scholar] [CrossRef]
  44. Esposito, L.; Palladino, S.; Minutolo, V. An effective free-meshing and linear Step-Wise procedure to predict crack initiation and propagation. Theor. Appl. Fract. Mech. 2024, 130, 104240. [Google Scholar] [CrossRef]
  45. Bjørheim, F. Practical Comparison of Crack Meshing in ANSYS Mechanical APDL 19.2. Master’s Thesis, University of Stavanger, Norway, 2019. [Google Scholar]
  46. ANSYS, R. Academic Research Mechanical, Release 19.2, Help System. In Coupled Field Analysis Guide; ANSYS Inc.: Canonsburg, PA, USA, 2020. [Google Scholar]
  47. Yan, X.; Dan, S.; Zhang, Z. Mixed-mode fatigue crack growth prediction in biaxially stretched sheets. Eng. Fract. Mech. 1992, 43, 471–475. [Google Scholar]
  48. Wu, C.H. Maximum-energy-release-rate criterion applied to a tension-compression specimen with crack. J. Elast. 1978, 8, 235–257. [Google Scholar] [CrossRef]
  49. Sih, G.C. Strain-energy-density factor applied to mixed mode crack problems. Int. J. Fract. 1974, 10, 305–321. [Google Scholar] [CrossRef]
  50. Rice, J.R. A path independent integral and the approximate analysis of strain concentration by notches and cracks. J. Appl. Mech. 1968, 35, 379–386. [Google Scholar] [CrossRef]
  51. Larsson, S.-G.; Carlsson, A.J. Influence of non-singular stress terms and specimen geometry on small-scale yielding at crack tips in elastic-plastic materials. J. Mech. Phys. Solids 1973, 21, 263–277. [Google Scholar] [CrossRef]
  52. Roth, S.; Hütter, G.; Kuna, M. Simulation of fatigue crack growth with a cyclic cohesive zone model. Int. J. Fract. 2014, 188, 23–45. [Google Scholar] [CrossRef]
  53. Schreiber, C.; Kuhn, C.; Müller, R.; Zohdi, T. A phase field modeling approach of cyclic fatigue crack growth. Int. J. Fract. 2020, 225, 89–100. [Google Scholar] [CrossRef]
  54. Giner, E.; Sukumar, N.; Tarancón, J.; Fuenmayor, F. An Abaqus implementation of the extended finite element method. Eng. Fract. Mech. 2009, 76, 347–368. [Google Scholar] [CrossRef]
  55. Cheng, Z.; Wang, H. A novel X-FEM based fast computational method for crack propagation. arXiv 2017, arXiv:1708.01610. [Google Scholar]
  56. Jafari, A.; Broumand, P.; Vahab, M.; Khalili, N. An eXtended finite element method implementation in COMSOL multiphysics: Solid mechanics. Finite Elem. Anal. Des. 2022, 202, 103707. [Google Scholar] [CrossRef]
  57. Cordeiro, S.G.F.; Leonel, E.D. An improved computational framework based on the dual boundary element method for three-dimensional mixed-mode crack propagation analyses. Adv. Eng. Softw. 2019, 135, 102689. [Google Scholar] [CrossRef]
  58. Rosa, R.J.R.; Coda, H.B.; Sanches, R.A.K. Blended isogeometric-finite element analysis for large displacements linear elastic fracture mechanics. Comput. Methods Appl. Mech. Eng. 2022, 392, 114622. [Google Scholar] [CrossRef]
  59. Alshoaibi, A.M.; Fageehi, Y.A. A Comparative Analysis of 3D Software for Modeling Fatigue Crack Growth: A Review. Appl. Sci. 2024, 14, 1848. [Google Scholar] [CrossRef]
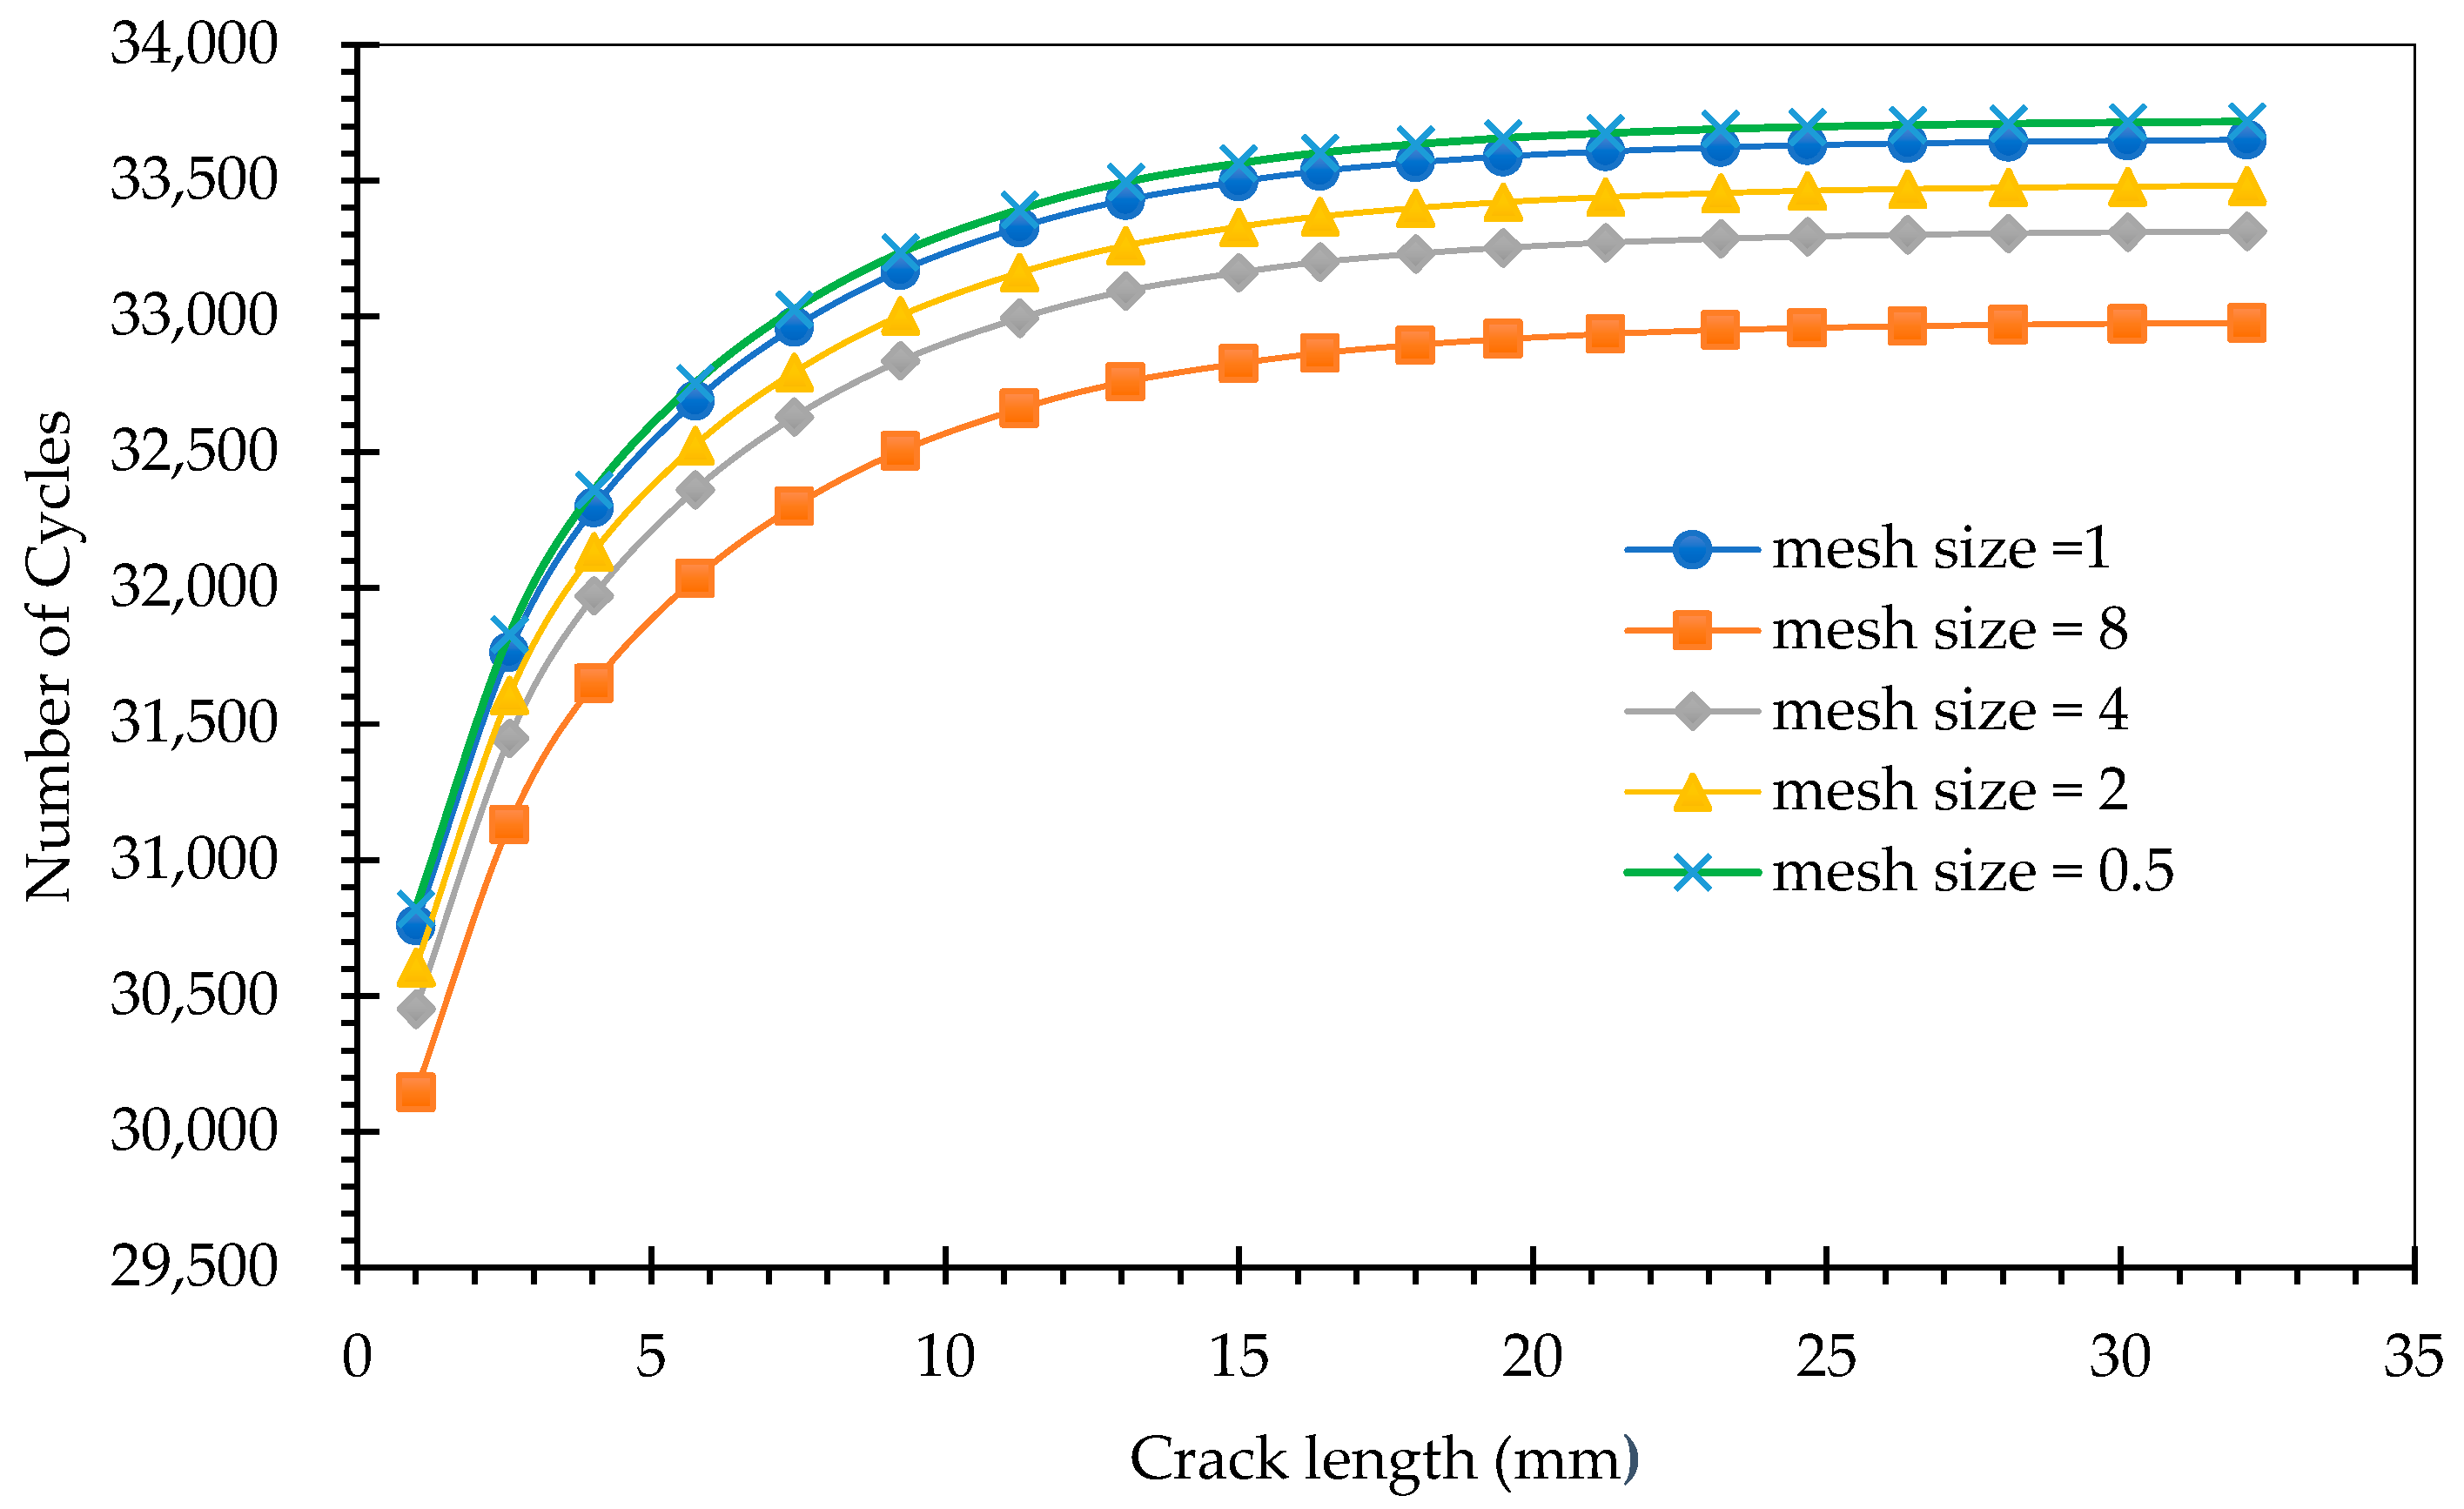
Figure 1. Mesh sensitivity analysis of the number of cycles versus the mesh size.
Crystals 15 00596 g001
Figure 2. The geometry of the notched plate with hole (left) and the finite element mesh (right).
Crystals 15 00596 g002
Figure 3. Fatigue crack growth path of the notched plate with a hole: (a) present study, (b) experimental [54], (c) numerical [55], and (d) numerical [56].
Crystals 15 00596 g003
Figure 4. Equivalent stress intensity factors for different stress ratios.
Crystals 15 00596 g004
Figure 5. Predicted fatigue life cycles for positive and negative stress ratio.
Crystals 15 00596 g005
Figure 6. Von Mises stress distribution across various stress ratios.
Crystals 15 00596 g006aCrystals 15 00596 g006b
Figure 7. Geometric depiction and boundary condition for the cracked rectangular plate with two holes (all units in cm).
Crystals 15 00596 g007
Figure 8. Initial mesh generated using ANSYS.
Crystals 15 00596 g008
Figure 9. Crack trajectory: (a) present study, (b) FEM with Franc2d/L [57], and (c) domain decomposition technique [58].
Crystals 15 00596 g009
Figure 10. Comparison of mode I SIF (KI) [57,58].
Crystals 15 00596 g010
Figure 11. Comparison of mode II SIF (KII) [57,58].
Crystals 15 00596 g011
Figure 12. X-deformation for the last step of crack growth: (a) ANSYS; (b) DBEM (from [57]).
Crystals 15 00596 g012
Figure 13. Total deformation at final stage of crack growth.
Crystals 15 00596 g013
Table 1. Mesh sensitivity analysis.
Element Size (mm)No. of NodesNo. of ElementsMaximum Equivalent Stress Intensity Factor (MPa)Maximum Fatigue Life Cycles
844,76331,8521306.7032,639
458,74740,6561320.1732,976
2140,30095,0141333.6433,312
1581,980398,5661347.12133,649
0.52,567,5321,795,7271350.0233,670
Disclaimer/Publisher’s Note: The statements, opinions and data contained in all publications are solely those of the individual author(s) and contributor(s) and not of MDPI and/or the editor(s). MDPI and/or the editor(s) disclaim responsibility for any injury to people or property resulting from any ideas, methods, instructions or products referred to in the content.