Abstract
A single batch of AlSi10Mg powder was used to fabricate two groups of round bars via horizontal printing, employing an identical strategy except for one parameter in the process of powder bed fusion-laser beam. The parameter is layer thickness, set at 50 and 80 μm for Group-1 and Group-2, respectively, resulting in laser energy densities of 29.95 and 18.72 J/mm3. Both materials exhibit similar microstructures; Group-1 has fewer and smaller defects than Group-2, leading to higher strength and ductility. Fatigue performance of low-cycle and long-life up to 108 cycles under rotating bending was assessed, and the fracture surfaces were carefully examined under scanning electron microscopy. The S-N data converge to a single slope followed by a horizontal asymptote, indicating the occurrence of very-high-cycle fatigue (VHCF) in both cases. Group-1 shows higher fatigue strength in the range of 104 to 108 cycles, and a greater failure probability in VHCF regime than Group-2. This is attributed to the larger defect size in Group-2, where the smaller control volume in rotating bending greatly increases the likelihood of encountering large defects compared to Group-1. At the defect edge, the microstructure shows distinct resistance to crack propagation under high and low loads.
1. Introduction
The advantage of additive manufacturing (AM) lies in its seamless integration with computer technologies: a three-dimensional geometric model of the part is first generated through computer-aided design, then sliced and converted into a format compatible with specific additive manufacturing equipment [1,2,3,4,5]. Powder bed fusion (PBF) is an AM technology that utilizes a high-energy beam (e.g., laser or electron beam, the former termed PBF-LB [6]) to selectively melt layers of metal or polymer powder, constructing 3D parts layer by layer. The process involves spreading powder onto a substrate, selectively fusing regions based on a digital model, and repeating the cycle until the part is complete. PBF methods [7,8,9,10] enable the fabrication of complex geometries, lightweight structures, and a broad range of materials (e.g., titanium [11,12,13,14,15,16], aluminum [17,18,19], and nickel [20,21,22]), making them widely used in aerospace and medical applications. Post-processing steps such as de-powdering, heat treatment, and surface finishing are necessary to achieve the desired final properties. During the PBF-LB process, metal powder is uniformly spread across the build platform, and a laser beam with power p follows a predefined path with scanning speed s and hatch spacing h, acting on the surface of the powder to rapidly melt and solidify it, forming solid melt pools and melt track structures. The build platform then lowers by a certain distance (equal to the layer thickness t of powder bed), powder is spread again, and laser melting continues in a cyclic manner until the entire part is fully formed. Throughout this process, the presence of different boundaries on the surface and within the part leads to variations in scanning strategies, which often results in the accumulation of numerous metallurgical defects on or near the surface of the printed components [18,19,23].
According to Refs. [24,25,26,27], metal fatigue is a progressive structural degradation that occurs when a material is subjected to cyclic loading, leading to the initiation and propagation of cracks over time. Unlike static failure, fatigue failure can occur at stress levels significantly lower than the material’s ultimate tensile strength (UTS) due to the accumulation of microscopic damage. The fatigue life Nf (number of cycles to failure) of a metal component is influenced by factors such as maximum stress σmax, stress amplitude, loading frequency f, residual stresses, microstructure, and environmental conditions. In additively manufactured (AMed) alloys, defects such as porosity, surface roughness, and residual stresses play a crucial role in determining fatigue performance, often necessitating post-processing treatments to enhance durability and reliability [28,29,30,31,32,33,34,35,36,37,38]. With the development of modern industrial technology, traditional high-cycle fatigue (HCF, 105 cycles < Nf < 107 cycles) has gradually become insufficient to meet the required safety life standards. As a result, research on very-high-cycle fatigue (VHCF, Nf > 107 cycles) has emerged over the past decades [39,40,41,42,43,44,45,46,47,48,49]. Recently, the VHCF of AMed alloys has received considerable attention [12,14,15,16,17,18,19,31,50,51,52,53,54,55,56]. However, most of the results have been obtained through ultrasonic loading, with a loading frequency of 20 kHz, applied in either axial tension–compression or tension–tension modes.
In the early stages of fatigue research [57,58,59] and VHCF studies [39,60,61,62], rotating bending was commonly used to load specimens, with a loading frequency of over 50 Hz, which falls within the range of conventional frequencies [19,63]. Additionally, in rotating bending, the applied stress or strain exhibits a linear gradient, with the maximum at the surface and the minimum at the core. This may lead to HCF and VHCF phenomena different from those observed under ultrasonic axial loading in AMed alloys [64,65,66]. Given these considerations, the paper conducts rotating bending fatigue experiments in the range of 4.2 × 10⁴ to 1.3 × 10⁸ cycles and provides a detailed study on the low-cycle fatigue (LCF), HCF, and VHCF behavior of AMed AlSi10Mg alloys produced by PBF-LB with two groups of processing parameters (varying layer thickness). Subsequently, the fracture surfaces of the specimens are analyzed using a scanning electron microscope (SEM) to determine the failure types of the material under rotating bending. The AM defect characteristics on the fracture surfaces, including size, location, and shape parameters, are examined in relation to LCF, HCF, and VHCF lives. Finally, the stress intensity factor (SIF) values near critical AM defects are calculated, taking into account the failure characteristics and statistical defect data, providing a reference for the fatigue performance assessment of the AMed AlSi10Mg alloys.
2. Materials and Experiments
2.1. Specimen Fabrications
In order to investigate the effect of layer thickness on the LCF, HCF, and VHCF of the AMed AlSi10Mg alloys via PBF-LB, two sets of specimens with different layer thicknesses of the powder bed were designed and fabricated in this subsection, while all other controllable printing parameters were kept identical to maintain a single-variable condition. Specifically, the powder layer thickness t was set to 50 μm for the first group (Group-1) and 80 μm for the second group (Group-2). During the fabrication of both groups, the laser power p was maintained at 370 W, the scanning speed s at 1300 mm/s, and the hatch spacing h at 0.19 mm. The volumetric laser energy density E is commonly used to characterize the amount of heat input per unit volume and serves as a comprehensive process parameter in studies of the PBF-LB [67], which is determined by the following equation:
Based on the processing parameters of the two groups of samples, the volumetric energy density of the first group was calculated to be 29.95 J/mm3, while that of the second group was 18.72 J/mm3. The latter is much lower than the former; however, both values are relatively low, indicating a state of insufficient heat input.
To eliminate the potential influence of surface and subsurface defects accumulated during the printing process, all specimens were first fabricated as cylindrical rods and then machined and polished into rotating bending fatigue specimens according to the geometry, as shown in Figure 1a. In addition, some cylindrical rods were machined into dog-bone shaped specimens for quasi-static tensile testing, as shown in Figure 1b, with a gauge length of 30 mm. It should be noted that all cylindrical rods were printed at 0°, meaning that the axis of both the cylindrical rods and the subsequently machined fatigue and tensile specimens was perpendicular to the build direction.
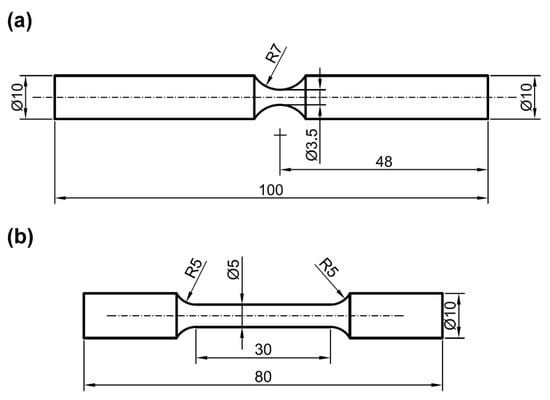
Figure 1.
Specimen geometries (in mm) for rotating bending fatigue (a) and uniaxial tension (b).
2.2. Material Characterizations
This study conducted microstructural observations on two sets of specimens of the AMed AlSi10Mg alloy. First, cylindrical samples measuring Φ10 mm × 5 mm (diameter × length) were obtained by electrical discharge wire-cutting from the grip sections of the rotating bending fatigue specimens and quasi-static tensile specimens, serving as preliminary metallographic samples.
Before metallographic polishing, these small cylindrical samples were mounted in resin for easier handling. The polishing surfaces were then ground sequentially using abrasive papers ranging from 300# to 2000# until no visible scratches remained. Subsequently, the surfaces were polished using diamond polishing paste applied to a polishing cloth on a rotating polishing machine until a mirror-like finish was achieved. Finally, Keller’s reagent [68] was prepared by mixing distilled water (190 mL), nitric acid (5 mL), hydrochloric acid (3 mL), and hydrofluoric acid (2 mL). The polished surfaces were then etched by immersion in this solution to obtain the metallographic specimens.
The prepared metallographic specimens were qualitatively observed and quantitatively characterized using an optical microscope (OM, Axiovert 200 MAT, Zeiss, Oberkochen, Baden-Württemberg, Germany) and a field emission SEM (Zeiss Gemini SEM 300, Zeiss, Oberkochen, Baden-Württemberg, Germany), respectively. In addition, characterization of internal printing defects in these two batches of samples will be conducted using high-energy X-ray tomography. This technique is particularly suitable for capturing three-dimensional features of surface and internal defects in AMed materials due to its non-destructive nature and high resolution. It has already provided a considerable number of critical references for evaluating the fatigue performance of PBF-LB processed AlSi10Mg.
Prior to conducting rotating bending fatigue tests, several small cylindrical samples (Φ5 mm × 5 mm) were coaxially extracted from the printed large-diameter rods (Φ10 mm × 100 mm) using wire-cutting to meet the requirements of the synchrotron radiation light source, thereby ensuring optimal imaging quality. Subsequently, high-energy X-ray tomography was performed using the synchrotron radiation source with an X-ray energy of 26 keV and a projection exposure time of 0.5 s, achieving a spatial resolution of 3.25 μm. A vertical line (approximately perpendicular to the cylindrical base) within the small cylinder was selected as the rotation axis, and a projection image was recorded every 0.25° rotation. After completing a full 360° rotation, a series of projection images was acquired. These two-dimensional projections were converted into cross-sectional slice stacks perpendicular to the projection plane using PITRE V3.5 software [69]. Finally, three-dimensional reconstruction was performed in AVIZO Version 2023.1 software [70].
2.3. Tensile and Fatigue Testing
The uniaxial quasi-static tensile test is one of the fundamental material mechanics experiments, from which basic mechanical properties such as yield strength, UTS, elongation, and elastic (Young’s) modulus can be obtained.
First, a mechanical electronic extensometer (MTS 635.25F-05, MTS, Eden Prairie, MN, USA) with a gauge length of 25 mm is attached to the gauge section of the specimen. Subsequently, a uniaxial tensile test is conducted using an MTS Landmark high-frequency fatigue testing machine (with a maximum load capacity of ±100 kN) (Eden Prairie, MN, USA) at a loading rate of 1 mm/min and a strain rate of approximately 5 × 10⁻⁴/s. During the test, the machine continuously collects data on the force and displacement at the crossbeam, as well as the deformation of the specimen gauge section corresponding to the extensometer.
This subsection employs a cantilever beam-based fatigue testing machine (Giga Quad YRB200, Yamamoto, Osaka, Japan) to perform rotational bending fatigue loading with testing frequency of 52.5 Hz. The specimen is treated as a cantilever beam, with one end connected to the main shaft and the other end loaded with weights to apply a bending moment. The motor drives the main shaft at a high speed of 3150 r/min through a belt drive. During the test, the machine automatically records the number of rotation cycles until the specimen fractures, at which point the recording stops.
The stress distribution under rotating bending loading differs from that under axial tension–compression or tension–tension loading. In axial loading, the stress on the cross section perpendicular to the loading axis of the specimen is generally uniformly distributed (excluding stress concentration caused by changes in cross-sectional geometry). In contrast, under rotating bending, the maximum stress is located at the specimen surface, and the normal stress on the cross section perpendicular to the specimen axis exhibits a gradient distribution, with the stress level being zero at the neutral axis of the cross section. If this gradient is linear, the maximum stress experienced by the specimen follows the equation
In this equation, α is the stress concentration factor at the specimen’s minimum cross section, with a tabulated value of 1.07 according to Ref. [71]; l is the distance from the plumb line of the loading weight to the specimen’s minimum cross section, measured as 43.5 mm; F is the applied load, calculated as the product of the total mass of all weights (including the load attached to the specimen, fixtures, springs, etc.) and the gravitational acceleration (taken as 9.8 N/kg); d is the diameter at the specimen’s minimum cross section, with a nominal value of 3.5 mm.
After the tests, all tensile and fatigue specimens fractured completely, which differs from the case under ultrasonic loading. The fracture surfaces were cleaned using ultrasonic cleaning in alcohol and acetone to remove dust and contaminants as much as possible. After drying, detailed morphological observation and analysis of the fracture surfaces of all failed specimens were carried out by using an SEM (JSM IT-300, JEOL, Tokyo, Japan).
3. Microstructure, Defect, and Tensile Behavior
3.1. Microstructural Features
Figure 2 presents the OM observations of metallographic samples from the AMed AlSi10Mg specimens. These images show cross sections perpendicular to the specimen axis and parallel to the build direction. Figure 2a,b corresponds to the samples of Group-1 and Group-2, respectively.
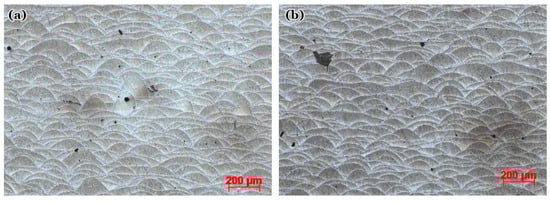
Figure 2.
Optical micrographs along building direction for etched surfaces of metallographic samples cut from Group-1 (a) and Group-2 (b).
In both cases, distinct melt pool morphologies can be observed, which is one of the common characteristics of AMed eutectic alloys [17,18,19]. Differences can be seen between the interior and boundary regions of the melt pools, attributed to variations in the distribution of Si particles. The white regions in the images represent the melt pool boundaries, where Si particles are present at a lower density, while the gray areas indicate the interior of the melt pools, where Si particles are more densely distributed. This contrast arises because Si particles appear dark under the optical microscope, whereas the α-Al matrix appears bright. As shown in Figure 3, in the secondary electron images obtained from the field emission SEM, the α-Al matrix appears dark gray, while the Si particles appear bright white. The roughened morphology formed around the edges of the Si particles due to metallographic etching further enhances the contrast of the Si particles. Figure 3a–d presents the secondary electron morphologies of the metallographic samples from Group-1 and Group-2 at different magnifications.
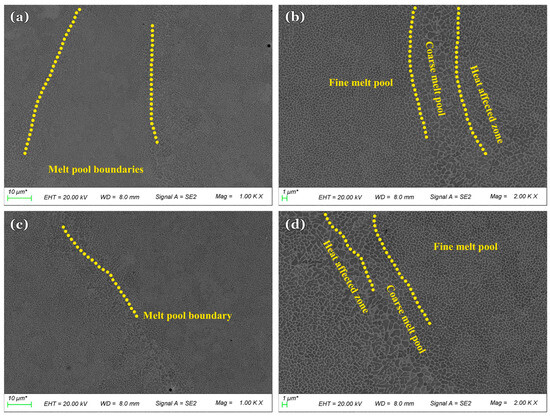
Figure 3.
Microstructure features of melt pool boundaries for Group-1 (a,b) and Group-2 (c,d).
The overall morphologies are similar, with melt pool features faintly visible. In Figure 3a,c, the melt pool boundary regions are composed of slightly coarser Si networks, while the enclosed interior areas consist of finer, more densely connected Si networks. At higher magnifications, as shown in Figure 3b,d, across two adjacent melt pools, a clear trend of the Si network or α-Al cell size increasing and then decreasing can be observed. In the fine regions, the equivalent diameter is less than 1 μm, while at the melt pool boundaries, it can reach the order of 5–6 μm. Three distinct regions can be clearly identified: melt pool fine zone (MP-fine), melt pool coarse zone (MP-coarse), and heat affected zone (HAZ). In the MP-fine, the Si networks are finer and uniformly distributed; in the MP-coarse, the Si particles are larger and more sparsely distributed; and in the HAZ, the Si networks exhibit irregular shapes and distributions.
3.2. Additive Manufacturing Defects
To further determine the three-dimensional morphology and distribution of printing defects, high-energy synchrotron X-ray computed tomography (CT) was performed on cross-sectional samples from the two groups of AMed AlSi10Mg specimens.
Figure 4 presents reconstructed cross-sectional slices obtained using PITRE V3.5 software from direct high-energy X-ray projections of the specimen surfaces in their as-built state. The slice positions are indicated in the top-right corner of the figure. The slice positions were selected essentially at random, and the observed distribution of printing defects does not show any essential difference across locations. As shown in the figure, two typical types of pore-like printing defects can be identified: gas pores and lack-of-fusion defects. Gas pores are relatively small in size with more regular shapes, generally appearing equiaxed or ellipsoidal. In contrast, lack-of-fusion defects are usually larger and more irregular, often formed by the combination of several interconnected pores. Consistent with the observations from the cross-sectional metallographic samples, the second set of specimens with larger layer thickness exhibits an order-of-magnitude higher number of pore-type printing defects in the CT slices, and these defects frequently show larger projected areas.
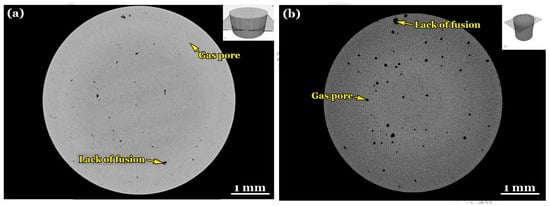
Figure 4.
Defect distributions on cross sections of CT samples for Group-1 (a) and Group-2 (b).
However, metallographic cross sections or CT slices can only reflect the projected characteristics of pore-type printing defects on a single two-dimensional plane and cannot fully represent the three-dimensional distribution of these defects. Therefore, AVIZO Version 2023.1 software was used to stack and reconstruct these slice sets.
In order to quantitatively describe the size and shape of the defects, the equivalent diameter deq and sphericity ds of each defect were calculated using the following equations:
where vd is the defect volume, and sd is the defect surface area. This is because the sphere with diameter deq has the same volume as the defect, while ds represents the ratio of the surface area of the sphere to that of the defect.
Obviously, more and larger pore-type printing defects are distributed in the CT samples of the second group of specimens. For quantitative analysis, Figure 5 presents the frequency histograms and cumulative frequency curves of the equivalent diameters of defects. As shown in Figure 5a, in Group-1, over 93% of the pore-type printing defects have an equivalent diameter smaller than 30 μm. Similarly, in Group-2, more than 88% of the defects are also smaller than 30 μm in equivalent diameter. This indicates that, for both sets of specimens, the vast majority of printing defects are small pores. In Group-1, the largest detected defect size is on the order of 150 μm, with a very low occurrence frequency of only 0.02%. In contrast, the largest detected defect in Group-2 reaches approximately 450 μm, also with a frequency of around 0.02%. Comparing Figure 5a,b, it can be seen that the distributions of pore-type printing defects in both groups follow a similar trend; however, the defect sizes in Group-1 are considerably smaller than those in Group-2. In short, the probability of large defects occurring in Group-2 is more than three times higher than in Group-1, and the maximum defect size in Group-1 is less than one-third of that in Group-2. For both groups, most defects are relatively small, and the probability of occurrence decreases gradually as the equivalent diameter increases.
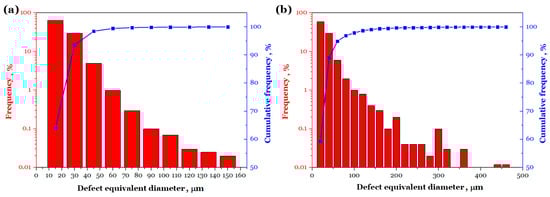
Figure 5.
Defect statistics of Group-1 (a) and Group-2 (b) for the AMed AlSi10Mg.
3.3. Tensile Curves and Fractography
Figure 6 presents the engineering stress–strain curves obtained from uniaxially quasi-static tensile tests conducted in ambient air at room temperature for two sets of the AMed AlSi10Mg specimens. Based on these curves, the elastic modulus (Young’s), yield strength (at 0.2% offset plastic strain), UTS, and elongation after fracture can be determined. The results show that for all these mechanical properties—including elastic modulus, yield strength, UTS, and elongation—the values for Group-2 specimens are lower than those for Group-1.
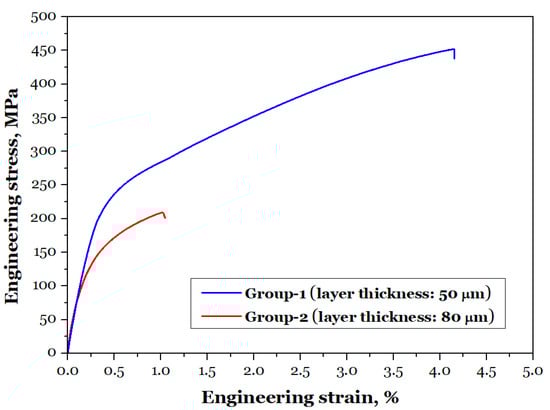
Figure 6.
Tensile curves for the two groups of the AMed AlSi10Mg.
As shown in Figure 7, detailed observations of the quasi-static tensile fracture surfaces of both groups of specimens were conducted using the SEM. Compared with the first group, the fracture surfaces of the second group exhibit a large number of printing defects, which is the fundamental reason for the significant reduction in yield strength and ultimate tensile strength. These pore-type defects greatly weaken the overall stiffness of the specimens. In addition, the reduction in elongation is most likely attributed to the severe stress and strain concentrations around the pore-type defects during monotonic loading, which induce deformation localization and accelerate the damage accumulation process [72].
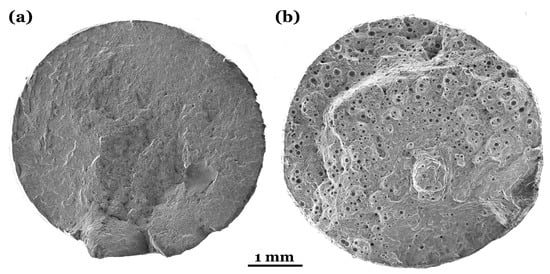
Figure 7.
Representative SEM images of tensile fracture surfaces for Group-1 (a) and Group-2 (b).
4. Low-Cycle and Long-Life Fatigue Performance
4.1. Fatigue Performance Analysis
Figure 8 presents the S-N data for two groups of PBF-LB AlSi10Mg specimens tested in air at room temperature under a stress ratio of R = −1. In the figure, data points marked with arrows represent specimens that did not fracture by the time the number of cycles reached the value indicated on the horizontal axis. Overall, the LCF, HCF, and VHCF performance of Group-1 is consistently superior to that of Group-2. As the number of cycles to failure increases from 3 × 10⁴ to 3 × 10⁶, the HCF limit of the Group-1 decreases from a maximum stress (equal to the stress amplitude) of σmax = 150 MPa to approximately 80 MPa. In contrast, for Group-2, as the number of cycles to failure increases from 7 × 10⁴ to 3 × 10⁶, the HCF limit decreases from σmax = 100 MPa to around 25 MPa. With a further increase in loading cycles, from 106 to 108 under rotating bending conditions, the fatigue limit in terms of maximum stress for Group-1 remains relatively stable in the range of 70–85 MPa. Similarly, the fatigue limit of Group-2 stabilizes in the range of σmax = 15–25 MPa.
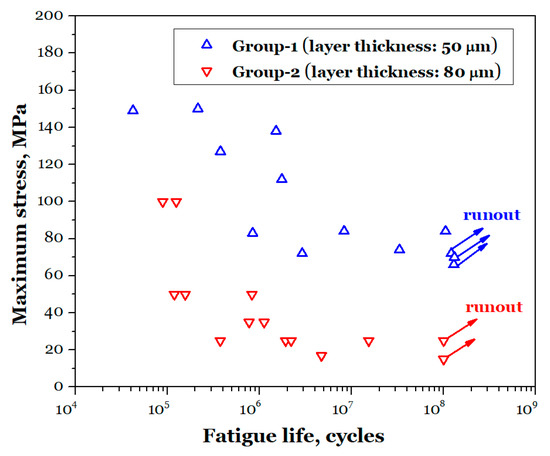
Figure 8.
S-N data for the two groups of the AMed AlSi10Mg.
The S-N data indicate that both groups of the AMed AlSi10Mg specimens exhibit a clear VHCF plateau region under rotating bending loading, while in the HCF regime, the fitting curve of S-N data display a single linear slope. For Group-1 of specimens, the maximum applied number of cycles reached 1.3 × 10⁸, with the highest fatigue fracture cycle count at 1.0 × 10⁸, and a fatigue limit of approximately 70 MPa. In contrast, for Group-2, the maximum applied cycle count was 1.0 × 10⁸, but the highest fatigue fracture cycle count was only 1.5 × 10⁷, with a fatigue limit of approximately 15 MPa. Compared with Group-2, Group-1 demonstrates significantly superior fatigue performance.
4.2. Fatigue Fracture Surface Morphologies
To further investigate how printing defects affect the LCF, HCF, and VHCF behavior of the AMed AlSi10Mg alloys under rotating bending loading, a detailed examination of the fatigue fracture surfaces was performed, according to Ref. [73].
Figure 9 presents the fatigue fracture surfaces under lower cycle conditions, where large un-melted defects are the primary source of crack initiation. In the high value of maximum stress or LCF regime, fatigue cracks tend to initiate from multiple un-melted defects located at or near the surface of the specimens. As shown in the figure, cracks begin to propagate from un-melted defects on several different planes, and as the cracks grow, “ridges” formed by the coalescence of fatigue cracks on different planes can be observed. As the cracks merge, the crack propagation area expands instantaneously. It is evident that the crack initiation mechanism is influenced by the interaction between the maximum stress and surface AM defects. Due to the higher stress levels, multiple cracks simultaneously reach the threshold of the stress intensity factor, leading to concurrent crack propagation [74,75].
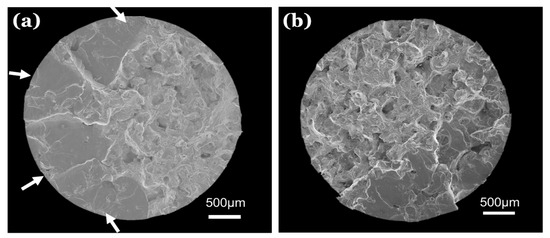
Figure 9.
SEM images showing fracture surfaces of low-cycle fatigue for the AMed AlSi10Mg: (a) Group-1, σmax = 127 MPa, Nf = 3.8 × 10⁵ cycles, arrows show the crack initiation regions; (b) Group-2, σmax = 100 MPa, Nf = 1.2 × 10⁵ cycles.
During the high-cycle and very-high-cycle stages, fatigue failure in both groups of specimens is dominated by a single crack source, as shown in Figure 10 and Figure 11. After initiating from the unfused defects, fatigue cracks propagate into the crack growth region, exhibiting a semi-elliptical morphology. Comparing with the fracture surfaces under ultrasonic axial loading reported by Qian et al. [17], it can be observed that, under rotating bending conditions, cracks tend to initiate from surface and subsurface defects, with few originating from internal defects. This is due to the gradient distribution of stress across the specimen’s depth under rotating bending fatigue, where the maximum stress occurs at the specimen surface, making internal cracking less common. Furthermore, fracture surface analysis reveals that the cracks initiate from unfused defects, not pore defects. This is because, under the same external loading conditions, unfused defects are larger and more irregular in shape, leading to more pronounced stress concentrations, making cracks more likely to initiate from these defects. This indicates that, compared to pore defects, unfused defects are more detrimental.
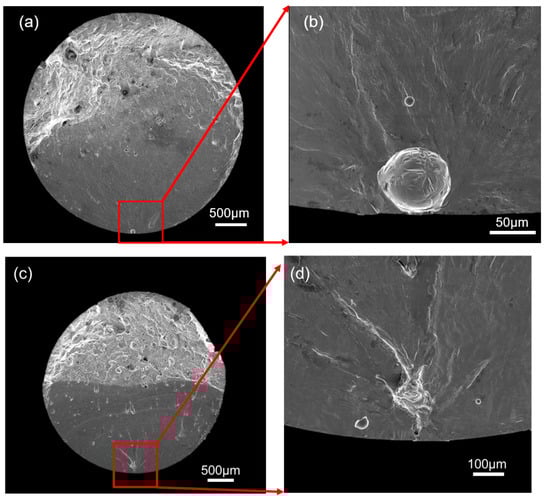
Figure 10.
SEM images showing fracture surfaces of long-life fatigue for Group-1: (a,b) σmax = 112 MPa, Nf = 1.8 × 10⁶ cycles; (c,d) σmax = 74 MPa, Nf = 3.3 × 10⁷ cycles.
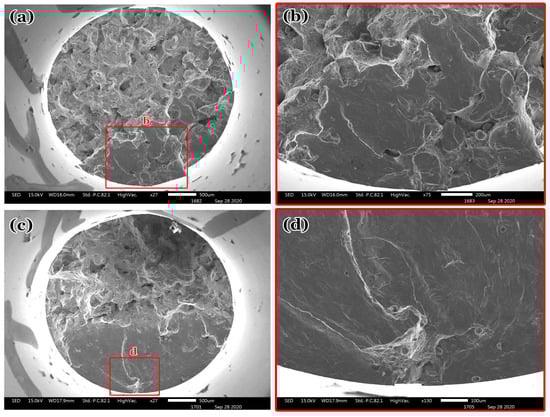
Figure 11.
SEM images showing fracture surfaces of long-life fatigue for Group-2: (a,b) σmax = 25 MPa, Nf = 1.9 × 10⁶ cycles; (c,d) σmax = 25 MPa, Nf = 1.5 × 10⁷ cycles.
4.3. Instantaneous Fracture Surfaces and Features
At the end of the crack initiation stage, its SIF value is comparable to the threshold for long fatigue-crack propagation [76]. As the SIF continues to increase, the crack enters the steady-state growth stage. After the crack enters the stable growth stage, if the SIF value at the fatigue crack tip reaches the material’s fracture toughness, the crack will undergo unstable propagation. Therefore, the area of the unstable fracture zone can, to some extent, reflect the material’s fracture toughness [77,78].
Figure 12 shows the statistical analysis of the proportion of the unstable fracture zone area in the fracture surfaces of both sets of the AMed AlSi10Mg specimens. It can be observed that, with an increase in stress levels, the proportion of the unstable fracture zone area increases. However, for the specimens in Group-1 at 150 MPa and Group-2 at 100 MPa, although the applied maximum stresses are relatively high, the proportion of the unstable fracture surface is comparatively small. This is because, under these loading conditions, the specimens exhibit multiple crack origins, with several cracks propagating simultaneously, leading to more complete crack propagation compared to a single crack source. The smallest proportion of the unstable fracture zone area for Group-1 is 0.36, and the largest is 0.65. For Group-2, the smallest proportion is 0.5, and the largest is 0.82. The proportion of the unstable fracture zone area is significantly higher in Group-2 than in Group-1, indicating a substantial decrease in fracture toughness for Group-2. As seen in the fracture surfaces in Figure 11, a large number of unfused defects can be clearly observed at the crack front in Group-2 specimens. When the fatigue cracks propagate, these aggregated large unfused defects cause the fatigue cracks in Group-2 to undergo more easily unstable propagation, resulting in a decrease in fracture toughness.
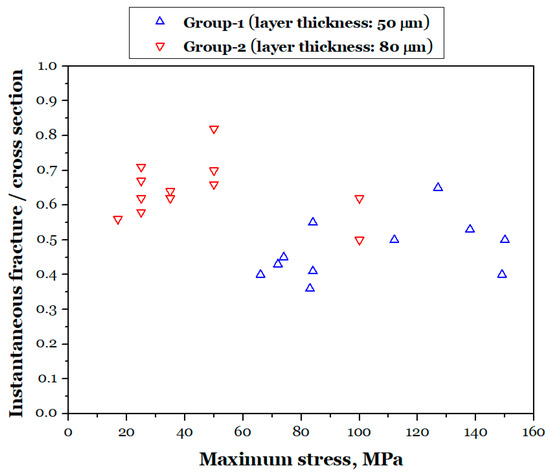
Figure 12.
Area ratio of instantaneous fracture to specimen cross section versus maximum stress.
4.4. Quantification of Fatigue-Dominating Defects
To quantitatively analyze the effect of defect characteristics on the LCF, HCF, and VHCF performance of the AMed AlSi10Mg, ImageJ2 2.16.0 software [79] was used to quantify the characteristic parameters of critical defects in the fracture surfaces of each fatigue specimen. The equivalent defect size was determined using the method proposed by Murakami [25]. The defect depth is defined as the shortest distance from the center of the critical defect to the specimen surface. Additionally, defect sphericity dsa was introduced to describe the defect shape.
In the equation, aread represents the critical defect area; rmax denotes the maximum distance from the defect center to the outer bounding contour of the AM defect; dsa is sphericity, a measure of circular similarity, which is a dimensionless value ranging from 0 to 1, where 0 indicates a highly irregular shape and 1 represents a perfect circle.
Figure 13a illustrates the variation of the equivalent diameter of critical defects on the fracture surface with the number of cyclic loads. It can be observed that, for both groups of specimens, there is no clear correlation between the equivalent diameter of the critical defect inducing crack initiation and fatigue life. For Group-1, the equivalent diameter of defects inducing crack initiation ranges from 62 to 136 me. In contrast, for Group-2, the range is 170 to 454 μm. The data indicate that the critical defect size in Group-2 is significantly larger than in Group-1, with greater variability in defect size.
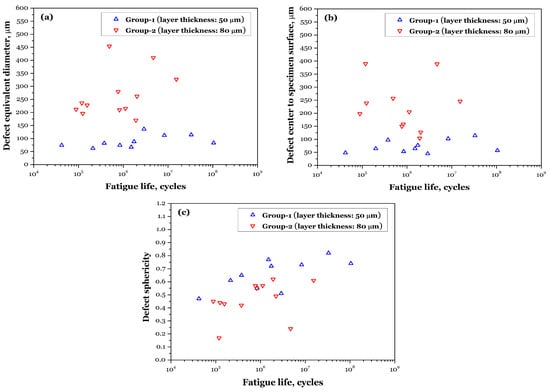
Figure 13.
Fatigue-initiating defects versus failure cycle relationships: (a) size; (b) location; (c) shape.
Figure 13b shows the relationship between the critical defect depth and the number of loading cycles for both groups of specimens. It can be observed that for Group-1, the defect depth ranges from 48 to 114 μm, while for Group-2, the defect depth ranges from 104 to 390 μm. These data suggest that the distribution of defects has a significant impact on the crack initiation location. The larger the defect size, the higher the probability of initiation at a deeper location.
As shown in Figure 13c, the defect sphericity for Group-1 of specimens ranges from 0.47 to 0.82, while for Group-2, it ranges from 0.17 to 0.62. It can be observed that the defects in Group-2 are more irregular in shape. The statistical results for the defect shape parameters indicate that the sphericity of defects in Group-2 is significantly lower than in Group-1, which is consistent with the correlation between defect size and shape observed in the previous CT analysis.
Furthermore, unlike the patterns observed for defect size and depth, as the fatigue life increases, the shape of the critical defects becomes more regular. This suggests that under rotating bending loading conditions, during the HCF and VHCF stages, cracks are more likely to initiate from unfused defects with a more regular shape. Cracks initiated and propagated from such regular-shaped unfused defects consume more fatigue cycles. Therefore, optimizing the process to prevent the formation of unfused defects, especially those with irregular shapes, in AMed components is crucial for enhancing fatigue performance.
From the above fracture surface analysis, it can be seen that fatigue cracks in the AMed AlSi10Mg alloys produced by PBF-LB under rotating bending loading conditions initiate from surface or near-surface unfused defects and gradually propagate, eventually leading to material fracture. The preceding paragraphs quantify the relationship between critical defect characteristics on the fracture surface and fatigue life. From the perspective of fracture mechanics, defects in the material can be assumed to be cracks. When the SIF at the crack tip reaches the threshold [76] for crack growth, the crack will begin to expand. To quantitatively characterize the relationship between AM defect (at specimen surface) induced fatigue crack initiation and early-stage growth behavior [80], this section uses the maximum stress of the SIF at the crack tip to describe it. The calculation method for the SIF of surface and internal (subsurface) defects are given by Equations (6) and (7), respectively.
Figure 14 shows the distribution of the SIF at the critical defects in both groups of specimens as a function of fatigue life cycles. For Group-1, the SIF at the critical defects ranges from approximately 0.78 to 1.39 MPa·m1/2. For Group-2, the SIF at the defects inducing crack initiation ranges from approximately 0.35 to 1.58 MPa·m1/2. From the data, it can be seen that for Group-2, the presence of a large number and size of unfused defects reduces the intrinsic properties of the AMed material, and the threshold for crack initiation and early growth is significantly lowered.
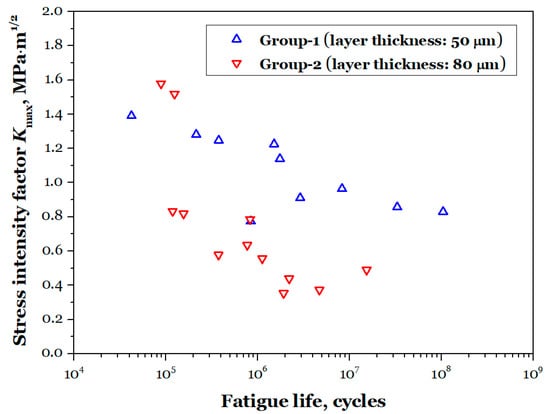
Figure 14.
Stress intensity factor Kmax on fatigue-initiating defect versus failure cycle.
5. Conclusions
By using rotating bending and failure analysis, this paper investigates the low-cycle, high-cycle, and very-high-cycle fatigue behavior of the AMed AlSi10Mg via PBF-LB with horizontal printing. The study focuses on two different processing parameters: powder layer thickness of 50 μm and 80 μm, corresponding to laser energy densities of 29.95 and 18.72 J/mm3. The following conclusions can be drawn:
1. Under rotating bending cyclic loading conditions, cracks initiate from surface or near-surface defects. Under high-cycle stress or low-cycle conditions, cracks tend to exhibit multi-source cracking characteristics. In the low-stress or very-high-cycle phase, fatigue cracks initiate from a single crack source.
2. The powder bed thickness has a significant impact on tensile and fatigue properties. The second batch of specimens contains more and larger unfused defects. The tensile and fatigue performance of the first batch (50 μm layer thickness) is much higher than that of the second batch (80 μm layer thickness).
3. The fracture resistance of the second batch of specimens (80 μm layer thickness) is significantly lower than that of the first batch (50 μm layer thickness). The presence of AM defects in the material reduces the crack propagation threshold and fracture toughness of the AMed alloy.
Author Contributions
Conceptualization, L.L., Y.M. and S.W.; methodology, L.L.; investigation, L.L., Y.M. and S.W.; resources, L.L., Y.M. and S.W.; data curation, L.L.; writing—original draft preparation, L.L.; writing—review and editing, L.L. and S.W.; visualization, L.L. and Y.M.; supervision, S.W.; project administration, L.L. and S.W.; funding acquisition, L.L. and S.W. All authors have read and agreed to the published version of the manuscript.
Funding
This research was funded by Science Fund for Creative Research of Xi’an aerospace Propulsion Institute, grant number 2025Da.YY4006Da.
Data Availability Statement
Data will be made available on request.
Acknowledgments
We would like to express our sincere gratitude to the laboratory staff who have been instrumental in the successful completion of this research. Their expertise and dedication have been invaluable throughout the entire experimental process. We are also extremely thankful to the Xi’an Aerospace Propulsion Institute for their generous support.
Conflicts of Interest
The authors declare no conflicts of interest. The funders had no role in the design of the study; in the collection, analyses, or interpretation of data; in the writing of the manuscript; or in the decision to publish the results.
Abbreviations
The following abbreviations are used in this manuscript:
| AM | Additive manufacturing |
| AMed | Additively manufactured |
| CT | Computed tomography |
| HAZ | Heat affected zone |
| HCF | High-cycle fatigue |
| MP-coarse | Melt pool coarse zone |
| MP-fine | Melt pool fine zone |
| OM | Optical microscope |
| PBF-LB | Powder bed fusion-laser beam |
| SEM | Scanning electron microscope |
| SIF | Stress intensity factor |
| UTS | Ultimate tensile strength |
| VHCF | Very-high-cycle fatigue |
References
- DebRoy, T.; Wei, H.L.; Zuback, J.S.; Mukherjee, T.; Elmer, J.W.; Milewski, J.O.; Beese, A.M.; Wilson-Heid, A.; De, A.; Zhang, W. Additive manufacturing of metallic components—Process, structure and properties. Prog. Mater. Sci. 2018, 92, 112–224. [Google Scholar] [CrossRef]
- Zenou, M.; Grainger, L. Additive manufacturing of metallic materials. In Additive Manufacturing: Materials, Processes, Quantifications and Applications; Zhang, J., Jung, Y.-G., Eds.; Butterworth-Heinemann: Oxford, UK, 2018; pp. 53–103. [Google Scholar]
- Leary, M. Design for Additive Manufacturing; Elsevier: Amsterdam, The Netherlands, 2020. [Google Scholar]
- Gibson, I.; Rosen, D.; Stucker, B.; Khorasani, M. Additive Manufacturing Technologies, 3rd ed.; Springer: Cham, Switzerland, 2021. [Google Scholar]
- Su, J.L.; Jiang, F.L.; Teng, J.; Chen, L.Q.; Yan, M.; Requena, G.; Zhang, L.C.; Wang, Y.M.; Okulov, I.; Zhu, H.M.; et al. Recent innovations in laser additive manufacturing of titanium alloys. Int. J. Extrem. Manuf. 2024, 6, 032001. [Google Scholar] [CrossRef]
- BS EN ISO/ASTM 52900:2021; Additive Manufacturing—General Principles—Fundamentals and Vocabulary. BSI Standard Limited: London, UK, 2022.
- Gong, H.; Rafi, K.; Gu, H.; Starr, T.; Stucker, B. Analysis of defect generation in Ti–6Al–4V parts made using powder bed fusion additive manufacturing processes. Addit. Manuf. 2014, 1–4, 87–98. [Google Scholar] [CrossRef]
- King, W.E.; Anderson, A.T.; Ferencz, R.M.; Hodge, N.E.; Kamath, C.; Khairallah, S.A.; Rubenchik, A.M. Laser powder bed fusion additive manufacturing of metals; physics, computational, and materials challenges. Appl. Phys. Rev. 2015, 2, 041304. [Google Scholar] [CrossRef]
- Liu, Z.Z.; Zhou, Q.H.; Liang, X.K.; Wang, X.B.; Li, G.C.; Vanmeensel, K.; Xie, J.X. Alloy design for laser powder bed fusion additive manufacturing: A critical review. Int. J. Extreme Manuf. 2024, 6, 022002. [Google Scholar] [CrossRef]
- Chua, C.; Liu, Y.T.; Williams, R.J.; Chua, C.K.; Sing, S.L. In-process and post-process strategies for part quality assessment in metal powder bed fusion: A review. J. Manuf. Syst. 2024, 73, 75–105. [Google Scholar] [CrossRef]
- Qian, G.; Jian, Z.; Pan, X.; Berto, F. In-situ investigation on fatigue behaviors of Ti-6Al-4V manufactured by selective laser melting. Int. J. Fatigue 2020, 133, 105424. [Google Scholar] [CrossRef]
- Du, L.; Pan, X.; Qian, G.; Zheng, L.; Hong, Y. Crack initiation mechanisms under two stress ratios up to very-high-cycle fatigue regime for a selective laser melted Ti-6Al-4V. Int. J. Fatigue 2021, 149, 106294. [Google Scholar] [CrossRef]
- Long, X.; Jia, Q.; Li, J.; Chong, K.; Du, L.; Pan, X.; Chang, C. Mechanical properties and parameter optimization of TC4 alloy by additive manufacturing. China Surf. Eng. 2022, 35, 215–223. (In Chinese) [Google Scholar]
- Tao, Z.; Wang, Z.; Pan, X.; Su, T.; Long, X.; Liu, B.; Tang, Q.; Ren, X.; Sun, C.; Qian, G.; et al. A new probabilistic control volume scheme to interpret specimen size effect on fatigue life of additively manufactured titanium alloys. Int. J. Fatigue 2024, 183, 108262. [Google Scholar] [CrossRef]
- Du, L.; Pan, X.; Hong, Y. New insights into microstructure refinement in crack initiation region of very-high-cycle fatigue for SLM Ti-6Al-4V via precession electron diffraction. Materialia 2024, 33, 102008. [Google Scholar] [CrossRef]
- Gao, C.; Zhang, Y.; Jiang, J.; Fu, R.; Du, L.; Pan, X. Research viewpoint on performance enhancement for very-high-cycle fatigue of Ti-6Al-4V alloys via laser-based powder bed fusion. Crystals 2024, 14, 749. [Google Scholar] [CrossRef]
- Qian, G.; Jian, Z.; Qian, Y.; Pan, X.; Ma, X.; Hong, Y. Very-high-cycle fatigue behavior of AlSi10Mg manufactured by selective laser melting: Effect of build orientation and mean stress. Int. J. Fatigue 2020, 138, 105696. [Google Scholar] [CrossRef]
- Pan, X.; Du, L.; Qian, G.; Hong, Y. Microstructure features induced by fatigue crack initiation up to very-high-cycle regime for an additively manufactured aluminium alloy. J. Mater. Sci. Technol. 2024, 173, 247–260. [Google Scholar] [CrossRef]
- Pan, X.; Hong, Y. High-cycle and very-high-cycle fatigue of an additively manufactured aluminium alloy under axial cycling at ultrasonic and conventional frequencies. Int. J. Fatigue 2024, 185, 108363. [Google Scholar] [CrossRef]
- Han, Q.; Gu, Y.; Setchi, R.; Lacan, F.; Johnston, R.; Evans, S.L.; Yang, S. Additive manufacturing of high-strength crack-free Ni-based Hastelloy X superalloy. Addit. Manuf. 2019, 30, 100919. [Google Scholar] [CrossRef]
- Yu, H.; Zhao, Q.; Fu, J.; Hu, Y.; Liang, J.; Li, J.; Xu, W. The design of oxidation resistant Ni superalloys for additive manufacturing. Addit. Manuf. 2025, 97, 104616. [Google Scholar] [CrossRef]
- Xu, S.; Pan, S.; Li, Z.; Li, S.; He, X.; Pan, X. Anisotropic tensile behavior and fracture characteristics of an additively manufactured nickel alloy without and with a heat treatment of solution aging. Mater. Sci. Eng. A 2025, 927, 148015. [Google Scholar] [CrossRef]
- Romano, S.; Brückner-Foit, A.; Brandão, A.; Gumpinger, J.; Ghidini, T.; Beretta, S. Fatigue properties of AlSi10Mg obtained by additive manufacturing: Defect-based modelling and prediction of fatigue strength. Eng. Fract. Mech. 2018, 187, 165–189. [Google Scholar] [CrossRef]
- Suresh, S. Fatigue of Materials, 2nd ed.; Cambridge University Press: Cambridge, UK, 1998. [Google Scholar]
- Murakami, Y. Metal Fatigue: Effect of Small Defects and Nonmetallic Inclusions; Elsevier: Oxford, UK, 2002. [Google Scholar]
- Bathias, C.; Paris, P. Gigacycle Fatigue in Mechanical Practice; Marcel Dekker: New York, NY, USA, 2005. [Google Scholar]
- Schijve, J. Fatigue of Structures and Materials, 2nd ed.; Springer: Dordrecht, Germany, 2009. [Google Scholar]
- Balachandramurthi, A.R.; Moverare, J.; Dixit, N.; Pederson, R. Influence of defects and as-built surface roughness on fatigue properties of additively manufactured Alloy 718. Mater. Sci. Eng. A 2018, 735, 463–474. [Google Scholar] [CrossRef]
- Shao, S.; Khonsari, M.M.; Guo, S.; Meng, W.J.; Li, N. Overview: Additive manufacturing enabled accelerated design of Ni-based alloys for improved fatigue life. Addit. Manuf. 2019, 29, 100779. [Google Scholar] [CrossRef]
- Sanaei, N.; Fatemi, A. Defects in additive manufactured metals and their effect on fatigue performance: A state-of-the-art review. Prog. Mater. Sci. 2021, 117, 100724. [Google Scholar] [CrossRef]
- Avateffazeli, M.; Haghshenas, M. Ultrasonic fatigue of laser beam powder bed fused metals: A state-of-the-art review. Eng. Fail. Anal. 2022, 134, 106015. [Google Scholar] [CrossRef]
- Peng, X.; Wu, S.; Qian, W.; Bao, J.; Hu, Y.; Zhan, Z.; Guo, G.; Withers, P.J. The potency of defects on fatigue of additively manufactured metals. Int. J. Mech. Sci. 2022, 221, 107185. [Google Scholar] [CrossRef]
- Hu, Y.; Wu, S.; Wu, Z.; Wu, W.; Qian, W. Integrity of Additively Manufactured Advanced Materials and Structures; National Defense Industry Press: Beijing, China, 2023. [Google Scholar]
- Afazov, S.; Serjouei, A.; Hickman, G.J.; Mahal, R.; Goy, D.; Mitchell, I. Defect-based fatigue model for additive manufacturing. Prog. Addit. Manuf. 2023, 8, 1059–1066. [Google Scholar] [CrossRef]
- Karakas, O.; Kardes, F.B.; Foti, P.; Berto, F. An overview of factors affecting high-cycle fatigue of additive manufacturing metals. Fatigue Fract. Eng. Mater. Struct. 2023, 46, 1649–1668. [Google Scholar] [CrossRef]
- Javidrad, H.; Koc, B.; Bayraktar, H.; Simsek, U.; Gunaydin, K. Fatigue performance of metal additive manufacturing: A comprehensive overview. Virtual Phys. Prototy. 2024, 19, e2302556. [Google Scholar] [CrossRef]
- Matušů, M.; Džuberová, L.; Papuga, J.; Rosenthal, J.; Šimota, J.; Beránek, L. Fatigue analysis and heat treatment comparison of additively manufactured specimens from AlSi10Mg alloy. Int. J. Fatigue 2024, 185, 108357. [Google Scholar] [CrossRef]
- Yi, M.; Tang, W.; Zhu, Y.; Liang, C.; Tang, Z.; Yin, Y.; He, W.; Sun, S.; Su, S. A holistic review on fatigue properties of additively manufactured metals. J. Mater. Process. Technol. 2024, 329, 118425. [Google Scholar] [CrossRef]
- Naito, T.; Ueda, H.; Kikuchi, M. Observation of fatigue fracture surface of carburized steel. J. Soc. Mater. Sc. 1983, 32, 1162–1166. (In Japanese) [Google Scholar] [CrossRef]
- Atrens, A.; Hoffelner, W.; Duerig, T.W.; Allison, J.E. Subsurface crack initiation in high cycle fatigue in Ti6Al4V and in a typical martensitic stainless steel. Scr. Metall. 1983, 17, 601–606. [Google Scholar] [CrossRef]
- Chang, Y.; Zheng, L.; Pan, X.; Hong, Y. Further investigation on microstructure refinement of internal crack initiation region in VHCF regime of high-strength steels. Frat. Integrità Strutt. 2019, 13, 1–11. [Google Scholar] [CrossRef]
- Sun, C.; Song, Q.; Zhou, L.; Pan, X. Characteristic of interior crack initiation and early growth for high cycle and very high cycle fatigue of a martensitic stainless steel. Mater. Sci. Eng. A 2019, 758, 112–120. [Google Scholar] [CrossRef]
- Pan, X.; Qian, G.; Wu, S.; Fu, Y.; Hong, Y. Internal crack characteristics in very-high-cycle fatigue of a gradient structured titanium alloy. Sci. Rep. 2020, 10, 4742. [Google Scholar] [CrossRef] [PubMed]
- Pan, X.; Xu, S.; Qian, G.; Nikitin, A.; Shanyavskiy, A.; Palin-Luc, T.; Hong, Y. The mechanism of internal fatigue-crack initiation and early growth in a titanium alloy with lamellar and equiaxed microstructure. Mater. Sci. Eng. A 2020, 798, 140110. [Google Scholar] [CrossRef]
- Chang, Y.; Pan, X.; Zheng, L.; Hong, Y. Microstructure refinement and grain size distribution in crack initiation region of very-high-cycle fatigue regime for high-strength alloys. Int. J. Fatigue 2020, 134, 105473. [Google Scholar] [CrossRef]
- Cong, T.; Qian, G.; Zhang, G.; Wu, S.; Pan, X.; Du, L.; Liu, X. Effects of inclusion size and stress ratio on the very-high-cycle fatigue behavior of pearlitic steel. Int. J. Fatigue 2021, 142, 105958. [Google Scholar] [CrossRef]
- Zhou, Y.; Sun, J.; Pan, X.; Qian, G.; Hong, Y. Microstructure evolution and very-high-cycle fatigue crack initiation behavior of a structural steel with two loading intermittence modes. Int. J. Fatigue 2022, 161, 106904. [Google Scholar] [CrossRef]
- Pan, X.; Su, H.; Liu, X.; Hong, Y. Multi-scale fatigue failure features of titanium alloys with equiaxed or bimodal microstructures from low-cycle to very-high-cycle loading numbers. Mater. Sci. Eng. A 2024, 890, 145906. [Google Scholar] [CrossRef]
- Pan, X.; Xu, S.; Nikitin, A.; Shanyavskiy, A.; Palin-Luc, T.; Hong, Y. Crack initiation induced nanograins and facets of a titanium alloy with lamellar and equiaxed microstructure in very-high-cycle fatigue. Mater. Lett. 2024, 357, 135769. [Google Scholar] [CrossRef]
- Günther, J.; Krewerth, D.; Lippmann, T.; Leuders, S.; Tröster, T.; Weidner, A.; Biermann, H.; Niendorf, T. Fatigue life of additively manufactured Ti–6Al–4V in the very high cycle fatigue regime. Int. J. Fatigue 2017, 94, 236–245. [Google Scholar] [CrossRef]
- Tridello, A.; Fiocchi, J.; Biffi, C.A.; Rossetto, M.; Tuissi, A.; Paolino, D.S. Effect of microstructure, residual stresses and building orientation on the fatigue response up to 109 cycles of an SLM AlSi10Mg alloy. Int. J. Fatigue 2022, 160, 106825. [Google Scholar] [CrossRef]
- Tusher, M.M.H.; Ince, A. Effect of stress-relieved heat treatment on very high cycle fatigue performance of additive manufactured Ti-6Al-4V alloy. Fatigue Fract. Eng. Mater. Struct. 2023, 46, 3982–4000. [Google Scholar] [CrossRef]
- Tusher, M.M.H.; Ince, A. A systematic review on high cycle and very high cycle fatigue behavior of laser powder bed fused (L-PBF) Al-Si alloys. Eng. Fail. Anal. 2023, 154, 107667. [Google Scholar] [CrossRef]
- Brot, G.; Koutiri, I.; Bonnand, V.; Favier, V.; Dupuy, C.; Ranc, N.; Aimedieu, P.; Lefebvre, F.; Hauteville, R. Microstructure and defect sensitivities in the very high-cycle fatigue response of laser powder bed fused Ti-6Al-4V. Int. J. Fatigue 2023, 174, 107710. [Google Scholar] [CrossRef]
- Lopes, J.H.; da Costa, P.R.; Freitas, M.; Reis, L. Review on the fatigue strength of additively manufactured metal materials under the very high cycle fatigue. Fatigue Fract. Eng. Mater. Struct. 2025, 48, 979–1000. [Google Scholar] [CrossRef]
- Tahmasbi, K.; Yaghoobi, M.; Shao, S.; Shamsaei, N.; Haghshenas, M. Simulated effect of defect volume and location on very high cycle fatigue of laser beam powder bed fused AlSi10Mg. Int. J. Fatigue 2025, 197, 108926. [Google Scholar] [CrossRef]
- Wöhler, A. Bericht über die Versuche, welche auf der Königl. Niederschlesisch-Märkischen Eisenbahn mit Apparaten zum Messen der Biegung und Verdrehung von Eisenbahnwagen-Achsen während der Fahrt, angestellt wurden. Z. Bauwes. 1858, 8, 642–652. [Google Scholar]
- Wöhler, A. Versuche zur Ermittlung der auf die Eisenbahnwagen-Achsen einwirkenden Kräfte und der Widerstandsfähigkeit der Wagen-Achsen. Z. Bauwes. 1860, 10, 548–616. [Google Scholar]
- Wöhler, A. Wöhler’s experiments on the strength of metals. Engineering 1867, 4, 160–161. [Google Scholar]
- Sakai, T.; Takeda, M.; Shiozawa, K.; Ochi, Y.; Nakajima, M.; Nakamura, T.; Oguma, N. Experimental reconfirmation of characteristic S-N property for high carbon chromium bearing steel in wide life region in rotating bending. J. Soc. Mater. Sci. 2000, 49, 779–785. (In Japanese) [Google Scholar] [CrossRef]
- Goto, M.; Yamamoto, T.; Nisitani, H.; Sakai, T.; Kawagoishi, N. Effect of removing surface hardened layer on the fatigue strength of bearing steel SUJ2 ground specimen in the long life field. J. Soc. Mater. Sci. 2000, 49, 786–792. (In Japanese) [Google Scholar] [CrossRef]
- Sakai, T. Review and prospects for current studies on very high cycle fatigue of metallic materials for machine structural use. J. Solid Mech. Mater. Eng. 2009, 3, 425–439. [Google Scholar] [CrossRef]
- Hong, Y.; Hu, Y.; Zhao, A. Effects of loading frequency on fatigue behavior of metallic materials—A literature review. Fatigue Fract. Eng. Mater. Struct. 2023, 46, 3077–3098. [Google Scholar] [CrossRef]
- Uematsu, Y.; Kakiuchi, T.; Han, Y.; Nakajima, M. Proposal of fatigue limit design curves for additively manufactured ti-6al-4v in a vhcf regime using specimens with artificial defects. Metals 2021, 11, 964. [Google Scholar] [CrossRef]
- Behvar, A.; Berto, F.; Haghshenas, M. A review on isothermal rotating bending fatigue failure: Microstructural and lifetime modeling of wrought and additive manufactured alloys. Fatigue Fract. Eng. Mater. Struct. 2023, 46, 3545–3595. [Google Scholar] [CrossRef]
- Nakamura, G.; Iwasaka, A.; Furuya, Y.; Takahashi, K. Effects of laser peening on rotating bending fatigue strength of additive manufactured maraging steel in very high cycle fatigue regime. Tetsu--Hagane 2025, 111, 9–19. (In Japanese) [Google Scholar] [CrossRef]
- Thijs, L.; Verhaeghe, F.; Craeghs, T.; Humbeeck, J.; Kruth, J. A study of the microstructural evolution during selective laser melting of Ti-6Al-4V. Acta Mater. 2010, 58, 3303–3312. [Google Scholar] [CrossRef]
- Keller, F. The macroetching of aluminum and its alloys. Trans. Am. Soc. Met. 1956, 46, 1024–1032. [Google Scholar]
- Chen, R.C.; Dreossi, D.; Mancini, L.; Menk, R.; Rigon, L.; Xiao, T.Q.; Longo, R. PITRE: Software for phase-sensitive X-ray image processing and tomography reconstruction. J. Synchrotron Radiat. 2012, 19, 836–845. [Google Scholar] [CrossRef]
- Thermo Fisher Scientific. AVIZO, Version 2023.1; Thermo Fisher Scientific: Waltham, MA, USA, 2023. [Google Scholar]
- Pilkey, W.D.; Pilkey, D.F. Peterson’s Stress Concentration Factors, 3rd ed.; John Wiley & Sons: Hoboken, NJ, USA, 2008. [Google Scholar]
- Pan, X.; Qian, G.; Hong, Y. Nanograin formation in dimple ridges due to local severe-plastic-deformation during ductile fracture. Scr. Mater. 2021, 194, 11363. [Google Scholar] [CrossRef]
- Hull, D. Fractography: Observing, Measuring and Interpreting Fracture Surface Topography; Cambridge University Press: Cambridge, UK, 1999. [Google Scholar]
- Liu, L.; Ma, Y.; Liu, S.; Wang, S. The fatigue behaviors of a medium-carbon pearlitic wheel-steel with elongated sulfides in high-cycle and very-high-cycle regimes. Materials 2021, 14, 4318. [Google Scholar] [CrossRef] [PubMed]
- Liu, L.; Wang, S.; Ma, Y. Research of rotating and ultrasonic cycling fatigue in high-cycle regimes. J. Aeronaut. Mater. 2024, 44, 142–150. (In Chinese) [Google Scholar]
- Pan, X.; Hong, Y. High-cycle and very-high-cycle fatigue behaviour of a titanium alloy with equiaxed microstructure under different mean stresses. Fatigue Fract. Eng. Mater. Struct. 2019, 42, 1950–1964. [Google Scholar] [CrossRef]
- Marșavina, L.; Stoia, D.I.; Emanoil, L. Fracture toughness in additive manufacturing by selective laser sintering: An overview. Mater. Des. Process. Commun. 2021, 3, e254. [Google Scholar] [CrossRef]
- Araújo, L.C.; Gabriel, A.H.G.; da Fonseca, E.B.; Avila, J.A.; Jardini, A.L.; Junior, R.S.; Lopes, É.S.N. Effects of build orientation and heat treatments on the tensile and fracture toughness properties of additively manufactured AlSi10Mg. Int. J. Mech. Sci. 2022, 213, 106868. [Google Scholar] [CrossRef]
- Schneider, C.A.; Rasband, W.S.; Eliceiri, K.W. NIH Image to ImageJ: 25 years of image analysis. Nat. Methods 2012, 9, 671–675. [Google Scholar] [CrossRef]
- Pan, X.; Su, H.; Sun, C.; Hong, Y. The behavior of crack initiation and early growth in high-cycle and very-high-cycle fatigue regimes for a titanium alloy. Int. J. Fatigue 2018, 115, 67–78. [Google Scholar] [CrossRef]
Disclaimer/Publisher’s Note: The statements, opinions and data contained in all publications are solely those of the individual author(s) and contributor(s) and not of MDPI and/or the editor(s). MDPI and/or the editor(s) disclaim responsibility for any injury to people or property resulting from any ideas, methods, instructions or products referred to in the content. |
© 2025 by the authors. Licensee MDPI, Basel, Switzerland. This article is an open access article distributed under the terms and conditions of the Creative Commons Attribution (CC BY) license (https://creativecommons.org/licenses/by/4.0/).