Article

Machine Learning Unveils the Impacts of Key Elements and Their Interaction on the Ambient-Temperature Tensile Properties of Cast Titanium Aluminides Employing SHAP Analysis

1
Advanced Materials Additive Manufacturing Innovation Research Center, School of Engineering, Hangzhou City University, Hangzhou 310015, China
2
School of Science, Zhejiang University of Science and Technology, 318 Liuhe Road, Xihu District, Hangzhou 310023, China
*
Authors to whom correspondence should be addressed.
Crystals 2025, 15(5), 468; https://doi.org/10.3390/cryst15050468
Submission received: 22 April 2025 / Revised: 13 May 2025 / Accepted: 14 May 2025 / Published: 16 May 2025

Abstract

:
This study facilitates the data-driven design of novel cast TiAl alloys by systematically investigating the critical elements and their interactions affecting room-temperature (RT) tensile properties by the machine learning method based on SHAP analysis. Comparative analysis of three algorithms within the training dataset proved the random forest regression (RFR) as the optimal modeling approach. To evaluate model performance and prevent overfitting, leave-one-out cross-validation (LOOCV) was simultaneously implemented during training. All the three well-trained models demonstrated robust predictive capabilities for ultimate tensile strength (UTS), elongation (EL), and yield strength (YS). Detailed investigation on both the magnitude and directionality of feature importance and interaction disclosed distinct elemental influences: B, C, and Nb predominantly improved UTS and YS, while Cr, Mn, and Al positively affected EL. The highly probable direction of feature interaction between two different elements on the RT tensile properties of cast TiAl alloys was basically revealed. Notably, Al–B interactions enhance UTS at Al < 45.5 at%; Cr–Mn synergistically improves EL when Cr > 1 at%; both Al–B and Al–C interactions boost YS within 44–46 at% Al. Despite a slight distinction in casting technology, this research established a qualitative relationship between the chemical elements and the RT tensile properties of TiAl alloys, providing design recommendations for cast TiAl alloys with excellent RT tensile properties.

1. Introduction

Among high-temperature structural materials, TiAl alloys demonstrate exceptional promise due to their low density (~4.0 g/cm3), high specific strength/modulus, and superior oxidation/creep resistance at elevated temperatures [1,2,3,4,5,6,7,8]. They are partially utilized in aero-engines and automotive sectors [9,10]. In 2006, the GE company announced that Ti-48Al-2Cr-2Nb alloy (48-2-2) blades processed by the investment casting method were successfully applied to 6th–7th stage low-pressure turbine blades of GEnxTM aero-engines, which is the first time that TiAl alloy has been applied to the rotating parts of commercial aero-engines [9]. However, there remains a significant gap before they can achieve large-scale industrial application. The primary reason for this gap is that three major shortcomings of TiAl alloys have yet to be effectively addressed. These shortcomings include room-temperature (RT) brittleness, poor formability, and relatively low strength [11,12,13]. The above-mentioned shortcomings in mechanical properties of TiAl alloys can be reflected well by the metric of RT tensile properties. Figure 1 presents the overview of RT tensile properties of typical TiAl alloys; it indicates that the RT tensile strength and elongation of cast TiAl alloys are usually less than 700 MPa and 2.5%, respectively. Therefore, it is very important to further improve RT tensile properties of cast TiAl alloys.
To enhance TiAl alloys for engineering applications, researchers are focusing on improving both strength and RT ductility through alloying. Alloying is the most basic and effective way to improve the RT tensile properties of cast TiAl alloy. This essential method modifies phase composition, phase content, microstructure, and mechanical behavior by adding specific alloy elements [14,15]. On the one hand, the addition of alloy elements in different species and content can effectively modify the phase composition and content of TiAl alloys. The alloying elements commonly used in TiAl alloy can mainly be divided into three categories: namely, β stabilizing element (mainly including Nb, Cr, Mn, V, etc.) [16], α stabilizing element (mainly including C, Si, O, etc.) [15] and further elements (which possess little effect on the range of each phase region on the phase diagram, mainly including B, Y, Er, etc.) [15]. On the other hand, microstructures of TiAl alloy can be significantly refined by the alloying method. For example, the grain size can be effectively refined by adding appropriate alloying elements, mainly including Nb, Mo, W, Ta, Mn, B, C, and Y [17,18,19,20,21]. However, traditional trial-and-error approaches for a novel composition or composition optimization of TiAl alloys are time-intensive, and experimental methods struggle to reveal synergistic effects of multiple elements on tensile properties.
To resolve these challenges, machine learning has emerged as a pivotal approach for sustainable alloy design [22,23,24]. It enables mechanical property prediction through input variables [25,26], widely applied in metal materials, especially for high entropy alloys [27,28,29,30,31,32]. Machine learning methods are highly beneficial for developing new alloys and accelerating the alloy design process [33,34]. Current machine-learning-driven TiAl alloy research remains nascent. Kwak et al. [35,36,37] tried to predict the mechanical properties, including RT tensile properties, nanoindentation hardness, and compressive properties of directionally solidified TiAl alloys using models of multiple linear regression and random forest regression. It was confirmed that elongation is more closely related to input variables (composition, input power, pulling speed) than tensile strength. By using double input variables, the relationships among tensile strength and elongation, nanoindentation hardness, and interlamellar space were observed. Feature importance analysis identified temperature and Er as dominant factors for compressive strength and strain, respectively. However, existing studies focus solely on single-element impacts on the mechanical properties via feature importance. Notably, cast TiAl alloys differ fundamentally from directional solidified variants: cast alloys require fine-grained microstructures, while directional solidification aims for single crystals. Consequently, obvious gaps currently persist in the research on the machine-learning-driven design of novel cast TiAl alloys and the interaction of two alloy elements on the mechanical properties of TiAl alloy.
In contemporary machine learning practice, performing model interpretation has become an essential process to systematically elucidate and understand the operational mechanisms, predictive outcomes, and decision-making rationale of computational models. While sophisticated architectures, like deep neural networks and ensemble methods (e.g., XGBoost, LightGBM), demonstrate superior predictive capabilities, their inherent complexity often renders them functionally opaque, earning the designation of “black-box” systems due to the inherent challenges in explicating their internal decision pathways. To address this interpretability challenge, SHapley Additive exPlanations (SHAP) has emerged as a prominent solution framework grounded in cooperative game theory principles. This innovative methodology operates by quantifying feature importance through rigorous value allocation mechanisms, thereby enabling mathematically-grounded interpretation of model outputs. By employing Shapley values from game theory, SHAP provides a unified metric to precisely determine each feature’s relative contribution to individual predictions, effectively bridging the gap between model performance and interpretability requirements [38,39,40].
This study employs the SHAP interpretability framework to systematically investigate the intrinsic correlations between chemical composition and RT tensile properties of cast TiAl alloys, leveraging existing empirical datasets from published studies, which mainly includes two aspects: one was to analyze the influence of single alloying element on RT tensile properties through feature importance; the other was to investigate the interaction of two different alloying elements on RT tensile properties through feature interaction. The research provides a computational foundation for inverse design of next-generation cast TiAl alloys through machine-learning-driven composition optimization, effectively bridging materials informatics with metallurgical engineering principles.

2. Methods

Our overall interpretative frame for the relationship between alloy elements and the RT tensile properties of cast TiAl alloy, including database preparation, model construction and evaluation, and model interpretation, is shown in Figure 2.

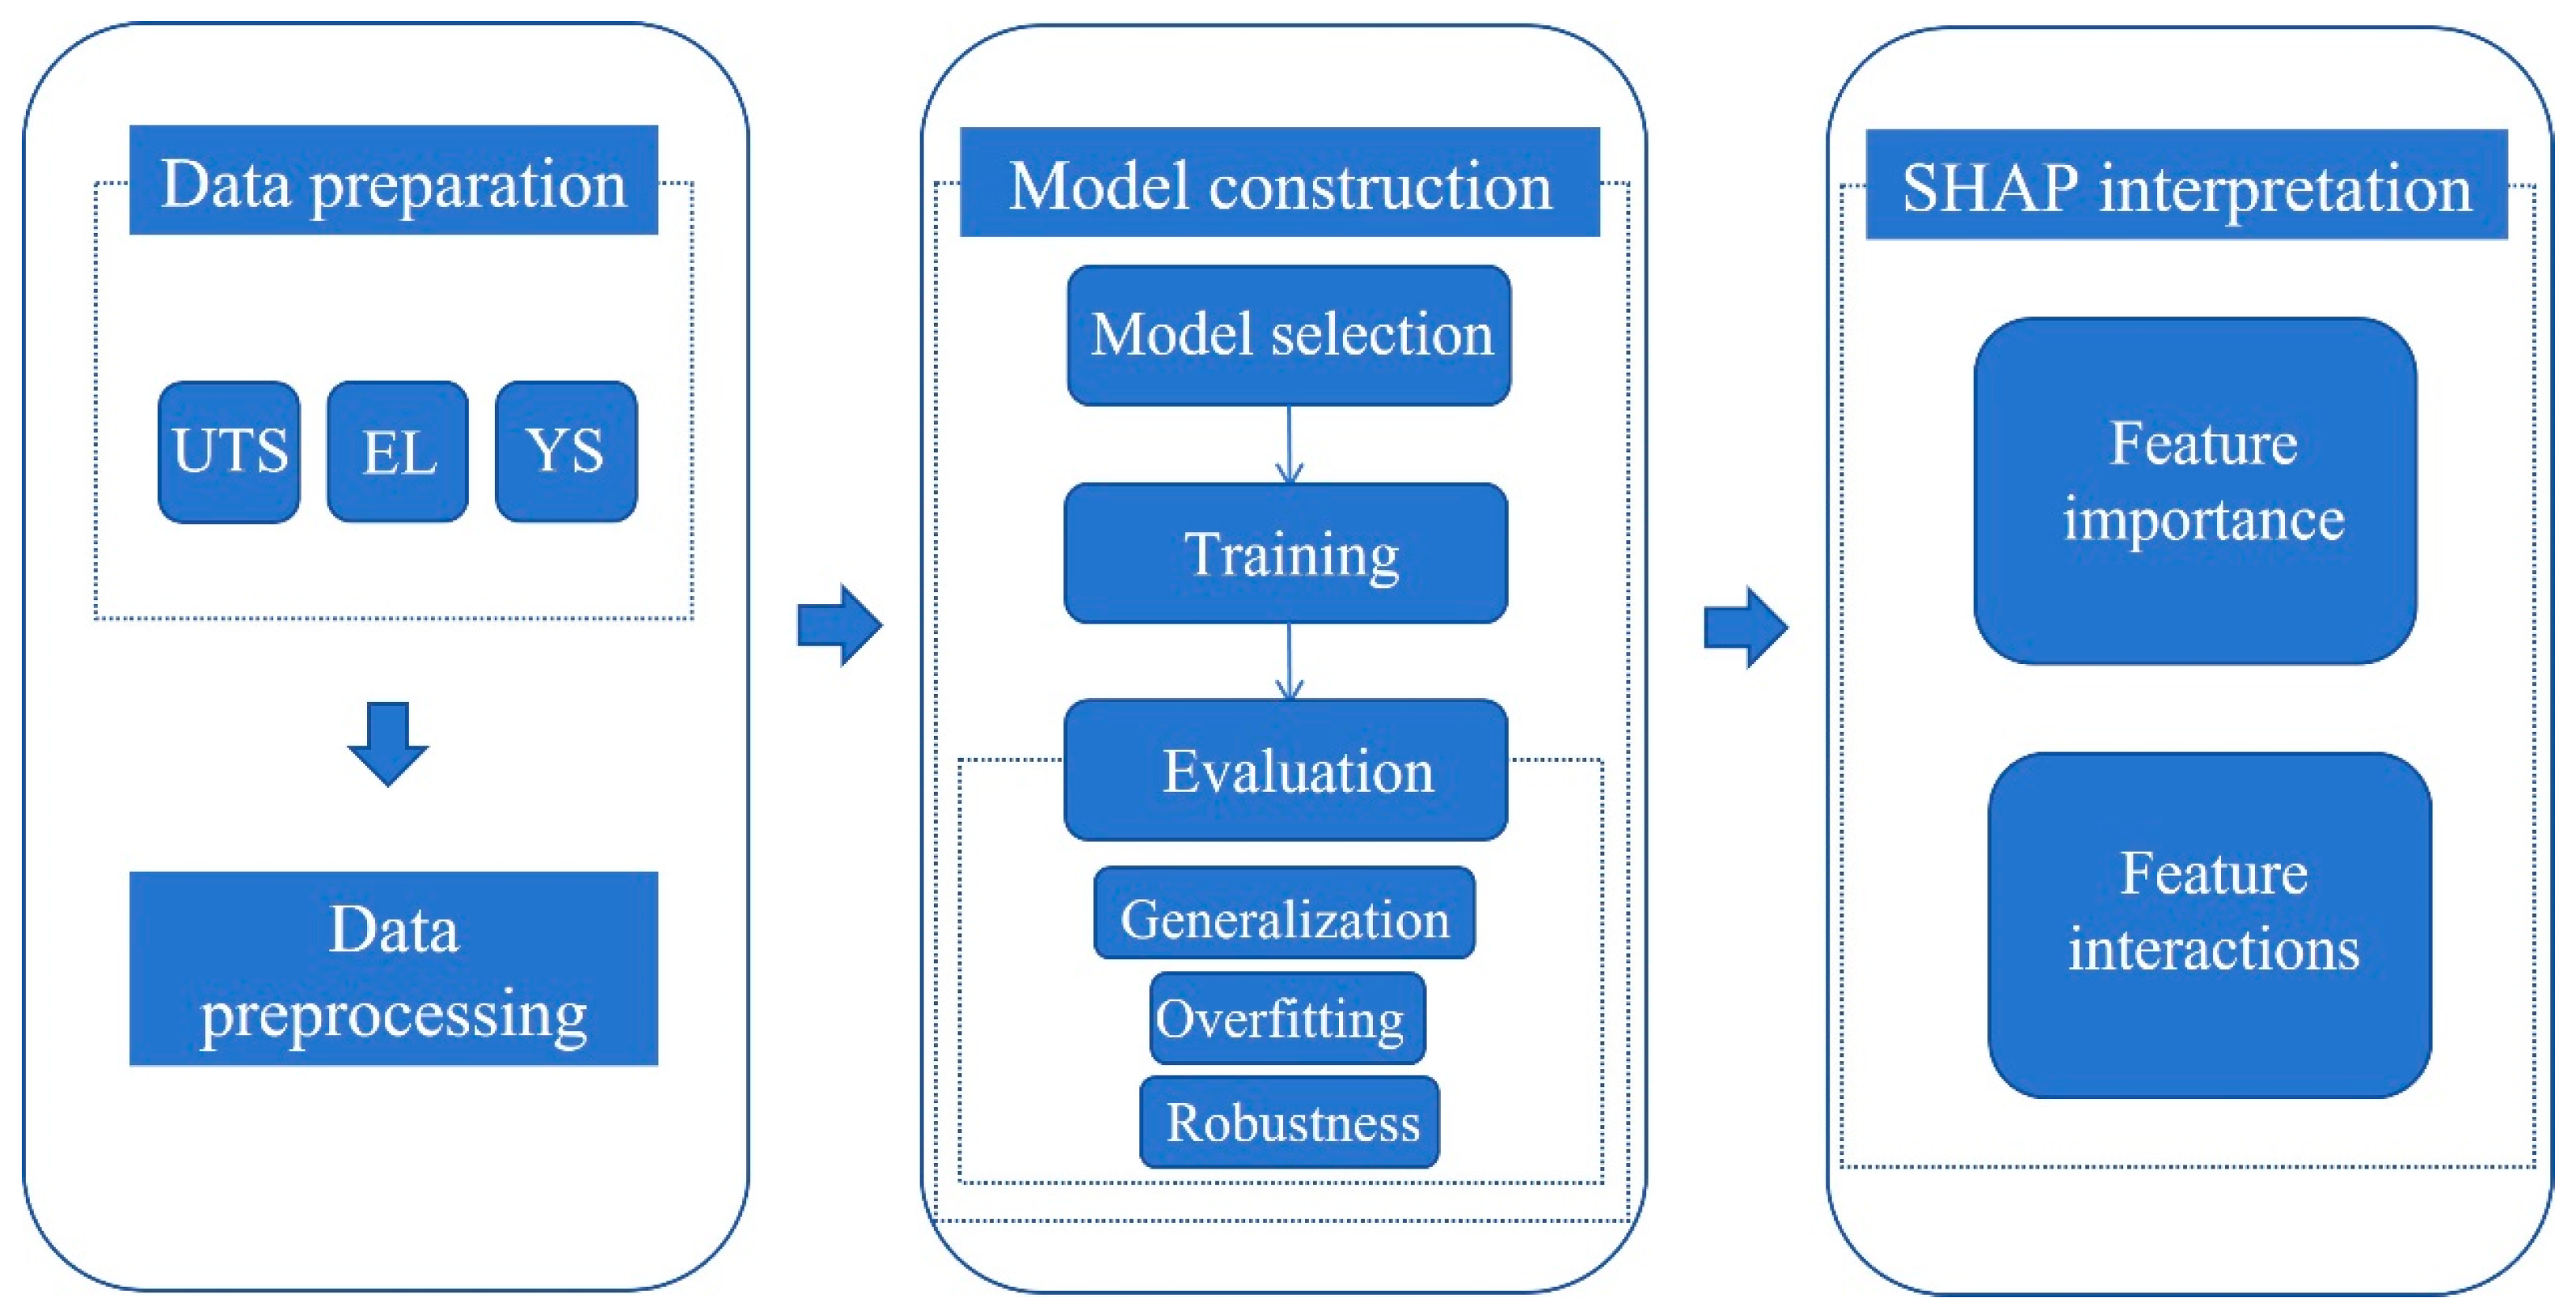
2.1. Data Preparation

Three experimental datasets pertaining to cast TiAl alloys were developed, namely the ultimate tensile strength (UTS) dataset, the yield strength (YS) dataset, and the elongation (EL) dataset, and all sample data were derived from experimental findings documented in the relevant published literature. To reduce the potential bias derived from the differences in the experimental processes in the various literature to the largest degree, strict data collection and screening were conducted when constructing the data sets. First, the data were collected from authoritative journals in the field of material science, which guarantees the reliability of the collected data to the largest extent. Second, considering that the RT tensile properties of cast TiAl alloys are mainly determined by their chemical compositions and the adopted casting process parameters (such as casting temperature and cooling rate), to minimize to the greatest extent the deviation caused by the differences in casting processes, the data were screened to ensure them from cast TiAl alloys with similar casting processes. The data were extracted mainly from the context and tables of the involved literature, while a fraction of the data was from graphs. The data from graphs were extracted by the Gatan Microscopy Suite (GMS) software (version 2. 32. 888. 0). The UTS dataset comprised 163 data entries, the YS dataset contained 93 entries, and the EL dataset included 155 entries. Each data entry encompassed information on alloy compositions alongside the corresponding RT tensile properties. These datasets have not been used before for similar work. The alloy compositions of the cast TiAl alloys were designated as input variables (namely features) and are detailed in Table 1. Among them, the chemical compositions were represented in terms of atomic percentage, with the total atomic percentage of all components summing to 100%. It is noteworthy that the dataset encompassed 16 to 18 alloy elements from the periodic table, although no individual experimental observation included all of these elements.
Another crucial preliminary step before the model construction was data preprocessing, which is essential for the creation of reliable datasets. In the context, given that minor inconsistencies or the presence of missing values can lead to significant errors in model performance, any missing features were imputed with zero value, predicated on the sum of the features in each sample equaling 100%. Significantly, although there was noise in the dataset caused by different experimental parameter settings, no denoising was performed during data preprocessing. This arises from the fact that when different researchers obtain RT tensile properties on the premise of the same alloy composition, the parameter settings frequently differ due to variations in experimental conditions, methodologies, and other factors. Consequently, we believe that the explanation provided by the model developed from a dataset that has not undergone noise reduction hold significant reference value for a greater number of researchers.

2.2. Model Construction

Following data preprocessing, the process advanced to model construction. Modeling of machine learning is to establish a relationship between the target and features. In this study, a machine learning model was developed to predict the RT tensile properties (UTS, EL, and YS) of cast TiAl alloys. To assess the generalizability of the well-trained model, an independent testing set was employed for validation. In addition, given the limited number of samples in the dataset, leave-one-out cross-validation (LOOCV) was implemented on the training set to mitigate the risk of overfitting. Additionally, to minimize the influence of random partitioning of the training and testing sets on the model’s performance, the original dataset was randomly divided into training and testing sets for 10 times.
In the model construction, the Pearson correlation coefficient (R) was employed to indicate the correlation to evaluate models. A higher R value signifies a stronger positive match between the predicted and actual values. Additionally, the model was also evaluated for performance using the root mean squared error (RMSE). It quantifies the root mean square discrepancy between the predicted value and the actual one, thereby indicating the average extent of deviation between these two values.

2.3. Model Interpretation Tool

The SHAP algorithm was utilized to elucidate the explicit factors that impact the RT tensile properties of cast TiAl alloys, which is a novel unified approach proposed by Lundberg and Lee in 2017 for interpreting model predictions [41]. This algorithm is deeply rooted in the game theory concept of Shapley values, providing a fair and equitable approach to determining the individual contributions of each feature to the model’s predictive outcomes. In interpreting the machine learning model, the SHAP algorithm precisely quantifies the impact of each feature on the prediction results, thereby facilitating the identification of the most crucial features in the decision-making process. Additionally, it captures the nonlinear interactions among features, offering a more comprehensive understanding that transcends the significance of individual features alone. However, it is noteworthy that SHAP reveals the statistical correlation rather than the causal relationship between features and predictive results.

3. Results

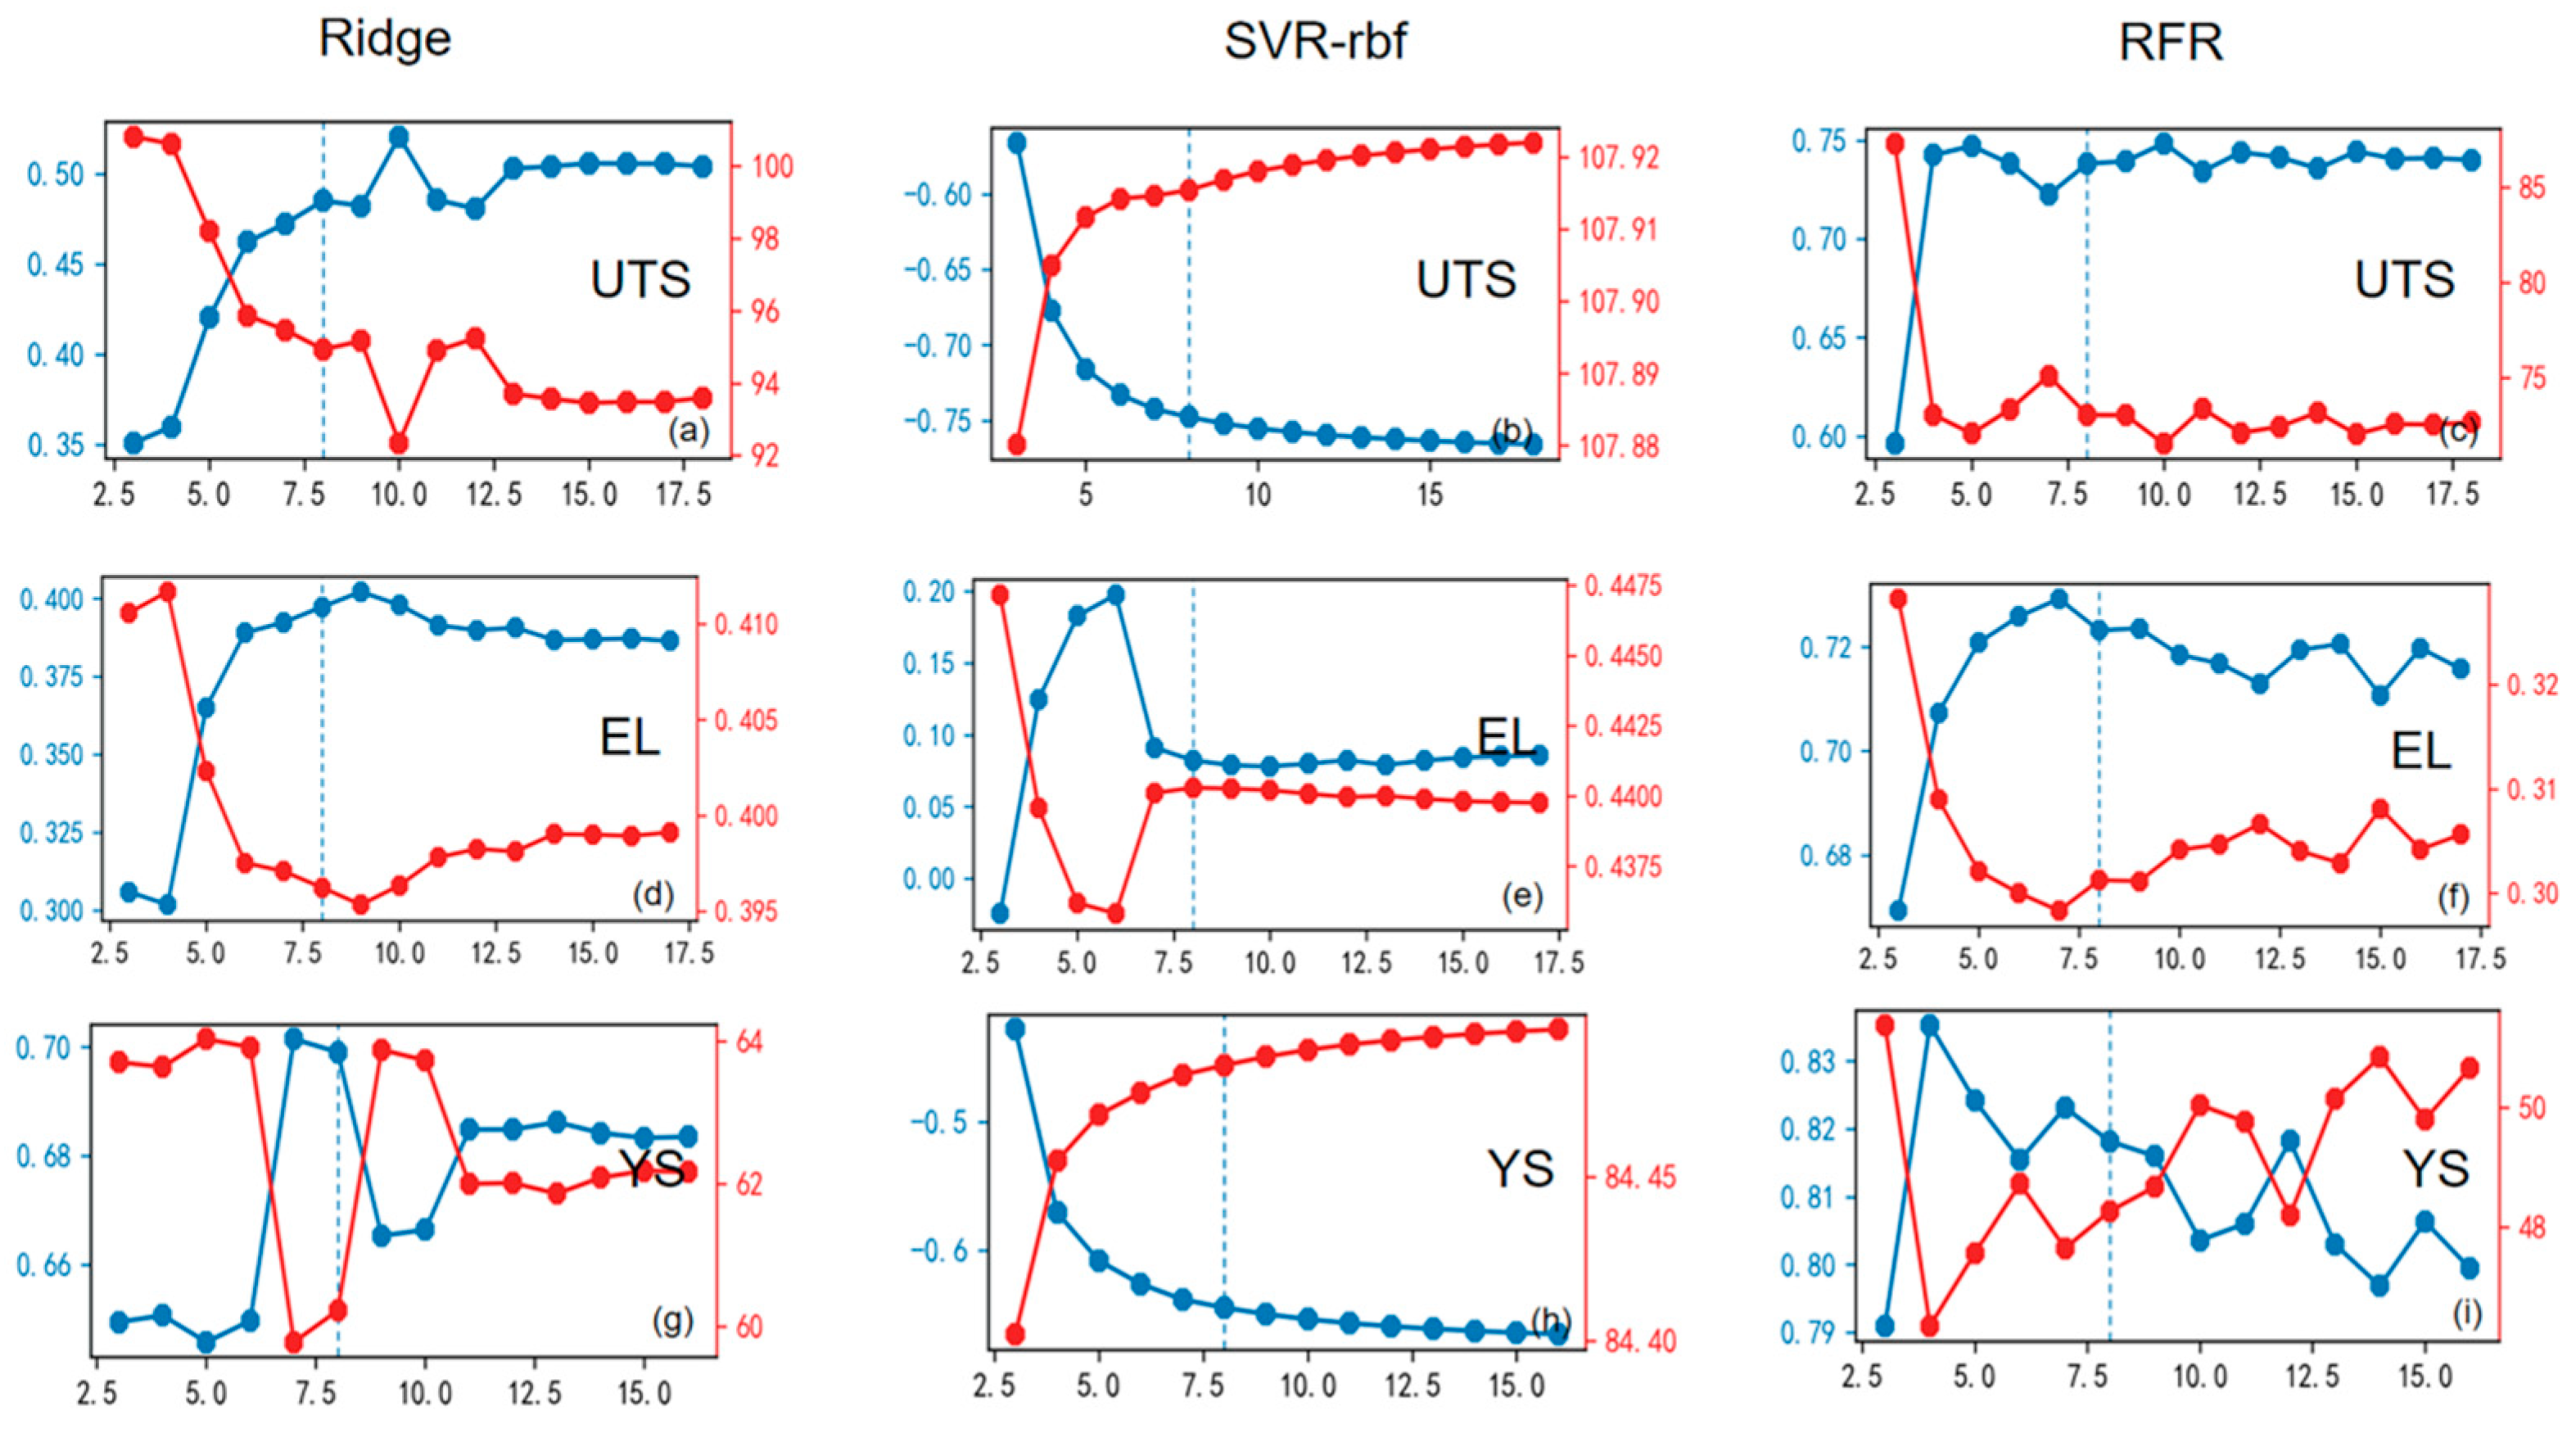
3.1. Model Selection

In general, alloy compositions encapsulate a wealth of information sufficient to develop a preliminary predictive model. Given the no free lunch theorem, which asserts that no machine learning algorithm is universally optimal, the dataset was randomly partitioned into training and testing subsets in a 9:1 ratio. To identify the most suitable algorithm, we employed several prevalent machine learning algorithms, including the ridge regression (Ridge), the support vector regression with a radial basis function kernel (SVR-rbf), and the random forest regression (RFR), to establish predictive models for the RT tensile properties of cast TiAl alloys based on their alloy compositions. By comparing the RMSE and R of the LOOCV across various algorithms within the training set in Figure 3, the RFR model emerged as the superior choice, boasting a higher R and a lower RMSE. Additionally, the RFR model has the advantage of not requiring feature normalization, thereby preserving the inherent relationship where the total feature values sum to 100%. Consequently, RFR was selected as the machine learning algorithm for constructing the specialized model to predict RT tensile properties of cast TiAl alloys.
In addition, Figure 3 illustrates that while the R-value and RMSE of models trained with varying quantities of key features as input variables in RFR exhibited fluctuations, the overall variation remained minimal. Consequently, to comprehensively capture the impact of diverse alloy elements on the RT tensile properties, this study retained all features present in the dataset.

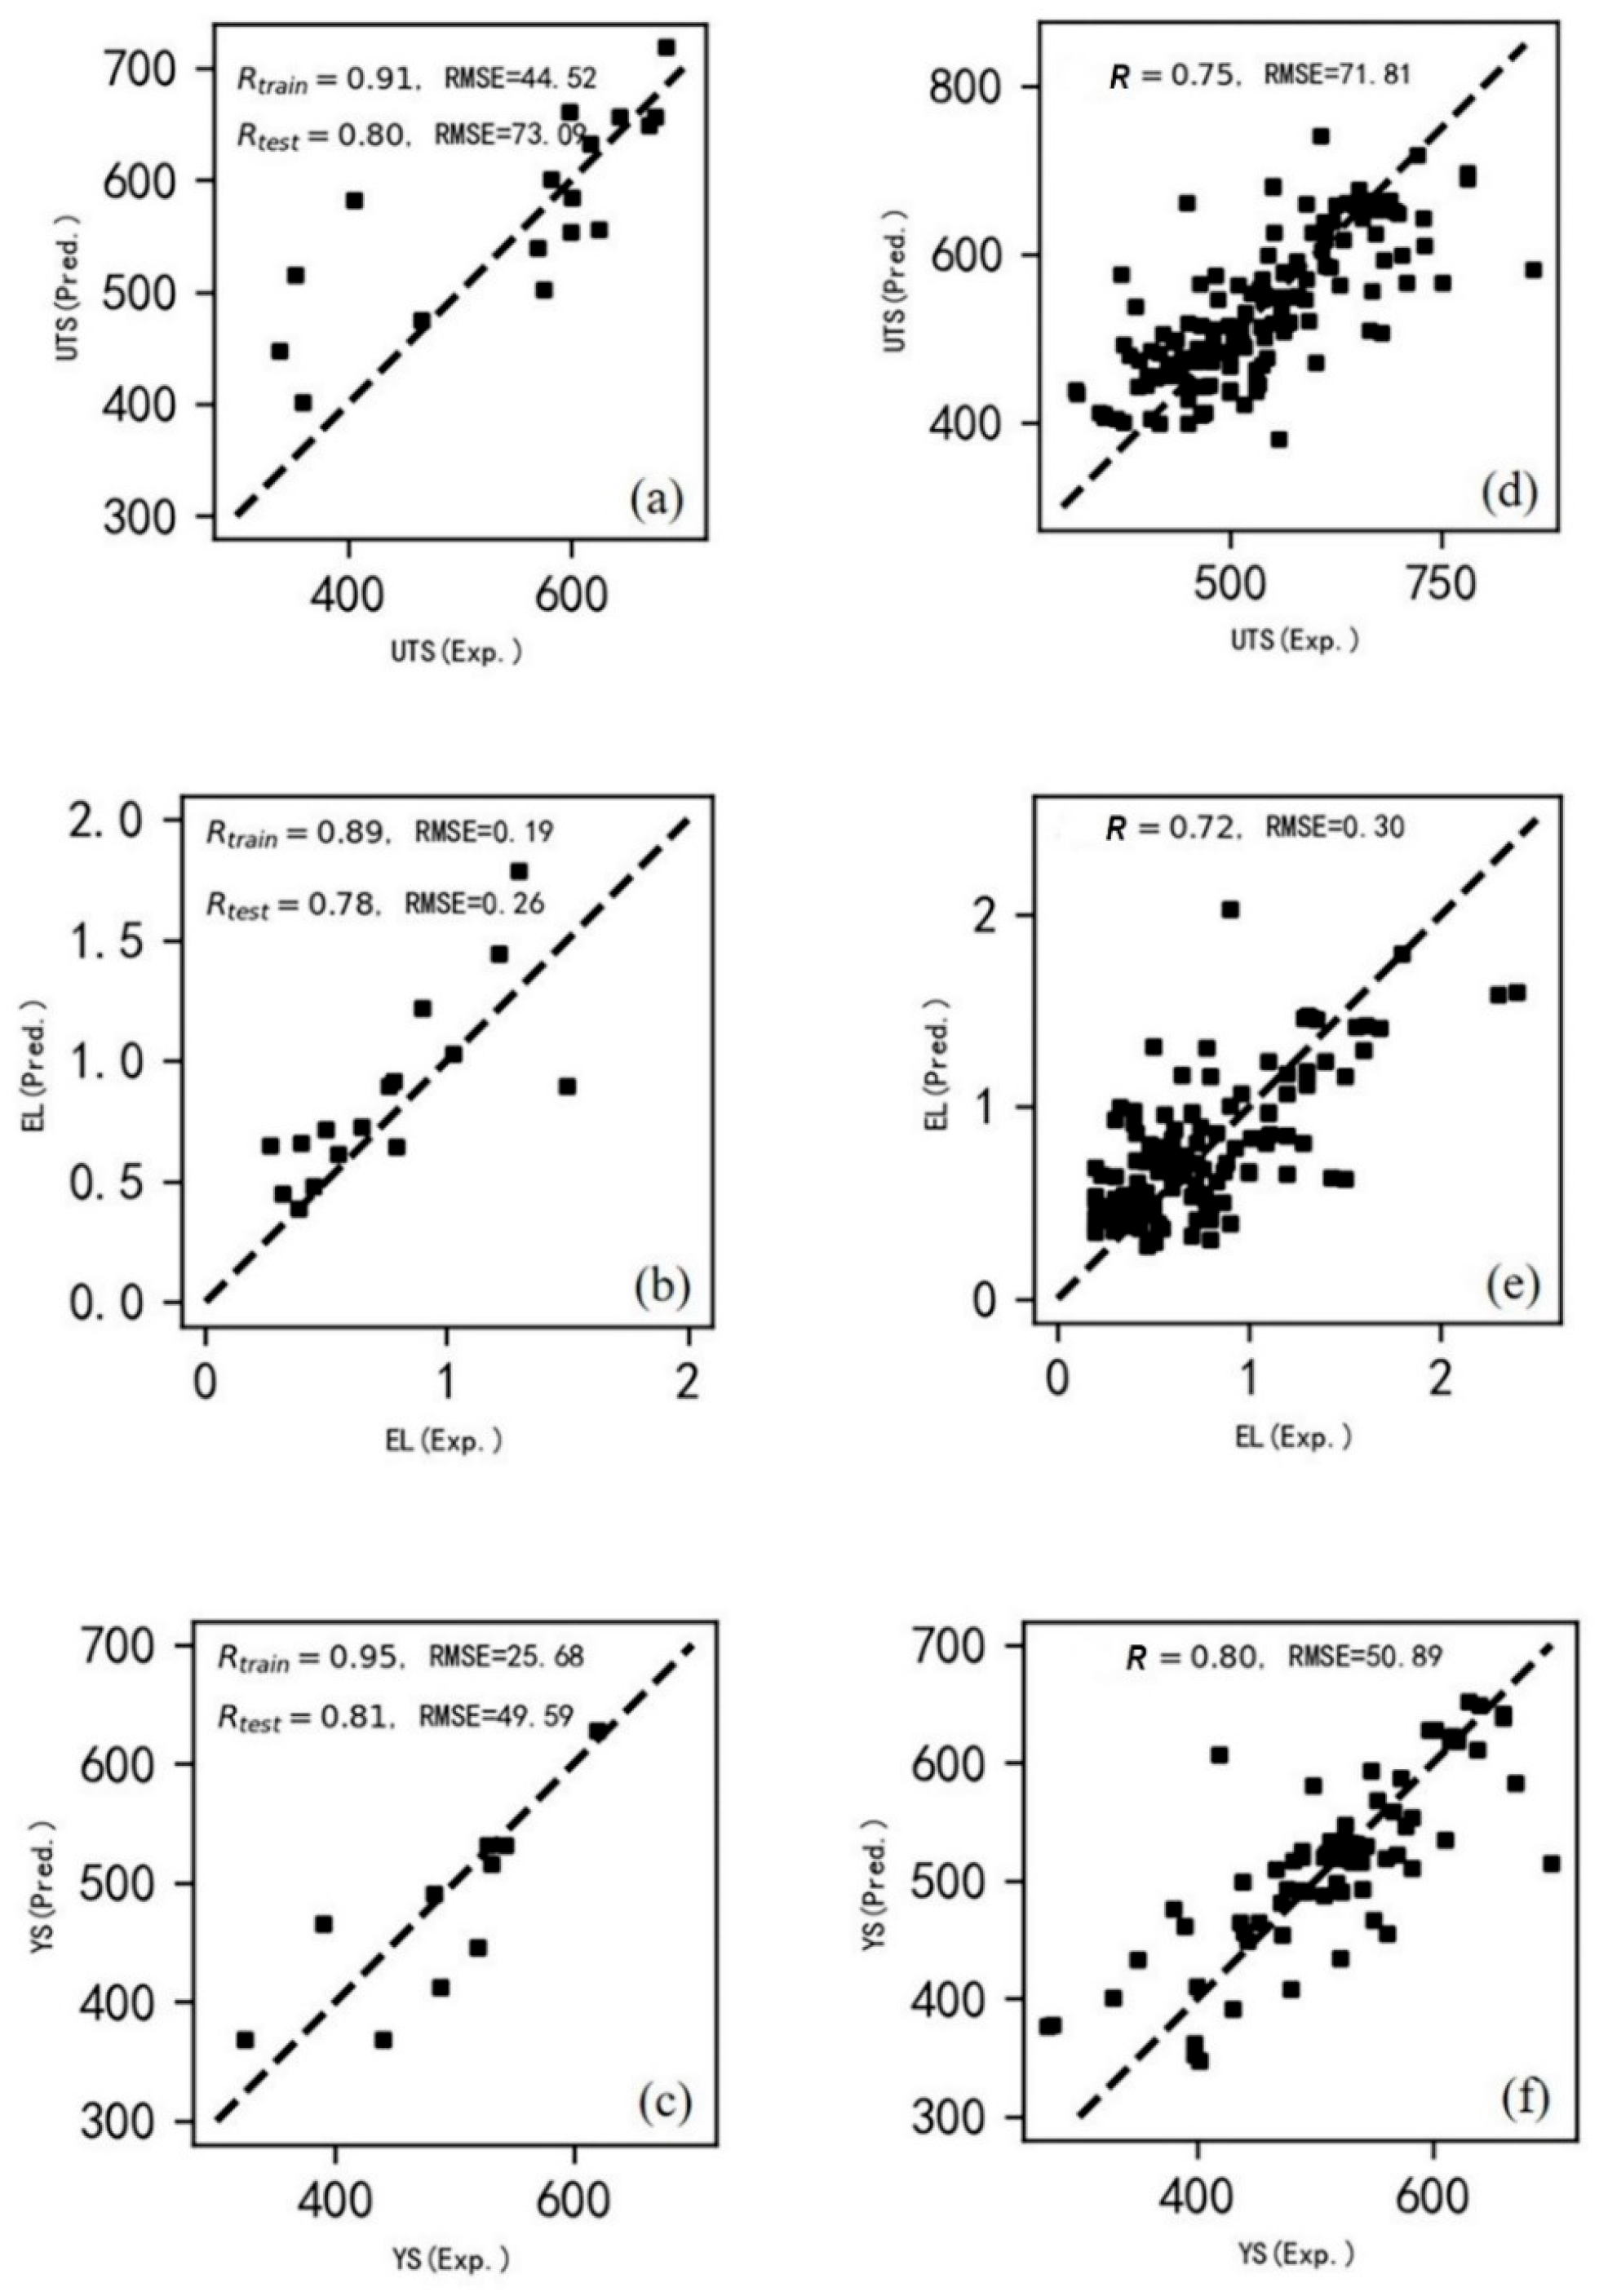
3.2. Model Construction and Evaluation

With the alloy elements as input variables, we applied RFR to develop a regression model aimed at predicting the RT tensile properties of cast TiAl alloys. The independent testing set was utilized to validate the generality of the well-trained model. Figure 4a–c illustrate the predicted UTS, YS, and EL in relation to their corresponding experimental values for cast TiAl alloys within the independent testing set. The Rtest values were approximately 0.8, with the majority of data points clustering around the diagonal line, indicating a relatively strong consistency between the predicted values and the experimental measurements. Additionally, all the RMSE values for UTS, EL, and YS remained within an acceptable range.
To assess the performance of the developed RFR model and mitigate the risk of overfitting, LOOCV was performed concurrently on the training set. LOOCV means that the dataset is split into n (the number of samples) equal-sized subsets, and each time (n − 1) subsets are used as the training set, the remaining one subset is used as the validation data to test the model. Figure 4d–f illustrate the predicted values in relation to the experimental measures of UTS, EL, and YS of cast TiAl alloys, as derived from the LOOCV of the training set. It was revealed that the discrepancy in R values between the independent test set and the LOOCV on the training set was about 0.05, suggesting that all three well-trained models exhibit relatively excellent predictive capabilities.
Furthermore, to mitigate the effect of random partitioning of the training and testing sets on the model, the original datasets were randomly divided into training and testing sets in a 9:1 ratio across 10 iterations. Subsequently, the model was reconstructed. Table 2 indicates that the mean R and RSEM values for both the training and testing sets are approximately consistent with the evaluations of our model presented in Figure 4a–c. These findings suggest the robustness and generalizability of the well-trained model.

3.3. Model Interpretation

While the RFR algorithm incorporates an inherent feature importance ranking mechanism, the SHAP algorithm offers several advantages, including enhanced fairness, local independence, model independence, ease of interpretation, and diverse visualization options for model interpretation. SHAP facilitates a detailed understanding of the individual contribution of each feature to the prediction outcome, thereby providing deeper insights into the decision-making processes and identifying the key features of the model.

3.3.1. Feature Importance

Feature importance is a metric derived from machine learning outcomes, indicating which input feature exerts the greatest influence on the predicted values of the output variables. The SHAP algorithm computes the marginal contribution of each feature across all conceivable subsets of features, subsequently weighting these contributions to derive the SHAP value for each feature. The SHAP value quantifies the average effect of each feature on the predictions made by the model. The ranking of feature importance is determined by the absolute values of the SHAP values; a larger absolute SHAP value indicates a more significant influence of the feature on the model’s predictions, thereby signifying a higher level of importance for that feature.
As illustrated in Figure 5, the SHAP algorithm was employed to evaluate feature importance and examine the influence of various features on the predictions made by our model. The horizontal axis represents the mean of the absolute values of the SHAP values, while the vertical axis delineates the different features. It is evident that the features on the vertical axis are arranged in descending order of their importance. Meanwhile, the length of the blue bar indicates the significance of each feature within the model’s predictive framework. A longer bar corresponds to greater importance of the feature in influencing the model’s predictions.
Figure 5a illustrates the importance of each feature in the prediction of the UTS. It is indicated that the RT UTS of cast TiAl alloys was mainly influenced by Al, B, C, Ti, Nb elements and so on, and the most effective element was Al, followed by B and C elements ordinally, exceeding the impact of Ti element. It is noteworthy that although O element was ranked seventh in the feature hierarchy, its contribution to UTS prediction was relatively outstanding, especially considering that only 6 out of 163 samples in the UTS dataset contained the oxygen element. Figure 5b illustrates the importance of each feature in the prediction of the EL. The findings indicate that the RT EL of cast TiAl alloys was predominantly influenced by Cr, Mn, Ti, Al, B elements and so on ordinally. Figure 5c illustrates the importance of each feature in the prediction of the YS. It indicates that the RT YS of cast TiAl alloys was predominantly influenced by Al, B, C, Nb, Ti elements and so on ordinally. Additionally, the top five key features were consistent with those in UTS.
In order to improve the credibility of the above-mentioned ordering results of alloy elements for different metrics of RT tensile properties of cast TiAl alloys, as shown in Figure 5, we quantified the uncertainty of the corresponding SHAP value for key chemical elements through bootstrap-based confidence interval estimation (100 times repeated sampling); the detailed results are shown in the Table 3. It reveals that all the mean |SHAP values| of the key chemical elements, as shown in Figure 5, were located in the 90% confidence interval, indicating that the above-mentioned ordering results own relatively high credibility.

3.3.2. Feature Interaction

Feature interaction denotes the occurrence in which features engage with one another, collectively influencing the outcomes of model predictions. This phenomenon is prevalent in the field of machine learning, indicating that features do not operate independently; on the contrary, they are interconnected and collaboratively impact the model’s predictive efficacy. In the SHAP algorithm, the metric that represents feature interaction is primarily the SHAP interaction value associated with feature interaction. This metric assesses the impact of feature interactions by analyzing the differences in SHAP interaction values of features across various combinations.
As illustrated in Figure 6, the SHAP algorithm was employed to evaluate the degree of the feature interaction in the model. The values depicted in the heatmap correspond to the average of the absolute values of the SHAP interaction values. Furthermore, the SHAP interaction heatmap illustrates the magnitude of the feature interaction value through variations in color depth; warmer hues, such as red, typically indicate a higher intensity of interaction, while cooler hues, such as blue, signify a lower intensity of interaction. By analyzing the color distribution and the numerical values presented in the heatmap, one can gain an intuitive understanding of the interactions between the features and their potential influence on the model’s predictions.
Figure 6a depicts the intricate interplay among features within the UTS model. It is evident that the top nine elements (Al, B, C, Ti, Cr, Nb, O, Si, V) exhibit a robust interaction, particularly the first six elements. The remaining combinations display a relatively weaker interaction. Notably, Al has the most significant interactions with other elements, followed by B, C, Ti, and so on, aligning closely with the element sequence for single feature importance illustrated in Figure 5a. Additionally, the Y element shows a strong interaction with Al and O but weaker interactions with other elements, while the W element has a strong interaction with C.
Figure 6b elucidates the interactions among features in the EL model. The top six features (Cr, Mn, Ti, Al, B, Nb) demonstrate a pronounced interaction, whereas the remaining combinations exhibit weaker interactions. Cr has the most interactions with other elements, followed by Mn, Ti, Al, and so on, which is consistent with the element sequence for single feature importance shown in Figure 5b. Moreover, Cr also has strong interactions with V, C, and O, but these elements have weaker interactions with other elements.
Figure 6c presents the interactions among features in the YS model. The top six features (Al, B, C, Nb, Ti, V) show a strong interaction, while other combinations have relatively weaker interactions. Al has the most interactions with other elements, followed by B, C, Nb, and so on, which is generally consistent with the element sequence for single feature importance depicted in Figure 5c. Compared to Figure 6a,b, the boxes with warm hues are more dispersed, indicating that the YS of cast TiAl alloys is more susceptible to interactions of different alloy elements than UTS and EL. Additionally, Mo, Hf, and Y have strong interactions with Al, while B has a strong interaction with Cr.
To enhance the credibility of the above-mentioned heatmaps of interaction between features for different metrics of RT tensile properties of cast TiAl alloys, as shown in Figure 6, we also quantified the uncertainty of the corresponding SHAP value for key element pairs through bootstrap-based confidence interval estimation (100 times repeated sampling); the detailed results are shown in Table 4. It reveals that all the mean |SHAP interaction values| of the key element pairs as shown in Figure 6 were located in the 90% confidence interval, indicating that the above-mentioned results own relatively high credibility.

4. Discussion

To elucidate the impact of the individual alloy element or the interaction between any two distinct elements on the RT tensile properties of cast TiAl alloys, providing foundational insights for machine-learning-driven alloy design, it is imperative to conduct a comprehensive analysis on the specific effect mechanisms of the relevant alloy elements, including the magnitude and direction of their effects, with the aid of the SHAP method. While the aforementioned experiments enabled the identification of the specific features and combinations of features that significantly influence each output variable, both the SHAP summary plot and SHAP dependence plot are crucial for a clearer depiction of both the direction and magnitude of these values. Specifically, analyzing the positive and negative SHAP values allows for a precise understanding of how each feature probably affects the prediction outcomes. Positive SHAP values indicate predictive outcome enhancement with elevated feature values, whereas negative values reflect detrimental contributions.

4.1. Analysis of Feature Importance

In the SHAP summary diagram presented in Figure 7, the vertical axis delineates each feature within the model, arranged in descending order based on their importance, which aligns with the arrangement in Figure 5. The horizontal axis illustrates the SHAP values corresponding to the model’s prediction outcomes. The colors of the points in the figure were employed to denote the range of feature values, with a gradient from low to high represented by varying colors from a cold hue to a warm one, correspondingly. This color coding aids in comprehending how the distribution of feature values impacts the prediction results. The positive SHAP value represents the positive action of features (various alloy elements) on the output variables (each metric of RT tensile properties), and vice versa. Furthermore, the density of the points reflects the distribution of the feature values within the dataset, with denser regions indicating a higher prevalence of certain feature values.
As illustrated in Figure 7a, the alloy elements can be generally divided into two categories on the basis of the distribution situation of their SHAP values, namely positive element for UTS and negative element for UTS. The positive elements for UTS mainly included B, C, Nb, O, and Y, while the negative elements for UTS mainly contained Al, Ti, Cr, V, Si, and Fe.
With respect to the positive elements for UTS, the B element induces effective grain refinement, substantially elevating UTS [42]; the C element concurrently refines both grain size and interlamellar spacing for synergistic strengthening [43,44]; the Nb element demonstrates dual functionality through solid–solution strengthening coupled with microstructural refinement, then exhibits a positive effect on the UTS of cast TiAl alloys [45]; the O element can availably refine the interlamellar spacing of cast TiAl alloy, meanwhile it can also significantly increase the α2 phase content—the UTS of cast TiAl alloys could be enhanced notably [46,47]; the Y element exhibits superior lamellar structure refinement alongside pronounced grain size reduction, establishing itself as a multi-scale microstructural modifier for UTS improvement [48,49].
With respect to the negative elements for UTS, the Al element is beneficial to increasing the volume fraction of the γ phase and obtaining coarse fully lamellar structures for the cast TiAl alloys—therefore, a relatively high Al content has a negative effect on their UTS; elevated Ti content inversely reduces the positive alloying element concentrations under fixed Al levels, thereby diminishing the strengthening potential; the Cr element is a typical β stabilizing element in TiAl alloy—therefore, an increase in Cr content can lead to the rise in volume fraction of the brittle B2 phase, thus excessive Cr content decreases the UTS of cast TiAl alloys [50,51]; both the V and Fe are also typical β stabilizing elements in TiAl alloy—their effect mechanisms on the UTS of cast TiAl alloys are similar to that of Cr element, thus exhibiting a negative effect on the UTS of cast TiAl alloys [16,52]; the Si element is negative to the improvement in UTS of cast TiAl alloys, mainly because its solid-solubility in TiAl alloy is rather limited—therefore its addition facilitates the precipitation of the brittle Ti5Si3 phase, and a large amount of this phase is detrimental to the increase in UTS of cast TiAl alloys [53,54].
Combined with the magnitude of the mean |SHAP values| for UTS as shown in Figure 5a, in order to effectively improve the RT UTS of cast TiAl alloys, it is suggested to increase the B, C, and Nb content, while decreasing the Al and Ti content appropriately.
As illustrated in Figure 7b, the alloy elements can also be divided into two categories in general on the basis of the distribution situation of their SHAP values, namely a positive element for EL and a negative element for EL. The positive elements for EL mainly included Cr, Mn, Al, and V; while the negative elements for EL mainly contained Nb and C.
With respect to the positive elements for EL, both the Cr and Mn elements are able to synergistically refine grain structures while reducing γ-phase stacking fault energy, promoting deformation twinning, and super dislocation mobility to improve elongation (EL) [55,56,57]; the increase in Al content can result in the enhancement in the volume fraction of the γ phase, which is favorable to the improvement in EL of cast TiAl alloys; the ductilization effect of V is partially due to its ability to occupy Al lattice sites and modify the Ti–Al bond; it is also partially due to its ability to promote twin formation, by modifying the Al partitioning and therefore the α2/γ volume ratio in transformed regions [58]. With respect to the negative elements for EL, excessive Nb elevates the dislocation loop critical resolved shear stress (CRSS) while intensifying solute segregation, collectively impairing RT ductility of cast TiAl alloys [45,59]; although C element can effectively refine microstructures, its overabundance triggers the formation of Ti2AlC or other carbides—large numbers of coarse carbides may obviously deteriorate the ductility of cast TiAl alloys [43,60].
Combined with the magnitude of the mean |SHAP values| for EL as shown in Figure 5b, in order to effectively improve the RT EL of cast TiAl alloys, it is suggested to increase the Cr, Mn, and Al content, while decreasing the Nb and C content appropriately.
As illustrated in Figure 7c, the alloy elements can also be divided into two categories in general on the basis of the distribution situation of their SHAP values, namely a positive element for YS and a negative element for YS. The positive elements for YS mainly included B, C, and Nb; while the negative elements for YS mainly contained Al, Ti, V, W, and Mo.
According to [61,62], the yield strength of cast TiAl alloy is mainly determined by the intrinsic frictional stress, grain size, and lamellar spacing; the higher the intrinsic friction stress of constituent phases is, the greater is the yield strength, and the lower both the grain size and lamellar spacing are, the greater is the yield strength. With respect to the positive elements for YS, all the B, C, and Nb elements collectively enhance intrinsic frictional stress of the constituent phases, while differentially modifying the microstructural characteristics; the B element induces effective grain refinement, the C element simultaneously reduces both grain size and interlamellar spacing, while the Nb element can also refine the microstructures of cast TiAl alloys to some extent. Therefore, they exhibit a positive effect on the YS of cast TiAl alloys [45,63]. With respect to the negative elements for YS, the improvement in Al element is beneficial to enhancing the volume fraction of the γ phase and achieving coarse fully lamellar structures for the cast TiAl alloys; therefore, a relatively high content of Al exhibits a negative effect on their YS. When the Al content is certain, the increase in Ti content means the reduction in other alloy elements, thus the improvement in Ti element is not favorable for the enhancement in YS of cast TiAl alloys generally. All the V, W, and Mo elements are typical β stabilizing elements in TiAl alloy; therefore, an increase in their content can lead to the rise in volume fraction of the brittle B2 phase, which is usually harmful to the improvement in YS of cast TiAl alloys [16].
In summary, the main alloy elements having obvious effect on the YS of cast TiAl alloys and their effect mechanisms are similar to those for the UTS of cast TiAl alloys. Combined with the magnitude of mean |SHAP values| for YS as shown in Figure 5c, in order to effectively improve the RT YS of cast TiAl alloys, it is suggested to increase the B, C, and Nb content, while decreasing the Al and Ti content appropriately.

4.2. Analysis of Feature Interaction

As shown in Figure 6, the interaction magnitude between different features on the RT tensile properties of cast TiAl alloys can be revealed clearly, while the interaction direction between different features is still unclear. Table 5 shows the mean |SHAP interaction values| of different element pairs with an outstanding interaction for the UTS, EL, and YS of cast TiAl alloys, namely the interaction magnitude between different features; in Table 5; the element pairs are arranged in descending order in terms of the mean |SHAP interaction values|.
It is shown in Table 5 that the top five element pairs with respect to the magnitude of interaction on different metrics of RT tensile properties of cast TiAl alloys are Al–B, B–C, Al–C, Al–Ti and B–Nb for the UTS; Cr–Ti, Ti–Al, Cr–Mn, Mn–B and Cr–Al for the EL; Al–Nb, Al–B, Al–C, Al–Ti and B–C for the YS. In order to further reveal the interaction direction between different alloy elements on the RT tensile properties of cast TiAl alloys, the SHAP dependence plots were drawn for the top four element pairs except for the Ti–Al one (because of the two elements being basic for the TiAl alloys) with respect to different metrics of RT tensile properties of cast TiAl alloys, as shown in Figure 8, Figure 9 and Figure 10, specifically.
As indicated by Figure 8a, when the Al content was less than about 45.5 at%, the SHAP interaction values between Al and B elements for the UTS were positive, indicating that their interaction has a positive effect on the UTS of cast TiAl alloys; especially when the Al content was 45 at%, their positive effect increased with the increase in B content. As shown in Figure 8b, when the B content was zero, the SHAP interaction values between Al and B elements were positive with the Al content approximately more than 46 at%, elucidating that the addition of B element on this condition is harmful to the UTS. As seen in Figure 8c,d, when the B content was zero or trace, the addition of C element made the SHAP interaction values between the B and C elements vary from negative to positive, illustrating that the addition of C element under this condition is beneficial to the UTS of cast TiAl alloys to a large extent. When the C content was zero or trace, their SHAP interaction values for the UTS were positive with the addition of B element, indicating that the addition of B element on this condition is also much more probably beneficial to the improvement in the UTS. Figure 8e shows that when the Al content was less than 46 at%, the SHAP interaction values between the Al and C elements for the UTS were positive, which means that the proper addition of C element is effective to improve the UTS with the Al content less than 46 at%. In addition, both the Figure 8e,f indicate that the addition of C element made the corresponding SHAP interaction values negative when the Al content was relatively high, such as being 48 at%. As indicated by Figure 8g, when the Nb content was approximately less than 5 at%, the SHAP interaction values between the Nb and B elements for the UTS were positive, whereas these values were negative when the Nb content was relatively high, about 8 at%. These results elucidate that when the Nb content is relatively low (about less than 5 at%), the proper addition of B element is beneficial to the enhancement in the UTS. Figure 8h also shows that when the Nb content was zero, the addition of B element was much more probably negative for the improvement in the UTS.
As indicated by Figure 9a, when the Cr content was zero and 1 at%, the SHAP interaction values between Cr and Ti elements for the EL of cast TiAl alloys were negative with the Ti content more than about 48 at%; while when the Cr content was 2 at%, the corresponding SHAP values turned positive with the Ti content more than about 48 at%. According to Figure 9b, when the Ti content was more than 48 at%, the relevant SHAP interaction values were generally positive. These results indicate that the interaction of relatively high Ti content (>48 at%) and Cr content (≥2 at%) are favorable for the enhancement in EL to a great extent. As seen in Figure 9c, when the Cr content was zero, the addition of Mn element made the SHAP interaction values between the Cr and Mn elements turn positive, and when the Cr content was more than about 1 at%, the corresponding SHAP interaction values were generally positive. As indicated by Figure 9d, the addition of Cr element can also make their SHAP interaction values change into positive when the Mn content is zero; however, the effect magnitude of Mn element was obviously larger than that of Cr element. It is suggested that in terms of improving the RT EL of cast TiAl alloys, a relatively high Cr content with low Mn content is better than a relatively high Mn content with low Cr content. Both Figure 9e,f show that when the Mn content was zero or trace, relatively low B content (about <0.5 at%) was probably beneficial to the enhancement in EL, while when the Mn content was relatively high (about 2 at%), a relatively high B content (about 1 at%) was likely more favorable. As indicated by Figure 9g,h, the interaction between the Al and Cr elements had not much of a significant effect on the RT EL of cast TiAl alloy. In spite of this, when the Cr content was relatively high (about 4 at%), a relatively low Al content (44–46 at%) was probably more beneficial to the improvement in the EL; while the Cr content was about 2 at%, a comparatively high Al content about 48 at% was more favorable to some extent.
As indicated by Figure 10a,b, when the Al content was within 44–46 at%, the SHAP interaction values between the Al and Nb elements for the YS of cast TiAl alloys were negative with a relatively high Nb content (about 4–8 at%), indicating that a relatively high Nb content is probably not beneficial to the improvement in the YS. As illustrated in Figure 10c, when the Al content was within 44–46 at%, the proper addition of B element usually had a positive effect on the improvement in the YS. It is indicated by Figure 10d that when the B content was zero, the SHAP interaction values between the B and Al elements were positive with the Al content approximately more than 45 at%, and rose with the increase in the Al content. It is revealed that when the Al content is relatively high (especially at 48 at%), the addition of B element is highly probably detrimental to the enhancement in the YS. Figure 10e,f show that when the Al content was within 44–46 at%, the addition of C element made the SHAP interaction values between the Al and C elements vary from negative to positive, meaning that it is probably a rather helpful method to add C element appropriately to enhance the YS when the Al content is between 44 at% and 46 at%. Comparing Figure 10g with Figure 10h, it is revealed that when the B content was zero or trace, the appropriate addition of C element could obviously enhance the YS, while when the C content was zero or trace, the improvement in the YS was highly probably not very significant with the addition of B element. Consequently, it is suggested to effectively improve the YS of cast TiAl alloys by the addition of C element appropriately based on maintaining a relatively low B content (about <0.5 at%).
To sum up, the highly probable interaction direction between two different elements on the RT tensile properties of cast TiAl alloys was basically unveiled by analyses of the SHAP dependence plots. With respect to the UTS, when the Al content is less than about 45.5 at%, the interaction between Al and B elements is positive; when the Al content is less than 46 at%, the interaction between Al and C elements is positive; when the Nb content is approximately less than 5 at%, the interaction between Nb and B elements is positive, whereas their interaction is negative when the Nb content is relatively high, about 8 at%. With respect to the EL, when the Ti content is more than 48 at%, the interaction between Ti and Cr elements is positive generally; when the Cr content is more than about 1 at%, the interaction between Cr and Mn elements is generally positive; when the Mn content is relatively high (about 2 at%), the interaction between Mn and B elements is positive with relatively high B content (about 1 at%). With respect to the YS, when the Al content is 44–46 at%, the interaction between Al and Nb elements is negative with relatively high Nb content (about 4–8 at%); when the Al content is 44–46 at%, the interactions between Al and B, as well as between Al and C elements, are generally positive.

5. Conclusions

This study employed SHAP interpretability modeling to establish composition-RT tensile property correlations in cast TiAl alloys, analyzing the alloying element effects through feature importance and interaction analyses. Key findings include the following:
(1)
By comparing the RMSE and R of the LOOCV across various algorithms, including the Ridge, the SVR-rbf, and the RFR, within the training set, it was found that the RFR model emerged as the superior choice, boasting a higher R and a lower RMSE.
(2)
To assess the performance of the developed RFR model and mitigate the risk of overfitting, LOOCV was performed concurrently on the training set. It was revealed that the discrepancy in R values between the independent test set and the LOOCV on the training set was about 0.05, suggesting that all three well-trained models for UTS, EL, and YS exhibit relatively good predictive capabilities.
(3)
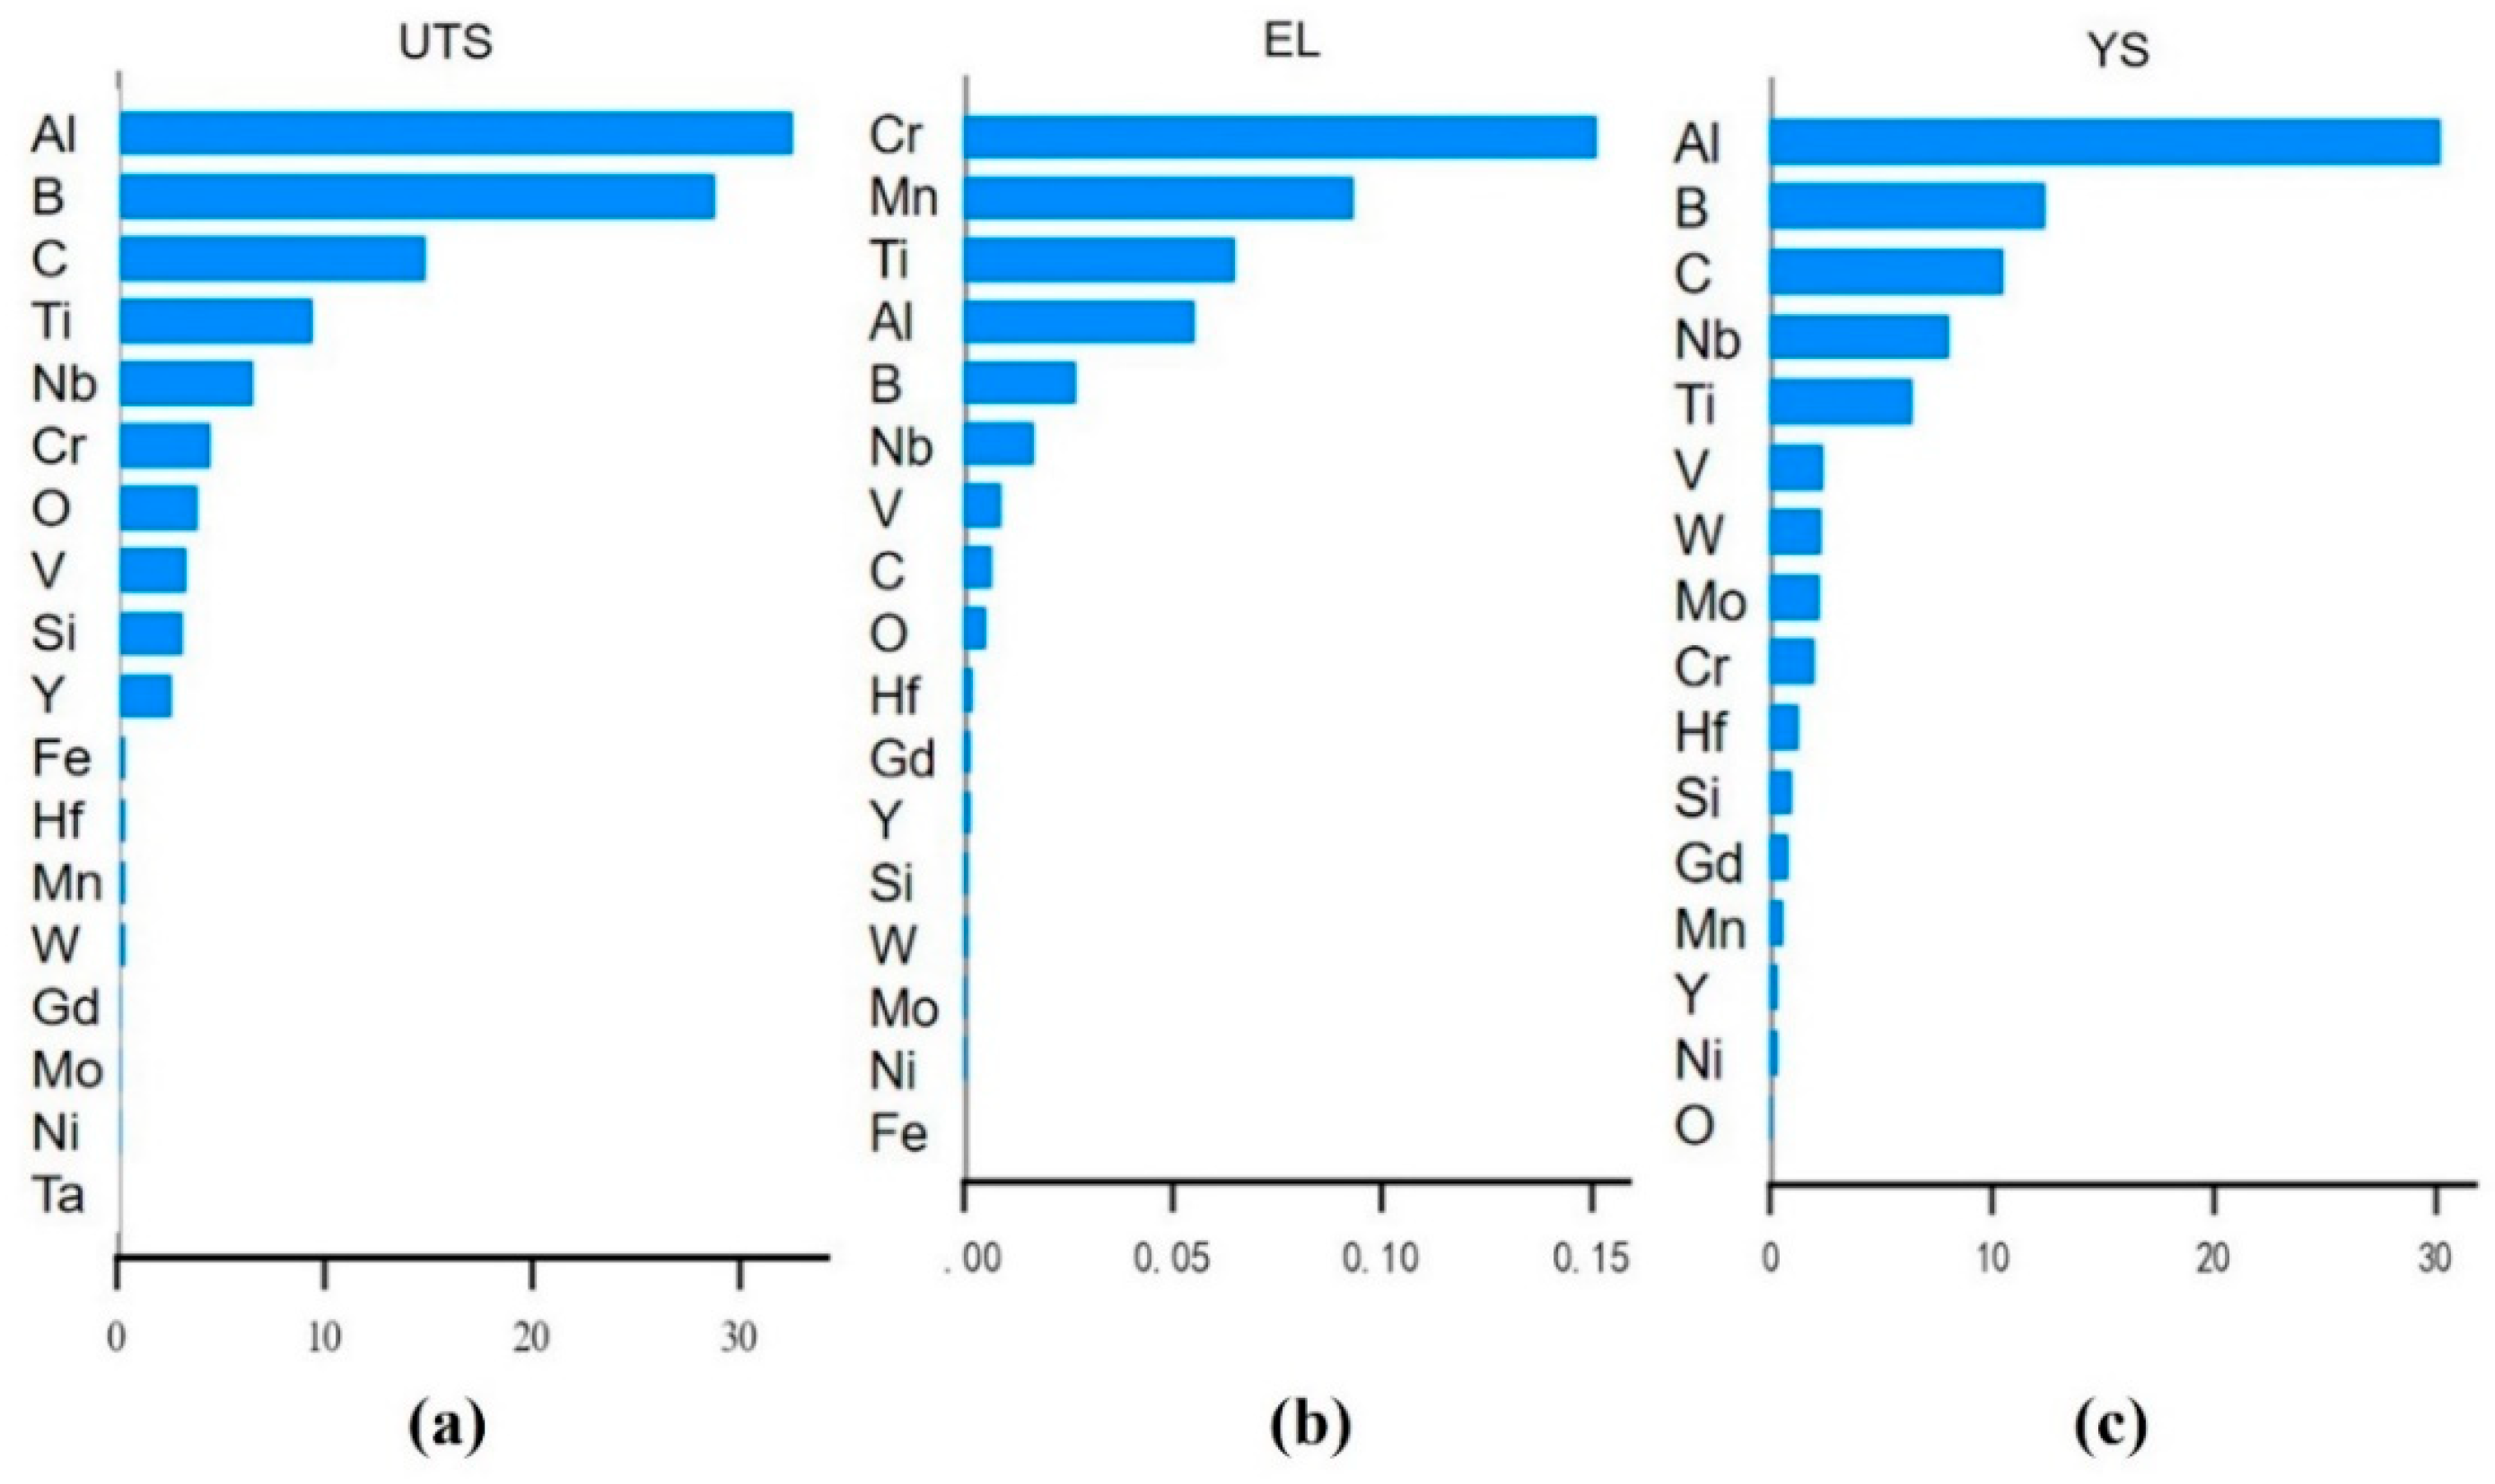
The RT UTS of cast TiAl alloys was mainly influenced by Al, B, C, Ti, Nb elements and so on, where the positive elements for UTS mainly included B, C, Nb, O, and Y, while the negative elements mainly contained Al, Ti, Cr, V, Si, and Fe. The RT EL of cast TiAl alloys was mainly influenced by Cr, Mn, Ti, Al, B elements and so on, where the positive elements for EL mainly included Cr, Mn, Al, and V, while the negative elements mainly contained Nb and C. The RT YS of cast TiAl alloys was mainly influenced by Al, B, C, Nb, Ti elements and so on, where the positive elements for YS mainly included B, C, and Nb, while the negative elements mainly contained Al, Ti, V, W, and Mo.
(4)
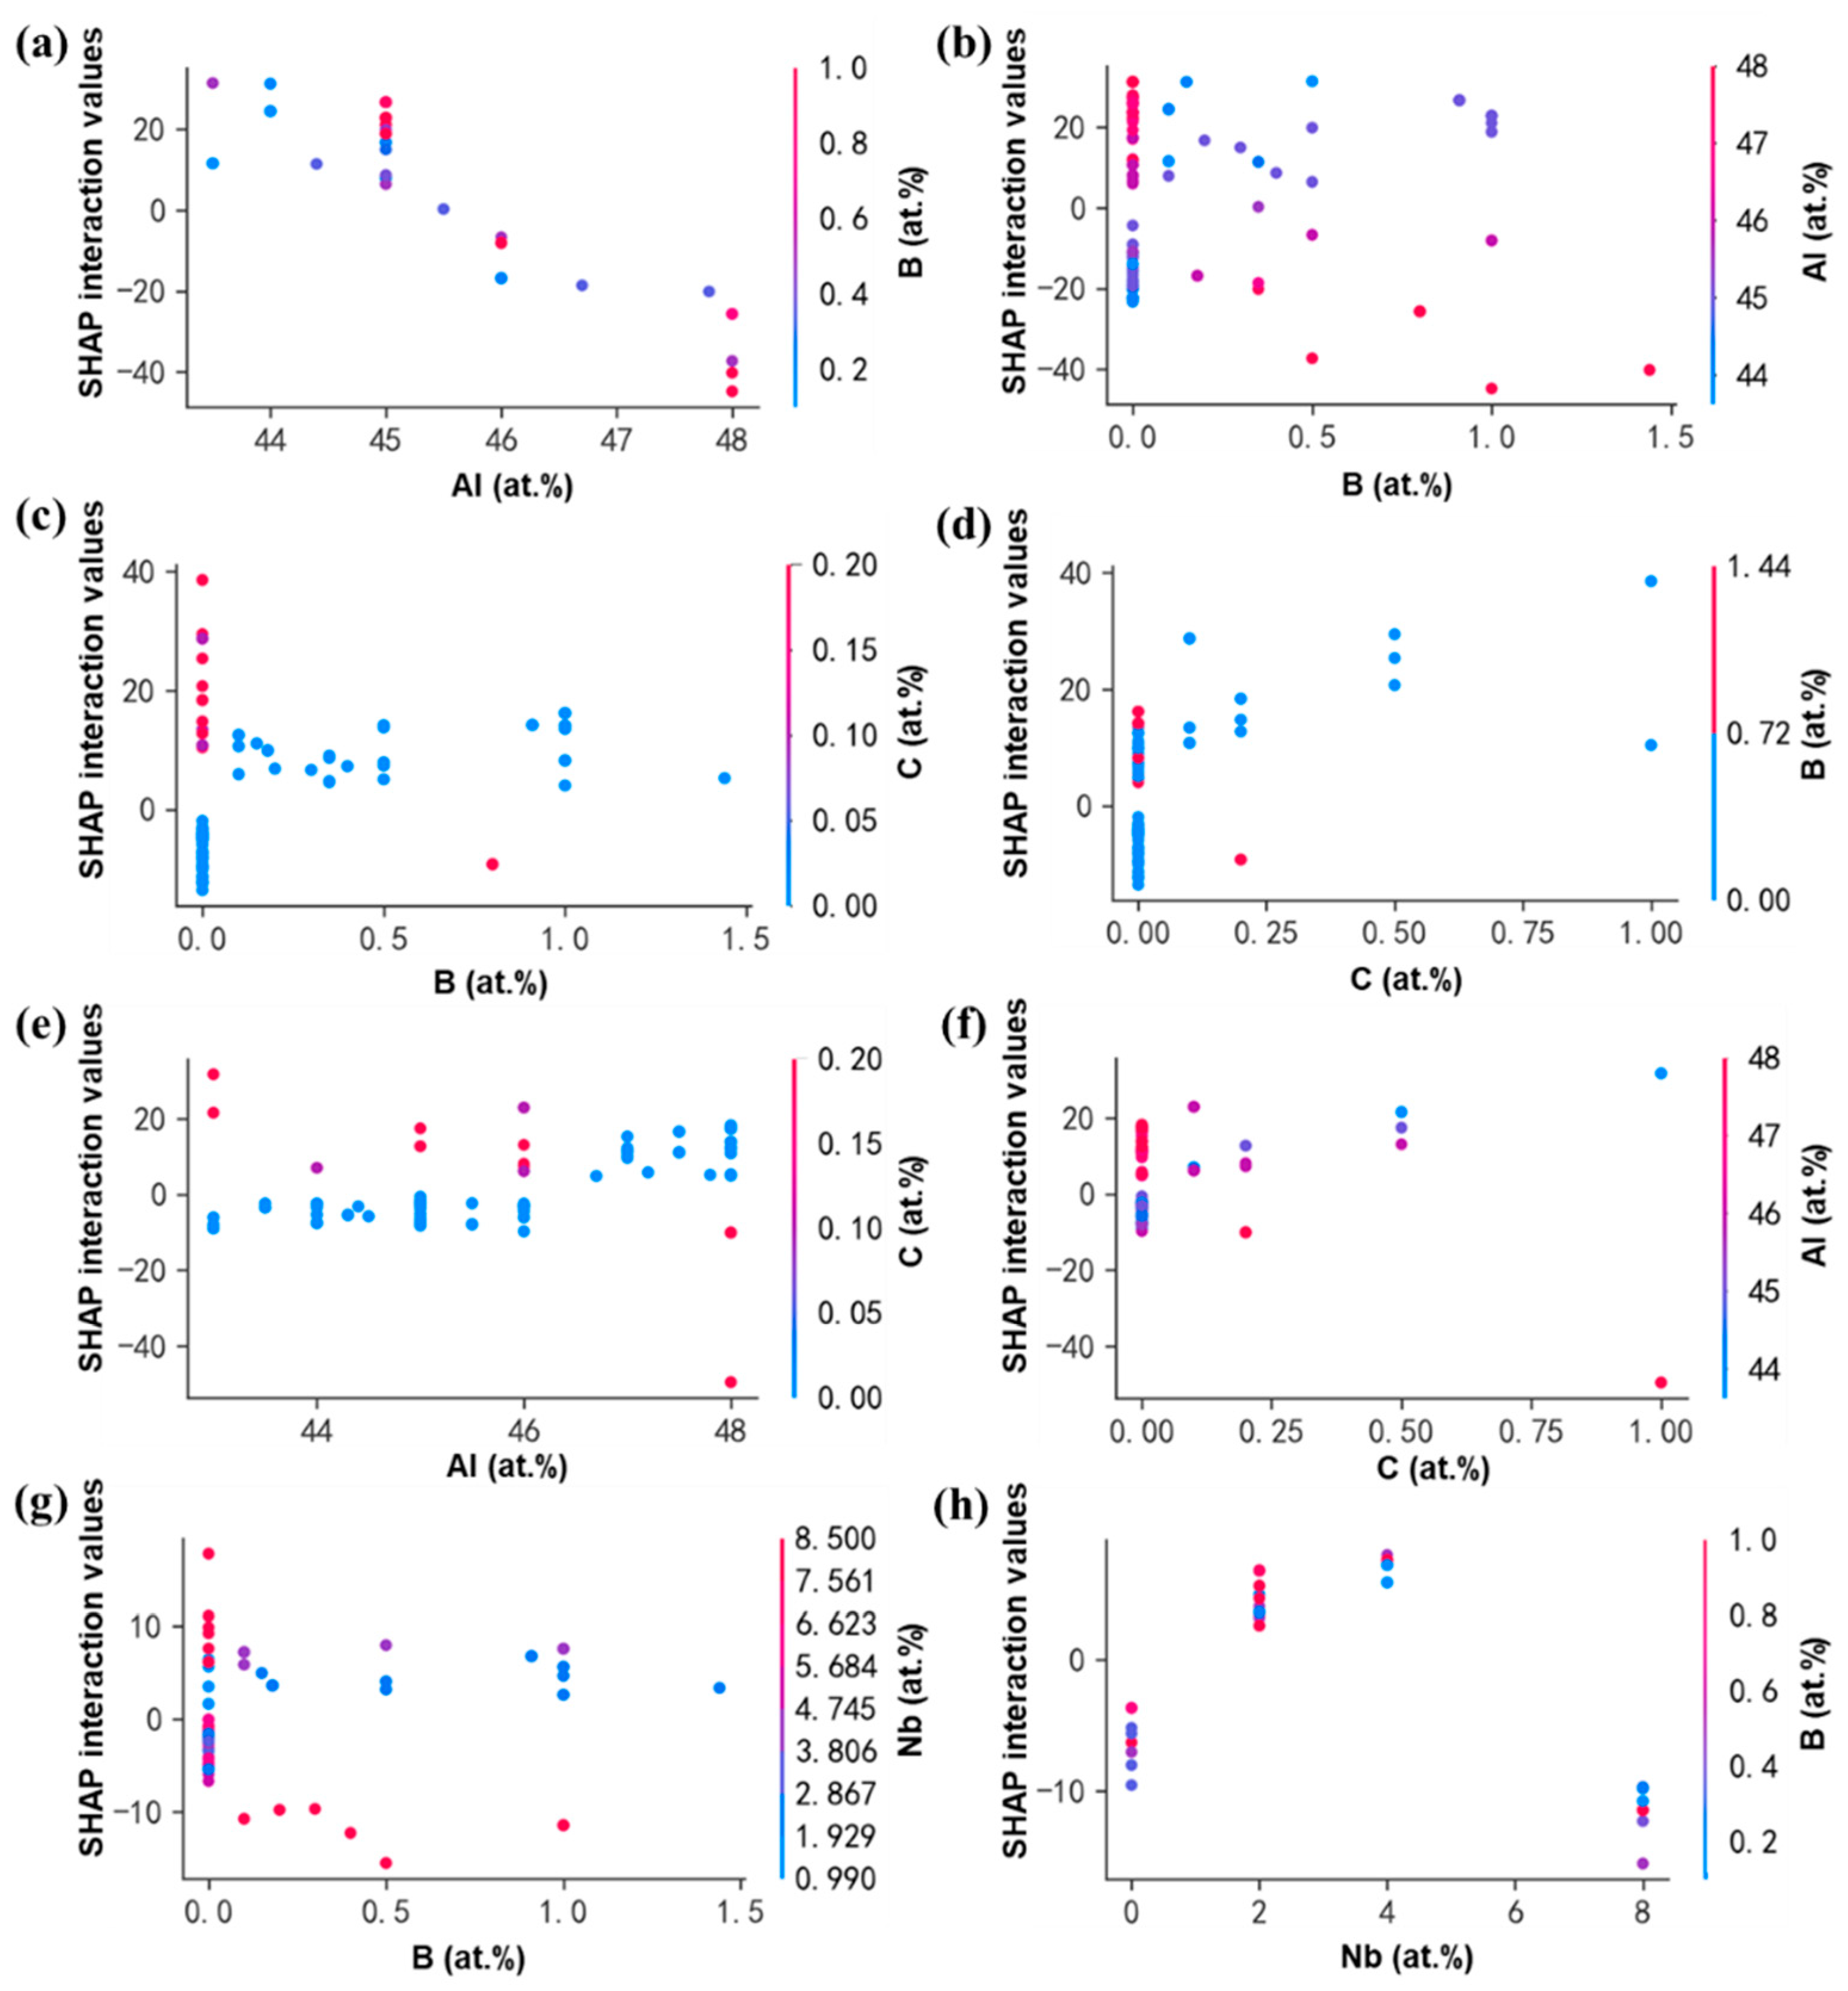
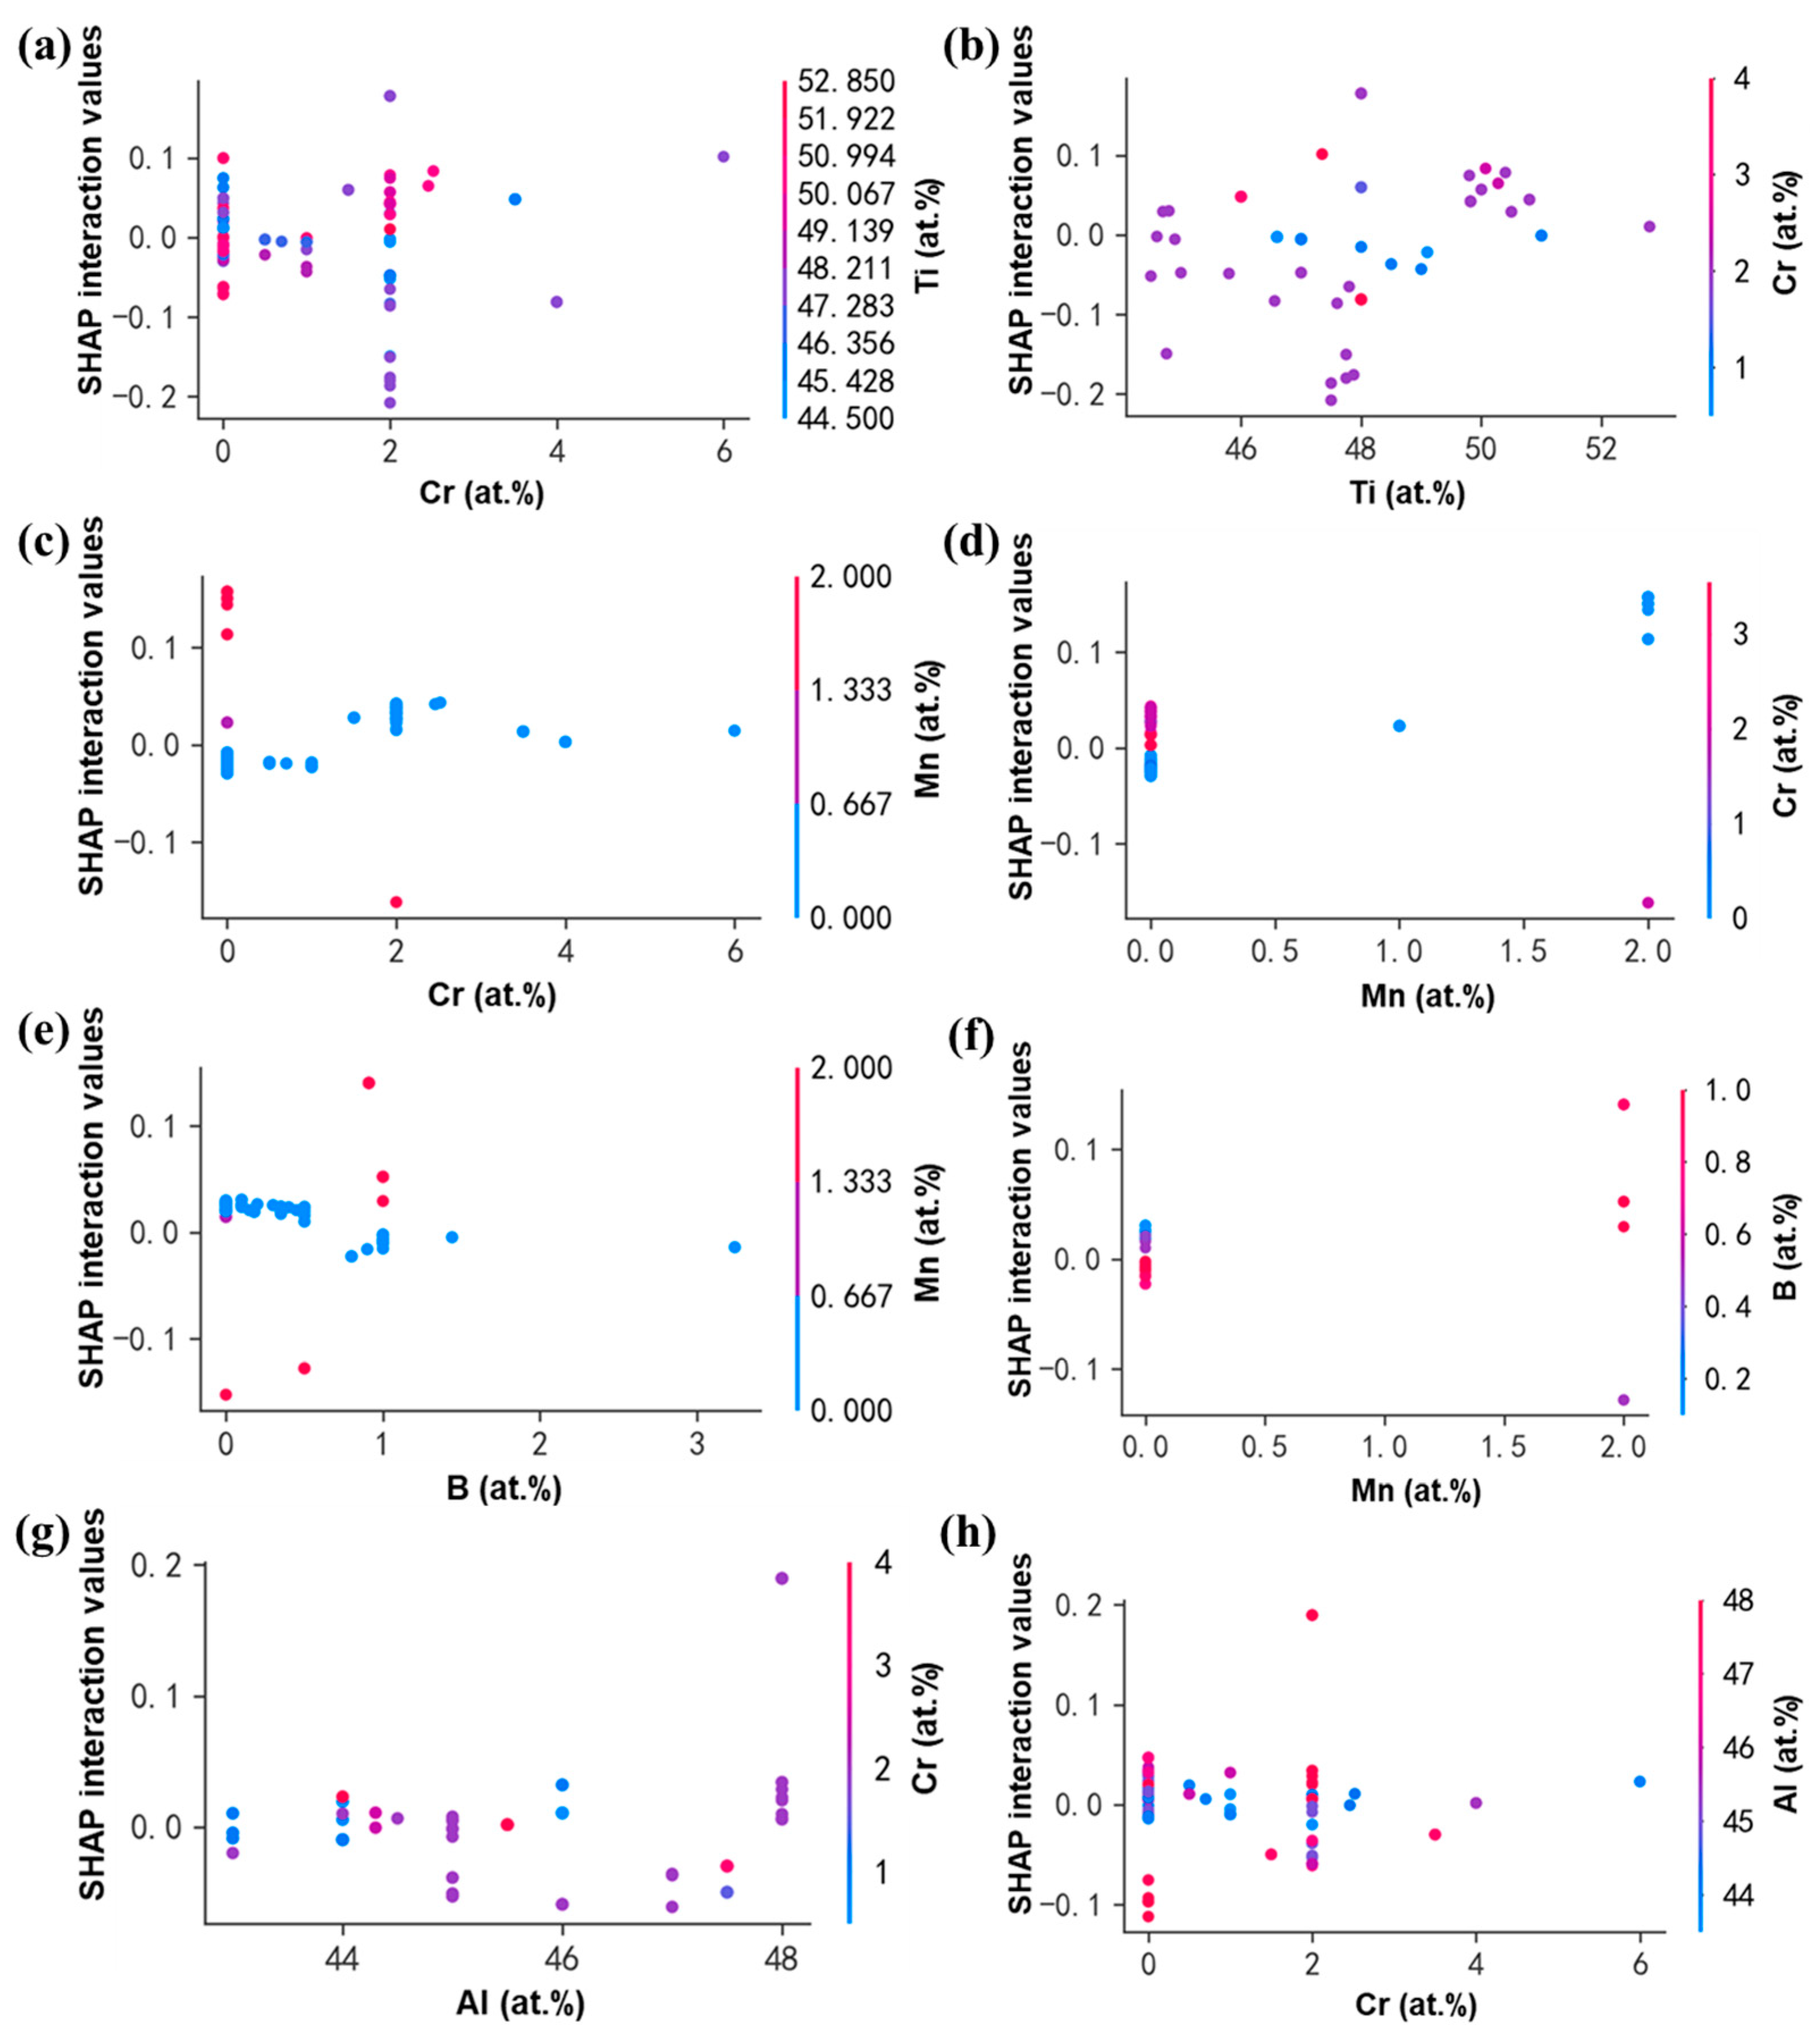
The highly probable interaction direction between two different elements on the RT tensile properties of cast TiAl alloys was basically unveiled by analyses of the SHAP dependence plots. Such as, when the Al content is less than about 45.5 at%, the interaction between Al and B elements is usually positive for the UTS; when the Cr content is more than about 1 at%, the interaction between Cr and Mn elements is generally positive for the EL; when the Al content is 44–46 at%, the interactions between Al and B, as well as between Al and C elements, are generally positive for the YS.

Author Contributions

Conceptualization, S.L.; methodology, L.L.; software, L.L.; validation, S.L. and L.L.; investigation, S.L. and L.L.; resources, S.L.; data curation, S.L. and L.L.; writing—original draft preparation, S.L. and L.L.; writing—review and editing, S.L. and L.L.; visualization, L.L.; supervision, S.L.; project administration, S.L.; funding acquisition, S.L. All authors have read and agreed to the published version of the manuscript.

Funding

The research was fund by A Project Supported by Scientific Research Fund of Zhejiang Provincial Education Department (Y202454336), A Project Supported by State Key Laboratory of Powder Metallurgy, Central South University, Changsha China (Sklpm-KF-015) and a project from Hangzhou City University (204000-581870).

Data Availability Statement

The data that support the findings of this study are available on request from the corresponding author upon reasonable request.

Acknowledgments

The authors would like to thank the above-mentioned fundings for providing financial support.

Conflicts of Interest

The authors declare no conflict of interest.

References

  1. Appel, F.; Clemens, H.; Fischer, F.D. Modeling concepts for intermetallic titanium aluminides. Prog. Mater. Sci. 2016, 81, 55–124. [Google Scholar] [CrossRef]
  2. Zhang, R.; Wang, D.; Liu, S.; Ding, H.; Yuan, S. Hot deformation characterization of lamellar Ti-43Al-2Si alloy fabricated by cold crucible continuous casting. J. Alloys Compd. 2016, 688, 542–552. [Google Scholar] [CrossRef]
  3. Liu, S.; Ding, H.; Guo, J.; Zhang, H.; Chen, Z.; Wang, Q.; Chen, R.; Fu, H. Rapid Cellular Crystal Growth of TiAl-Based Intermetallic without Peritectic Reaction by Melt-Quenching in Ga–In Liquid. Cryst. Growth Des. 2017, 17, 1716–1728. [Google Scholar] [CrossRef]
  4. Zhang, R.; Wang, D.; Liu, S.; Ding, H.; Yuan, S. Effect of microstructures on hot compression behavior of a Ti-43Al-2Si alloy fabricated by cold crucible continuous casting. Mater. Charact. 2018, 144, 424–430. [Google Scholar] [CrossRef]
  5. Liu, S.; Ding, H.; Chen, R.; Guo, J.; Fu, H. Microstructural evolution and mechanical properties of a Cr-rich β-solidifying TiAl-based alloy prepared by electromagnetic cold crucible continuous casting. Mater. Sci. Eng. A 2020, 798, 140205. [Google Scholar] [CrossRef]
  6. Liu, S.; Ding, H.; Chen, R.; Guo, J.; Fu, H. Evolution of rapidly grown cellular microstructure during heat treatment of TiAl-based intermetallic and its effect on micromechanical properties. Intermetallics 2021, 132, 107166. [Google Scholar] [CrossRef]
  7. Liu, S.; Luo, Y.; Ding, H.; Chen, R.; Guo, J.; Fu, H. Improved Fracture Toughness of Polycrystalline γ-TiAl-Based Intermetallic Alloys with a Favorable Deformation Mechanism of Twinning. Adv. Eng. Mater. 2022, 24, 2101710. [Google Scholar] [CrossRef]
  8. Luo, Y.; Liu, S.; Sun, Z.; Liu, B.; Wang, L.; Wang, Y.; Liu, Y. Microstructural evolution during annealing of a powder metallurgical TiAl–Nb composite and its effect on mechanical properties. J. Mater. Res. Technol. 2023, 25, 3654–3669. [Google Scholar] [CrossRef]
  9. Bewlay, B.P.; Nag, S.; Suzuki, A.; Weimer, M.J. TiAl alloys in commercial aircraft engines. Mater. High Temp. 2016, 33, 549–559. [Google Scholar] [CrossRef]
  10. Janschek, P. Wrought TiAl Blades. Mater. Today Proc. 2015, 2, S92–S97. [Google Scholar] [CrossRef]
  11. Bewlay, B.P.; Weimer, M.; Kelly, T.; Suzuki, A.; Subramanian, P.R. The Science, Technology, and Implementation of TiAl Alloys in Commercial Aircraft Engines. MRS Online Proc. Libr. (OPL) 2013, 1516, 49–58. [Google Scholar] [CrossRef]
  12. Yang, R. Advances and challenges of TiAl base alloys. Acta Metall. Sin. 2015, 51, 129–147. [Google Scholar]
  13. Liu, B.G.; Liu, L.H.; Xing, W.D.; Liu, R.C.; Yang, R.; Withey, P.A.; Zhu, J.; Yu, R. Structural stability and the alloying effect of TiB polymorphs in TiAl alloys. Intermetallics 2017, 90, 97–102. [Google Scholar] [CrossRef]
  14. Duan, B.; Yang, Y.; He, S.; Feng, Q.; Mao, L.; Zhang, X.; Jiao, L.; Lu, X.; Chen, G.; Li, C. History and development of γ-TiAl alloys and the effect of alloying elements on their phase transformations. J. Alloys Compd. 2022, 909, 164811. [Google Scholar] [CrossRef]
  15. Musi, M.; Graf, G.; Clemens, H.; Spoerk-Erdely, P. Alloying Elements in Intermetallic γ-TiAl Based Alloys–A Review on Their Influence on Phase Equilibria and Phase Transformations. Adv. Eng. Mater. 2024, 26, 2300610. [Google Scholar] [CrossRef]
  16. Sun, F.-S.; Cao, C.-X.; Yan, M.-G.; Kim, S.-E.; Tailee, Y. Alloying mechanism of beta stabilizers in a TiAl alloy. Metall. Mater. Trans. A 2001, 32, 1573–1589. [Google Scholar] [CrossRef]
  17. Jin, Y.; Wang, J.N.; Yang, J.; Wang, Y. Microstructure refinement of cast TiAl alloys by β solidification. Scr. Mater. 2004, 51, 113–117. [Google Scholar] [CrossRef]
  18. Imayev, R.M.; Imayev, V.M.; Oehring, M.; Appel, F. Alloy design concepts for refined gamma titanium aluminide based alloys. Intermetallics 2007, 15, 451–460. [Google Scholar] [CrossRef]
  19. Han, J.; Xiao, S.; Tian, J.; Chen, Y.; Xu, L.; Wang, X.; Jia, Y.; Du, Z.; Cao, S. Grain refinement by trace TiB2 addition in conventional cast TiAl-based alloy. Mater. Charact. 2015, 106, 112–122. [Google Scholar] [CrossRef]
  20. Cui, N.; Wang, X.-P.; Kong, F.-T.; Chen, Y.-Y.; Zhou, H.-T. Microstructure and properties of a beta-solidifying TiAl-based alloy with different refiners. Rare Met. 2016, 35, 42–47. [Google Scholar] [CrossRef]
  21. Zhang, K.; Hu, R.; Lei, T.; Yang, J. Refinement of massive γ phase with enhanced properties in a Ta containing γ-TiAl-based alloys. Scr. Mater. 2019, 172, 113–118. [Google Scholar] [CrossRef]
  22. Chapman, J.; Ramprasad, R. Nanoscale Modeling of Surface Phenomena in Aluminum Using Machine Learning Force Fields. J. Phys. Chem. C 2020, 124, 22127–22136. [Google Scholar] [CrossRef]
  23. Morgan, D.; Jacobs, R. Opportunities and Challenges for Machine Learning in Materials Science. Annu. Rev. Mater. Res. 2020, 50, 71–103. [Google Scholar] [CrossRef]
  24. Moosavi, S.M.; Jablonka, K.M.; Smit, B. The Role of Machine Learning in the Understanding and Design of Materials. J. Am. Chem. Soc. 2020, 142, 20273–20287. [Google Scholar] [CrossRef]
  25. Lee, K.; Hong, C.; Lee, E.-H.; Yang, W. Comparison of Artificial Intelligence Methods for Prediction of Mechanical Properties. IOP Conf. Ser. Mater. Sci. Eng. 2020, 967, 012031. [Google Scholar] [CrossRef]
  26. Bhandari, U.; Rafi, M.R.; Zhang, C.; Yang, S. Yield strength prediction of high-entropy alloys using machine learning. Mater. Today Commun. 2021, 26, 101871. [Google Scholar] [CrossRef]
  27. Liao, H.; Zhao, B.; Suo, X.; Wang, Q. Prediction models for macro shrinkage of aluminum alloys based on machine learning algorithms. Mater. Today Commun. 2019, 21, 100715. [Google Scholar] [CrossRef]
  28. Xinyu, C.; Yingbo, Z.; Jiaheng, L.; Hui, C. Composition design of 7XXX aluminum alloys optimizing stress corrosion cracking resistance using machine learning. Mater. Res. Express 2020, 7, 046506. [Google Scholar] [CrossRef]
  29. Hart, G.L.W.; Mueller, T.; Toher, C.; Curtarolo, S. Machine learning for alloys. Nat. Rev. Mater. 2021, 6, 730–755. [Google Scholar] [CrossRef]
  30. Rickman, J.M.; Balasubramanian, G.; Marvel, C.J.; Chan, H.M.; Burton, M.-T. Machine learning strategies for high-entropy alloys. J. Appl. Phys. 2020, 128, 221101. [Google Scholar] [CrossRef]
  31. Kaufmann, K.; Vecchio, K.S. Searching for high entropy alloys: A machine learning approach. Acta Mater. 2020, 198, 178–222. [Google Scholar] [CrossRef]
  32. Wen, C.; Zhang, Y.; Wang, C.; Xue, D.; Bai, Y.; Antonov, S.; Dai, L.; Lookman, T.; Su, Y. Machine learning assisted design of high entropy alloys with desired property. Acta Mater. 2019, 170, 109–117. [Google Scholar] [CrossRef]
  33. Liu, Y.; Zhao, T.; Ju, W.; Shi, S. Materials discovery and design using machine learning. J. Mater. 2017, 3, 159–177. [Google Scholar] [CrossRef]
  34. Hu, M.; Tan, Q.; Knibbe, R.; Xu, M.; Jiang, B.; Wang, S.; Li, X.; Zhang, M.-X. Recent applications of machine learning in alloy design: A review. Mater. Sci. Eng. R Rep. 2023, 155, 100746. [Google Scholar] [CrossRef]
  35. Kwak, S.; Kim, J.; Ding, H.; Xu, X.; Chen, R.; Guo, J.; Fu, H. Machine learning prediction of the mechanical properties of γ-TiAl alloys produced using random forest regression model. J. Mater. Res. Technol. 2022, 18, 520–530. [Google Scholar] [CrossRef]
  36. Kwak, S.; Kim, J.; Ding, H.; Xu, X.; Chen, R.; Guo, J.; Fu, H. Using multiple regression analysis to predict directionally solidified TiAl mechanical property. J. Mater. Sci. Technol. 2022, 104, 285–291. [Google Scholar] [CrossRef]
  37. Kwak, S.; Kim, J.; Ding, H.; Liang, H.; Chen, R.; Guo, J.; Fu, H. Prediction improvement of compressive strength and strain of directionally solidified TiAl alloy based on training data size adjustment. J. Mater. Res. Technol. 2024, 30, 5017–5027. [Google Scholar] [CrossRef]
  38. Mangalathu, S.; Hwang, S.-H.; Jeon, J.-S. Failure mode and effects analysis of RC members based on machine-learning-based SHapley Additive exPlanations (SHAP) approach. Eng. Struct. 2020, 219, 110927. [Google Scholar] [CrossRef]
  39. Wang, D.; Thunéll, S.; Lindberg, U.; Jiang, L.; Trygg, J.; Tysklind, M. Towards better process management in wastewater treatment plants: Process analytics based on SHAP values for tree-based machine learning methods. J. Environ. Manag. 2022, 301, 113941. [Google Scholar] [CrossRef]
  40. Yang, Y.; Yuan, Y.; Han, Z.; Liu, G. Interpretability analysis for thermal sensation machine learning models: An exploration based on the SHAP approach. Indoor Air 2022, 32, 12984. [Google Scholar] [CrossRef]
  41. Lundberg, S.M.; Lee, S.-I. A Unified Approach to Interpreting Model Predictions. In Proceedings of the 31st Conference on Neural Information Processing Systems (NIPS 2017), Long Beach, CA, USA, 4–9 December 2017. [Google Scholar]
  42. Hu, D. Effect of composition on grain refinement in TiAl-based alloys. Intermetallics 2001, 9, 1037–1043. [Google Scholar] [CrossRef]
  43. Tian, W.H.; Nemoto, M. Effect of carbon addition on the microstructures and mechanical properties of γ-TiAl alloys. Intermetallics 1997, 5, 237–244. [Google Scholar] [CrossRef]
  44. Wang, Q.; Ding, H.; Zhang, H.; Chen, R.; Guo, J.; Fu, H. Variations of microstructure and tensile property of γ-TiAl alloys with 0–0.5 at% C additives. Mater. Sci. Eng. A 2017, 700, 198–208. [Google Scholar] [CrossRef]
  45. Liu, Z.C.; Lin, J.P.; Li, S.J.; Chen, G.L. Effects of Nb and Al on the microstructures and mechanical properties of high Nb containing TiAl base alloys. Intermetallics 2002, 10, 653–659. [Google Scholar] [CrossRef]
  46. Ding, H.; Nie, G.; Chen, R.; Guo, J.; Fu, H. Influence of oxygen on microstructure and mechanical properties of directionally solidified Ti–47Al–2Cr–2Nb alloy. Mater. Des. 2012, 41, 108–113. [Google Scholar] [CrossRef]
  47. Zhong, H.; Yang, Y.; Li, J.; Wang, J.; Zhang, T.; Li, S.; Zhang, J. Influence of oxygen on microstructure and phase transformation in high Nb containing TiAl alloys. Mater. Lett. 2012, 83, 198–201. [Google Scholar] [CrossRef]
  48. Li, B.H.; Chen, Y.Y.; Hou, Z.Q.; Kong, F.T. Microstructure and mechanical properties of as-cast Ti–43Al–9V–0.3Y alloy. J. Alloys Compd. 2009, 473, 123–126. [Google Scholar] [CrossRef]
  49. Chen, Y.Y.; Li, B.H.; Kong, F.T. Microstructural refinement and mechanical properties of Y-bearing TiAl alloys. J. Alloys Compd. 2008, 457, 265–269. [Google Scholar] [CrossRef]
  50. Huang, S.-C.; Hall, E.L. The effects of Cr additions to binary TiAl-base alloys. Metall. Trans. A 1991, 22, 2619–2627. [Google Scholar] [CrossRef]
  51. Hamzah, E.; Kanniah, M.; Harun, M. Effect of chromium addition on microstructure, tensile properties and creep resistance of as-cast Ti-48Al alloy. J. Mater. Sci. 2007, 42, 9063–9069. [Google Scholar] [CrossRef]
  52. Nishikiori, S.; Matsuda, K.; Nakagawa, Y.G. Microstructural effects on tensile properties of cast TiAl–Fe–V–B alloy. Mater. Sci. Eng. A 1997, 239–240, 592–599. [Google Scholar] [CrossRef]
  53. Knaislová, A.; Novák, P.; Cabibbo, M.; Jaworska, L.; Vojtěch, D. Development of TiAl–Si Alloys—A Review. Materials 2021, 14, 1030. [Google Scholar] [CrossRef] [PubMed]
  54. Klein, T.; Rashkova, B.; Holec, D.; Clemens, H.; Mayer, S. Silicon distribution and silicide precipitation during annealing in an advanced multi-phase γ-TiAl based alloy. Acta Mater. 2016, 110, 236–245. [Google Scholar] [CrossRef]
  55. Liu, S.; Ding, H.; Zhang, H.; Chen, R.; Guo, J.; Fu, H. High-density deformation nanotwin induced significant improvement in the plasticity of polycrystalline γ-TiAl-based intermetallic alloys. Nanoscale 2018, 10, 11365–11374. [Google Scholar] [CrossRef]
  56. Liu, S.; Ding, H.; Chen, R.; Guo, J.; Fu, H. Remarkable improvement in tensile strength of a polycrystalline γ-TiAl-based intermetallic alloy by deformation nanotwins. Mater. Sci. Eng. A 2021, 823, 141692. [Google Scholar] [CrossRef]
  57. Wang, Q.; Ding, H.; Zhang, H.; Chen, R.; Guo, J.; Fu, H. Influence of Mn addition on the microstructure and mechanical properties of a directionally solidified γ-TiAl alloy. Mater. Charact. 2018, 137, 133–141. [Google Scholar] [CrossRef]
  58. Huang, S.-C.; Hall, E.L. Characterization of the effect of vanadium additions to TiAl base alloys. Acta Metall. Mater. 1991, 39, 1053–1060. [Google Scholar] [CrossRef]
  59. Tetsui, T. Effects of high niobium addition on the mechanical properties and high-temperature deformability of gamma TiAl alloy. Intermetallics 2002, 10, 239–245. [Google Scholar] [CrossRef]
  60. Fang, H.; Chen, R.; Yang, Y.; Su, Y.; Ding, H.; Guo, J.; Fu, H. Role of graphite on microstructural evolution and mechanical properties of ternary TiAl alloy prepared by arc melting method. Mater. Des. 2018, 156, 300–310. [Google Scholar] [CrossRef]
  61. Liu, C.T.; Maziasz, P.J. Microstructural control and mechanical properties of dual-phase TiAl alloys. Intermetallics 1998, 6, 653–661. [Google Scholar] [CrossRef]
  62. Chu, W.-Y.; Thompson, A.W. Effects of grain size on yield strength in TiAl. Scr. Metall. Mater. 1991, 25, 641–644. [Google Scholar]
  63. Zhang, W.J.; Appel, F. Effect of Al content and Nb addition on the strength and fault energy of TiAl alloys. Mater. Sci. Eng. A 2002, 329–331, 649–652. [Google Scholar] [CrossRef]
Figure 1. Room-temperature elongation-tensile strength map of typical TiAl alloys, where “PST” and “EMCCDS” are the abbreviations of polysynthetic twinning and electromagnetic cold crucible directional solidification, respectively.
Crystals 15 00468 g001
Figure 2. The interpretative frame for the relationship between alloy elements and RT tensile properties of cast TiAl alloy, in which UTS, EL, and YS represent the ultimate tensile strength, elongation, and yield strength, respectively.
Crystals 15 00468 g002
Figure 3. Three algorithms perform LOOCV on the training sets of the UTS (ac), EL (df) and YS (gi) of cast TiAl alloys. The horizontal axis illustrates the top n key features (alloy elements), while the left vertical axis denotes the R-value and the right vertical axis indicates the RMSE. The blue line depicts the R-value assessment of the model that has been trained on the dataset comprising solely the top n key features, whereas the red line represents the RMSE evaluation of the established model.
Crystals 15 00468 g003
Figure 4. Comparison of predicted and experimental values from the independent testing set (ac) and LOOCV on the training set (df) using RFR, where the horizontal axes are in expected (actual) values, and the vertical axes are in predicted values.
Crystals 15 00468 g004
Figure 5. Feature importance plot of input variables of the well-trained models using RFR for different metrics of RT tensile properties of cast TiAl alloys: (a) UTS, (b) EL, (c) YS. The horizontal axis illustrates the mean of the absolute values of the SHAP values (mean |SHAP values|) for each feature, while the vertical axis denotes the ranking of feature importance based on mean |SHAP values|.
Crystals 15 00468 g005
Figure 6. Heatmap of interaction between features for different metrics of RT tensile properties of cast TiAl alloys, where the values refer to mean |SHAP interaction values|.
Crystals 15 00468 g006
Figure 7. SHAP summary diagram of input variables of the well-trained models using RFR for different metrics of RT tensile properties of cast TiAl alloys: (a) UTS, (b) EL, (c) YS. The horizontal axis illustrates the SHAP values.
Crystals 15 00468 g007
Figure 8. SHAP dependence plots of interaction values between two different elements for the RT UTS of cast TiAl alloys: (a,b) Al–B, (c,d) B–C, (e,f) Al–C and (g,h) B–Nb.
Crystals 15 00468 g008
Figure 9. SHAP dependence plots of interaction values between two different elements for the RT EL of cast TiAl alloys: (a,b) Cr–Ti, (c,d) Cr–Mn, (e,f) Mn–B and (g,h) Cr–Al.
Crystals 15 00468 g009
Figure 10. SHAP dependence plots of interaction values between two different elements for the RT YS of cast TiAl alloys: (a,b) Al–Nb, (c,d) Al–B, (e,f) Al–C and (g,h) B–C.
Crystals 15 00468 g010
Table 1. Alloying elements content ranges and the number of samples containing these elements in (a) the UTS dataset, (b) the YS dataset, and (c) the EL dataset.
ElementsTiAlCrNbBCVNiMnFeMoWHfSiYOTaGd
Content (at%)Bal.43–480–60–8.50–3.240–10–90–0.250–20–1.30–20–20–40–1.30–0.30–0.450–10–0.2
Number16316383147592620826418145279625
(a)
ElementsTiAlCrNbBCVNiMnMoWHfSiYOGd
Content (at%)Bal.43–480–40–80–10–0.50–90–0.20–20–20–20–40–0.50–0.30–0.150–0.2
Number93932886519952788719425
(b)
ElementsTiAlCrNbBCVNiMnFeMoWHfSiYOGd
Content (at%)Bal.43–480–60–80–3.240–10–90–0.250–20–1.30–20–20–40–1.30–0.3 0–0.450–0.2
Number1551557814168221832441514724855
(c)
Table 2. The mean R and RMSE values for both the training and testing sets across 10 iterations using RFR.
Mechanical Properties R train R M S E train R test R M S E test
UTS0.9144.800.8066.75
YS0.9427.30.8045.8
EL0.890.190.770.32
Table 3. The 90% confidence interval of mean |SHAP values| of top 2 chemical elements for different metrics of RT tensile properties of cast TiAl alloys.
Metrics of Tensile PropertyKey Chemical Elements90% Confidence Interval of Mean |SHAP Values|
UTSAl[18.150, 53.778]
B[14.521, 47.786]
ELCr[0.078, 0.232]
Mn[0.046, 0.138]
YSAl[20.999, 50.279]
B[4.534, 30.850]
Table 4. The 90% confidence interval of mean |SHAP interaction values| of top 2 key element pairs for different metrics of RT tensile properties of cast TiAl alloys.
Metrics of Tensile PropertyKey Chemical Elements90% Confidence Interval of Mean |SHAP Interaction Value|
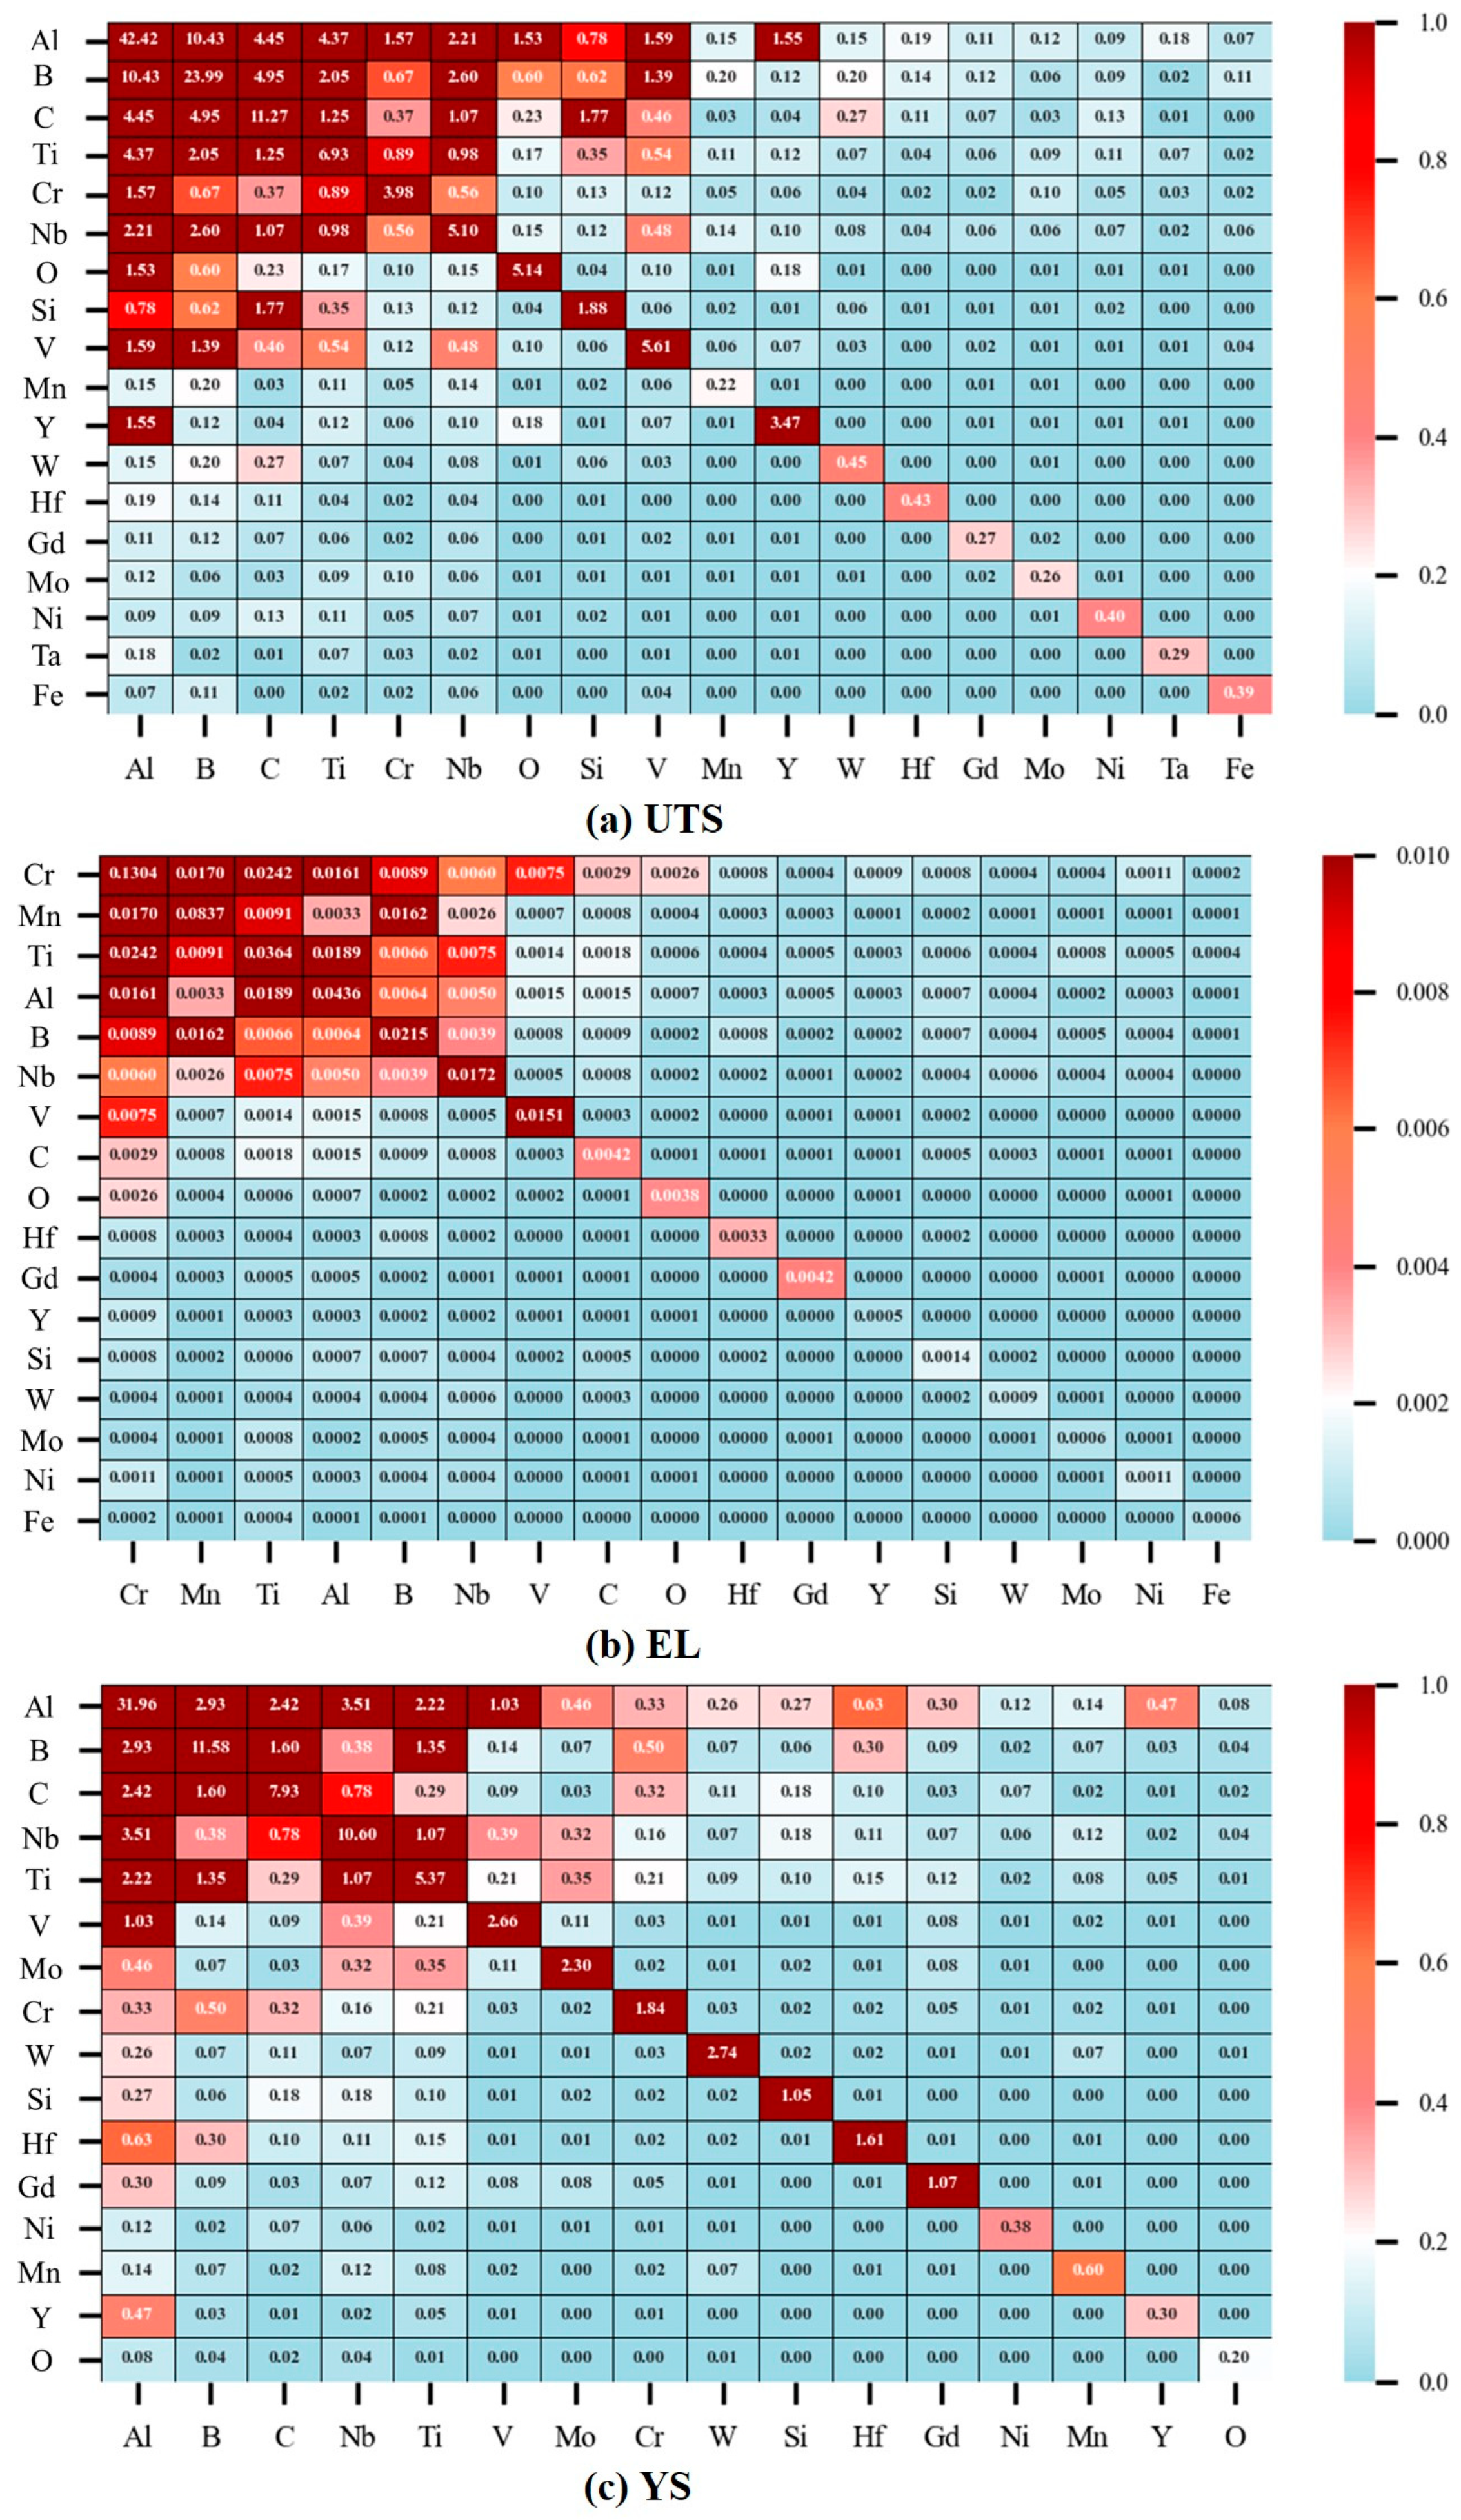
UTSAl-B[4.300, 13.957]
B-C[1.797, 6.870]
ELCr-Ti[0.010, 0.040]
Ti-Al[0.006, 0.032]
YSAl-Nb[1.054, 6.954]
Al-B[0.748, 4.377]
Table 5. Mean |SHAP interaction values| of different elements pairs with respect to UTS, EL, and YS.
UTSELYS
Element PairMean |SHAP Interaction Value|Element PairMean |SHAP Interaction Value|Element PairMean |SHAP Interaction Value|
Al-B10.43Cr-Ti0.0242Al-Nb3.51
B-C4.95Ti-Al0.0189Al-B2.93
Al-C4.45Cr-Mn0.017Al-C2.42
Al-Ti4.37Mn-B0.0162Al-Ti2.22
B-Nb2.60Cr-Al0.0161B-C1.6
Al-Nb2.21Mn-Ti0.0091B-Ti1.35
B-Ti2.05Cr-B0.0089Nb-Ti1.07
C-Si1.77Cr-V0.0075Al-V1.03
Al-V1.59Ti-Nb0.0075C-Nb0.78
Al-Cr1.57Ti-B0.0066B-Cr0.5
Note: The mean values for absolute value of SHAP interaction value, namely mean |SHAP interaction values|, of different element pairs are arranged in descending order.
Disclaimer/Publisher’s Note: The statements, opinions and data contained in all publications are solely those of the individual author(s) and contributor(s) and not of MDPI and/or the editor(s). MDPI and/or the editor(s) disclaim responsibility for any injury to people or property resulting from any ideas, methods, instructions or products referred to in the content.

