Article

Microstructural Investigation and High-Temperature Oxidation Performance of K417G Alloy Prepared by Wide-Gap Brazing

1
Guangdong College of Industry and Commerce, Guangzhou 510510, China
2
Guangdong Key Laboratory for Advanced Metallic Materials Fabrication and Forming, National Engineering Research Center of Near-Net-Shape Forming for Metallic Materials, South China University of Technology, Guangzhou 510640, China
3
School of Mechanical Engineering and Automation, Fuzhou University, Fuzhou 350116, China
*
Authors to whom correspondence should be addressed.
Crystals 2025, 15(5), 434; https://doi.org/10.3390/cryst15050434 (registering DOI)
Submission received: 16 April 2025 / Revised: 29 April 2025 / Accepted: 1 May 2025 / Published: 2 May 2025

Abstract

:
K417G superalloy is widely applied in gas turbine components such as blades, vanes, and nozzles. In this work, the oxidation behavior and mechanism of K417G alloy prepared by wide-gap brazing were investigated in air at 800, 900, 1000, and 1100 °C. Microstructures of the bonded joints differ in the wide-gap braze region (WGBR) and base metal (BM). The surface and cross-sectional morphology, composition, and structure of specimens were analyzed by XRD, SEM, and EDS after oxidation tests. The experimental data demonstrate that the WGBR‌ (wide-gap brazed region) exhibits markedly superior oxidation resistance compared to the BM‌ (base material) under elevated-temperature conditions exceeding 1000 °C. This performance disparity is quantitatively validated by oxidation kinetics analysis, where the weight gain curve of the WGBR demonstrates parabolic oxidation kinetics, as evidenced by its significantly lower parabolic rate constant relative to the BM. The oxide layers of the BM and WGBR are similar after oxidation at high temperatures of 800–900 °C, and they consist of an outermost layer of NiO, a middle mixed layer of Cr2O3, and an innermost layer of dendritic Al2O3. However, when the temperature is between 1000 and 1100 °C, the NiO on the surface of the BM falls off due to thermal expansion coefficient mismatch in coarse-grained regions, resulting in oxidation mainly divided into outer layer Cr2O3 and inner layer Al2O3 and TiO2. Under high-temperature oxidation conditions (1000–1100 °C), a structural transition occurs in the oxide scale of the BM‌, with the underlying mechanism attributable to grain-coarsening-induced oxide scale destabilization‌. Specifically, the coarse-grained structure of the BM (characteristic grain size exceeding 50 μm) is exhibited. Therefore, the WGBR demonstrates outstanding oxidation resistance, as evidenced by the formation of a continuous Al2O3 scale with parabolic rate constants of about 1.38 × 10⁻³ mg2·cm−4·min−1 at 1100 °C.

1. Introduction

K417G superalloy is a nickel-based precipitation-hardened cast superalloy [1]. It was initially developed by the Institute of Metal Research, Chinese Academy of Sciences, as a replica of the American IN100 superalloy, resulting in the successful creation of the K417 cast superalloy. Subsequently, the K417G alloy was further developed, exhibiting advantages such as low density, high intermediate-temperature strength, good plasticity, and excellent corrosion resistance. As a result, it has been widely used in hot-section components of aero-engines, such as turbine blades and guide vanes [2,3,4,5]. In recent years, with the rapid and sustained development of industrial production, hot-section components are subjected to long-term service in harsh environments involving high temperatures and gas flow, making them highly susceptible to the initiation and propagation of microcracks into large-gap cracks. Therefore, the high-quality repair of large-gap cracks in high-temperature components has become a critical method for extending equipment service life [6].
Currently, the primary technique for repairing large-gap cracks in superalloys is wide-gap brazing technology [7]. This method is based on the Transient Liquid Phase (TLP) bonding principle, where the filler material consists of a small amount of low-melting-point alloy containing melting point depressants (MPDs) and a high-melting-point alloy with a composition close to that of the base metal. Cheng et al. [8] studied the wide-gap brazing of K417G alloy with low-melting-point nickel base alloy powder containing boron (LMP) and high-melting-point nickel base alloy powder (HMP). The effect of the composition of filler metal on microstructure evolution and mechanical properties of the joint was analyzed, and the strengthening mechanism of the joint was investigated. When the ratio of HMP in the filler metal increases to 95 wt%, B can be uniformly diffused into the HMP, and dispersed granular M3B2 borides at the interface are obtained. The tensile strength of the joint at room temperature and 600 °C is 971 and 934 MPa, respectively, reaching the strength of the base metal. Ren [9] reported the microstructure evolution and mechanical properties of wide-gap brazed K417G superalloy joints with BNi-5 filler alloy and additive superalloy powders. The brazing experiment was conducted at 1200 °C for 30 min. B atoms uniformly diffused through the K417G alloy and additive alloy. The interfacial evolution and diffusion behavior were investigated. With the prolonging of the holding time, a stronger mutual element diffusion phenomenon occurred. The joints brazed at 1150 °C for 30 min exhibit the highest average tensile strength of 404 MPa tested at 950 °C.
However, during the service of aero-engines, repaired hot-section components such as turbine blades endure complex and extreme working conditions, including high temperatures, high pressure, and high rotational speeds [10]. Consequently, the repaired components are prone to high-temperature oxidation, which leads to surface depletion of strengthening elements, loss of strength, and crack initiation, ultimately resulting in component failure. Thus, oxidation resistance has become one of the key indicators for evaluating the repair performance of superalloys [11]. Revealing the initial oxidation behavior of K417G superalloys is significant for a better understanding of the oxidation mechanism of turbine blades during service conditions. High-temperature oxidation testing under atmospheric conditions is the most commonly used method for assessing the oxidation behavior of superalloys [12,13]. Different design approaches for wide-gap brazing of superalloys result in variations in service temperature and performance. However, research on their oxidation behavior and the underlying differences remains limited.
This study focuses on the oxidation resistance of wide-gap brazed K417G alloy at 800 °C, 900 °C, 1000 °C, and 1100 °C. It systematically investigates the oxidation kinetics, phase composition of oxide layers, surface morphology, and cross-sectional microstructure, explores the high-temperature oxidation mechanisms, and provides a theoretical foundation for optimizing the comprehensive performance of large-gap powder-metallurgy-bonded joints.

2. Experimental Section

2.1. Materials and Sample Preparation

The microstructures of the bonded specimens were measured by NOVA NANOSEM 430 field emission Electron Backscatter Diffraction (EBSD). The EBSD data were analyzed using the Channel 5 software. Figure 1a,b reveal that the joint primarily consists of the base metal (BM) region and the wide-gap brazed region (WGBR). The BM exhibits coarse grains of 2–5 mm, resulting from the casting process (Figure 1c). The BM region contains a γ-austenite matrix, γ′ precipitates, γ/γ′ eutectic structures, and MC-type carbides as its main phases [14,15]. In contrast, as shown in Figure 1d, the WGBR displays fine grains ranging from 20 to 100 μm. This refined grain structure is attributed to the powder sintering process, where the grain size may correlate with the initial powder particle size. The WGBR predominantly comprises the same matrix phases as the BM (γ-austenite matrix and γ′ precipitates), along with M3B2 white boride particles, while γ/γ′ eutectic structures are absent [16].

2.2. Oxidation Tests

Circular specimens with dimensions of Φ4 × 3 mm were sectioned from the BM, joint interface, and WGBR. The specimens were first ground with 800-grit sandpaper, mechanically polished, and then ultrasonically cleaned three times in a mixed solution of alcohol and acetone, followed by drying. Isothermal oxidation experiments were conducted using a simultaneous thermal analyzer (STA 449C, DSC/TGA). The heating rate was set to 20 °C/min. Prior to the target oxidation temperatures (800 °C, 900 °C, 1000 °C, and 1100 °C) being reached, inert argon gas was purged to protect the specimens from pre-oxidation. Upon reaching the target temperatures, a mixed gas containing 79% N2 and 21% O2 (simulating air composition) was introduced for isothermal oxidation over 1440 min.

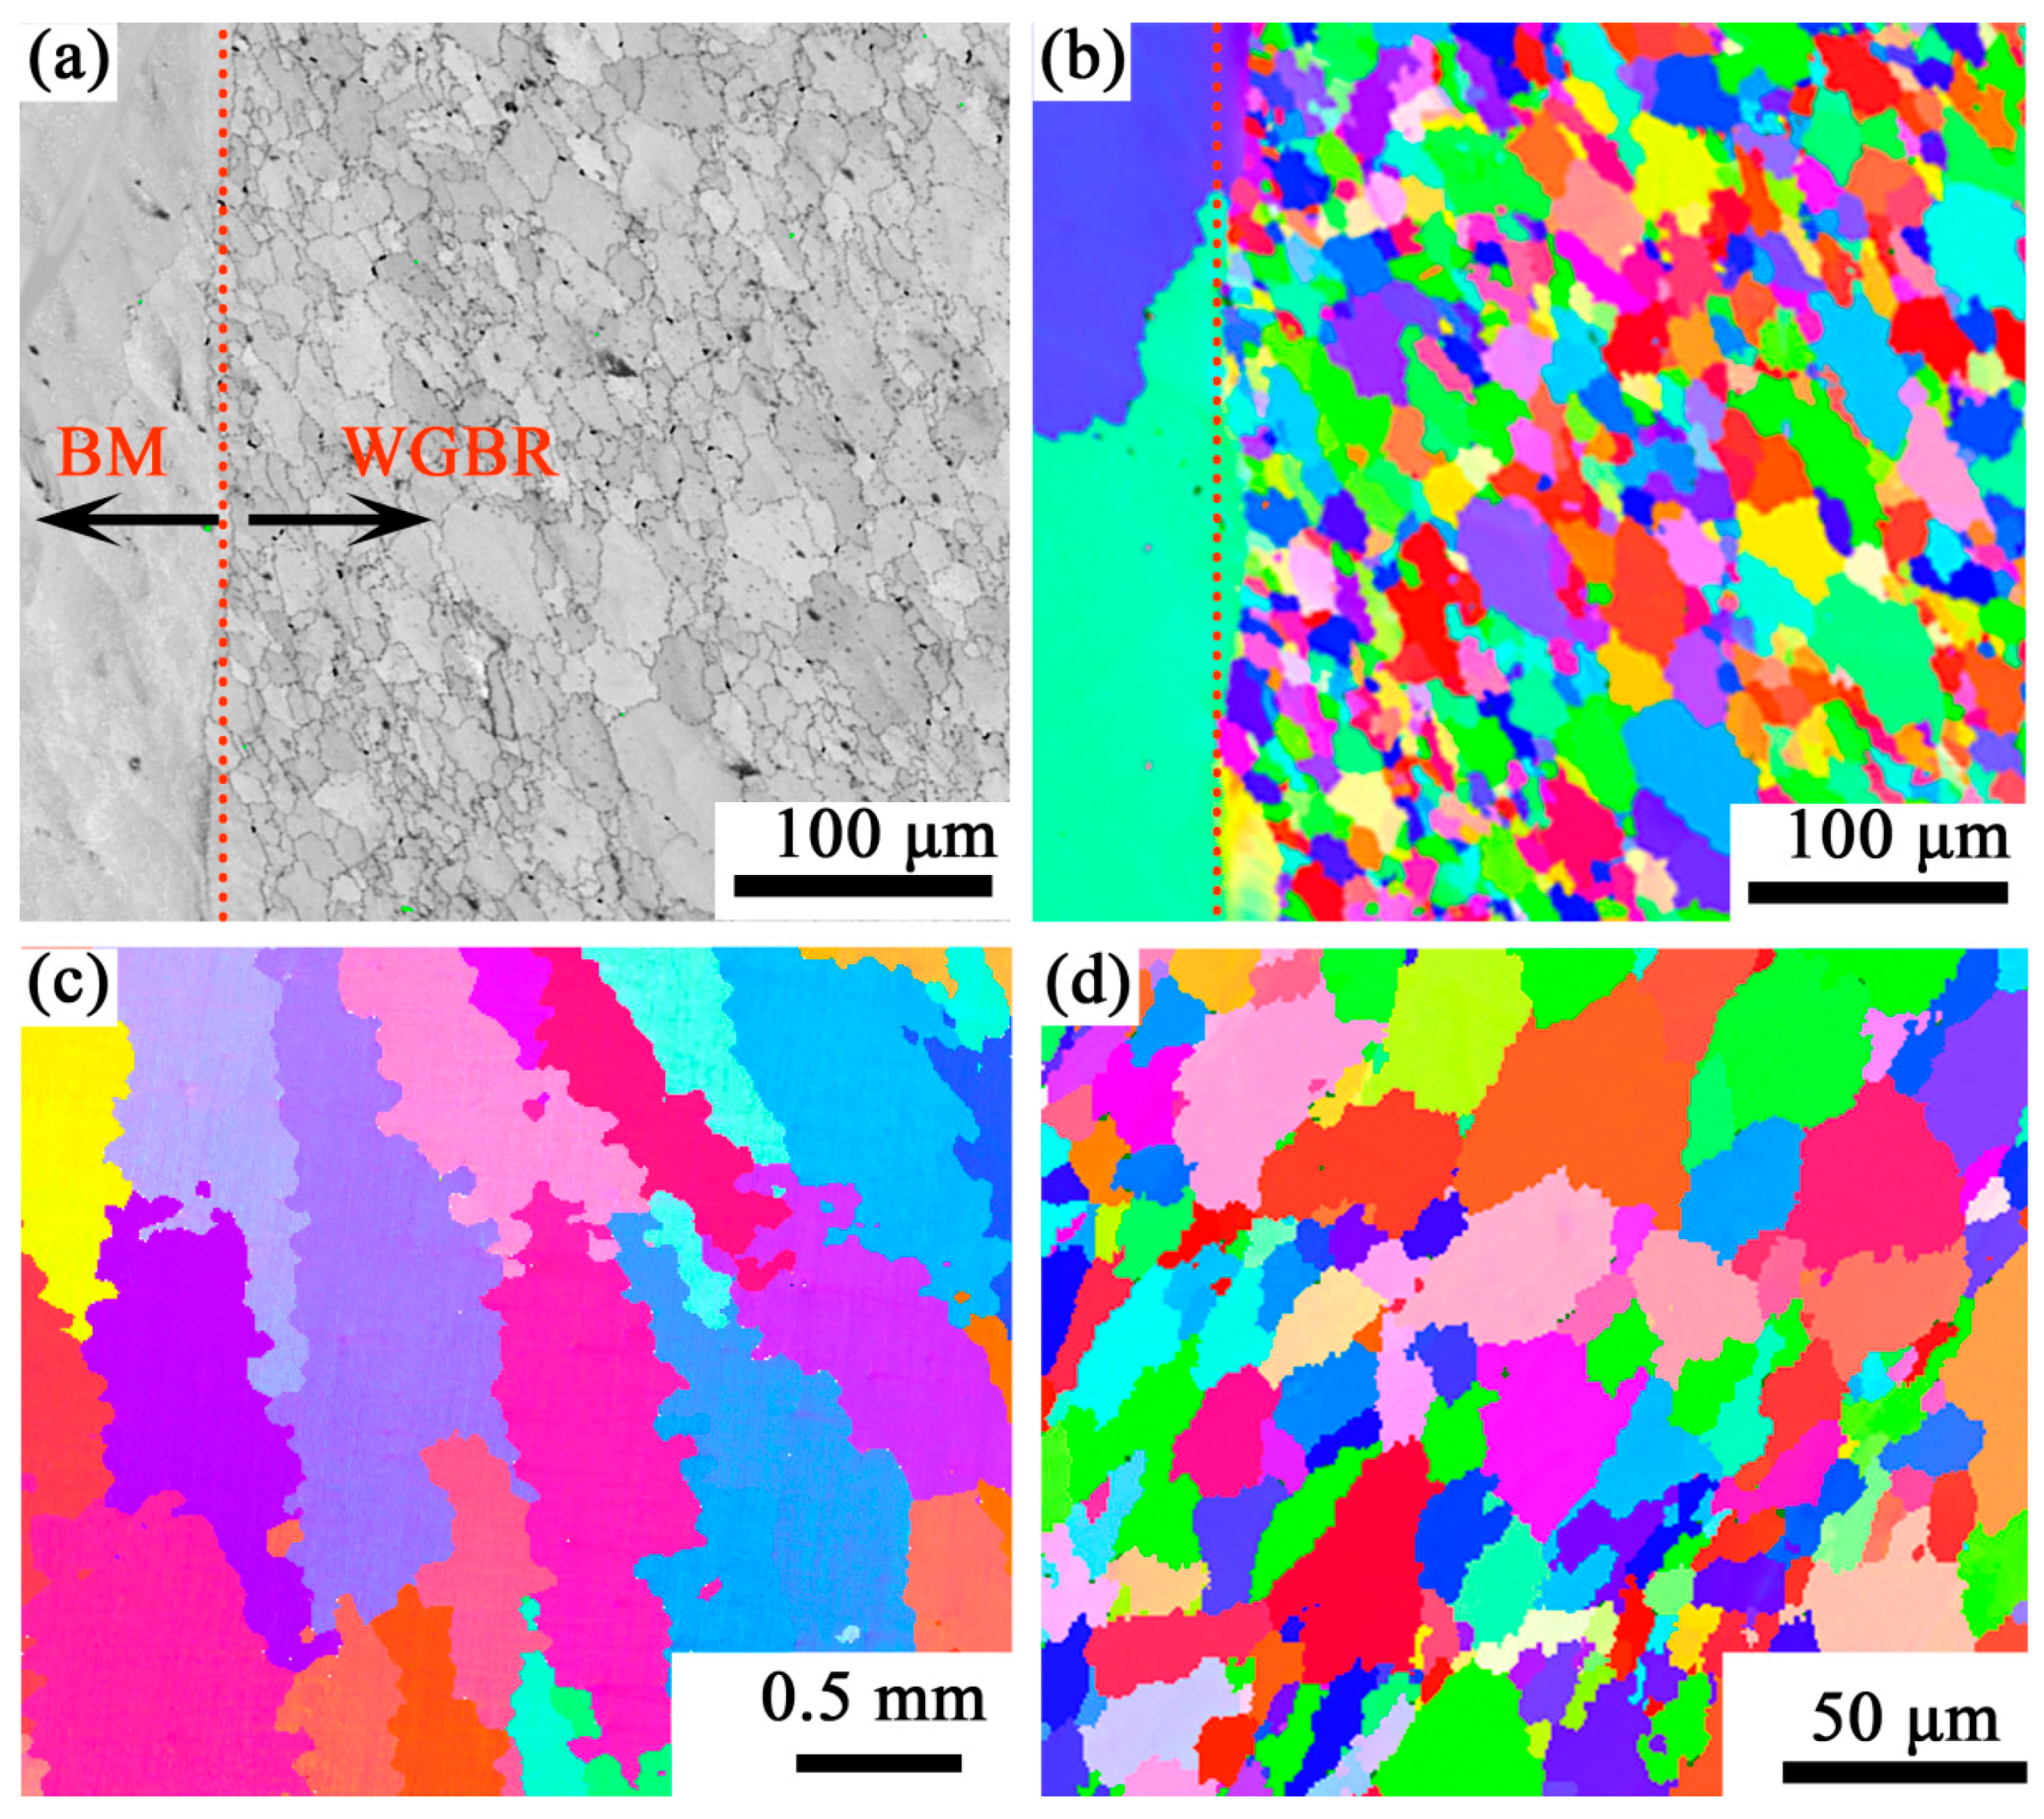
2.3. Microstructural Characterization

The surface and cross-sectional morphologies of the oxide layers were examined using a scanning electron microscope (SEM, XL-30 FEG), while their chemical compositions were analyzed via energy-dispersive spectroscopy (EDS, Oxford X-max 80). The distribution of major elements within the oxide layers was characterized by electron probe microanalysis (EPMA, JXA-8230). Phase identification and quantification were carried out by X-ray diffraction (XRD) on an STOE STADI P diffractometer (STOE & Cie. GmbH) using Mo Kα1 radiation (λ = 0.7093 Å). The step size was 0.02°, the scanning speed was 0.05°/min, and the scanning range was 20–80°. A TEM sample of a cross-section of oxide film was prepared by an FEI Helios Nanolab 600 focused ion beam (FIB) microscope. The crystal structure of the oxide film was identified by a JEM-2100F transmission electron microscope (TEM).

3. Results

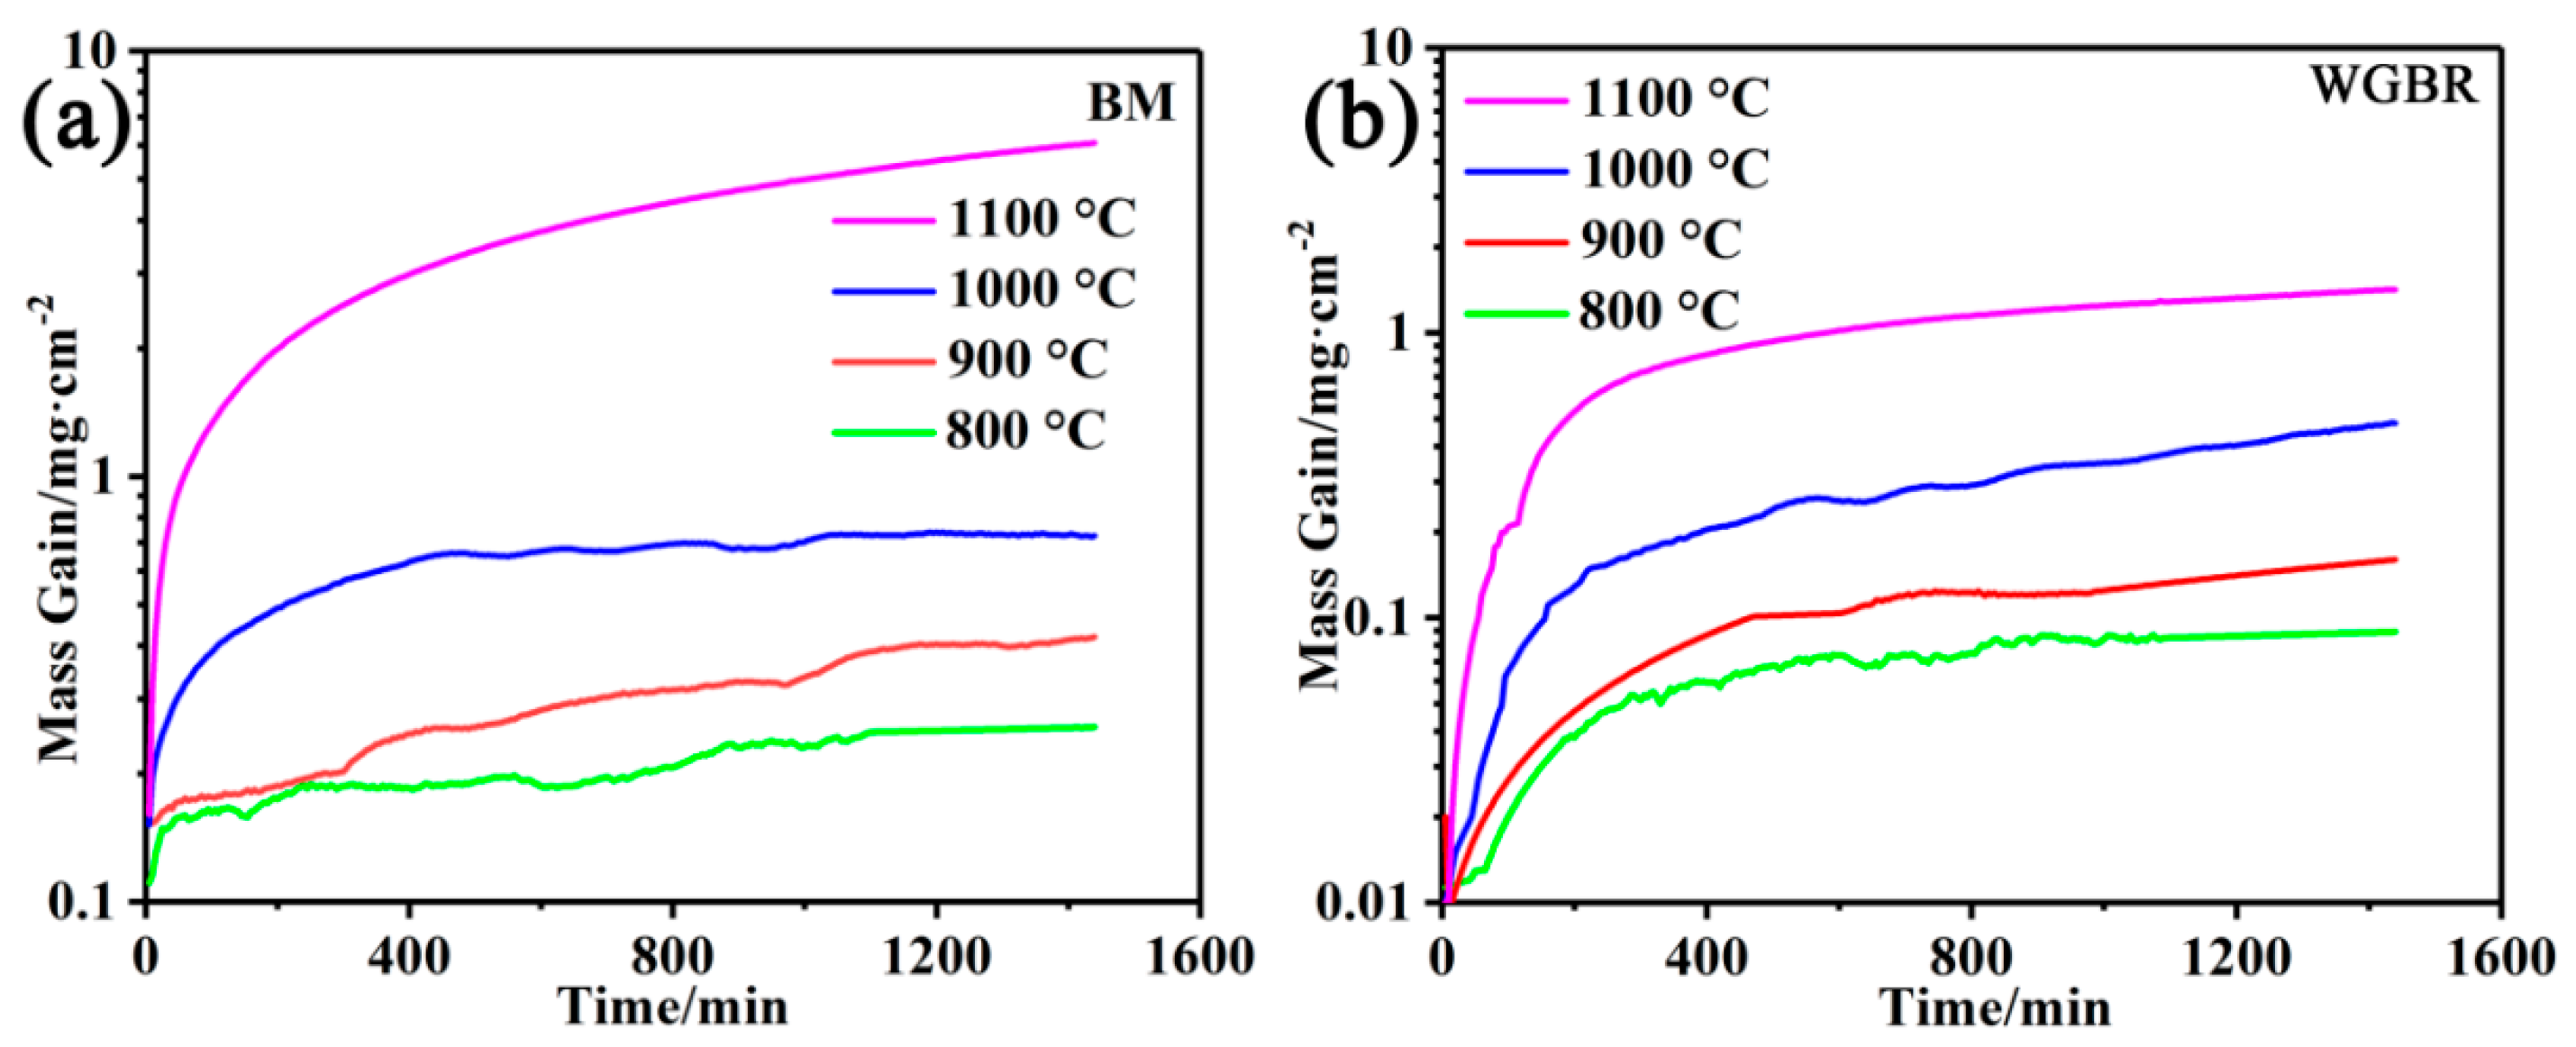
3.1. Oxidation Behaviors at High Temperature

Figure 2 shows the isothermal oxidation kinetics curves of the BM and WGBR at 800 °C, 900 °C, 1000 °C, and 1100 °C. The results indicate that the oxidation process of the superalloy primarily consists of two stages: an initial rapid oxidation phase followed by a stabilized oxidation phase. This behavior can be attributed to the following mechanisms:
Initial stage: Oxygen directly reacts with surface elements to form oxides or oxide films, leading to a high oxidation rate.
Later stage: Reactants combine through the diffusion of cations and anions across the oxide layer, rendering the oxidation rate diffusion-controlled and consequently slower.
This observation aligns with previous reports [17]. The oxidation behavior of the tested alloy follows the same trend and adheres to a parabolic law, as illustrated in Figure 3. Specifically, rapid mass gain occurs during the initial stage, while the oxidation rate gradually decreases over time. The accelerated initial oxidation is driven by oxide nucleation at surface defects (e.g., grain boundaries), whereas the subsequent rate reduction reflects the transition to diffusion-controlled kinetics as nucleation sites diminish.
Additionally, the oxidation rates of both the BM and WGBR increase significantly with temperature. Notably, the BM exhibits a relatively low oxidation rate below 1000 °C, with an average rate of 0.50 × 10⁻³ mg·cm−2·min−1 after 1440 min at 1000 °C. However, this value surges to 42.24 × 10⁻³ mg·cm−2·min−1 at 1100 °C, representing a two-order-of-magnitude increase (see Table 1). In contrast, the WGBR demonstrates a much lower oxidation rate of 1.00 × 10⁻³ mg·cm−2·min−1 at 1100 °C. Furthermore, the WGBR exhibits slow mass gain and no oxide spallation after 1440 min at 1100 °C, whereas the BM suffers from severe oxide layer detachment. These findings confirm that the BM undergoes more pronounced oxidation than the WGBR under identical conditions.
According to oxidation kinetics theory, the oxidation rate of metals is controlled by the diffusion of oxygen ions and metal ions through the oxide layer, which can be expressed as follows:
K p = m 2 t
In the equation, Kp represents the parabolic rate constant, Δm denotes the mass gain per unit area, and t is the oxidation time. The calculated results (Table 2) show that the oxidation rate constants of both the BM and WGBR at 1100 °C are significantly higher than those at 800 °C, 900 °C, and 1000 °C. Notably, Kp-WGBR exceeds Kp-BM at 800–1000 °C, whereas Kp-BM becomes markedly greater than Kp-WGBR at 1100 °C. This indicates that the oxide layer of the WGBR exhibits superior high-temperature oxidation resistance at temperatures up to 1000 °C, effectively reducing the oxidation rate.
Furthermore, the Kp value of the WGBR exhibits significant temperature dependence, increasing by an order of magnitude for every 100 °C rise in temperature. A comparison with the literature [18] reveals that the oxidation rate constant of the WGBR closely approximates the growth rate constant of Cr2O3. Consequently, the diffusion activation energies of O2− and Cr3+ ions were calculated. Since elemental diffusion is a thermally activated process, it follows the Arrhenius equation:
K p = K 0 e x p Q R T
where the following definitions hold:
  • K0 = Pre-exponential constant;
  • Q = Activation energy (430 kJ/mol for the alloy);
  • R = Universal gas constant;
  • T = Absolute temperature.
The calculated activation energy Q of the alloy is 430 kJ/mol, which matches the diffusion activation energy of O2− ions in Cr2O3 films. This confirms that the oxidation process of the WGBR is predominantly controlled by the inward diffusion of O2− ions.

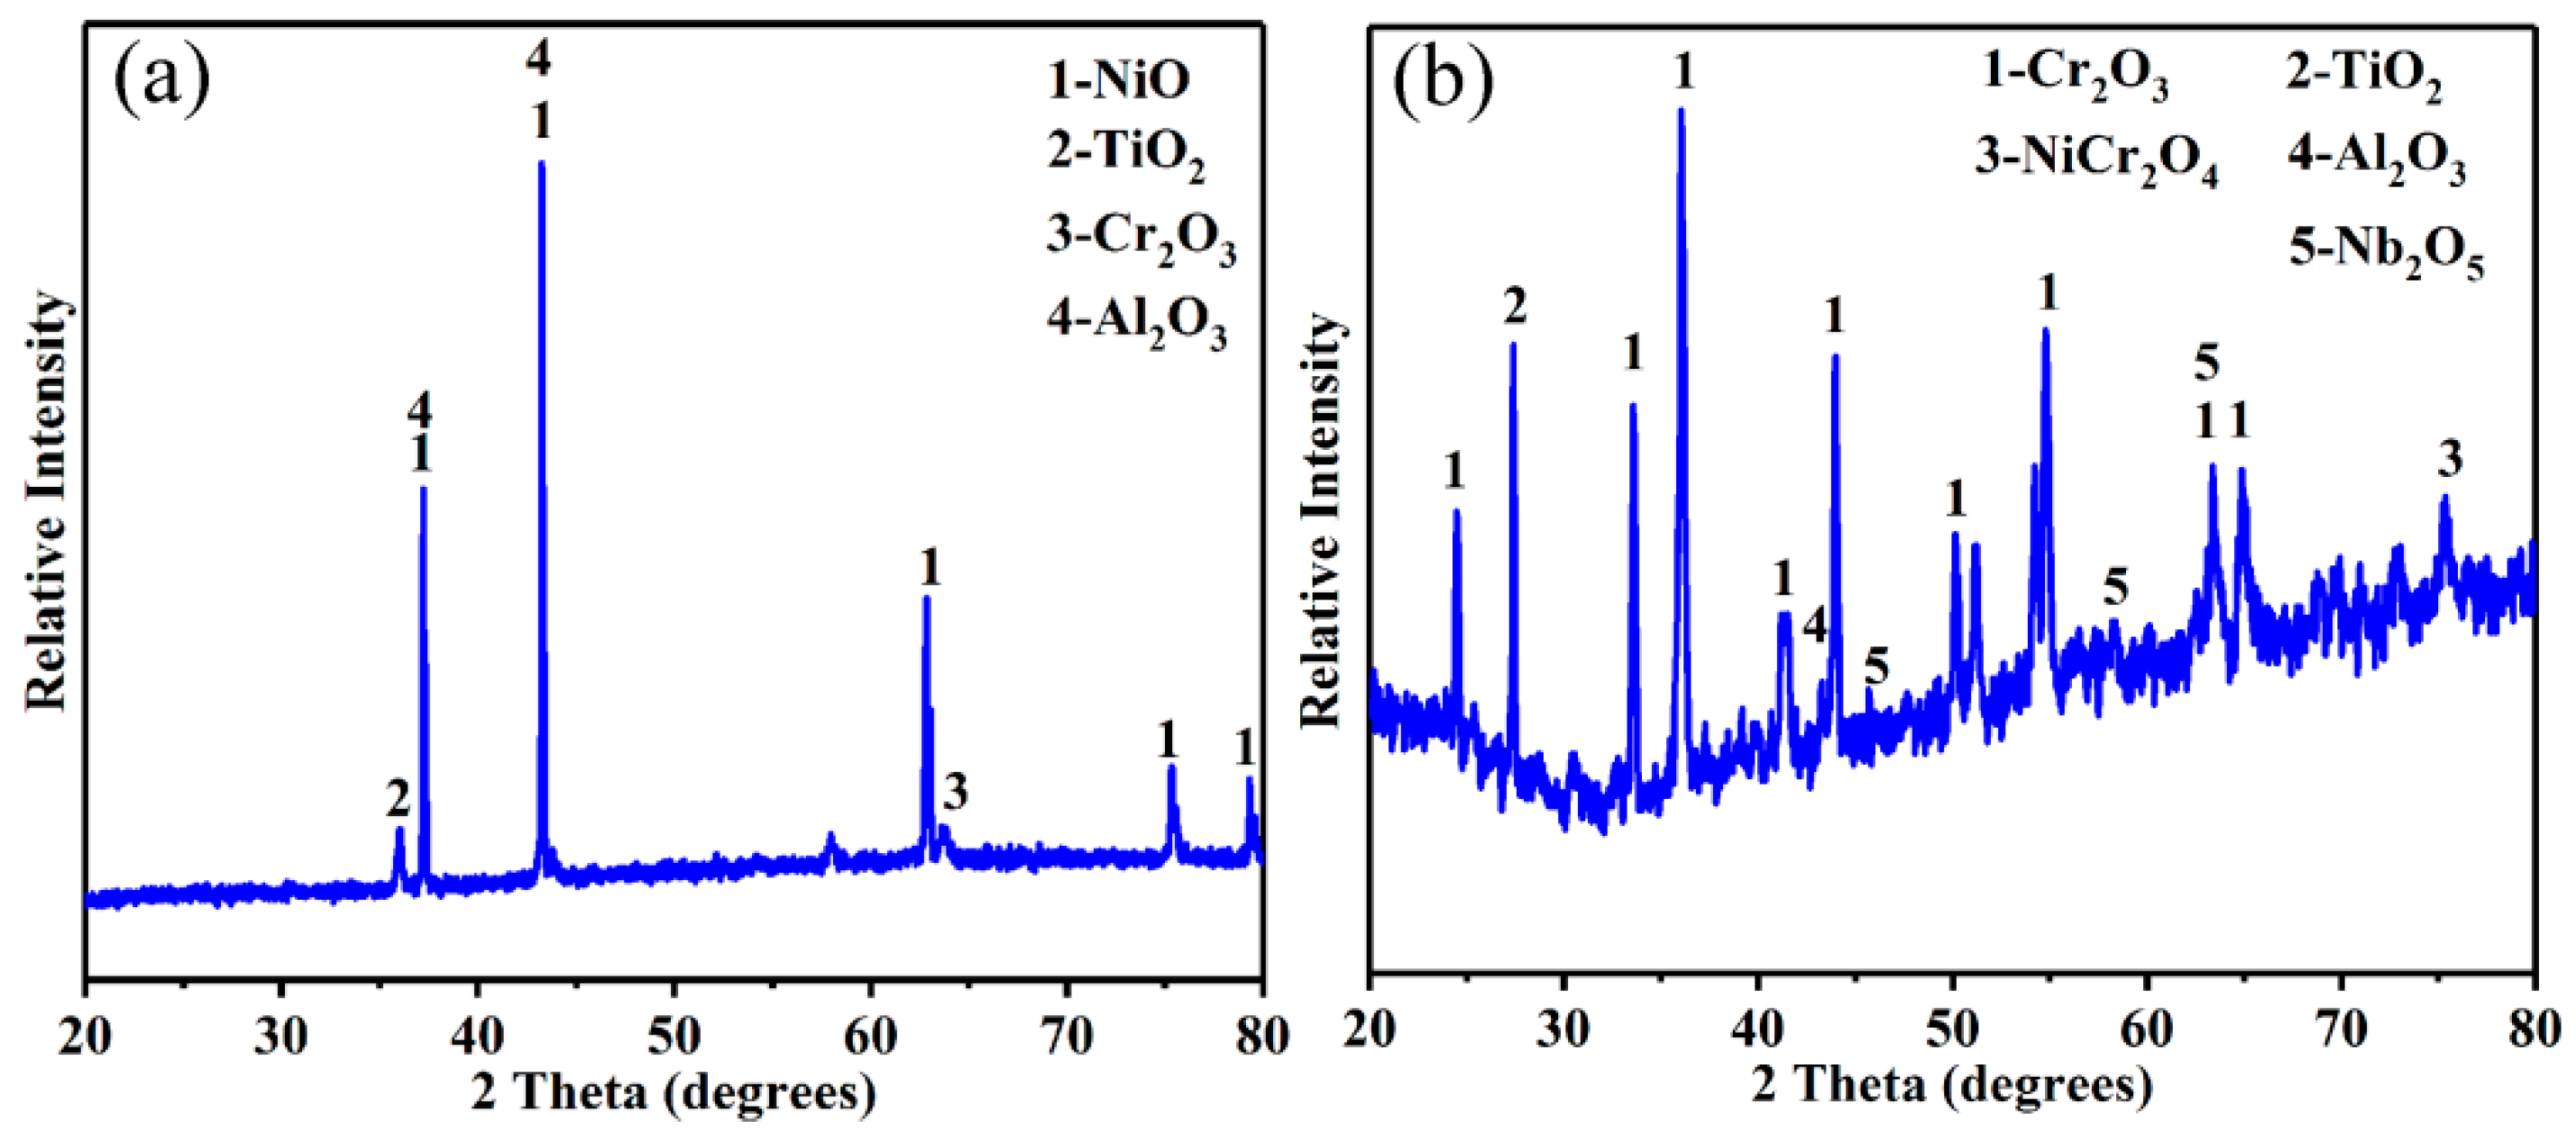
3.2. Oxide Composition

Within the temperature range of 800–1000 °C, the high-temperature oxidation behaviors of the BM and WGBR are fundamentally similar.
Figure 4 illustrates the surface oxide compositions of the BM and WGBR after 1440 min of oxidation at 1000 °C. As shown in Figure 4a, the oxide layer on the BM primarily consists of NiO, TiO2, and Cr2O3 after 1440 min of isothermal oxidation. Previous studies [19] have reported that NiO and Cr2O3 in the oxide layer of K417G alloy begin to form at 800 °C. With increasing temperature, Ti elements from the substrate continuously diffuse outward through the oxide layer and are oxidized to form TiO2.
In contrast, Figure 4b demonstrates that the oxide layer on the WGBR is predominantly composed of Cr2O3, NiCr2O4, and TiO2. This indicates that the WGBR preferentially forms oxides such as NiCr2O4 and Cr2O3 under these conditions, showing a distinct compositional difference compared to the BM. This difference may be attributed to the presence of multiple active elements (e.g., Al and Ti) in the WGBR, which collectively participate in the oxidation reactions. These elements reduce the oxidation propensity of Ni, resulting in minimal NiO formation in the WGBR oxide layer.

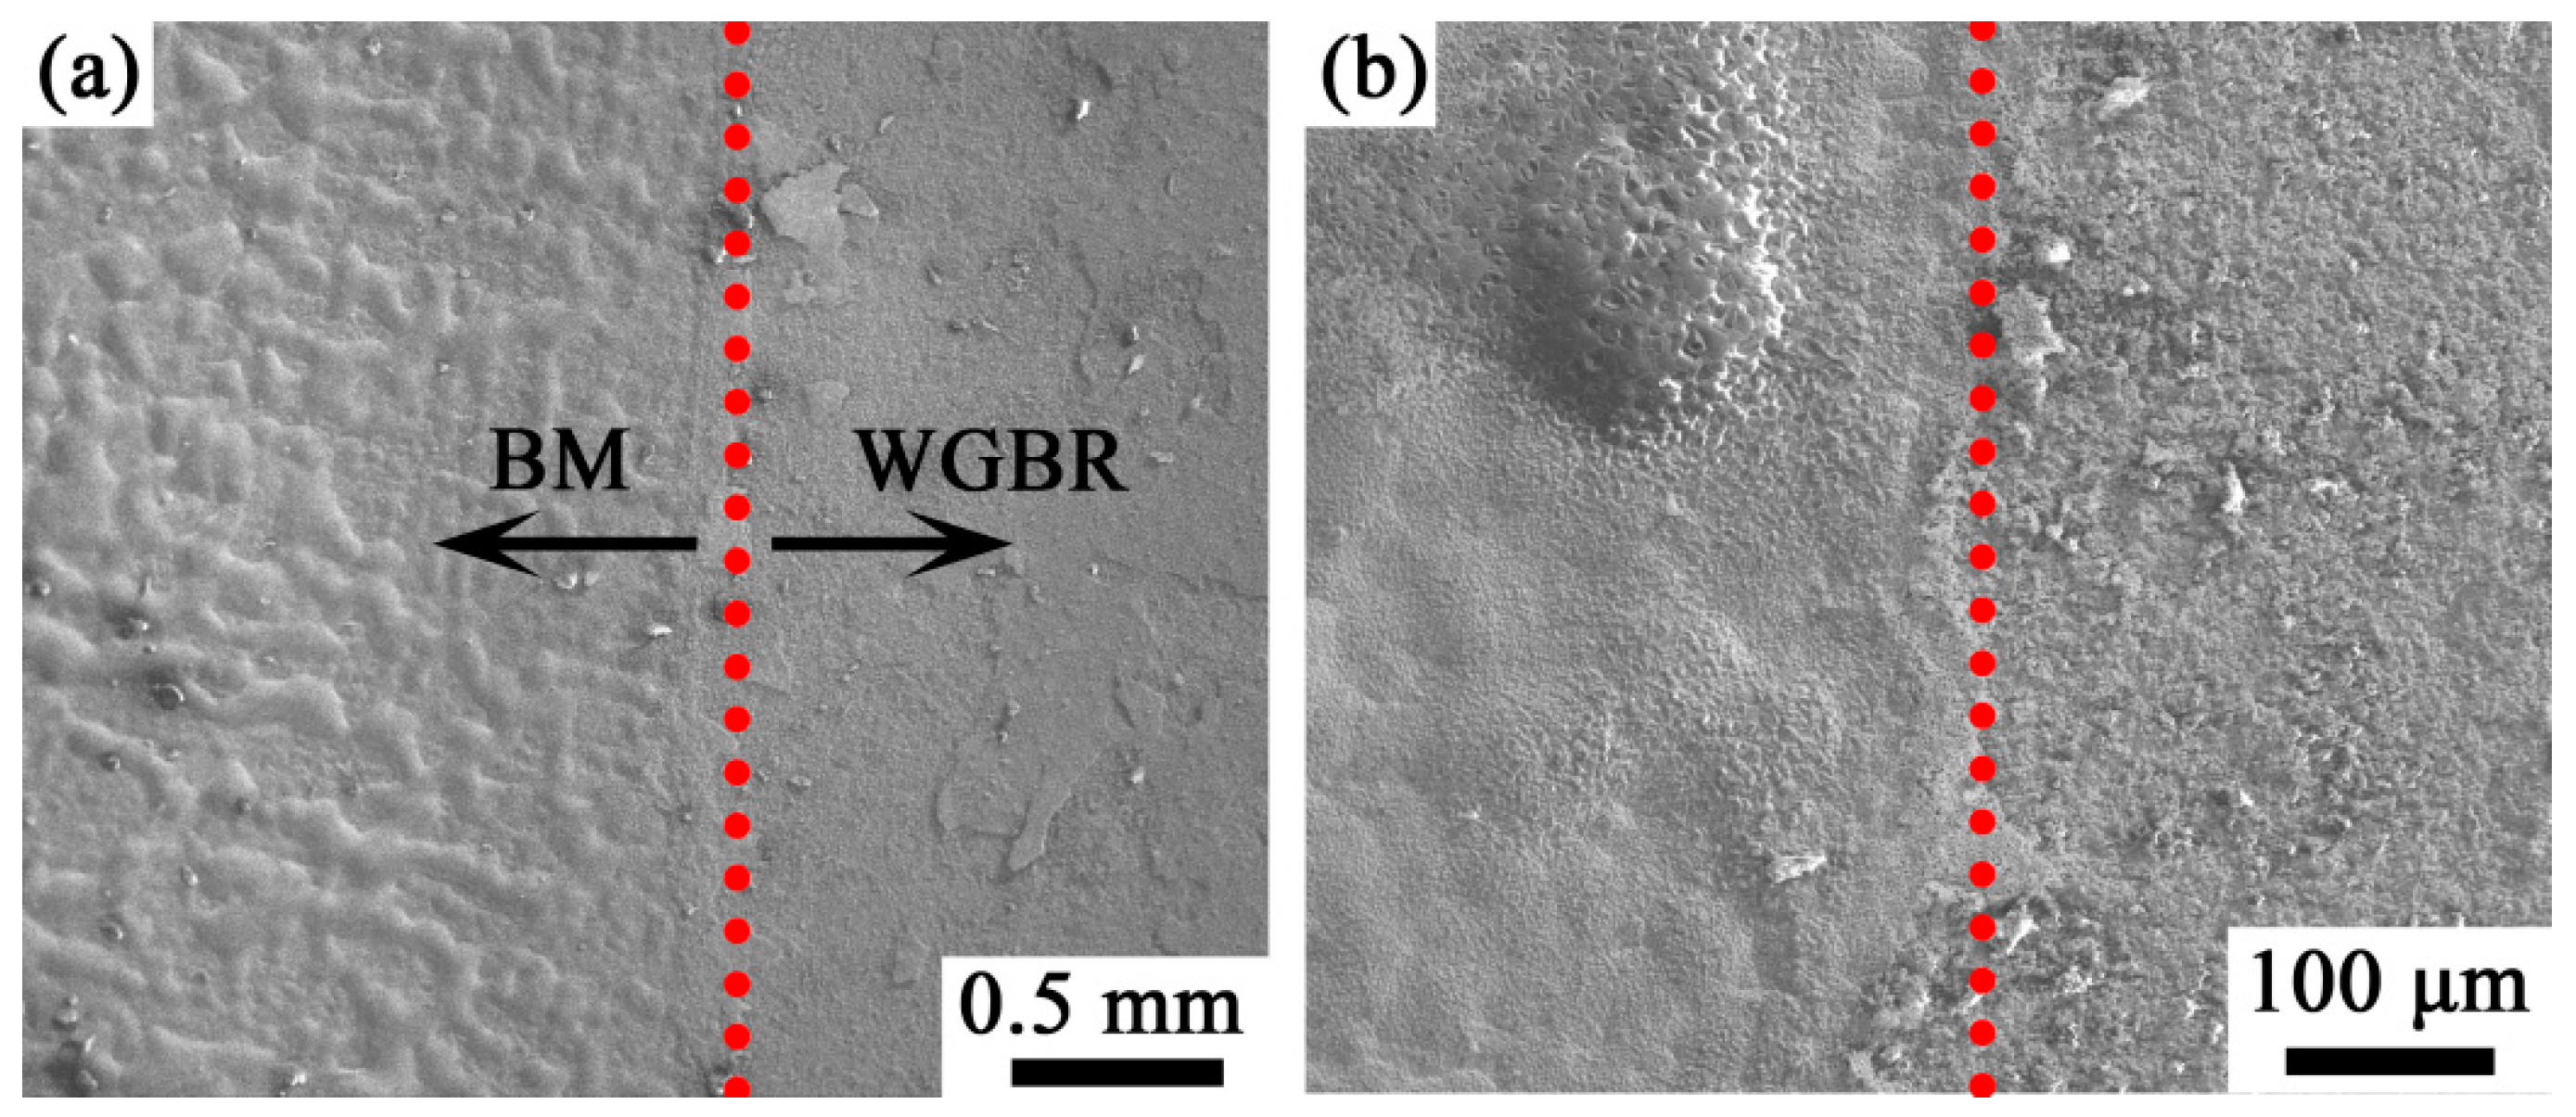
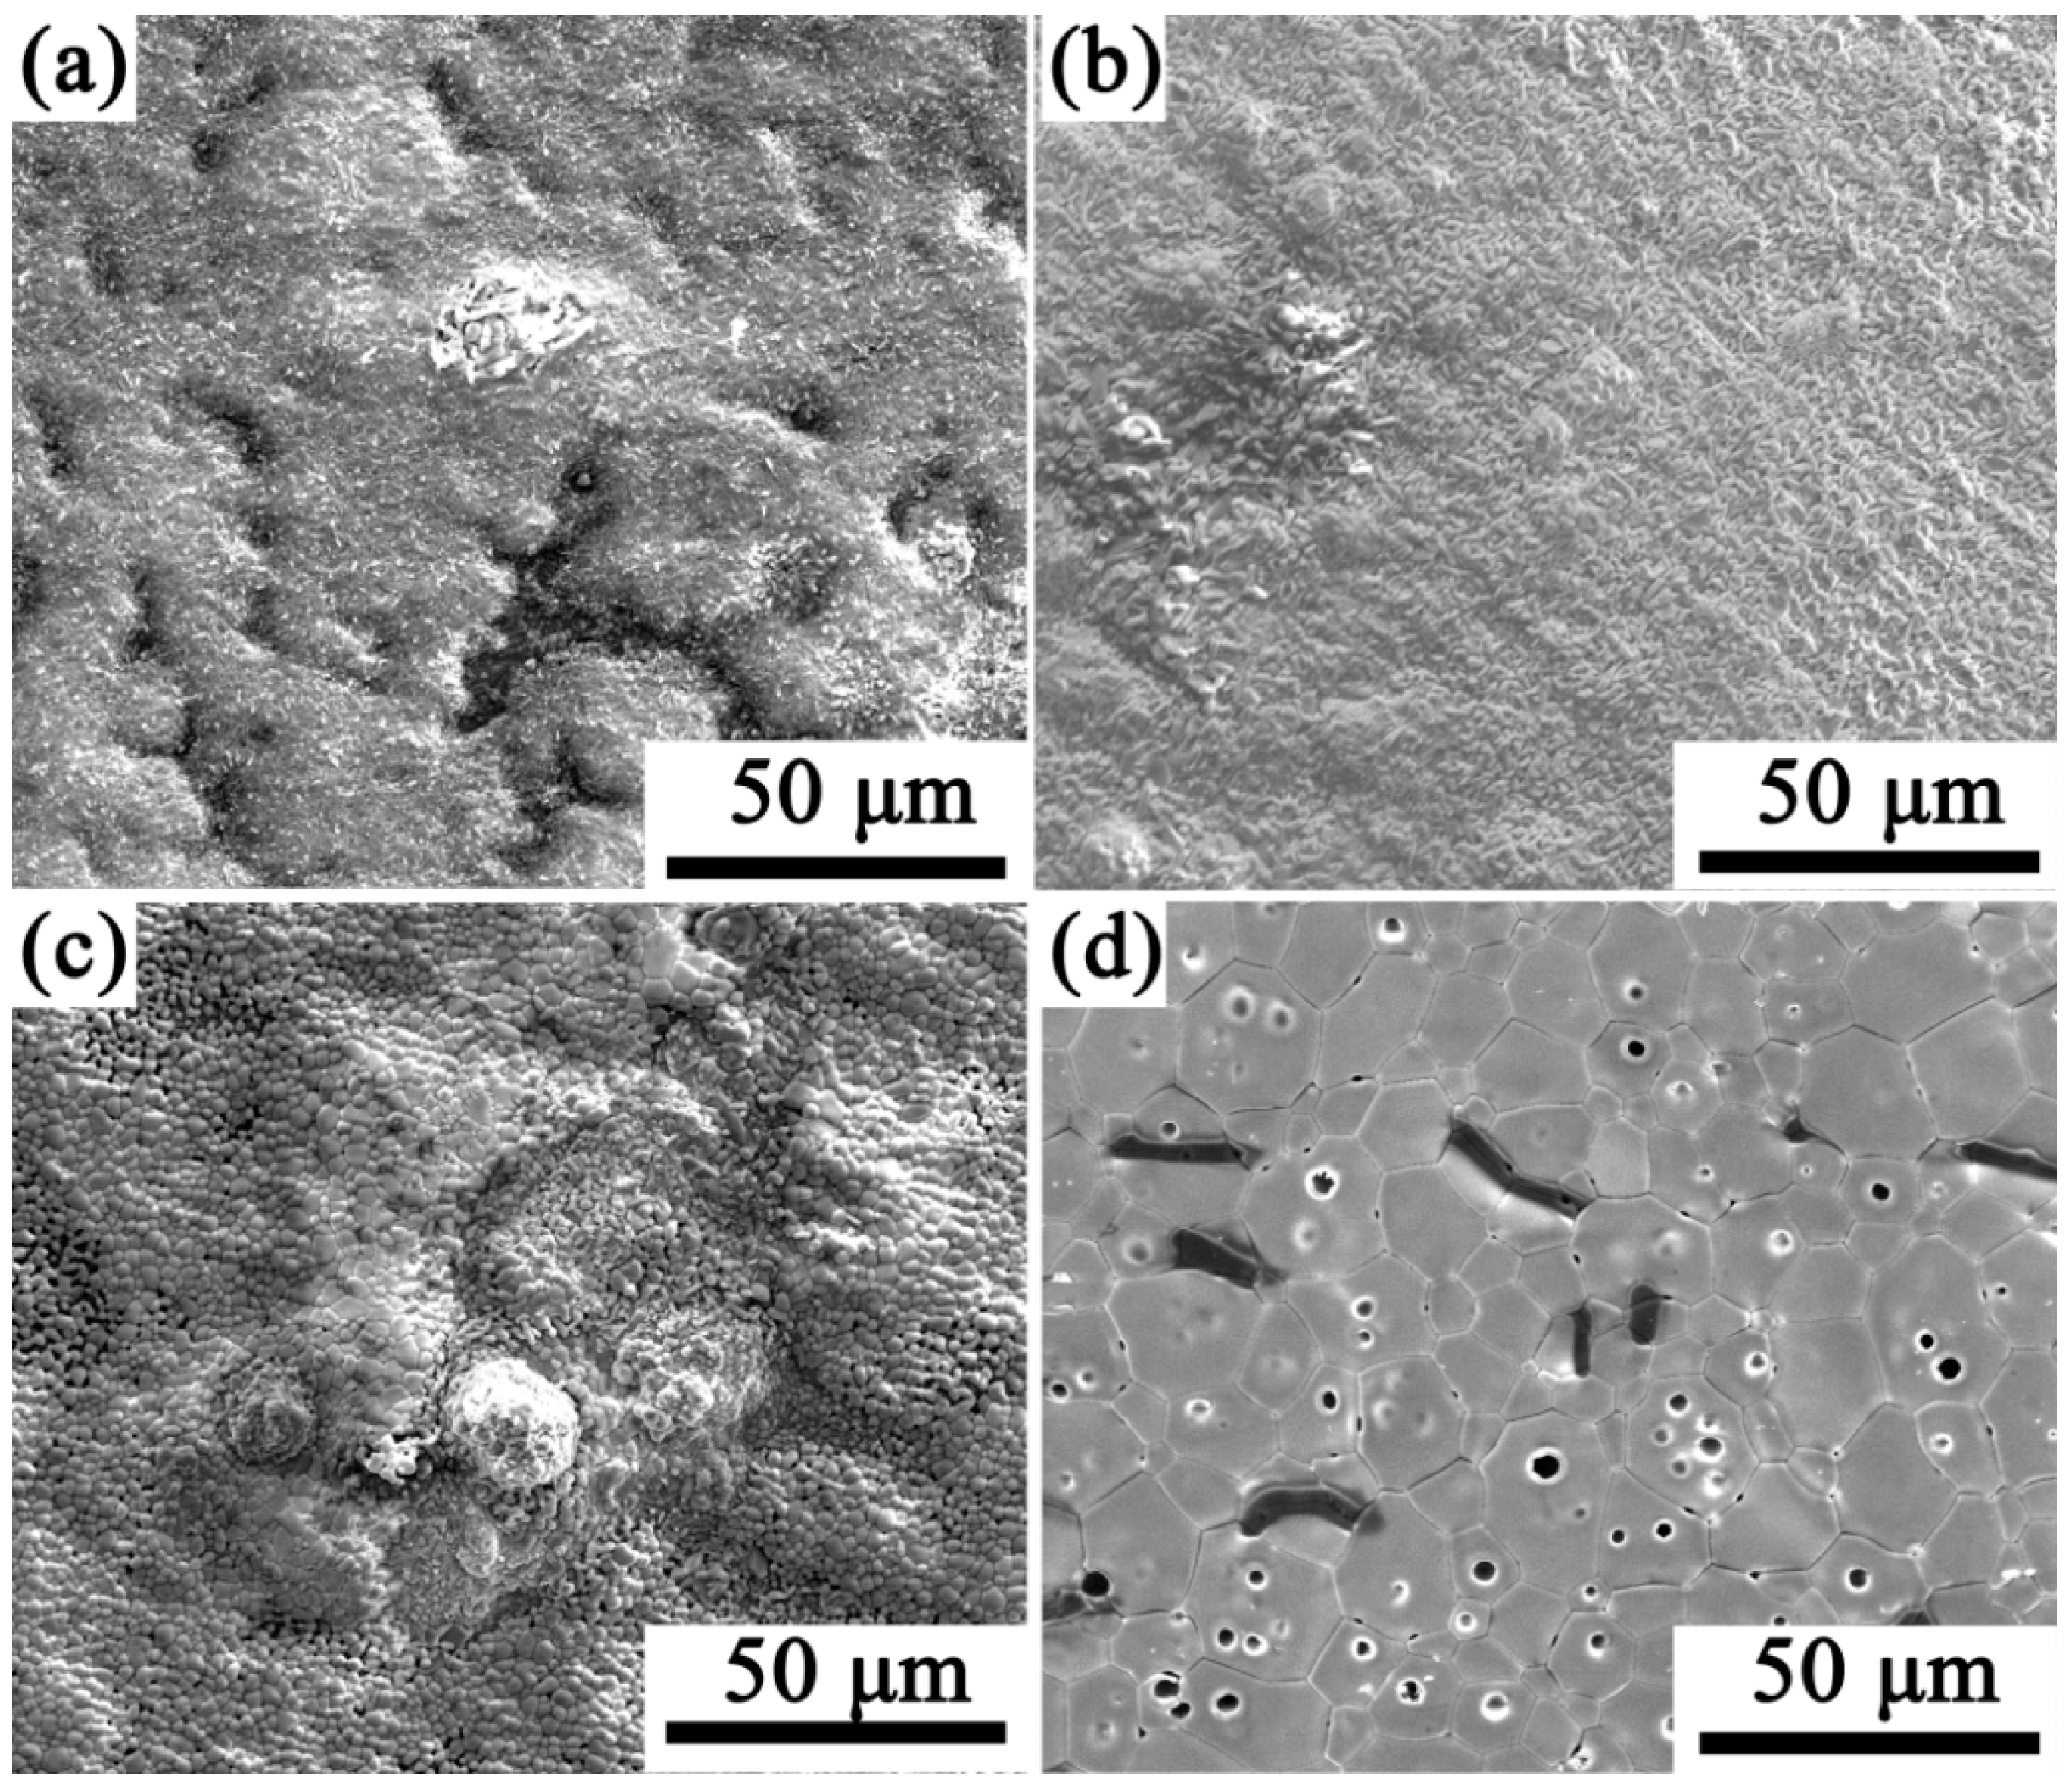
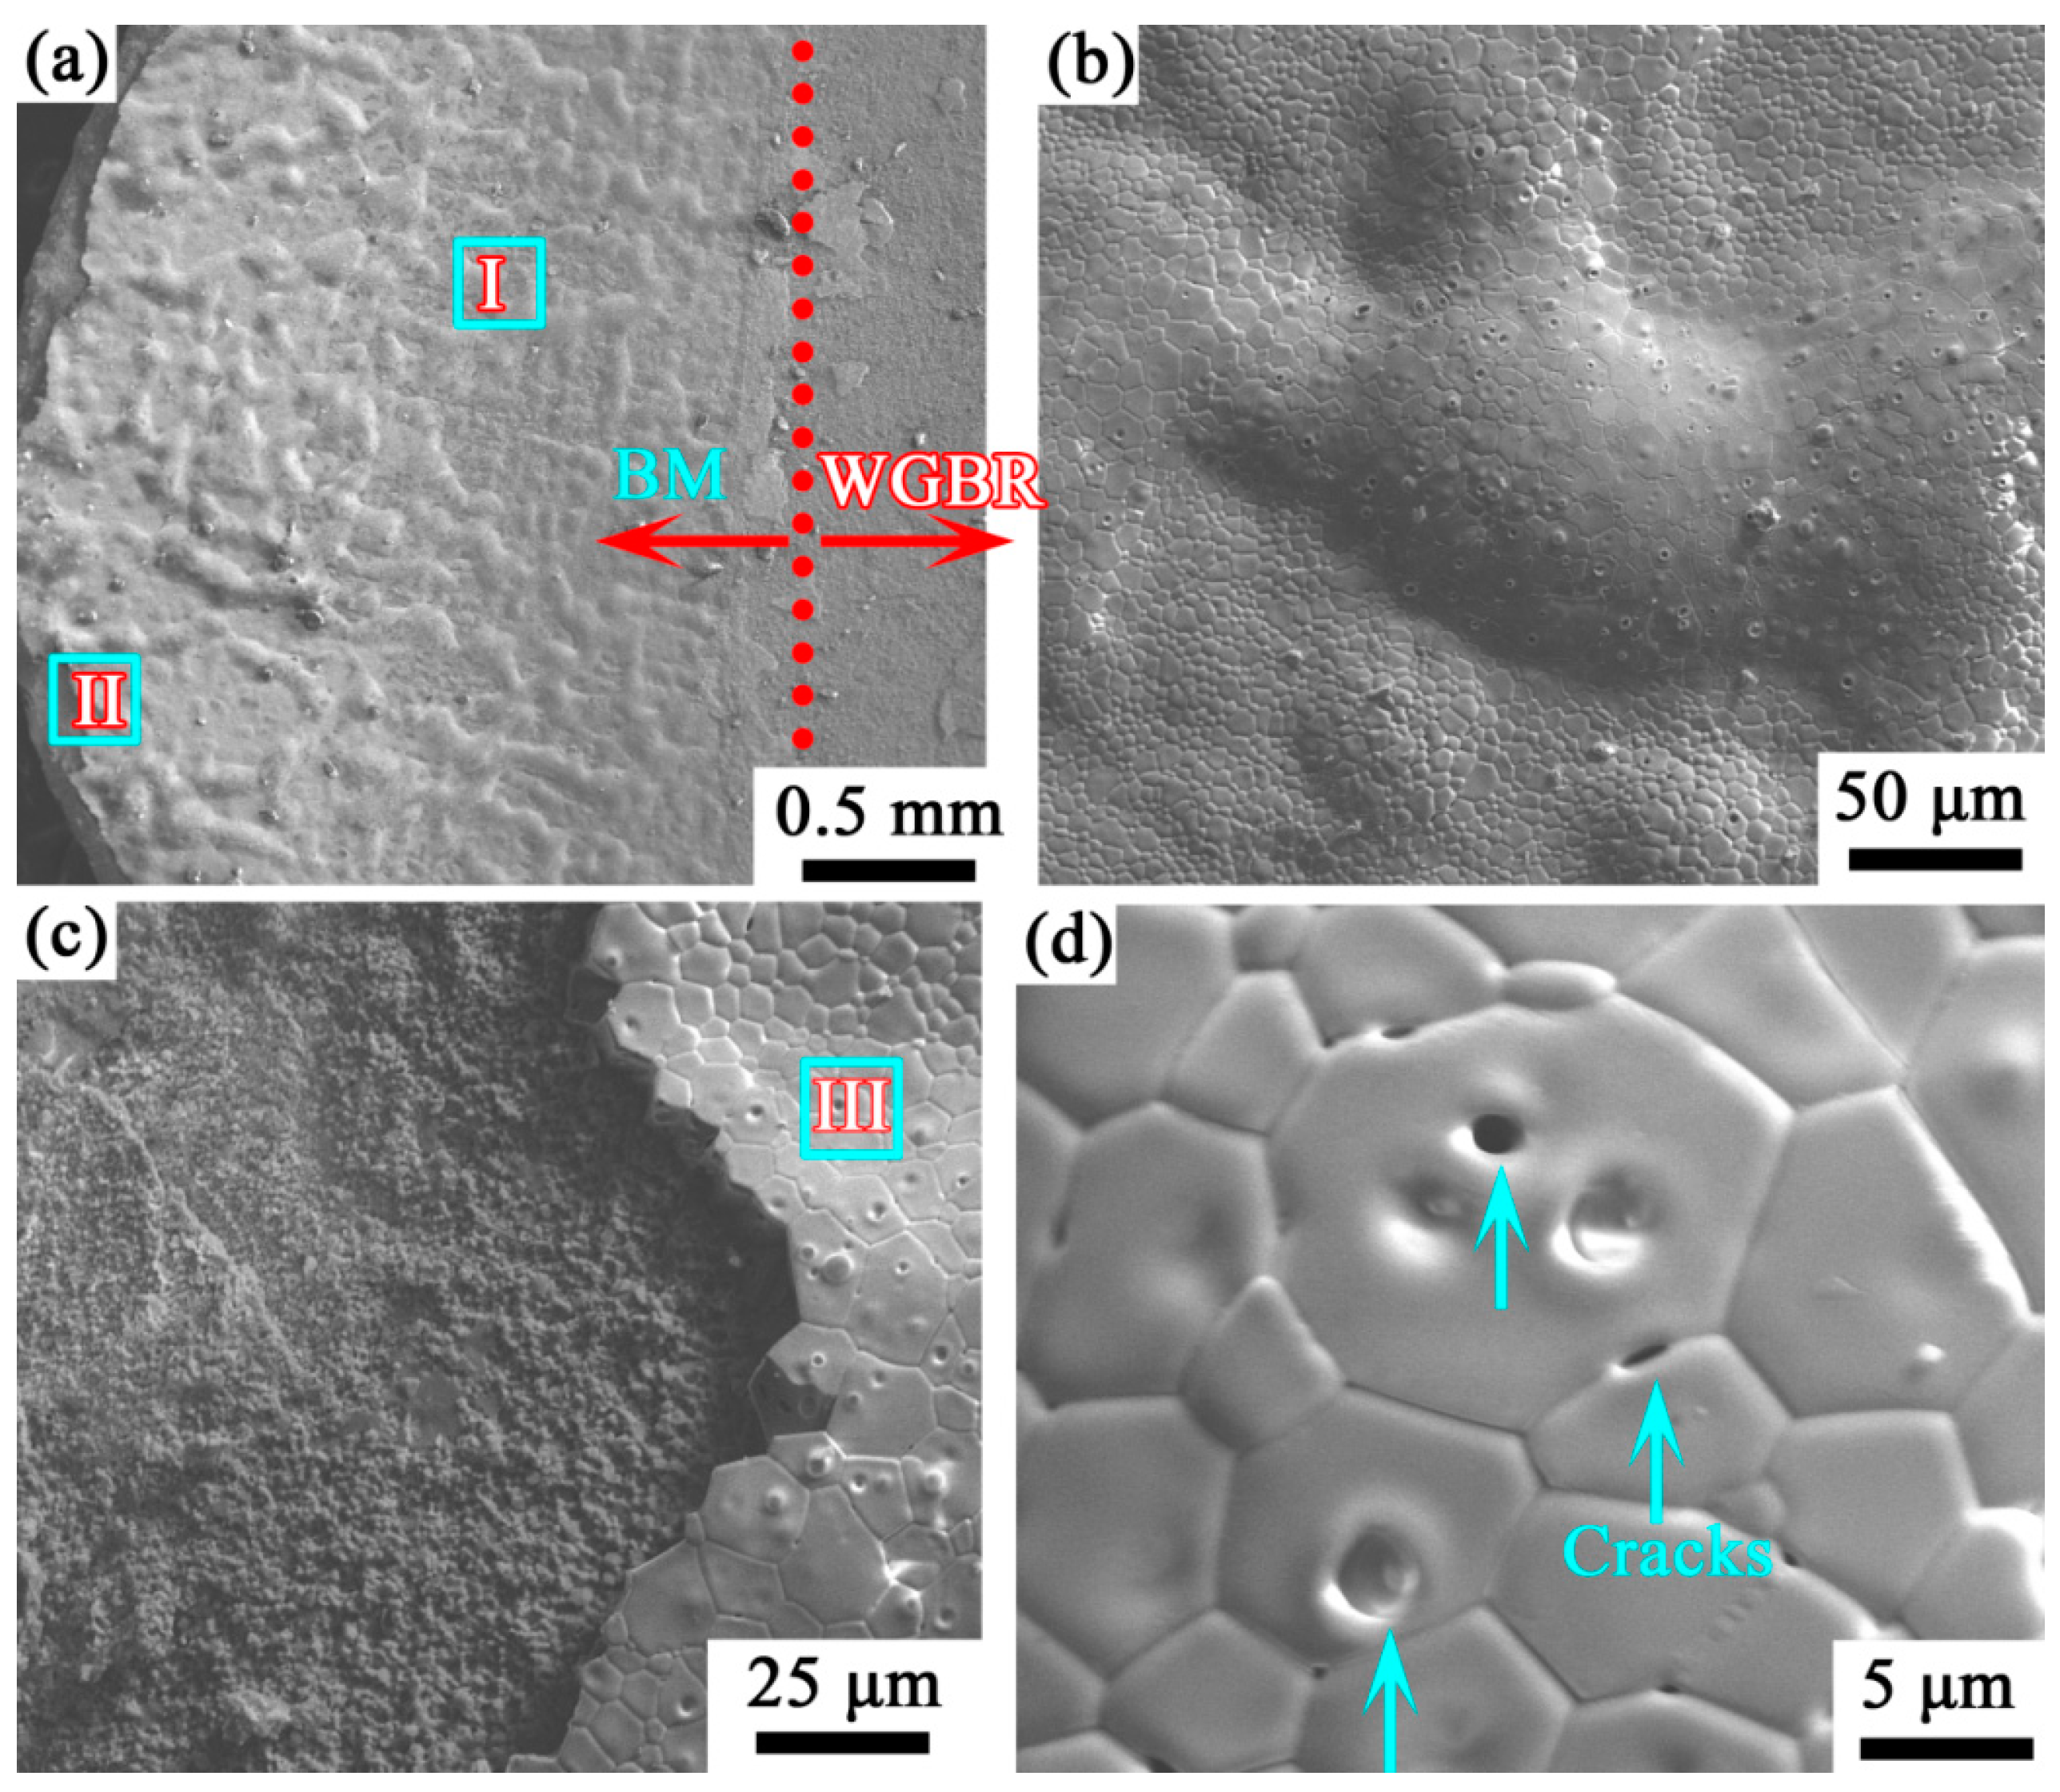
3.3. Surface Morphology of Oxidized Material

Figure 5 displays the surface oxide morphologies of the large-gap powder-metallurgy-bonded joint after 1440 min of oxidation at 1000 °C. Macroscopic observations reveal that the oxide layer on the WGBR is significantly denser, whereas interparticle gaps persist in the oxide layer of the BM.
Figure 6 shows the oxide morphologies of the BM oxidized for 1440 min at 800 °C, 900 °C, 1000 °C, and 1100 °C. After oxidation at 800 °C, the BM oxide layer exhibits a granular surface morphology. Based on the XRD results in Figure 4a, these granular oxides are likely composite phases of NiO, TiO2, and Cr2O3. Upon oxidation at 1000 °C, the surface oxides on the BM grow markedly, forming large nodular oxide clusters. These nodular oxides are composed of aggregated fine spherical particles, which, combined with XRD analysis, are hypothesized to be mixtures of NiO and TiO2. As shown in Figure 6d, the oxide layer on the BM undergoes fragmentation, likely caused by thermal expansion coefficient mismatch between different oxides, leading to crack formation.
Figure 7 presents the oxide layer morphologies of the WGBR after 1440 min of oxidation at 800 °C, 900 °C, 1000 °C, and 1100 °C. At 800 °C, minimal oxide formation is observed on the WGBR surface. Oxidation at 900 °C yields a uniformly distributed oxide layer. However, localized spallation occurs in the oxide layer at 1000 °C. Based on XRD analysis, the intact regions likely consist of densely structured Cr2O3, while the spalled areas may correspond to secondary oxides formed via elemental diffusion. At 1100 °C, severe oxide spallation significantly compromises the oxidation resistance of the WGBR.
An analysis of the literature [20,21] suggests that the primary cause of oxide spallation is the excessive internal stresses generated within the dense Cr2O3 and NiCr2O4 layers formed on the WGBR during oxidation. Generally, these internal stresses originate from two sources:
Growth stress: Resulting from the mismatch in Pilling–Bedworth (PB) ratios between NiCr2O4 and Cr2O3, reflecting the volume ratio of oxides to their parent metals.
Thermal stress: Arising from differences in thermal expansion coefficients between NiCr2O4 and Cr2O3, leading to differential volume changes during heating or cooling cycles.
The combined effects of these stresses induce significant interfacial stresses between the oxides, ultimately causing localized spallation of the oxide layer from the Cr2O3 matrix.

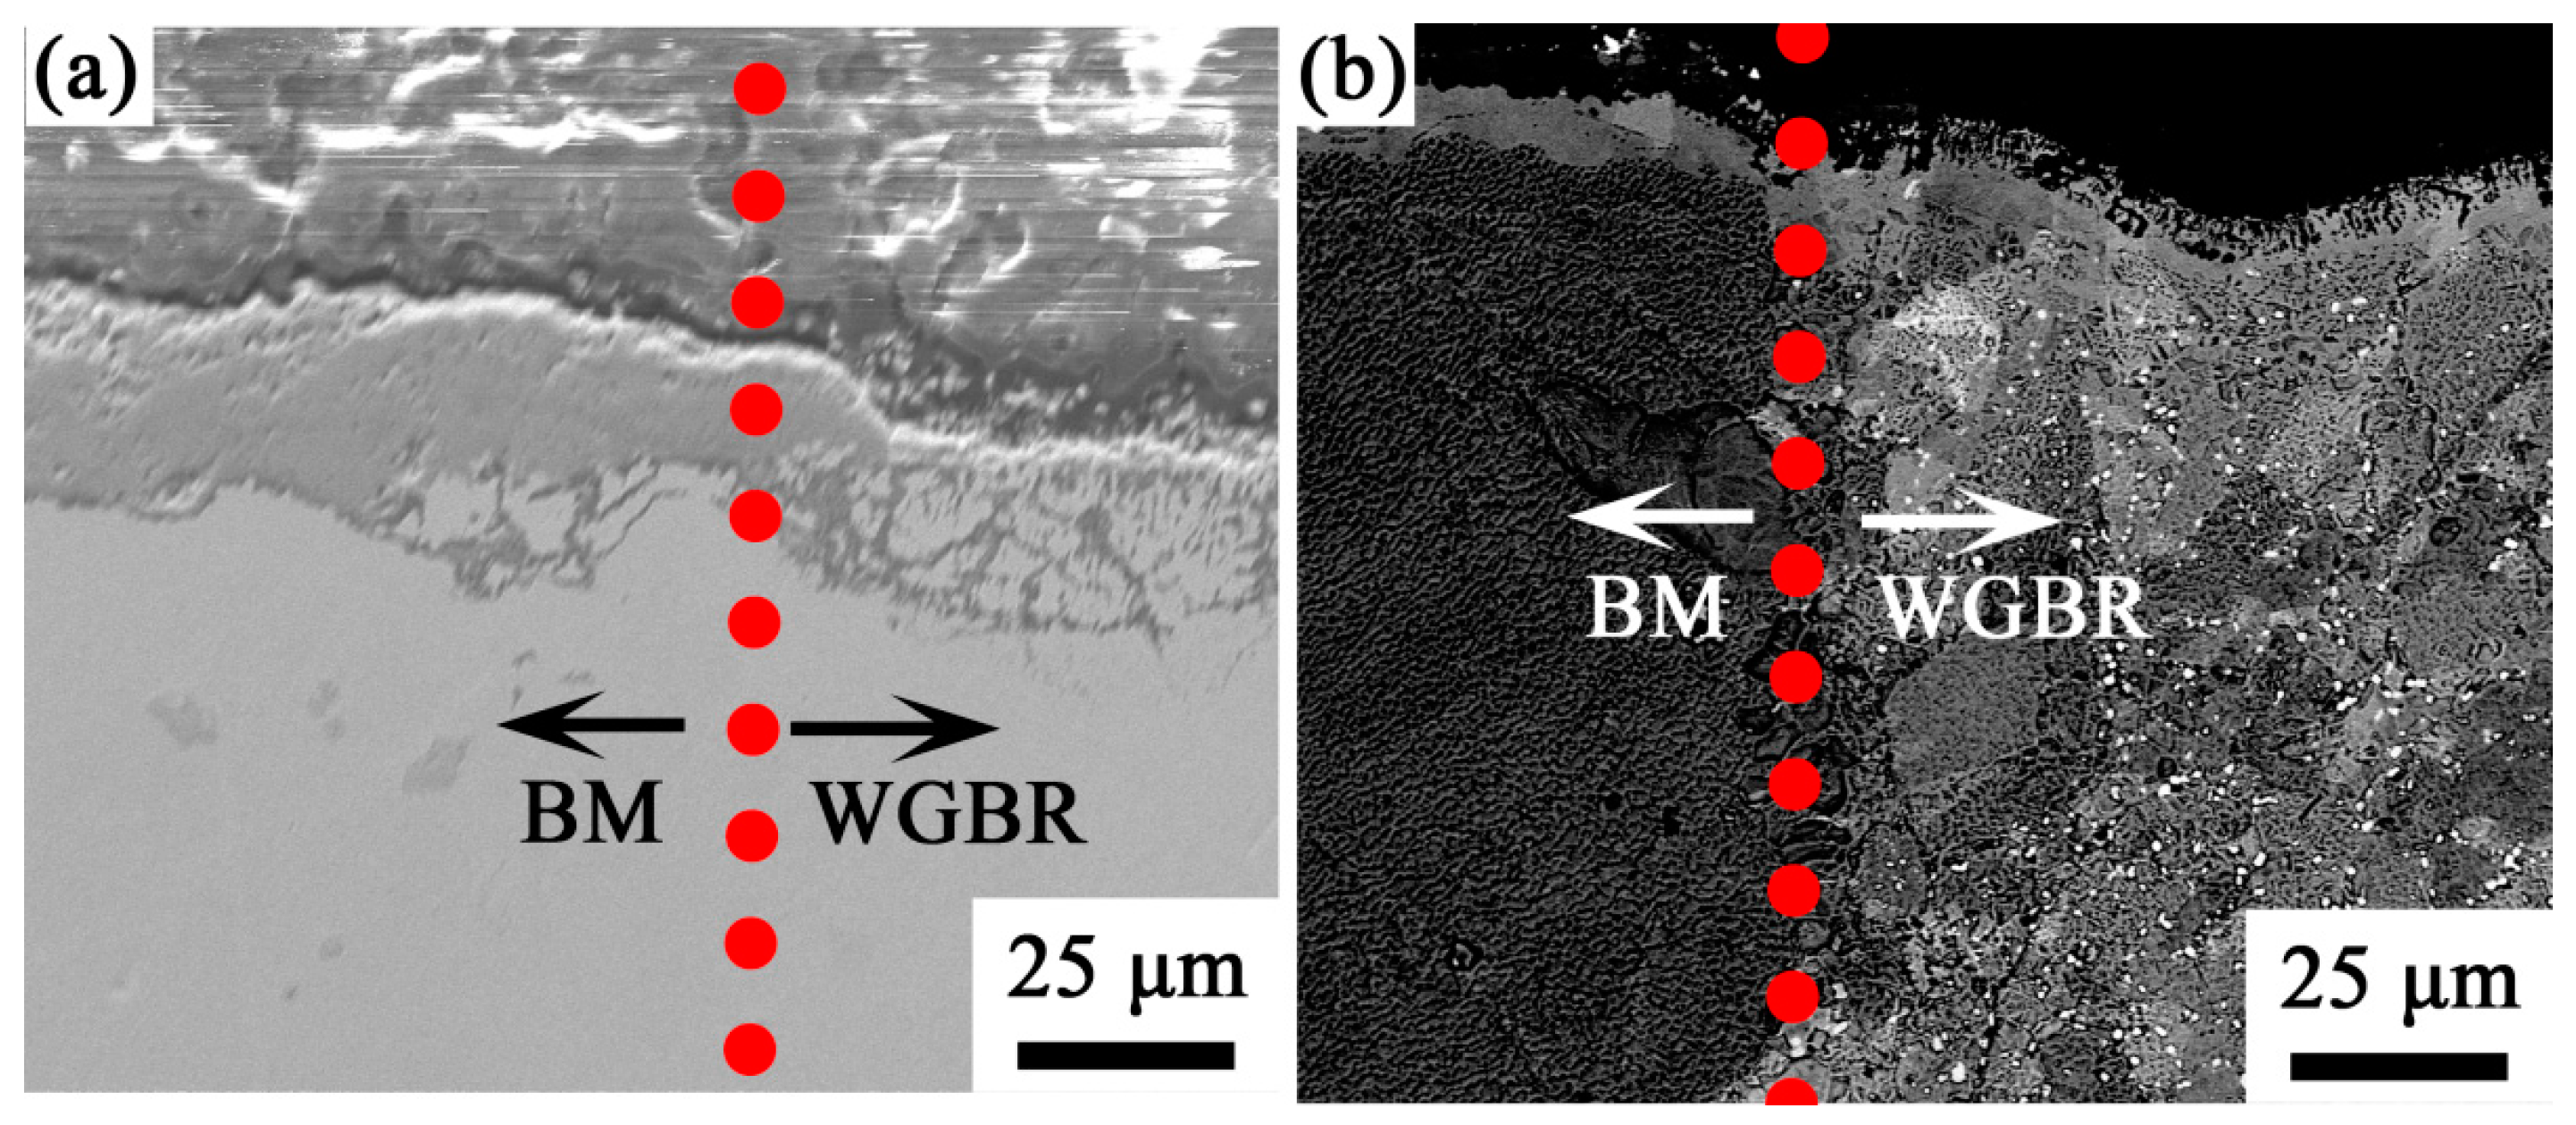
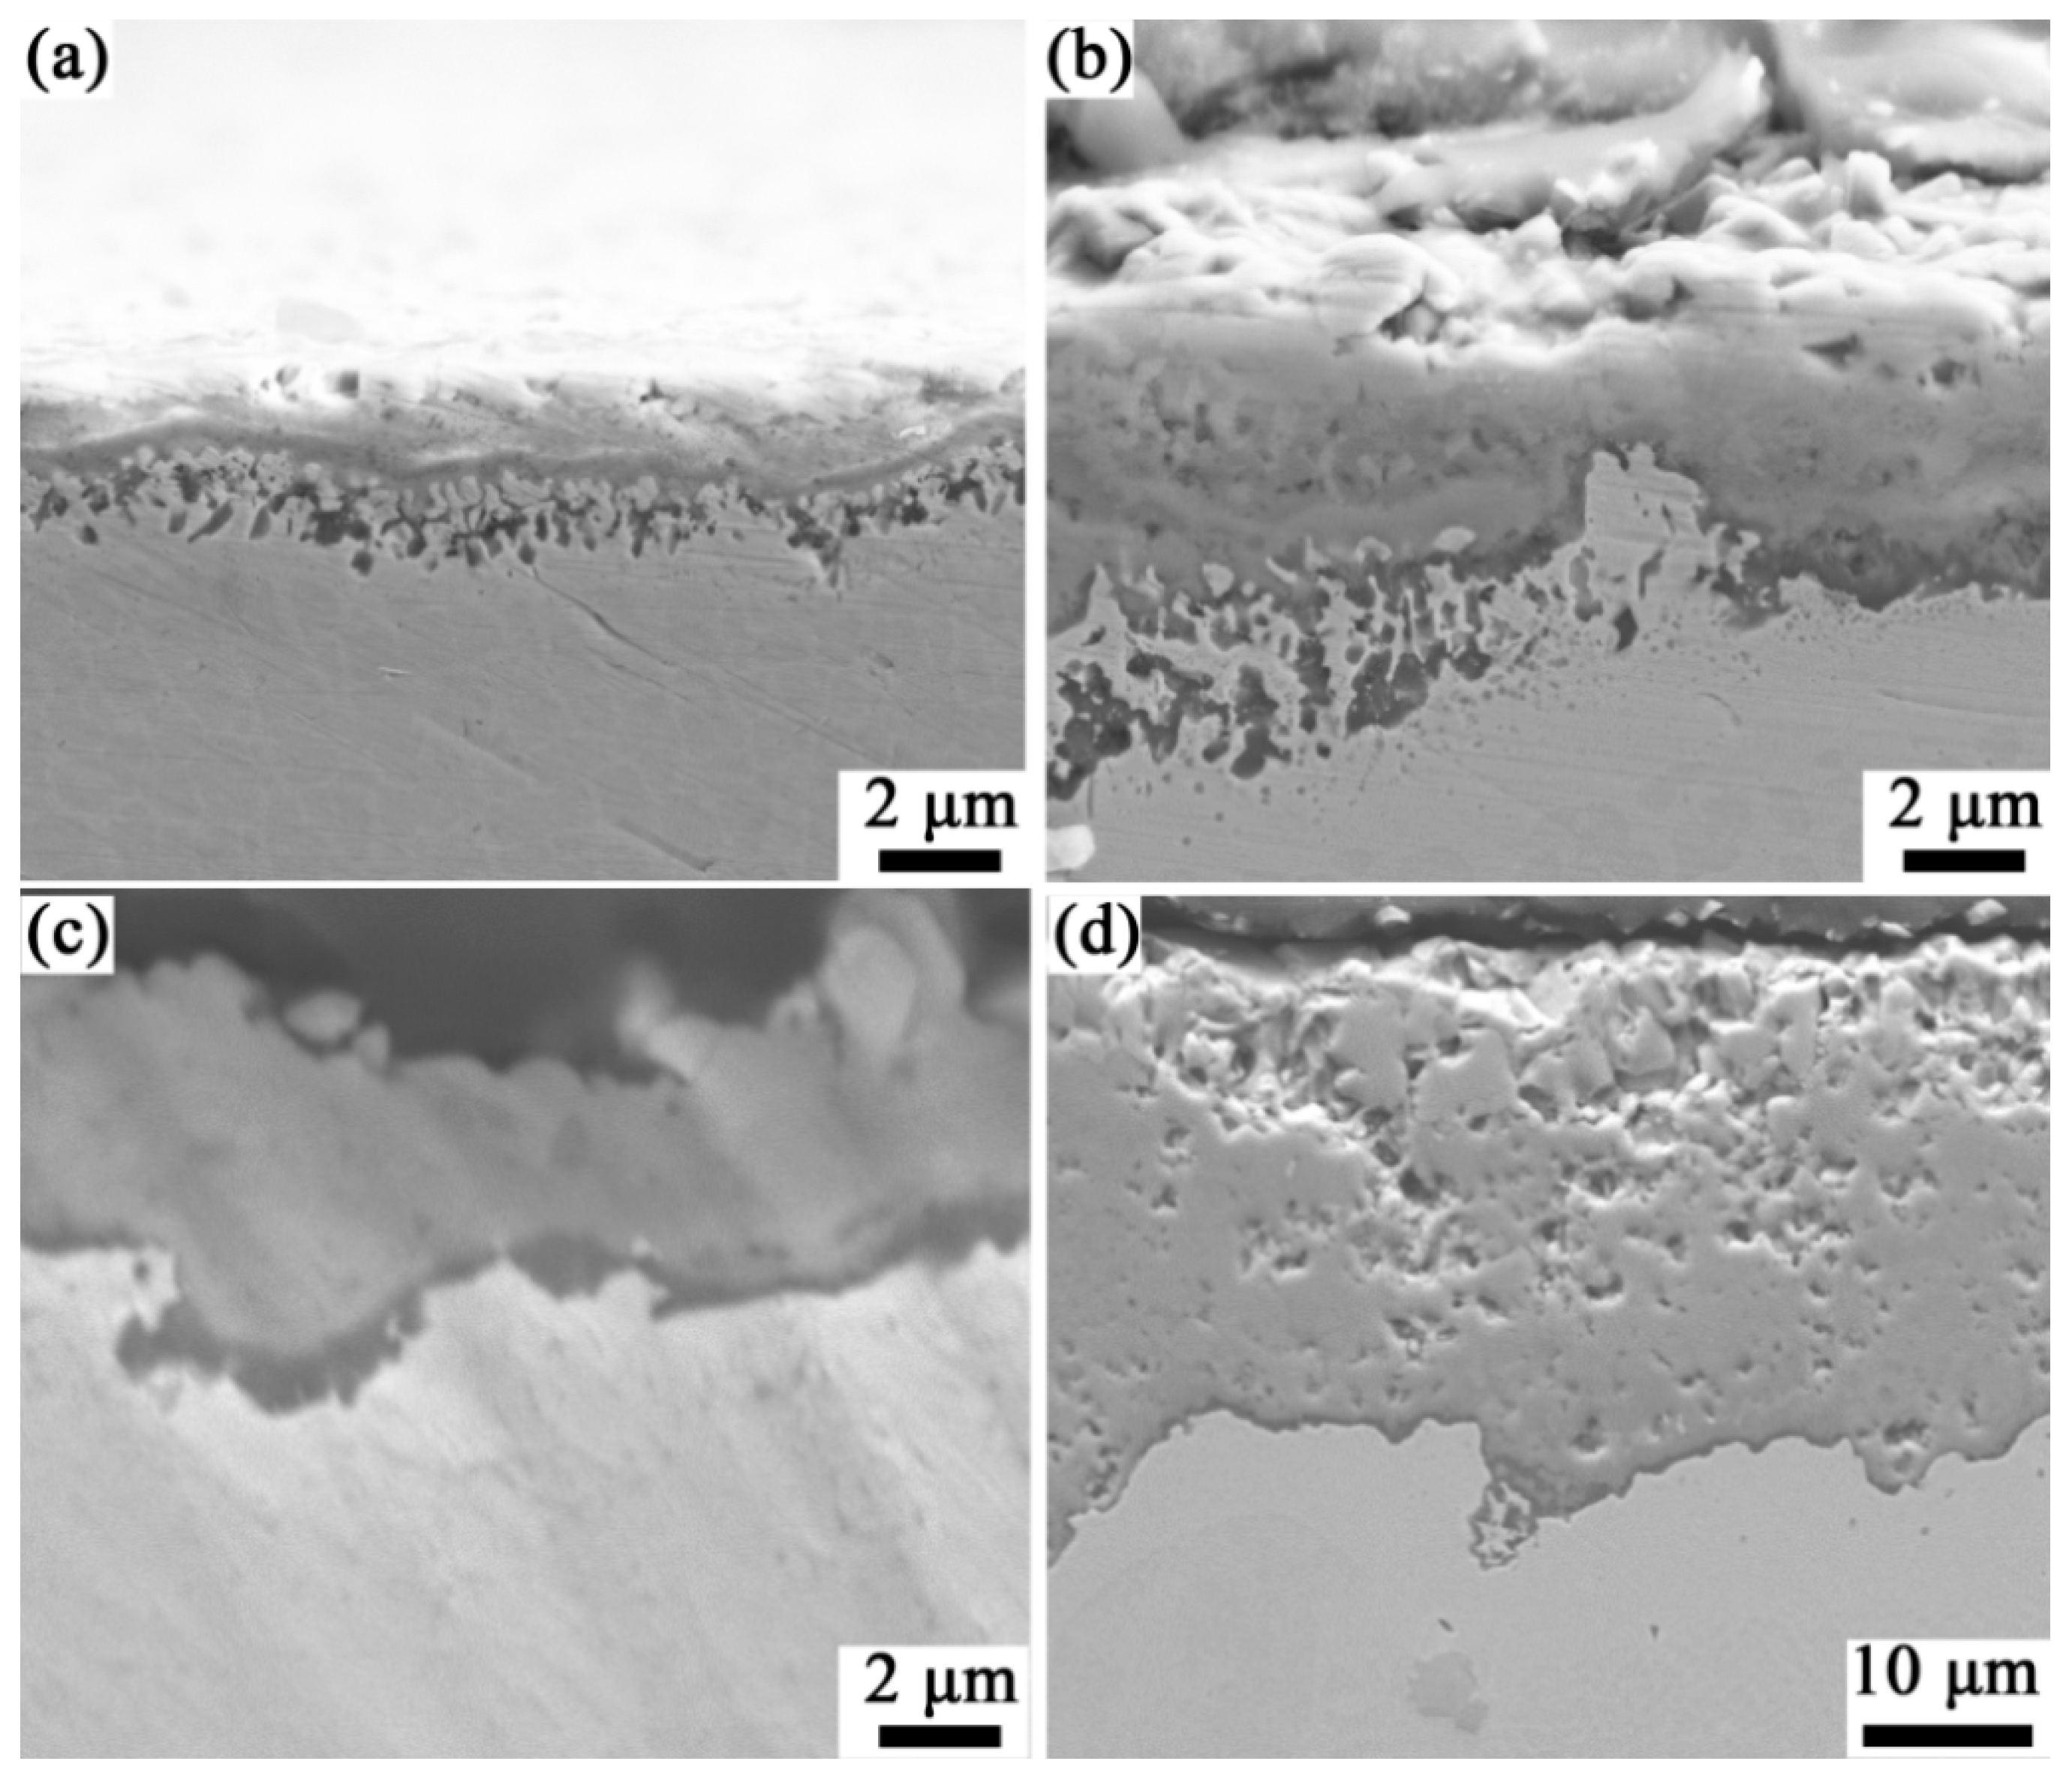
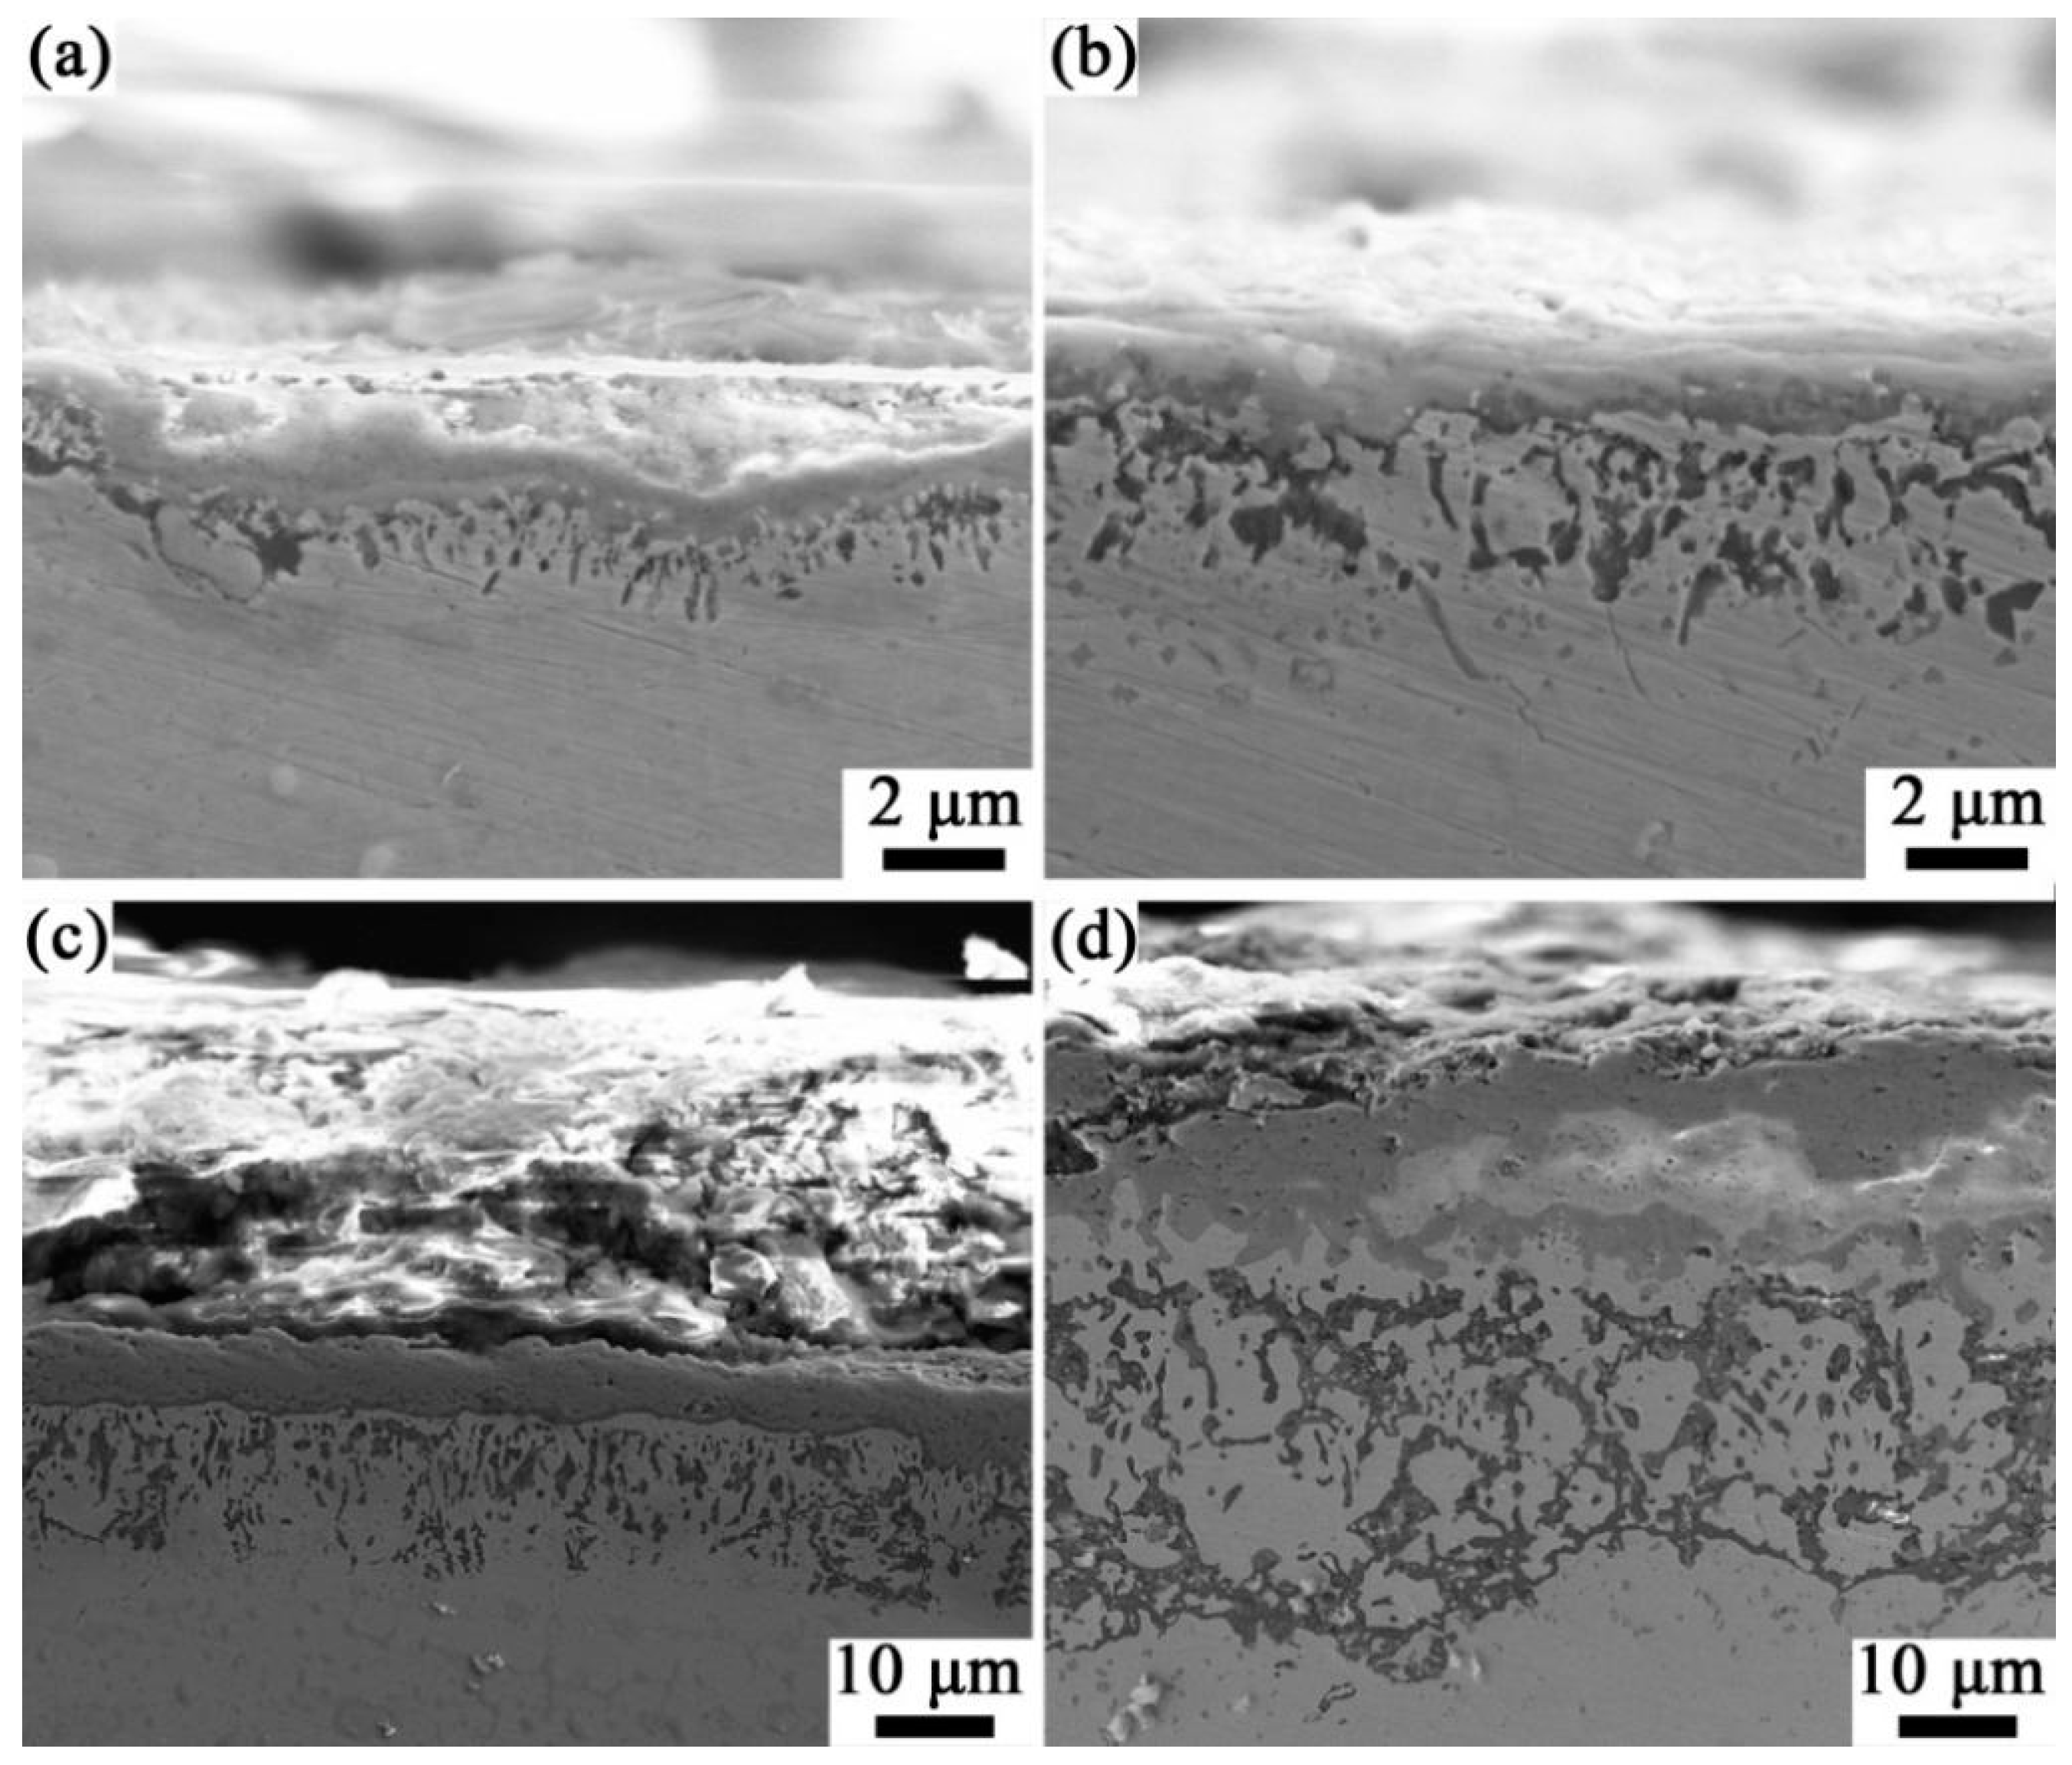
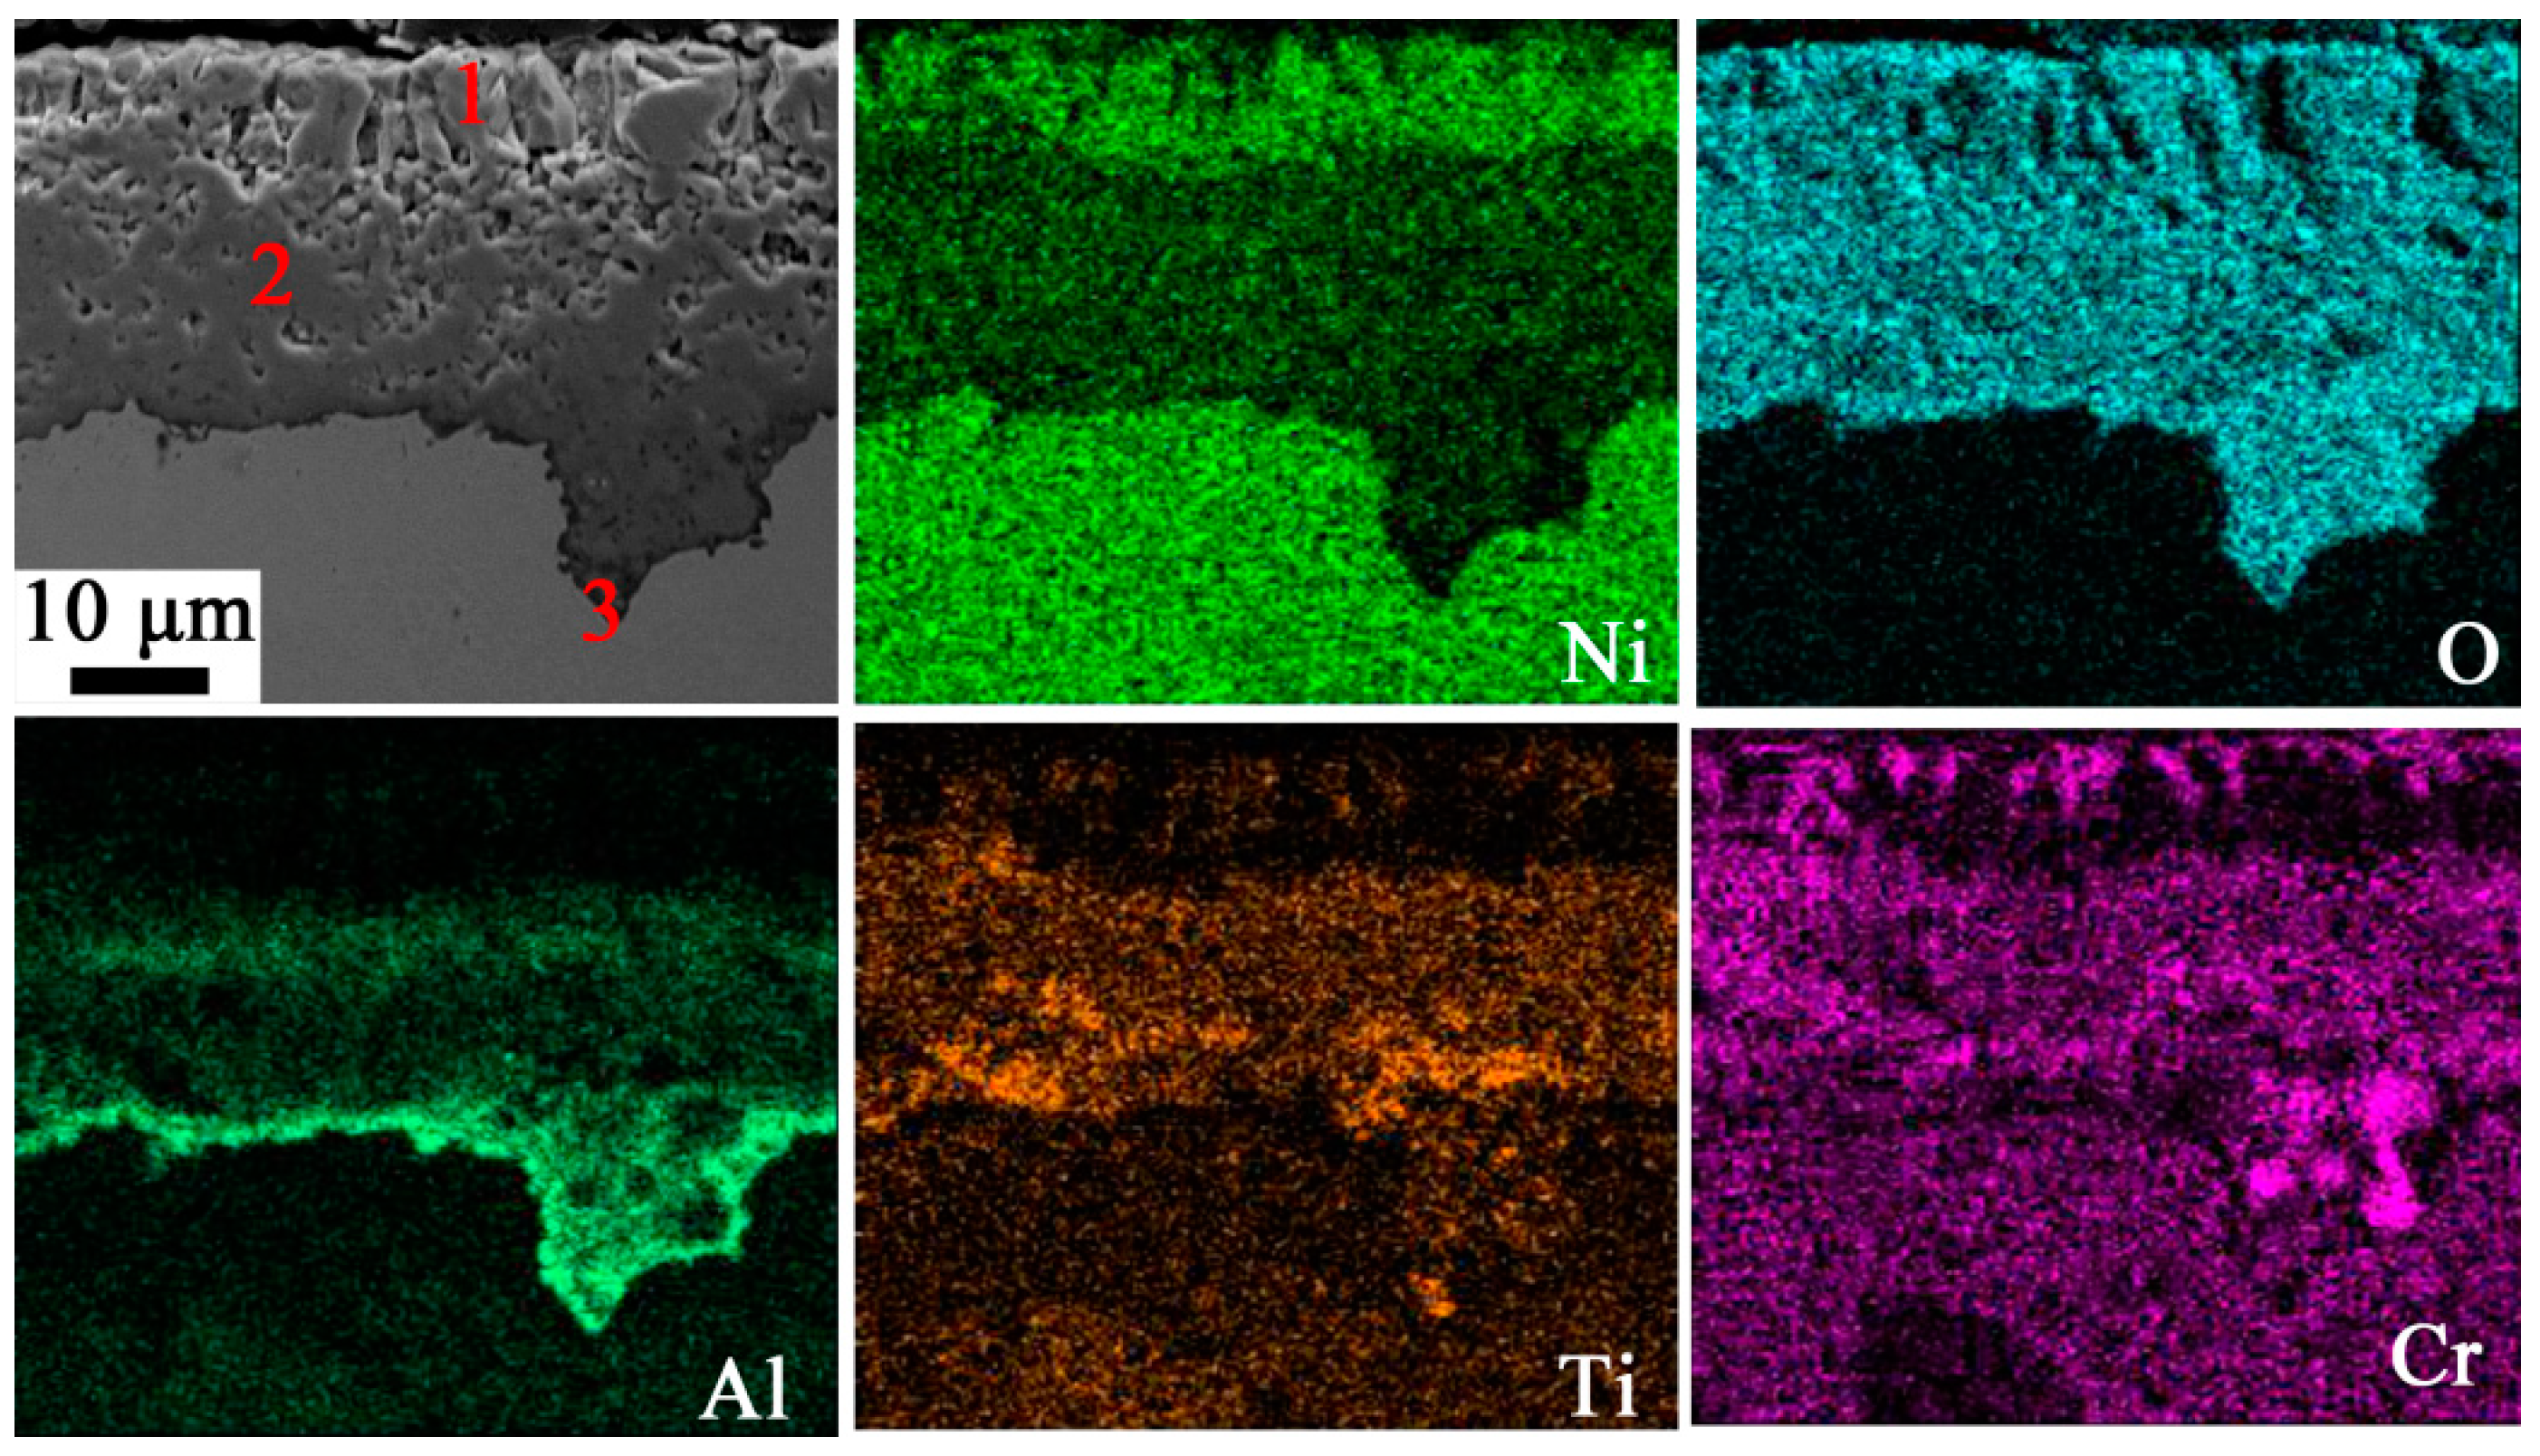
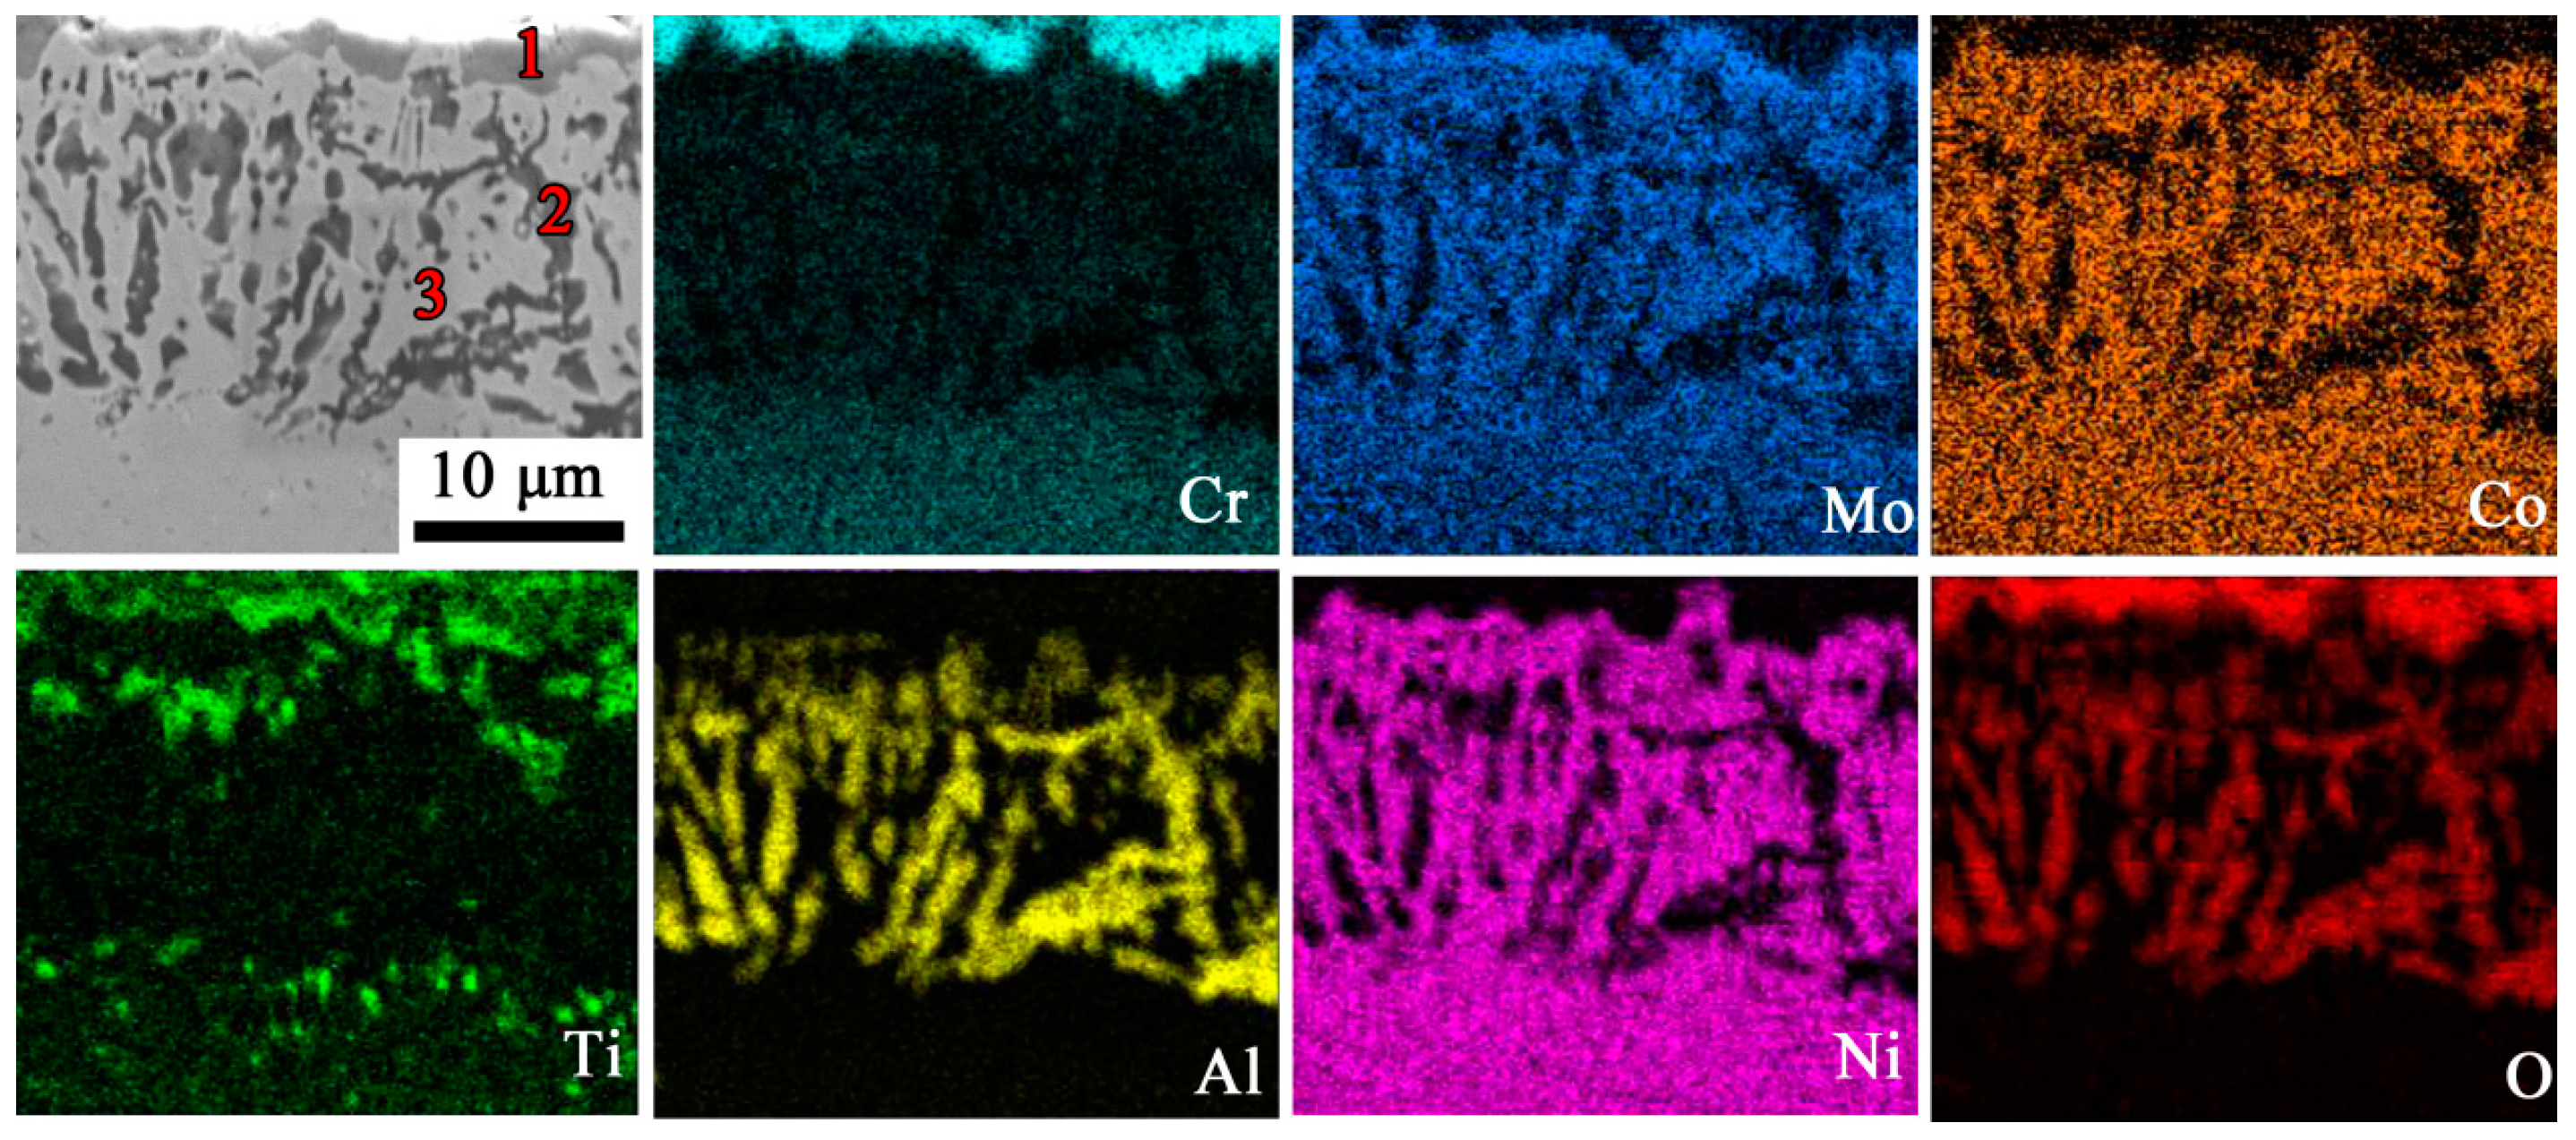
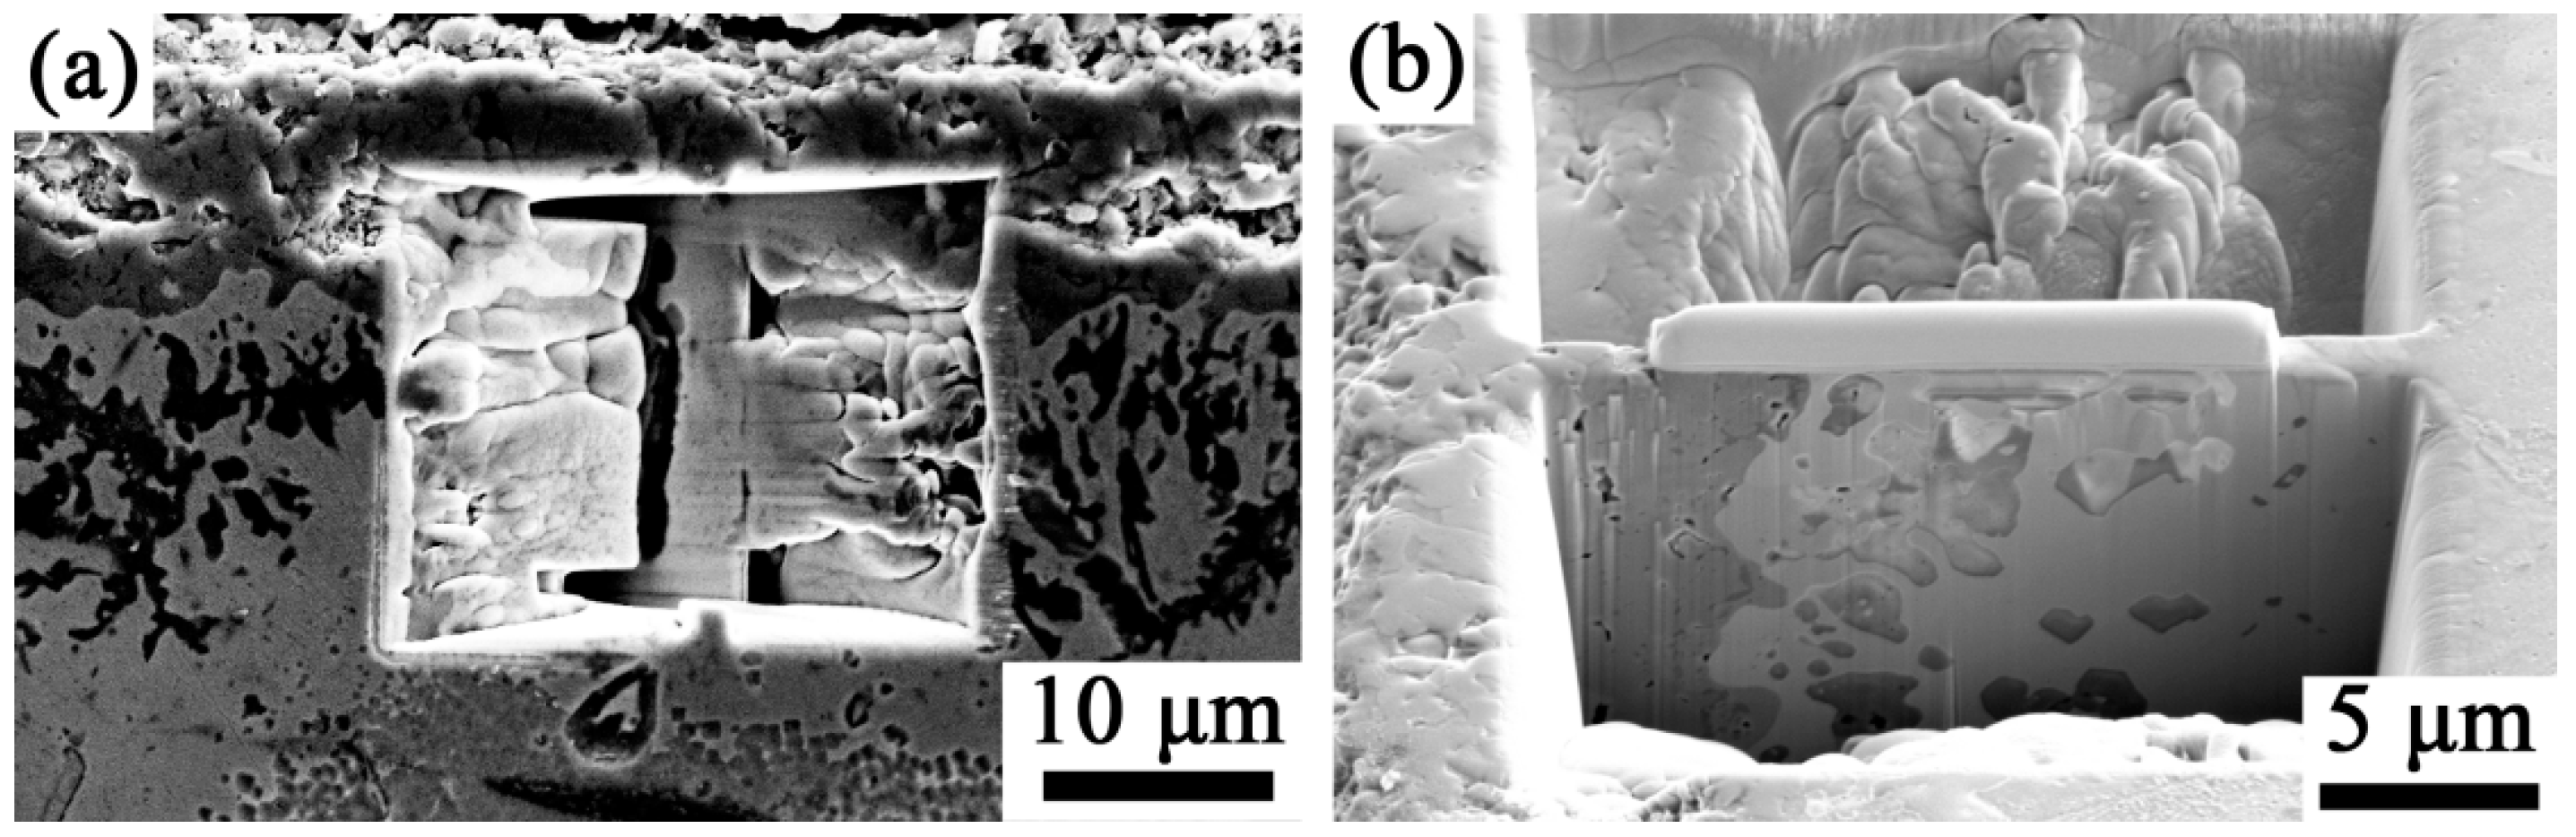
3.4. Cross-Sectional Morphology After High-Temperature Oxidation
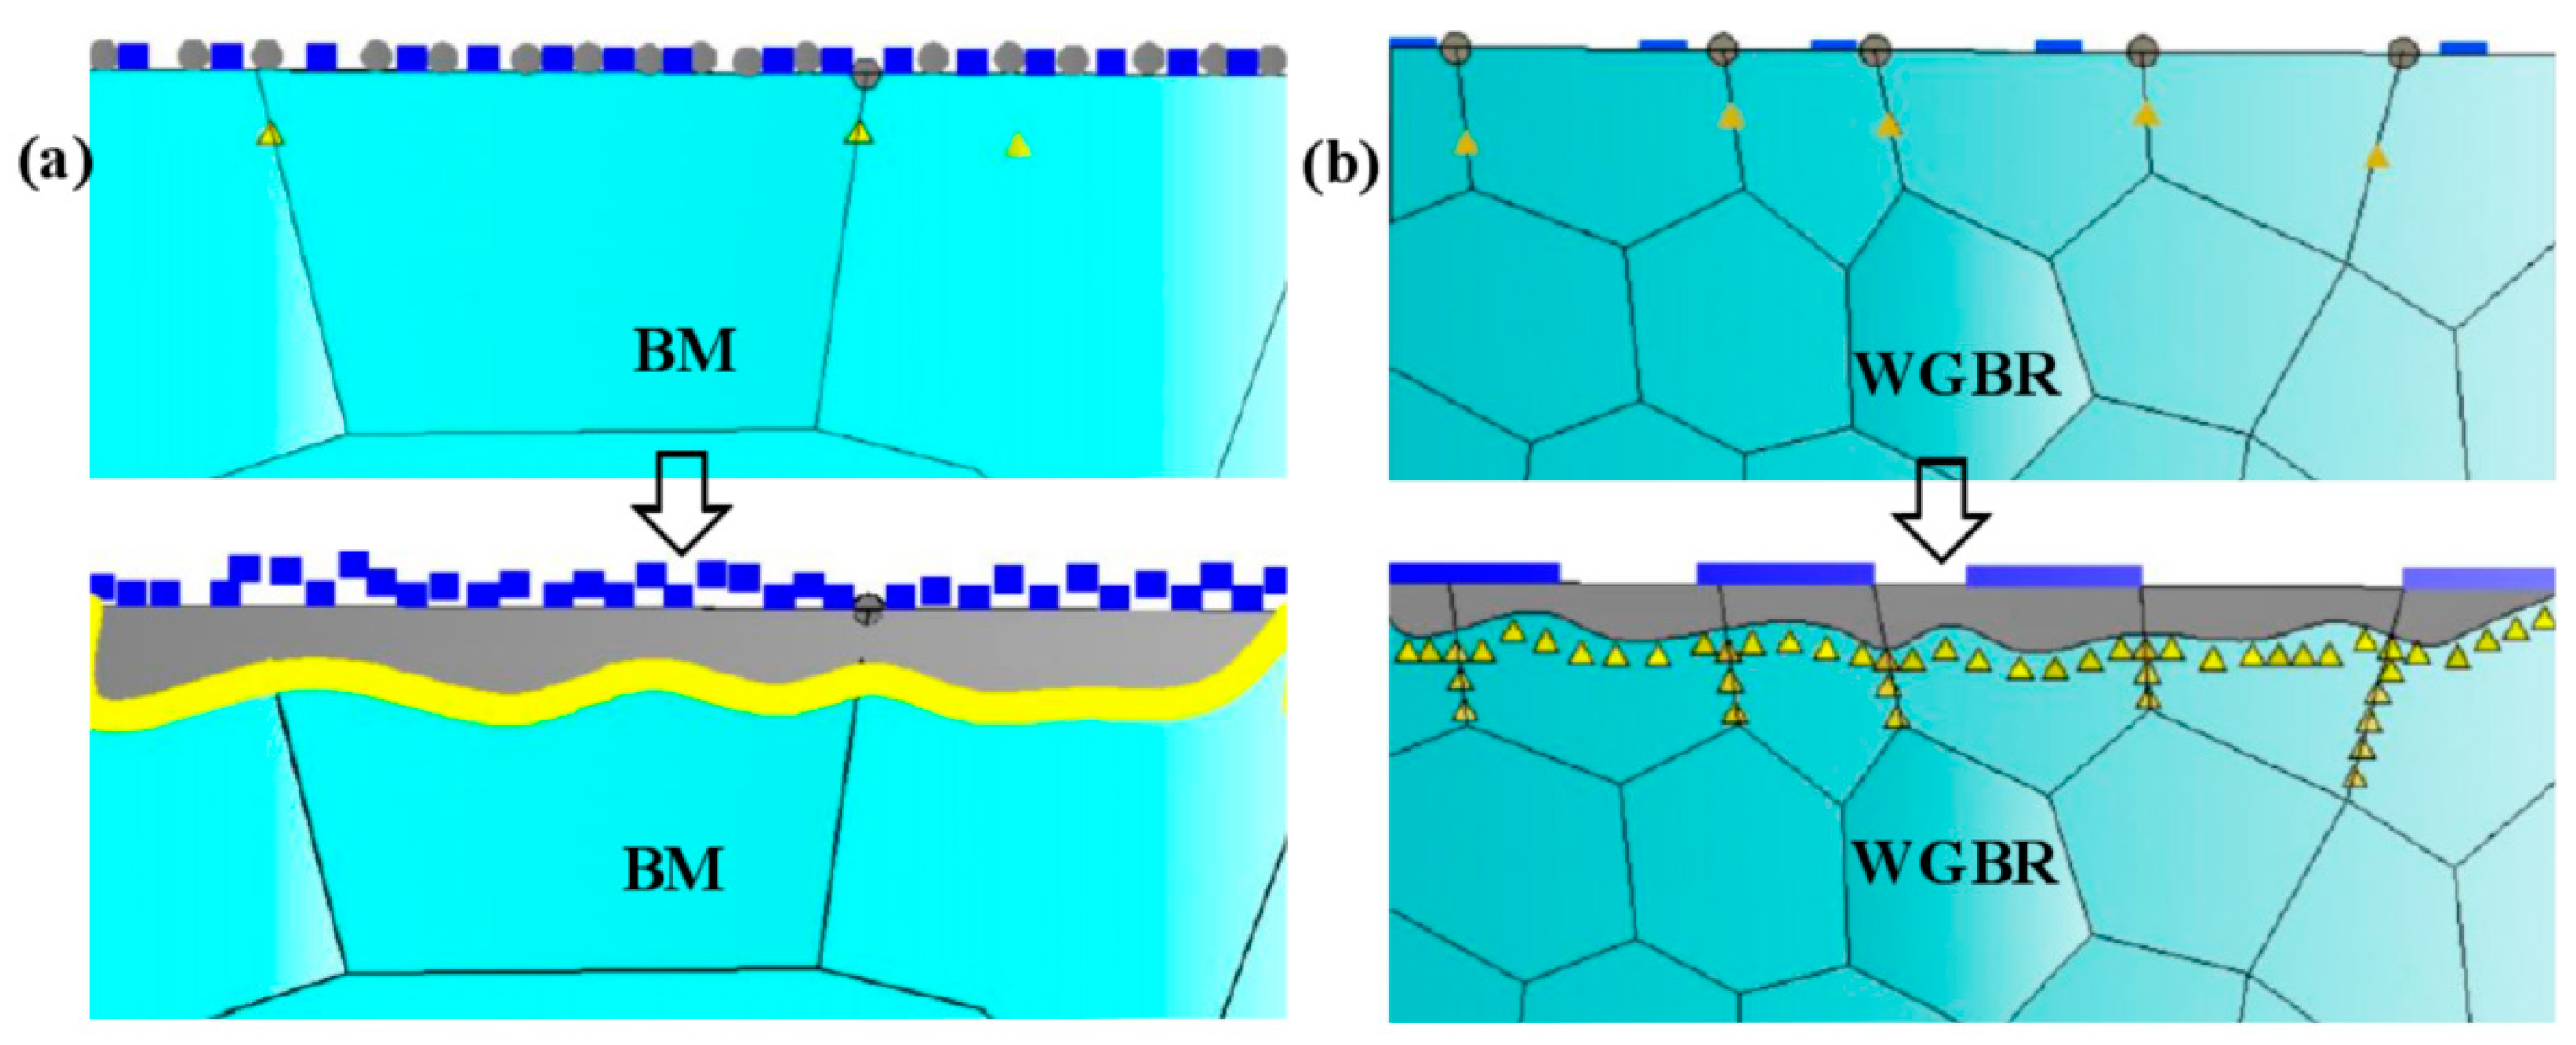
A comprehensive evaluation of the alloy’s oxidation resistance can be achieved by analyzing the mass gain before and after oxidation, phase evolution, and interfacial morphology of the oxide layers. Figure 8 illustrates the cross-sectional morphology of the wide-gap brazed joint after 1440 min of oxidation. Under identical temperature and isothermal duration conditions, the oxide layer on the BM is markedly thicker than that on the WGBR.
Figure 9 shows the cross-sectional morphologies of the BM after 1440 min of oxidation at various temperatures. At 800 °C, a thin, continuous oxide layer with a porous structure forms on the BM surface, exhibiting crack-like pores and an average thickness of 2.28 μm. As the oxidation temperature increases, the oxide layer thickness changes significantly. At 1000 °C, the thickness increases to 6.78 μm, with pore quantity and size substantially larger than those at 800 °C. These pores likely initiate and propagate cracks, particularly under cyclic stress. At 1100 °C, the oxide layer thickens dramatically to 30.41 μm. Overall, BM undergoes primarily surface oxidation due to the dense, continuous inner oxide layer that prevents internal oxidation, leading to thick outer oxide formation.
Figure 10 displays the cross-sectional morphologies of the WGBR after 1440 min of oxidation. At 800 °C, the layered oxide structure averages 2.08 μm in thickness, thinner than the BM. Consistent with the BM’s oxidation behavior, the oxide layer at 1000 °C thickens to 5.53 μm, with larger and more numerous pores. At 1100 °C, the thickness reaches 30.05 μm. This accelerated oxidation in the WGBR may stem from its abundant grain boundaries, which facilitate inward oxygen diffusion and outward alloy element diffusion. The literature [22] notes that internal oxidation proceeds slower than surface oxidation, explaining why the BM’s oxide layer is thicker than the WGBR’s under identical conditions.
Figure 11 presents the cross-sectional morphology and EDS elemental maps of the BM oxidized at 1000 °C for 1440 min. The oxide layer comprises three distinct regions:
Outer layer: Enriched with Ni (likely NiO and minor Cr2O3, based on XRD and EDS data in Table 3).
Intermediate layer: A dense mixture of TiO2 and Cr2O3.
Inner layer: A thin Al2O3 film undetected by XRD due to its depth.
The oxide/substrate interface shows strong adhesion, with localized substrate protrusions embedded into the oxide layer. Studies [23] suggest that vacancies form at the Cr2O3/substrate interface as Ni, Nb, and Cr ions diffuse outward. However, uniform Al2O3 formation in BM suppresses vacancy aggregation, preventing microvoid formation and enhancing oxide adhesion.
Figure 12 illustrates the cross-sectional morphology and EDS maps of the WGBR oxidized at 1000 °C for 1440 min. The oxide layer consists of two regions: an outer layer, rich in Cr and Ti (primarily Cr2O3 and TiO mixtures), and an inner layer, namely a dense Al2O3 layer with substrate protrusions, enhancing adhesion and preventing spallation (Table 4). Al2O3 is distributed in two modes: uniformly at the Cr2O3/substrate interface, improving layer compactness, and with root-like extensions into the substrate, acting as “pegs” to strengthen adhesion.
Localized Nb enrichment in the oxide layer suggests Nb2O₅ formation. Research [24] indicates that Nb oxidizes preferentially (oxygen potential: −146.2 kJ/mol, oxygen partial pressure: 8.1 × 10⁻²¹ Pa) compared to Cr (−139.6 kJ/mol, 1 × 10⁻¹⁹ Pa). Nb enhances Cr2O3 layer densification, reducing oxygen diffusion and vacancy defects. Mo shows no segregation, likely forming volatile MoO3, while Co’s low reactivity and slow diffusion delay its oxidation. Studies [25] report Co only diffuses into oxide layers after prolonged exposure (e.g., 28 days at 850 °C in IN617 alloy).
To further validate the phase composition of oxides in the WGBR, FIB-TEM techniques were employed to analyze the cross-section of the oxide film. Figure 13 shows the FIB-SEM cross-section morphology of various oxide layers in the WGBR after oxidation for 1440 min at 1000 °C. The prepared sample was ion-thinned to below 100 nm and then analyzed using transmission electron microscopy. A detailed phase analysis of the oxide layer interface is illustrated in Figure 14 through TEM and high-resolution transmission electron microscopy (HRTEM) observations.
Figure 14a reveals distinct contrast differences between the inner and outer layers of the oxidation products in the WGBR. The TEM morphology from top to bottom in Figure 14a corresponds to the SEM morphology in Figure 10c. Indexing of transmission diffraction patterns from the outer and inner layers indicates that the dense outer layer primarily consists of Cr2O3 oxide, while the uniformly distributed inner layer is predominantly Al2O3 oxide. Further analysis of the interfacial relationships between these oxides and the substrate demonstrates no distinct orientation relationship between Cr2O3 and the substrate phase, nor between Al2O3 and the substrate phase.

4. Discussion

4.1. High-Temperature Oxidation Mechanism

Based on the aforementioned results, the oxidation behaviors of the BM and WGBR at 1000 °C can be schematically summarized as shown in Figure 15. The oxidation processes of both the BM and WGBR comprise two stages: initial oxidation and steady-state oxidation.
As illustrated in Figure 15a, during the initial stage, selective oxidation of Ni dominates in BM, accompanied by minor oxidation of Cr and Ti. The primary oxidation products at this stage are NiO, Cr2O3, and TiO2. Upon entering the steady-state stage, the dense oxide layer formed by NiO and Cr2O3 isolates the substrate from direct oxygen contact, shifting the oxidation kinetics to ion diffusion control through the Cr2O3 layer. Ni2+ and Ti4+ ions diffuse outward, leading to the formation of NiO and TiO2 on the Cr2O3 surface. Concurrently, NiO reacts with Cr2O3 to form NiCr2O4 spinel. Oxygen ions (O2−) continue diffusing inward, combining with Cr3+ to thicken the Cr2O3 layer and with Al3+ to form coarsened Al2O3 particles. The embedding of initial oxide particles into the Cr2O3 layer enhances interfacial adhesion.
Figure 15b depicts the oxidation process of the WGBR. In the initial stage, oxygen directly oxidizes Ni, Cr, and Ti, forming discrete Cr2O3, NiO, and TiO2 particles. During the steady-state stage, the process transitions to diffusion-controlled kinetics. Ni2+, Al3+, and Ti4+ ions diffuse outward, generating a dense Cr2O3 layer and localized Al2O3 domains. Compared to BM, WGBR exhibits higher Cr oxidation propensity, favoring the formation of a continuous Cr2O3 layer that significantly improves oxidation resistance. In contrast, BM undergoes more extensive Ni oxidation, resulting in a thicker but less protective oxide layer.
The green phase represents nickel oxide (NiO), the gray phase indicates chromium oxide (Cr2O3), and the yellow phase corresponds to aluminum oxide (Al2O3).
With the continuous migration of oxygen from the surface to the substrate, oxide films of varying morphologies and thicknesses form in a specific sequence. During the initial oxidation stage, oxygen diffusion leads to the formation of a NiO oxide film with lower Gibbs free energy:
G T θ ( kJmol - 1 ) = - 468.0892 + 0.1696 T ( K )
Subsequently, a Cr2O3 interlayer forms, whose Gibbs free energy is
G T θ ( kJmol - 1 ) = - 752.4631 + 0.1684 T ( K )
Within the oxide film structure, the Gibbs free energy of the TiO2 interlayer is expressed as
G T θ ( kJmol - 1 ) = - 944.75 + 0.1854 T ( K )
Meanwhile, the Gibbs free energy of the Al2O3 interlayer is
G T θ ( kJmol - 1 ) =   - 1127.3137 + 0.2193 T ( K )
The high-temperature oxidation behavior of the WGBR reveals that its oxide layer consists of a protective Cr2O3 layer, a non-protective TiO2 layer, and NiCr2O4. These findings align with XRD analysis results. Notably, NiCr2O4 is spontaneously generated through the following reaction between NiO and Cr2O3:
NiO + Cr 2 O 3 ( g ) = Ni C r 2 O 4 ( s ) ,   G T θ ( kJmol - 1 ) = - 1378.26 + 0.3677 T ( K )
The BM and WGBR exhibit significantly more intense oxidation behavior at 1100 °C compared to 900 °C and 1000 °C, indicating a transition in oxidation mechanisms within the 1000–1100 °C temperature range. Elevated temperatures naturally enhance the diffusion of chromium, titanium, and oxygen, leading to accelerated mass gain and oxidation rates. Crucially, non-protective NiCr2O4 forms after 1440 min of oxidation at 1100 °C. The formation of NiCr2O4 consumes the protective Cr2O3 layer, exacerbating oxidation progression and ultimately causing severe oxidative degradation. Thus, the emergence of NiCr2O4 is a critical factor influencing oxidation behavior at 1100 °C. Additionally, as highlighted by Kumar et al. [26], the outer Cr2O3 layer can be further oxidized into gaseous CrO3 at elevated temperatures. Since CrO3 is volatile and non-protective, this secondary oxidation of Cr2O3 represents another key contributor to the severe oxidation observed at 1100 °C.

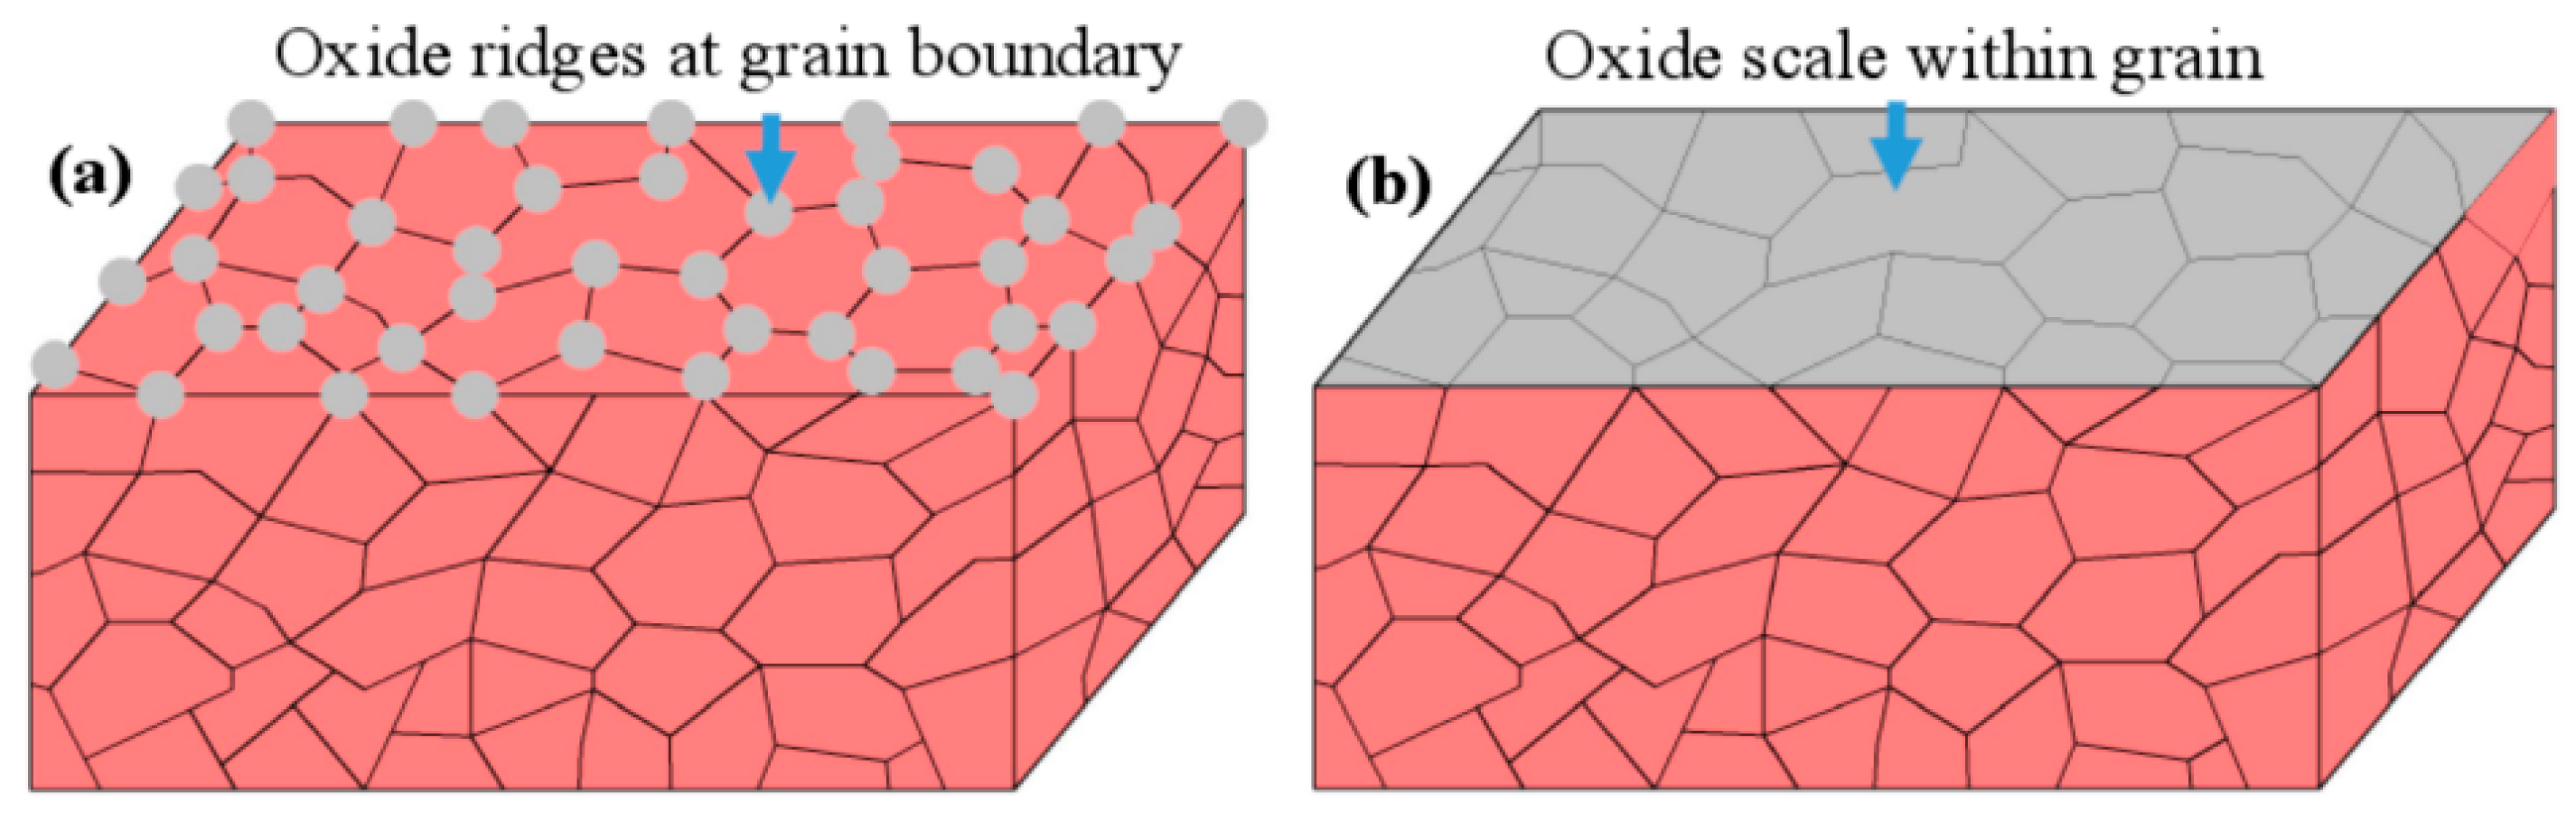
4.2. Oxide Spallation Mechanism Analysis

Figure 14 shows the surface morphology of the BM after oxidation at 1000 °C for 1440 min. As observed, the surface oxide layer (NiO) on the BM exhibits cracking and spallation following oxidation at 1000 °C for 1440 min. Based on the BM’s microstructure, a schematic diagram of the growth, cracking, and spallation of the NiO oxide layer is proposed, as illustrated in Figure 16.
Thermodynamic calculations of the Gibbs free energy for oxide formation by the BM’s constituent elements reveal that NiO has the lowest free energy, explaining its preferential formation on the BM surface (Figure 16a). As temperature increases, oxide growth occurs through interconnected networks, forming a thin and uniform oxide layer (Figure 16b), accompanied by internal stress development. Stress relief via oxide debonding at the oxide/substrate interface primarily occurs at defect sites (e.g., Kirkendall voids) (Figure 16c). While this expansion process does not accelerate oxidation rates, prolonged exposure to elevated temperatures or extended durations leads to gradual nodular growth of the oxide scale. Notably, such expansion partially relaxes compressive stresses, resulting in localized bulging. When the oxide scale becomes excessively thick, preventing the relief of compressive stresses through deformation or wrinkling, cracks initiate at defect sites (Figure 16d). These cracks propagate under accumulating stress, eventually causing severe spallation. Post-spallation, deformed oxide scales remain with clearly visible scale/alloy interfaces. An analysis indicates that weak bonding strength at the scale/alloy interface is the primary cause of cracking and spallation. To address this, improving interfacial adhesion strength is crucial for enhancing the oxidation resistance of BM alloys [27].
Spallation during oxidation is primarily driven by two factors: thermal stress, generated during heating and cooling cycles, arising from the mismatch in coefficients of thermal expansion (CTEs) between the oxide scale and the substrate, and growth stress, caused by the volumetric difference between the formed oxide and the consumed metal. Thermal cycling also introduces cracks in the oxide layer, further enhancing oxygen supply to the substrate. The spallation behavior depends on the grain size of the base material undergoing oxidation. Due to CTE mismatch, the surface NiO layer tends to fracture into powdery structures under stress, while the intermediate Cr2O3 layer retains a dense, protective morphology.
Figure 17 shows the surface morphology of the WGBR after oxidation at 800 °C for 1440 min. During initial oxidation, Cr2O3 oxides preferentially precipitate at grain boundaries due to their high density in the WGBR. As temperature and oxidation time increase, Cr2O3 rapidly covers the alloy surface, forming a dense protective layer. This grain boundary oxidation behavior aligns with observations in nickel-based superalloys, where grain boundaries act as fast diffusion pathways in gaseous environments, making intergranular oxide layers prevalent. Cr2O3 growth initiates along grain boundaries, consistent with findings in this study.
Figure 18 illustrates the grain boundary oxidation mechanism in the WGBR. Initially, oxides grow along grain boundaries intersecting the surface. Although thermodynamic calculations predict NiO as the most stable phase (lowest Gibbs free energy), kinetic factors dominate: grain boundaries, as high-energy regions, provide preferential diffusion pathways for Cr, enabling rapid Cr2O3 formation [28]. High growth stresses near grain boundaries arise from two effects: thicker oxide layers along boundaries in fine-grained materials, amplifying the volumetric mismatch between oxides and the consumed metal, and physical barriers formed between oxides growing along boundaries and intragranular regions [29,30]. These combined factors promote the rapid formation of a dense Cr2O3 oxide film on the alloy surface, significantly enhancing oxidation resistance

5. Conclusions

This oxidation kinetics study revealed that the large-gap powder metallurgy joint zone exhibits superior oxidation resistance compared to the base material at 1000 °C and above, with their oxidation weight gain versus time curves both following parabolic laws. This phenomenon can be attributed to the fact that the preferentially formed NiO on the base material surface lacks stable oxidation resistance and tends to spall off, accompanied by partial oxidation of Cr and Ti elements, where the primary oxidation products are NiO and TiO2. In contrast, the large-gap powder metallurgy joint zone, characterized by abundant grain boundaries, forms dense Cr2O3 during the initial oxidation stage, thereby significantly enhancing its oxidation resistance at 1000 °C.

Author Contributions

Z.C.: Writing—Original Draft, Software, Methodology, Investigation, Formal Analysis, Data Curation, Conceptualization. X.L. (Xin Lai): Writing—Review and Editing, Writing—Original Draft, Methodology. J.F.: Resources, Investigation, Formal Analysis. Zhengyi Jin: Visualization, Validation, Methodology. J.H.: Writing—Review and Editing, Visualization, Supervision, Resources. X.L. (Xiaoqiang Li): Writing—Review and Editing, Visualization, Validation, Supervision, Resources, Funding Acquisition. F.L.: Writing—Review and Editing, Writing—Original Draft, Supervision, Resources, Methodology. All authors have read and agreed to the published version of the manuscript.

Funding

South China University of Technology Fundamental Research Funds for the Central Universities (No. 2023ZYGXZR005), Key Areas Research Program for Higher Education Institutions of Guangdong Provincial Department of Education (No. 2023ZDZX3058), The 17th “Challenge Cup” Guangdong University Students’ Extracurricular Academic Science and Technology Works Competition & 2023 Guangdong Provincial Science and Technology Innovation Strategy Special Funds (“Climbing Program”) University-level Cultivation Project (No. 2023SCPY032), 2023 Guangdong Provincial Science and Technology Innovation Strategy Special Funds (University Students’ Science and Technology Innovation Cultivation) (No. pdjh2023b0823), Guangdong Basic and Applied Basic Research Foundation Project (No. 2023A1515010384), School-Level Research Project of Guangdong Polytechnic of Industry and Commerce (No. 2024-ZKT-05).

Data Availability Statement

The original contributions presented in the study are included in the article; further inquiries can be directed to the corresponding authors.

Acknowledgments

This research was funded by South China University of Technology Fundamental Research Funds for the Central Universities (No. 2023ZYGXZR005), Guangdong Basic and Applied Basic Research Foundation Project (No. 2023A1515010384) and School-Level Research Project of Guangdong Polytechnic of Industry and Commerce (No. 2024-ZKT-05). Zhun Cheng acknowledges funding from the Key Areas Research Program for Higher Education Institutions of Guangdong Provincial Department of Education (No. 2023ZDZX3058), The 17th “Challenge Cup” Guangdong University Students’ Extracurricular Academic Science and Technology Works Competition & 2023 Guangdong Provincial Science and Technology Innovation Strategy Special Funds (“Climbing Program”) University-level Cultivation Project (No. 2023SCPY032), and 2023 Guangdong Provincial Science and Technology Innovation Strategy Special Funds (University Students’ Science and Technology Innovation Cultivation) (No. pdjh2023b0823). Hansheng Yan and Bo Wei contributed to the analyses and discussion of results and reviewed the entire manuscript.

Conflicts of Interest

No conflicts of interest exist in the submission of this manuscript, and the manuscript is approved by all authors for publication.

References

  1. Cheng, Z.; Li, X.Q.; Wang, B.; Qu, S.G.; Li, H.Y. M3B2-type borides effect on the wide gap brazing of K417G alloy with mixed powder. J. Alloys Compd. 2020, 821, 153431. [Google Scholar] [CrossRef]
  2. Yu, X.F.; Wang, S.J.; Zheng, D.Y.; Shen, X.; Li, Y.; Liu, W.; Su, Y.; Liu, F. Effect of heat treatment on rotating bending fatigue properties of K417G nickel-base superalloy. J. Alloys Compd. 2022, 905, 164209. [Google Scholar] [CrossRef]
  3. Zhang, G.T.; Liu, W.J.; Bian, H.Y.; Wang, C.; Li, Q.; Wang, H. Evolutionary mechanism analysis of Laves phase precipitation behavior and wear resistance of laser-directed energy deposited T-800 alloy coatings on K417G alloy at various aging temperatures. Mater. Lett. 2025, 382, 137938. [Google Scholar] [CrossRef]
  4. Liu, S.; Liu, C.S.; Gao, X.Y.; Wen, X.; Qiao, S.; Yuan, C. Insights into process optimization and induction preheating for crack-free laser metal deposition of nickel-based superalloy K417G. J. Mater. Res. Technol. 2024, 29, 2035–2050. [Google Scholar] [CrossRef]
  5. Zhang, L.H.; Liu, Y.H.; Guo, H.M.; Xing, W. Effects of pouring temperature on microstructure and properties of K417G superalloy in thermally-controlled solidification process. Rare Met. Mater. Eng. 2024, 53, 2546–2554. [Google Scholar]
  6. Kalfhaus, T.; Schneider, M.; Ruttert, B.; Sebold, D.; Hammerschmidt, T.; Frenzel, J.; Drautz, R.; Theisen, W.; Eggeler, G.; Guillon, O.; et al. Repair of Ni-based single-crystal superalloys using vacuum plasma spray. Mater. Des. 2019, 168, 107656. [Google Scholar] [CrossRef]
  7. Way, M.; Willingham, J.; Goodall, R. Brazing filler metals. Int. Mater. Rev. 2019, 65, 1–29. [Google Scholar] [CrossRef]
  8. Cheng, Z.; Li, X.Q.; Qu, S.G.; Zhu, D.; Li, H. Microstructural evolution and mechanical properties of wide gap brazing of K417G superalloy. Rare Met. Mater. Eng. 2021, 50, 3262–3269. [Google Scholar]
  9. Ren, X.Y.; Wang, H.; Li, W.W.; Dong, Q.; Chen, B.; Mao, W. Efect of holding time on interfacial evolution and mechanical strength of wide-gap brazed K417G superalloy joints. Weld. World 2024, 68, 3079–3084. [Google Scholar] [CrossRef]
  10. Li, Y.; Tan, Y.; You, X.Q.; Wang, D.; Hu, Y.; Song, S.; Qiang, J. Effect of trace impurity elements on the high-temperature oxidation resistance of a high-purity nickel-based superalloy. Corros. Sci. 2023, 211, 110904. [Google Scholar] [CrossRef]
  11. Miller, C.F.; Simmons, G.W.; Wei, R.P. High temperature oxidation of Nb, NbC and Ni3Nb and oxygen enhanced crack growth. Scr. Mater. 2000, 42, 227–232. [Google Scholar] [CrossRef]
  12. Zhao, D.; Xuan, W.D.; Shao, G.L.; Che, X.; Wang, S.; Qi, J.; Ren, Z. Unveiling the short-term oxidation behavior of nickel-base superalloy CMSX-4 in high-temperature air. Corros. Sci. 2025, 251, 112915. [Google Scholar] [CrossRef]
  13. Khedr, M.; Li, W.; Min, N. Strengthening contributions of mechanical twinning and dislocations to the flow stress of hadfield high-manganese steel: Quantitative analysis. J. Mater. Eng. Perform. 2022, 32, 501–511. [Google Scholar] [CrossRef]
  14. Cheng, Z.; Li, X.Q.; Zhang, M.A.; Qu, S.; Li, H. Wide-gap brazing of K417G alloy assisted by in situ precipitation of M3B2 boride particle. Materials 2020, 13, 3140. [Google Scholar] [CrossRef]
  15. He, W.B.; Xue, Z.L.; Guo, R.; Chen, N. On machining K417 superalloy with sliding self-propelled rotary tools: Simulation and experimental investigation. Int. J. Adv. Manuf. Technol. 2023, 126, 1669–1680. [Google Scholar] [CrossRef]
  16. Li, X.Q.; Cheng, Z.; Qu, S.G.; Zhu, D.; Li, H. Effect of filler metal on the microstructural evolution and mechanical properties of wide gap brazed K417G superalloy joints. Vacuum 2021, 184, 109967. [Google Scholar] [CrossRef]
  17. Jang, C.; Kim, D.; Kim, D.; Sah, I.; Ryu, W.S.; Yoo, Y.S. Oxidation behaviors of wrought nickel-based superalloys in various high temperature environments. Trans. Nonferr. Met. Soc. China 2011, 21, 1524–1531. [Google Scholar] [CrossRef]
  18. Liu, B.C.; Li, H.; Lou, L.H. Isothermal Oxidation Behavior of Single-Crystal Nickel-Base Superalloy DD10. Rare Met. Mater. Eng. 2010, 39, 1407–1410. [Google Scholar]
  19. Xu, C.; Nai, Q.L.; Yao, Z.H.; Dong, J. Grain Boundary Oxidation Effect of GH4738 Superalloy on Fatigue Crack Growth. Acta Metall. Sin. 2017, 53, 44–51. [Google Scholar]
  20. Wang, Y.L.; Tan, Y.; Liu, L.B.; Li, P.; Li, X. Oxidation behavior and mechanism of GH4975 superalloy prepared electron beam smelting between 900 °C and 1100 °C in air. Vacuum 2024, 219, 112752. [Google Scholar] [CrossRef]
  21. Wang, Q.; Shuai, S.X.; Lu, G.X.; Attard, B.; Ma, R.; Gao, S.; Rochman, A.; Cassar, G. Residual stress release and corresponding microstructural changes in high-energy impact-modified GH4169 after aging at 425 °C and 650 °C. J. Mater. Res. Technol. 2024, 33, 6461–6466. [Google Scholar] [CrossRef]
  22. Shi, Z.X.; Yan, X.F.; Duan, C.H. Isothermal oxidation behavior of newly developed superalloy GH4282. Trans. Nonferr. Met. Soc. China. 2019, 44, 45–53. [Google Scholar]
  23. Gao, S.; Hou, J.S.; Yang, F.; Wang, C.S.; Zhou, L.Z. High Temperature Oxidation Behaviors of Two Cast Ni-based Superalloys. Rare Met. Mater. Eng. 2019, 48, 960–966. [Google Scholar]
  24. Li, Y.; Liu, X.G.; Guo, J.T.; Yuan, C.; Yang, H.C. Isothermal oxidation behavior of cast Ni-base superalloy K44. Trans. Nonferr. Met. Soc. China. 2006, 16, 1967–1972. [Google Scholar]
  25. Zheng, L.; Zhang, M.C.; Dong, J. Oxidation behavior and mechanism of powder metallurgy Rene95 nickel based superalloy between 800 and 1000 C. Appl. Surf. Sci. 2010, 256, 7510–7515. [Google Scholar] [CrossRef]
  26. Kumar, D.; Adharapurapu, R.R.; Pollock, T.M.; Was, G.S. High-Temperature Oxidation of Alloy 617 in Helium Containing Part-Per-Million Levels of CO and CO2 as Impurities. Met. Mater. Trans. A 2011, 42, 1245–1265. [Google Scholar] [CrossRef]
  27. Zheng, L.; Zhang, M.; Chellali, R.; Dong, J. Investigations on the growing, cracking and spalling of oxides scales of powder metallurgy Rene95 nickel-based superalloy. Appl. Surf. Sci. 2011, 257, 9762–9767. [Google Scholar] [CrossRef]
  28. Athreya, C.N.; Deepak, K.; Kim, D.I.; de Boer, B.; Mandal, S.; Sarma, V.S. Role of grain boundary engineered microstructure on high temperature steam oxidation behaviour of Ni based superalloy alloy 617. J. Alloys Compd. 2019, 778, 224–233. [Google Scholar] [CrossRef]
  29. Ma, J.Y.; Jiang, W.X.; Wang, J. Initial oxidation behavior of a single crystal superalloy during stress at 1150 °C. Sci. Rep. 2020, 10, 3089. [Google Scholar] [CrossRef]
  30. Bitara, T.E.; Meligya, M.E.; Khedrb, M. Investigation of exhaust valve failure in a marine diesel engine. Eng. Fail. Anal. 2020, 114, 104574. [Google Scholar] [CrossRef]
Figure 1. Backscattered Electron Micrograph (a) and EBSD image (b) of the wide-gap brazing joint, (c) EBSD image of the BM, (d) EBSD image of the WGBR. The red dashed line indicates the interface region between theBM and WGBR.
Crystals 15 00434 g001
Figure 2. Mass gain vs. time curves of the BM (a) and WGBR (b).
Crystals 15 00434 g002
Figure 3. Mass gain vs. time curves (a) and oxidizing dynamic curves (b) of the two alloys.
Crystals 15 00434 g003
Figure 4. XRD patterns of the BM (a) and WGBR (b) after oxidation at 1000 °C for 1440 min.
Crystals 15 00434 g004
Figure 5. Low-magnification (a) and High-magnification (b) SEM images of the oxide scales of the joint after oxidation for 1440 min at 1000 °C. The red dashed line indicates the interface region between theBM and WGBR.
Crystals 15 00434 g005
Figure 6. SEM images of the oxide scales of the BM after oxidation for 1440 min at 800 °C (a), 900 °C (b), 1000 °C (c) and 1100 °C (d).
Crystals 15 00434 g006
Figure 7. SEM images of the oxide scales of the WGBR after oxidation for 1440 min at 800 °C (a), 900 °C (b), 1000 °C (c), and 1100 °C (d).
Crystals 15 00434 g007
Figure 8. Scanning Electron Microscope Micrograph (a) and Backscattered Electron Micrograph (b) of cross-section of joint oxidized at 1000 °C for 1440 min. The red dashed line indicates the interface region between theBM and WGBR.
Crystals 15 00434 g008
Figure 9. SEM images of a cross-section of the BM after oxidation at 800 °C (a), 900 °C (b), 1000 °C (c) and 1100 °C (d) for 1440 min.
Crystals 15 00434 g009
Figure 10. SEM images of a cross-section of the WGBR oxidized at 800 °C (a), 900 °C (b), 1000 °C (c), and 1100 °C (d) for 1440 min.
Crystals 15 00434 g010
Figure 11. SEM images of a cross-section and EDS element mapping of the BM oxidized at 1000 °C for 1440 min. Point 1 corresponds to the outermost dendritic oxide, Point 2 represents the intermediate gray oxide layer, and Point 3 denotes the innermost dark gray oxide region.
Crystals 15 00434 g011
Figure 12. SEM images of a cross-section and EDS element mapping of the WGBR oxidized at 1000 °C for 1440 min. Point 1 consists of the outermost gray oxide layer, Point 2 exhibits a middle layer of dark gray dendritic oxide structures, and Point 3 corresponds to the light gray matrix phase.
Crystals 15 00434 g012
Figure 13. The FIB-SEM cross-section morphology (a) and high-magnification FIB-SEM micrograph (b) of various oxide layers in the WGBR after oxidation for 1440 min at 1000 °C.
Crystals 15 00434 g013
Figure 14. Images of a cross-section: (a) BF image near the interface of scale and substrate, (d) SAD patterns of Al2O3, (e) SAD patterns of Cr2O3, and (b,c) HRTEM image of the yellow circles in (a).
Crystals 15 00434 g014
Figure 15. Schematic diagram showing the oxidation processes of the BM (a) and WGBR (b).
Crystals 15 00434 g015
Figure 16. (a) SEM images of the oxide scales of the joint after oxidation for 1440 min at 1000 °C, (b) magnification of I in (a), (c) magnification of II in (a), (d) magnification of III in (c).
Crystals 15 00434 g016
Figure 17. (a) SEM images of the oxide scales of the WGBR after oxidation for 1440 min at 800 °C, (b) high-magnification SEM micrograph of the blue-framed region in Figure 17 (a). The EDS spectrum of the light gray region (Point 1) is presented in the upper-right corner of Figure 17 (b).
Crystals 15 00434 g017
Figure 18. Schematic showing (a) oxide ridge formation occurring initially along the grain boundary and (b) the growth of oxide within the grain and lateral growth of the oxide ridge.
Crystals 15 00434 g018
Table 1. Oxidation rate of the BM and WGBR.
SampleOxidation Rate (mg·cm−2·h−1)
800 °C900 °C1000 °C1100 °C
BM0.18 × 10−30.29 × 10−30.50 × 10−342.24 × 10⁻³
WGBR0.06 × 10−30.16 × 10−30.35 × 10−31.00 × 10⁻³
Table 2. Parabolic rate constants Kp of the BM and WGBR (mg2·cm−4·min−1).
SampleKp (mg2·cm−4·min−1)
800 °C900 °C1000 °C1100 °C
BM1.01 × 10−51.85 × 10−51.31 × 10−42.78 × 10⁻²
WGBR2.07 × 10−62.25 × 10−52.73 × 10−41.38 × 10⁻³
Table 3. EDS analysis of the oxide scales in Figure 11 (at.%).
SpotsElement (at.%)
OAlTiCrCoNiMo
121.171.033.377.167.4737.071.31
247.7211.725.838.325.8619.580.98
350.3038.380.611.770.987.242.87
Table 4. EDS analysis of the oxide scales in Figure 12 (at.%).
SpotsElement (at.%)
OAlTiCrNbNiZrCoMo
154.440.935.7033.0612.222.021.31----
259.9121.5511.433.64--2.500.96----
3--5.913.2711.36--66.15--9.743.56
Disclaimer/Publisher’s Note: The statements, opinions and data contained in all publications are solely those of the individual author(s) and contributor(s) and not of MDPI and/or the editor(s). MDPI and/or the editor(s) disclaim responsibility for any injury to people or property resulting from any ideas, methods, instructions or products referred to in the content.

