Article

Numerical Simulation and Metal Fluidity Analysis of Refill Friction Stir Spot Welding Based on 6061 Aluminum Alloy

1
College of Mechanical and Electrical Engineering, Huangshan University, Huangshan 245061, China
2
Department of Materials Science, Kharkiv Polytechnic Institute, National Technical University, 61002 Kharkiv, Ukraine
*
Author to whom correspondence should be addressed.
Crystals 2025, 15(6), 555; https://doi.org/10.3390/cryst15060555
Submission received: 24 April 2025 / Revised: 29 May 2025 / Accepted: 3 June 2025 / Published: 10 June 2025

Abstract

Simulation analysis is a key technical means for studying the internal metal flow patterns in refill friction stir spot welding zones. This study used DeformV11.0 software to establish an accurate and reliable numerical simulation model for 6061-T6 aluminum alloy refill friction stir spot welding. The microstructure of different stages during actual welding was obtained using the stop method, and combined with the simulation results, shows that the temperature in the spot welding zone is highest during the dwell stage, with a high degree of match between the temperature distribution and actual measurements. This stage is also crucial for affecting the refill process. The results indicate that the metal flow rate in the center of the spot welding zone is slow and the pressure is low, while the flow rate on both sides is fast, and the temperature and pressure are high. In addition, the metal in the weld zone flows plastically in a shear friction and in situ spinning manner, and the weld zone achieves connection in a form similar to “complete friction plug riveting”. A “spiral suction–refill injection layer stacking” model was established to describe the forming mechanism of refill friction stir spot welding.

1. Introduction

Refill friction stir spot welding (RFSSW) has emerged as a significant area of interest within the field of lightweight alloy welding. This technique utilizes the heat generated from high-speed friction between the stirring tool and the target material to achieve spot welding. The process involves the coordinated movement of a specialized stirring sleeve and pin, offering advantages such as superior weld quality, minimal deformation, and reduced heat input. RFSSW finds extensive applications across diverse industries, including automobile manufacturing, high-speed train production, and aircraft construction. The inherent characteristics of this solid-phase welding method make the understanding of process parameters, tool dynamics, and metal flow within the welding zone critical to the integrity and quality of the welds. Consequently, these factors have become a focal point of scholarly research [1,2].
The metal flow within the welding zone is directly linked to the ultimate form and completeness of the weld, playing a pivotal role in both the optimization of process parameters and the design of the stirring tools. Zou Y et al. developed an enhanced tool for RFSSW, demonstrating that the nugget diameter of the weld increases with the rotational speed of the tool. Moreover, welds produced with this tool exhibit a flat hook formation and have been shown to possess superior tensile–shear and tear resistance compared to those made with conventional tools [3]. Shen Z and associates explored the impact of various tool designs on the RFSSW of Al6022-T4/Al7075-T6 aluminum alloys. Their research indicated that an innovative tool equipped with grooves could mitigate the formation of cracks and voids typically associated with standard tools, thereby enhancing metallurgical bonding, material amalgamation, and mechanical interlocking at the weld interface. These improvements resulted in increased lap shear strength and reduced sensitivity to welding parameters [4]. Further, Shen et al. also examined the influence of enhanced tool designs on material flow, blending, and liquefaction cracking in the welding of dissimilar alloys [5]. Kubit A and his team conducted studies focusing on the effects of coatings in the RFSSW of AA7075 aluminum alloy. Their findings highlighted how variations in plunge depths (1.55 mm and 1.9 mm) influence the mechanical properties and fatigue behavior of the welds. Detailed internal flow analyses suggested that the coatings tended to accumulate at the corners of the stirring zone, providing valuable insights into the relationship between plunge depth, coating distribution, and the resultant mechanical and fatigue properties [6].
Research on RFSSW predominantly focuses on the design of stirring tools, with a deeper emphasis on enhancing the metal flow within the spot welding zone. Understanding the behavior of metal flow in this region is crucial for improving welding outcomes; thus, numerical simulation emerges as an indispensable tool for this purpose. Ji S and colleagues conducted simulations to analyze the material flow behavior in RFSSW using LY12 aluminum alloy. By comparing these simulations with the macrostructure and microstructure of the spot weld joint, they elucidated the impact of the stirring tool’s geometry on material flow [7]. Utilizing Abaqus/Explicit, Muci-Küchler K H et al. developed an enhanced fully coupled thermomechanical finite element model (FEM) for the penetration stage of RFSSW. This model facilitated the acquisition of detailed data on temperature, deformation, stress, and strain distributions across the welded plates. To validate the model, experimental studies focusing on temperature were conducted, thereby verifying the model’s predictive accuracy [8]. Similarly, Kubit A and colleagues employed Simufact Forming software for RFSSW simulations, focusing particularly on the temperature field. Their findings demonstrated good agreement between the numerical calculations and experimental results, indicating that the numerical model could effectively predict material flow dynamics and potentially reduce the number of experiments required to determine optimal welding parameters [9]. Salami K et al. applied the full Lagrangian method (SPH) to simulate the RFSSW process. They validated the model’s accuracy through temperature field results from the magnesium–steel spot welding process. Their study not only detailed the temperature, stress, and strain field history but also mapped the material flow during welding, providing essential physical data to accurately assess the joint’s quality, mechanical properties, and material dynamics [10]. Lastly, Zhang H F et al. combined coupled Euler–Lagrangian (CEL) numerical modeling with experimental approaches to examine the welding thermal cycling at various positions within the joint, enhancing the fidelity of the simulation process. Their research into the RFSSW of AZ91D magnesium alloy highlighted how material flow can lead to significant defects, such as hook formations and bonded ligaments, further emphasizing the need for precise control of the welding process [11].
Earlier studies by scholars described and analyzed the process of refillable friction stir spot welding, providing essential references for understanding the metal flow patterns in the weld zone. In recent research advancements, Chen S et al. proposed using different metals for RFSSW material flow analysis, with their results indicating higher authenticity compared to numerical simulations [12]. In terms of mechanical strength and crack propagation, Maranho J F C et al. conducted RFSSW tests using a 0.1 mm downward offset, showing that this offset significantly enhanced the lap shear strength (LSS) of the weld joints under extreme temperatures [13]. Ohashi R et al. investigated the combined riveting and RFSSW process for carbon-fiber-reinforced thermoplastic composites, demonstrating effective improvement in joint strength [14]. Becker et al. investigated the effect of RFSSW on crack propagation behavior in AA6082-T6, finding that crack propagation was influenced not only by local strength but also by the angle at which the crack impacts the spot weld [15]. Belnap R et al. investigated the impact of tool material on the performance of reinforced AA2029-T8 skin structures using RFSSW, comparing process parameters, weld consolidation, and heat-affected zones to determine the effect of different tool materials on heat generation [16].
In terms of microstructure, Kim D et al. studied the refillable friction stir spot welding of Al5052-H32 alloy with high-purity copper film. The results showed that the stirring effect led to dynamic recrystallization in the weld zone, resulting in insufficient work hardening. However, it was found that the grain size of the aluminum alloy did not follow the Hall–Petch relationship with hardness. Diffusion between the metals at the nanometer and micrometer levels induced the formation of secondary phases, which positively contributed to improved mechanical properties [17]. Yuan Y et al. used an RFSSW system to study the effect of insertion depth on the macroscopic and microscopic structures and mechanical properties of 2195-T6 Al-Li alloy thin plate spot welds. All joints showed slight upward hooks at the edge of the lap interface, with hook heights remaining relatively constant. The tensile shear performance was closely related to the hook structure. The joint areas experienced material softening, primarily due to the dissolution and coarsening of precipitates and a decrease in dislocation density. The stir zone had higher hardness values because of finer grain sizes [18].
Wang Y et al. investigated the RFSSW of 2A12 aluminum alloy, with a thickness of 1.5 mm and 7B04 aluminum alloy, with a thickness of 2 mm, using stirring pin diameters of 5 mm and 7 mm, respectively. The macroscopic and microscopic structures of the weld cross-sections, effective welding depth, geometric characteristics of the stirred zone area, and volume were characterized. The results showed that a stirring pin diameter of 5 mm provided better strength stability, while a diameter of 7 mm offered higher strength [19].
In prior studies, scholars have elucidated and examined the RFSSW process, which serves as an essential framework for grasping the dynamics of metal flow within the welding zone. Despite these insights, RFSSW encompasses distinct stages, each characterized by unique flow patterns. A comprehensive understanding of metal flow throughout the entire RFSSW process is crucial for formulating the mechanistic principles that govern the formation within the spot welding zone. Such understanding is instrumental in optimizing the design of stirring tools and selecting appropriate process parameters. This study utilized Deform V11.0 software, noted for its robust post-processing capabilities, to perform numerical simulations of RFSSW. Various stages of the spot welding zone were examined using the instant stop technique to observe both macroscopic and microscopic structures. Additionally, thermocouples were employed to measure temperatures within the spot welding zone, providing data for comparison with simulation outcomes to validate the accuracy of the model. Ultimately, this approach facilitated a detailed elucidation of the RFSSW forming process.

2. Materials and Methods

2.1. Basic Parameter Settings

For the simulations, 6061-T6 aluminum alloy with a 3 mm thickness was selected. The dimensions of the stirring needle, sleeve, and holding ring were set at 6 mm, 9 mm, and 20 mm, respectively. The maximum depth of the spot weld was determined to be 4 mm. The operational parameters included a rotational speed of 1600 rpm and a welding speed of 30 mm/min. The specific stages of the spot welding process are depicted in Figure 1 [20,21]. Notably, the process includes a 3 s dwell period at the conclusion of the penetration stage.
The material properties and dimensions used in the numerical simulation conformed to the specifications outlined in Figure 1. The chemical composition and mechanical properties of the materials are detailed in Table 1 and Table 2; these data come from China Jinsheng Metal Co., Ltd. Dynamic stress–strain curves for the base metal and the spot welding zone at room temperature are depicted in Figure 2. Within a strain range of 0.1, the stress peak of the base material is approximately 350 MPa, while that of the spot weld area is about 120 MPa. Both stress values increase proportionally with strain initially and eventually stabilize. The base material’s stable value remains at around 350 MPa, whereas the spot weld area stabilizes at roughly 140 MPa. There is a significant difference between the two, indicating a noticeable change in material properties in the spot weld area. To ensure the accuracy of simulation, when setting up the material properties for the simulation model, the material not contacted by the stirring tool was set as the base material, as shown in Figure 2a, while the material properties for the area contacted by the stirring tool were set as shown in Figure 2b.
Drawing upon the investigations conducted by other researchers, the constitutive behavior of 6061-T6 aluminum alloy can be accurately characterized by the Arrhenius equation. This relationship encapsulates the interdependencies among true stress (σ), temperature (T), and strain rate (ε) as delineated in Equation (1) [22]:
ε ¯ = A sinh ( α σ ¯ ) n exp Δ H / R T a b s
where
A—Structural factor, 1.15e + 17;
α—Stress level parameter, 0.00882;
Δ H —Spark energy, 228,620 J/mol;
n—Stress index, 28.068;
R—Gas constant, 8.314 J/(mol·K).
Furthermore, the interaction between the stirring tools and the material was modeled through a hybrid approach of Coulomb and shear friction. Specifically, the coefficient of Coulomb friction fk is established at 0.2, while the shear friction force is quantified by Equation (2):
fμ = mτ
where
m—Coefficient of cutting friction;
τ—Material flow shear stress, MPa.
In accordance with the findings of Zhao Yunqiang et al., below a temperature threshold of 475 °C, the coefficient m holds a constant value of 0.32. As temperatures exceed this threshold, the precipitates within the 6061-T6 aluminum alloy commence a partial melting process, thereby diminishing the value of m linearly. At a pivotal temperature of 532 °C, the material undergoes complete melting, resulting in a reduction in m to zero [22].
The fundamental physical parameters for both the base material and the stirring tool were established based on existing scholarly literature and data provided by Deform software [7,8,9,10,11,23,24,25,26]. During the actual welding process, the ambient temperature was initially set at 20 °C. To ensure the precision and consistency of the experiment, spot welding was conducted prior to each trial. This procedure aided in stabilizing the temperature across the equipment. A thermocouple thermometer was strategically positioned at the installation site of the stirring tool to maintain a temperature of 100 °C ± 5 °C. Additionally, two specific areas on the spot-welded plate were designated as temperature monitoring points. The temperature trends recorded by the thermocouple were utilized to validate the accuracy of numerical simulation analysis results, as depicted in Figure 3.
The heat transfer coefficient listed in Table 3 pertains to the interaction between the object and the surrounding environment, while the remaining values denote the heat transfer coefficient between the object and the plate. Given that the bottom plate interfaces not only with the plate but also with larger equipment volumes possessing significant heat storage capacities, its heat transfer coefficient is comparatively lower, and its specific heat capacity is elevated to enhance the precision of simulation results.

2.2. Meshing and Motion Settings

To streamline the computational process, both the upper and lower plates were treated as a single entity. Its specific settings and the relative positions of each component are shown in Figure 4a,b. The area designated for spot welding underwent a more detailed meshing process, with a grid size ratio of 1:10 compared to other zones. The stir sleeve, stir pin, and holding ring were rigid bodies. To speed up calculations, the smallest mesh size for these rigid bodies was 0.3 mm, as illustrated in Figure 4c. The welding speed was set at 30 mm/min, and the displacement speed of the stirring tool was adjusted to 0.5 mm/s after unit conversion. According to standard practices in finite element simulation analysis, the minimum grid element size should be approximately one-third of the maximum displacement exhibited by the stirring tool. Consequently, the minimum grid element size should be less than 0.17 mm. For this study, a minimum element size of 0.15 mm was selected, with specific grid settings predetermined based on this criterion, as illustrated in Figure 4d.
In alignment with the foundational settings indicated in Figure 1 and Table 3, the stirring needle remained positioned above the spot-welded plate throughout the entire spot welding backfilling process. During the cessation stage, it maintained parallel contact with the upper surface of the spot-welded plate. Similarly, the stirring sleeve remained consistently above the spot-welded plate during the backfilling process, maintaining parallel contact during the stationing stage. To theoretically achieve complete backfilling, the displacement velocity of the stirring needle was set to be 1.25 times that of the stirring sleeve. The specific settings and corresponding displacements are detailed in Figure 5.

3. Results

3.1. Temperature Distribution

Utilizing the previously described numerical simulation model, we calculated the temperature distribution within the spot welding zone, which exhibited favorable molding characteristics devoid of defects. The morphology of the simulated spot welding zone closely aligned with the actual observed morphology, as illustrated in Figure 6a. According to the temperature measurement methodology detailed in Figure 3, the simulation revealed a peak temperature of 237 °C, closely approximating the actual peak temperature of 246 °C—a deviation of merely 4%. Similarly, the simulated temperature at locations distant from the spot welding zone registered at 49 °C, compared to an actual temperature of 51 °C, also reflecting a deviation of about 4%. These results, depicted in Figure 6b, validate the accuracy of the numerical simulation model.
Figure 7 delineates the temporal progression of the temperature distribution in the spot welding zone, highlighting peak temperatures occurring at the conclusion of the dwell stage and the commencement of the backfilling stage, predominantly in the central region directly beneath the spot welding zone. An examination of the backfilling rates across different stages indicates that the dwell stage is critical for enabling the plasticized metal to effectively occupy the cavity created by the stirring needle and sleeve. Prior to this stage, the filling rates were suboptimal, diverging from the theoretical expectation of a 100% filling rate. This discrepancy is attributed to the insufficiently elevated temperatures within the spot welding zone during the earlier stages, which could hinder the complete plasticization of the metal across the entire welding zone, thereby reducing metal fluidity and complicating the refilling process for the internal cavities of the stirring tools. As the dwell time extends, the filling rate progressively improves, culminating in complete cavity occupation by the end of the dwell stage. This phenomenon is facilitated by the gradual increase and peaking of temperatures within the zone, enabling the highly plasticized metal to be driven into the cavity under considerable pressure. Elevated temperatures thus play a pivotal role in accelerating the inflow of the plasticized metal.

3.2. Metal Forming Flow Analysis

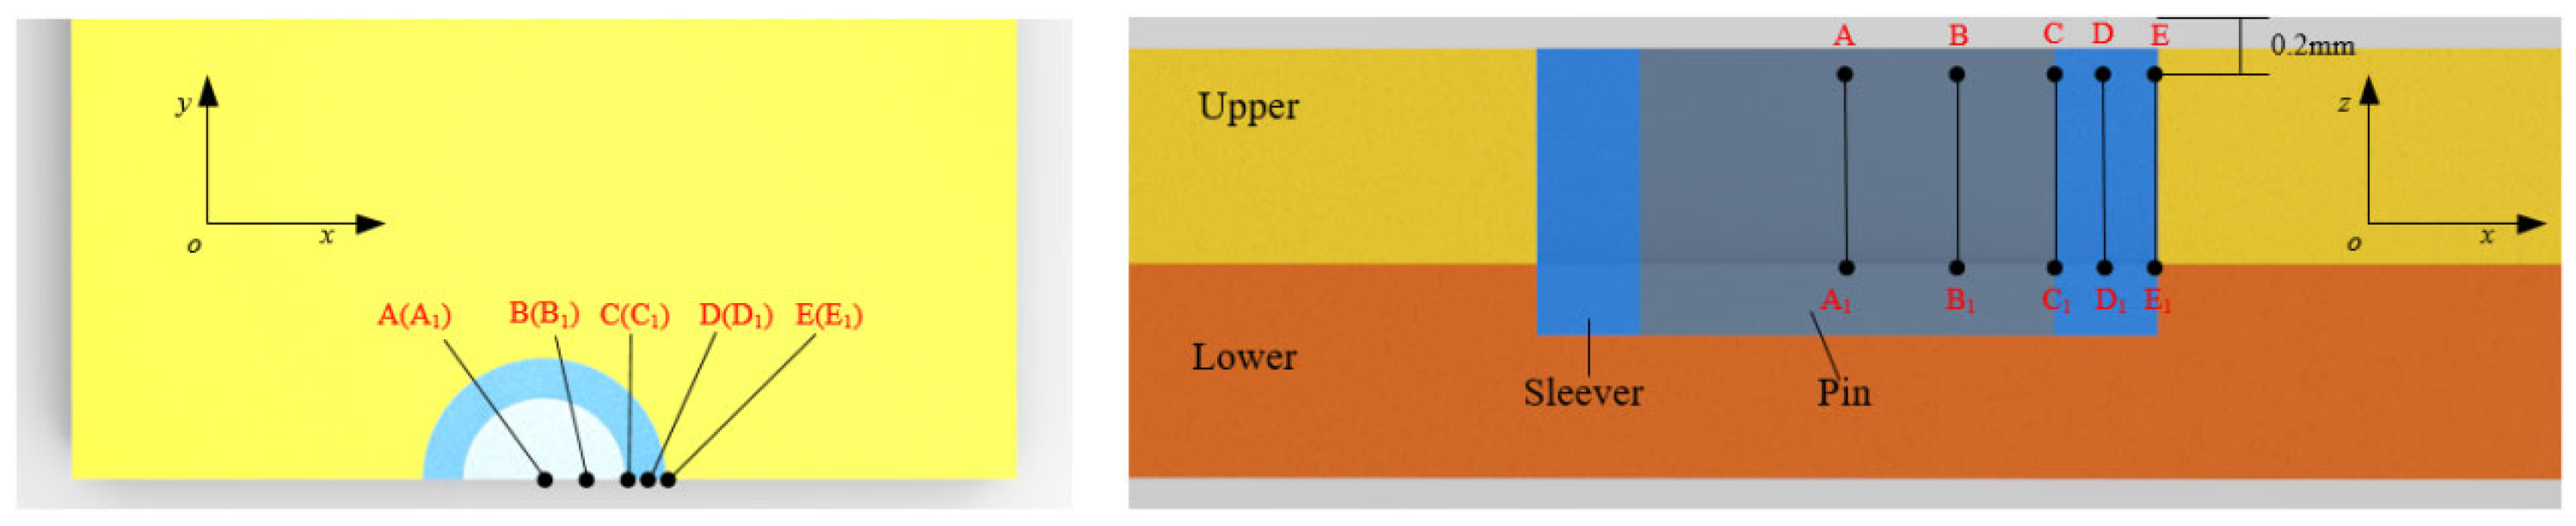
To deepen our comprehension of the flow and displacement patterns of internal metals, which are typically unobservable in practical spot welding scenarios, we utilized the particle tracing functionality within Deform software’s post-processing tools. This feature enabled the selection and tracking of particles situated at strategically chosen sites on the surfaces of both the upper and lower plates. The precise locations of these particles at each selected site are depicted in Figure 8.
Figure 8 illustrates the specific locations of ten representative tracer points: A, B, C, D, E, A1, B1, C1, D1, and E1. Tracer points A through E correspond directly with A1 through E1, respectively, in the thickness direction of the plate, sharing identical coordinates in the XY plane. To enhance the accuracy of positional information and to minimize the influence of surface meshing on the simulation model, tracer points A through E are positioned 0.2 mm below the upper surface of the top plate, while points A1 through E1 are located at the upper surface of the bottom plate. The material directly affected by the stirring tool at these points is highly indicative of flow characteristics, providing crucial insights into the flow trends within the spot welding zone. Specifically, tracer point A is situated at the center of the spot welding zone, point C at the perimeter of the stirring needle, point E at the boundary of the stirring sleeve, point B equidistant from points A and C, and point D equidistant from points C and E.
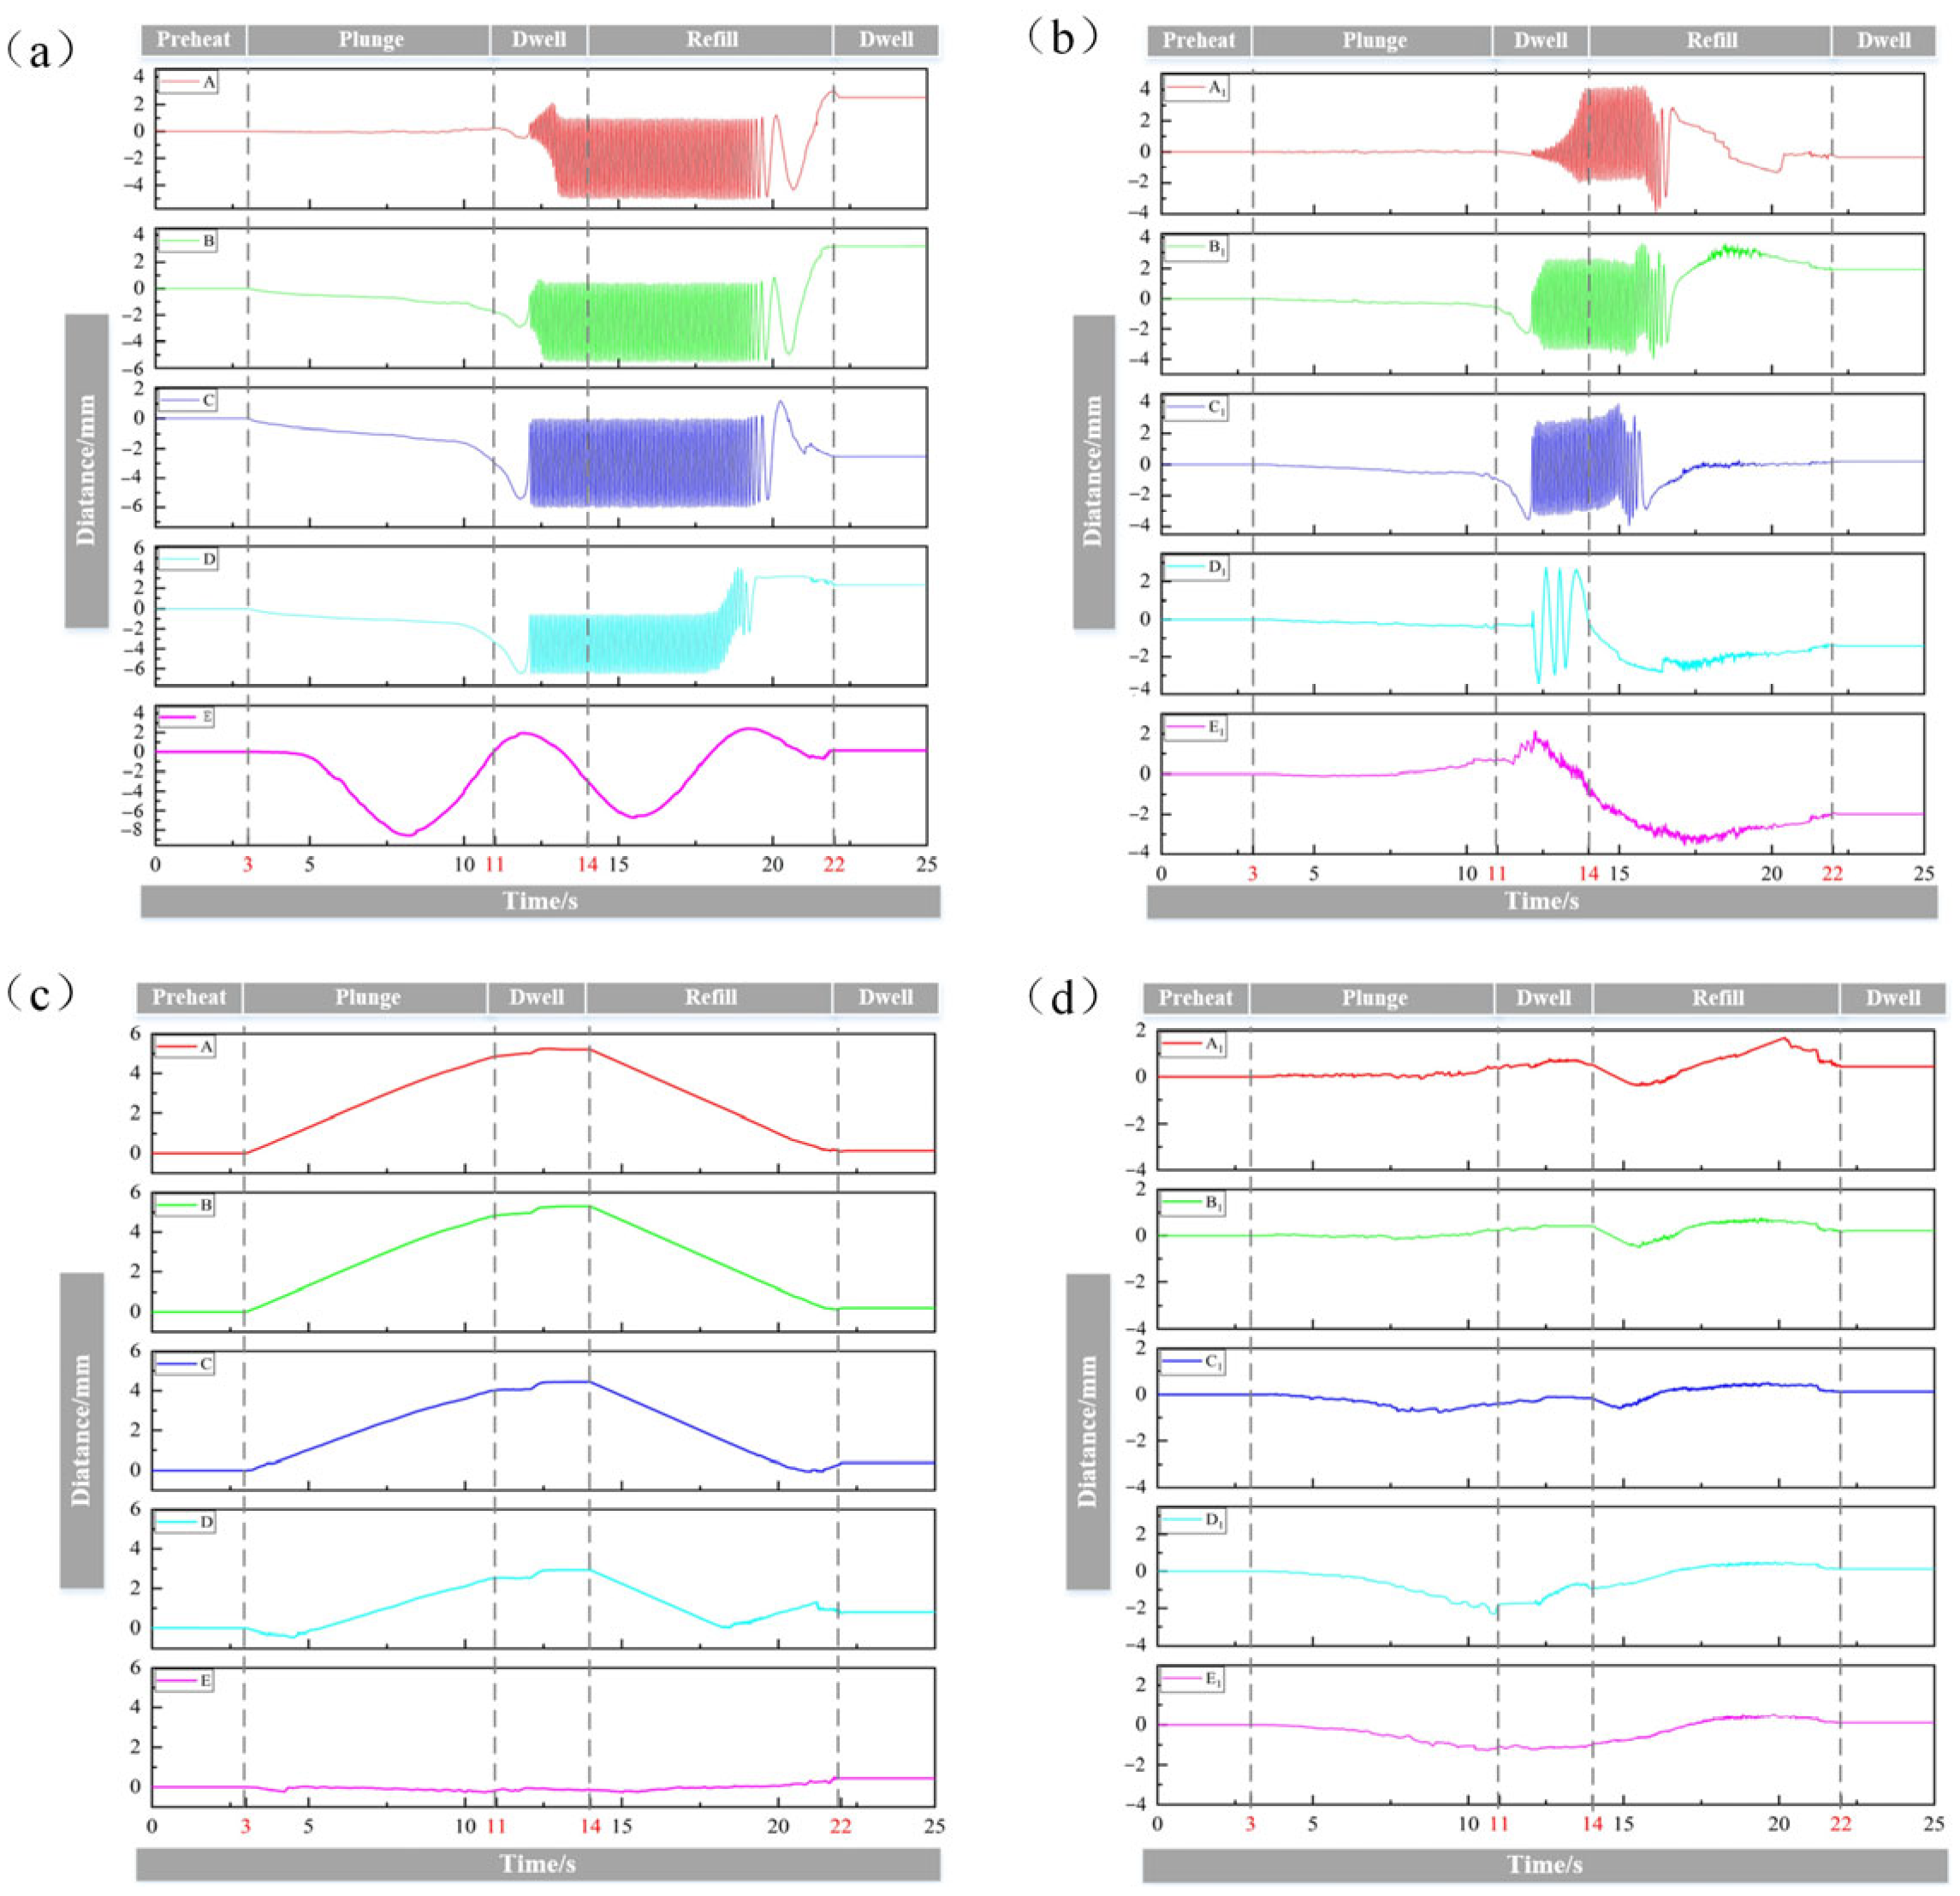
Figure 8 depicts the dynamic displacement trends of each tracer point. Given the symmetry of the RFSSW zone, the displacements in the X and Z directions were selected for analysis. Here, the X direction denotes horizontal displacement, while the Z direction indicates vertical displacement, with positive values representing upward movement. It is observed that the displacement changes in the horizontal direction of the tracer points on the upper plate are more complex and frequent compared to those on the lower plate. Conversely, displacement changes in the vertical direction appear more regular and stable when compared to the lower plate.
From an analysis of the amplitude of horizontal displacement, it is observed that the displacement amplitude progressively increases as one moves away from the center of the spot welding zone. The displacement fluctuation frequency and amplitude at points A and B, located beneath the stirring needle, are essentially identical. Furthermore, the displacement amplitude corresponds closely to the diameter of the stirring needle. The maximum displacement amplitude occurs at tracer point E, positioned at the outermost edge of the stirring sleeve; this amplitude aligns with the diameter of the stirring sleeve. Additionally, the amplitude of the sinusoidal fluctuations decreases progressively, as depicted in Figure 9a. These sinusoidal fluctuations at points E and E1 commence earliest, spanning from the penetration stage through to the conclusion of the backfilling stage, although their fluctuation frequency is markedly lower than that observed at other tracer points. Compared to those on the upper plate, the tracer points on the lower plate exhibit a reduced amplitude and frequency of fluctuations, and these fluctuations persist for a shorter duration, as shown in Figure 9b. It is evident that different tracer points exhibit sinusoidal fluctuations in the horizontal plane. Notably, the magnitude and duration of displacement at tracer points on the upper plate exceed those on the lower plate. This suggests that the fluidity of the metal in the upper plate, within the horizontal plane, is significantly greater than that in the lower plate.
In the thickness direction, the displacement amplitude of the tracer point diminishes progressively as one moves away from the center of the spot welding zone. Each point uniformly adheres to a unidirectional trajectory, culminating in a peak-like profile characterized by a high center and lower sides. The displacement initiates at the onset of the penetration stage and concludes at the termination of the backfilling stage, with a marginal elevation occurring during the standing stage. An upward movement is observed towards the end, as depicted in Figure 9c. The maximal displacement is noted at points A and A1, positioned at the central zenith. The displacement amplitude at point A closely mirrors the axial travel of the stirring needle, while the displacement at point D, located directly beneath the descending stirring sleeve, remains positive. This indicates a complete deviation of point D from its original position. At point E, situated on the outermost perimeter of the stirring sleeve, the displacement exhibits minor fluctuations. Comparatively, the fluctuation amplitude of each tracer point on the lower plate is markedly less pronounced than that on the upper plate, following a pattern of initial decrease followed by a subsequent increase. Moreover, the timing of the descent advances progressively with increasing distance from the center of the spot welding zone. The greatest descent occurs at point E1, at the outermost boundary of the stirring sleeve, where the maximum displacement aligns closely with the depth of penetration of the stirring sleeve into the lower plate, as illustrated in Figure 9d. These observations underscore the significant influence of the stirring tool on the movement of tracer points through the thickness of the material, with the upper plate exhibiting notably greater metal fluidity than the lower plate.
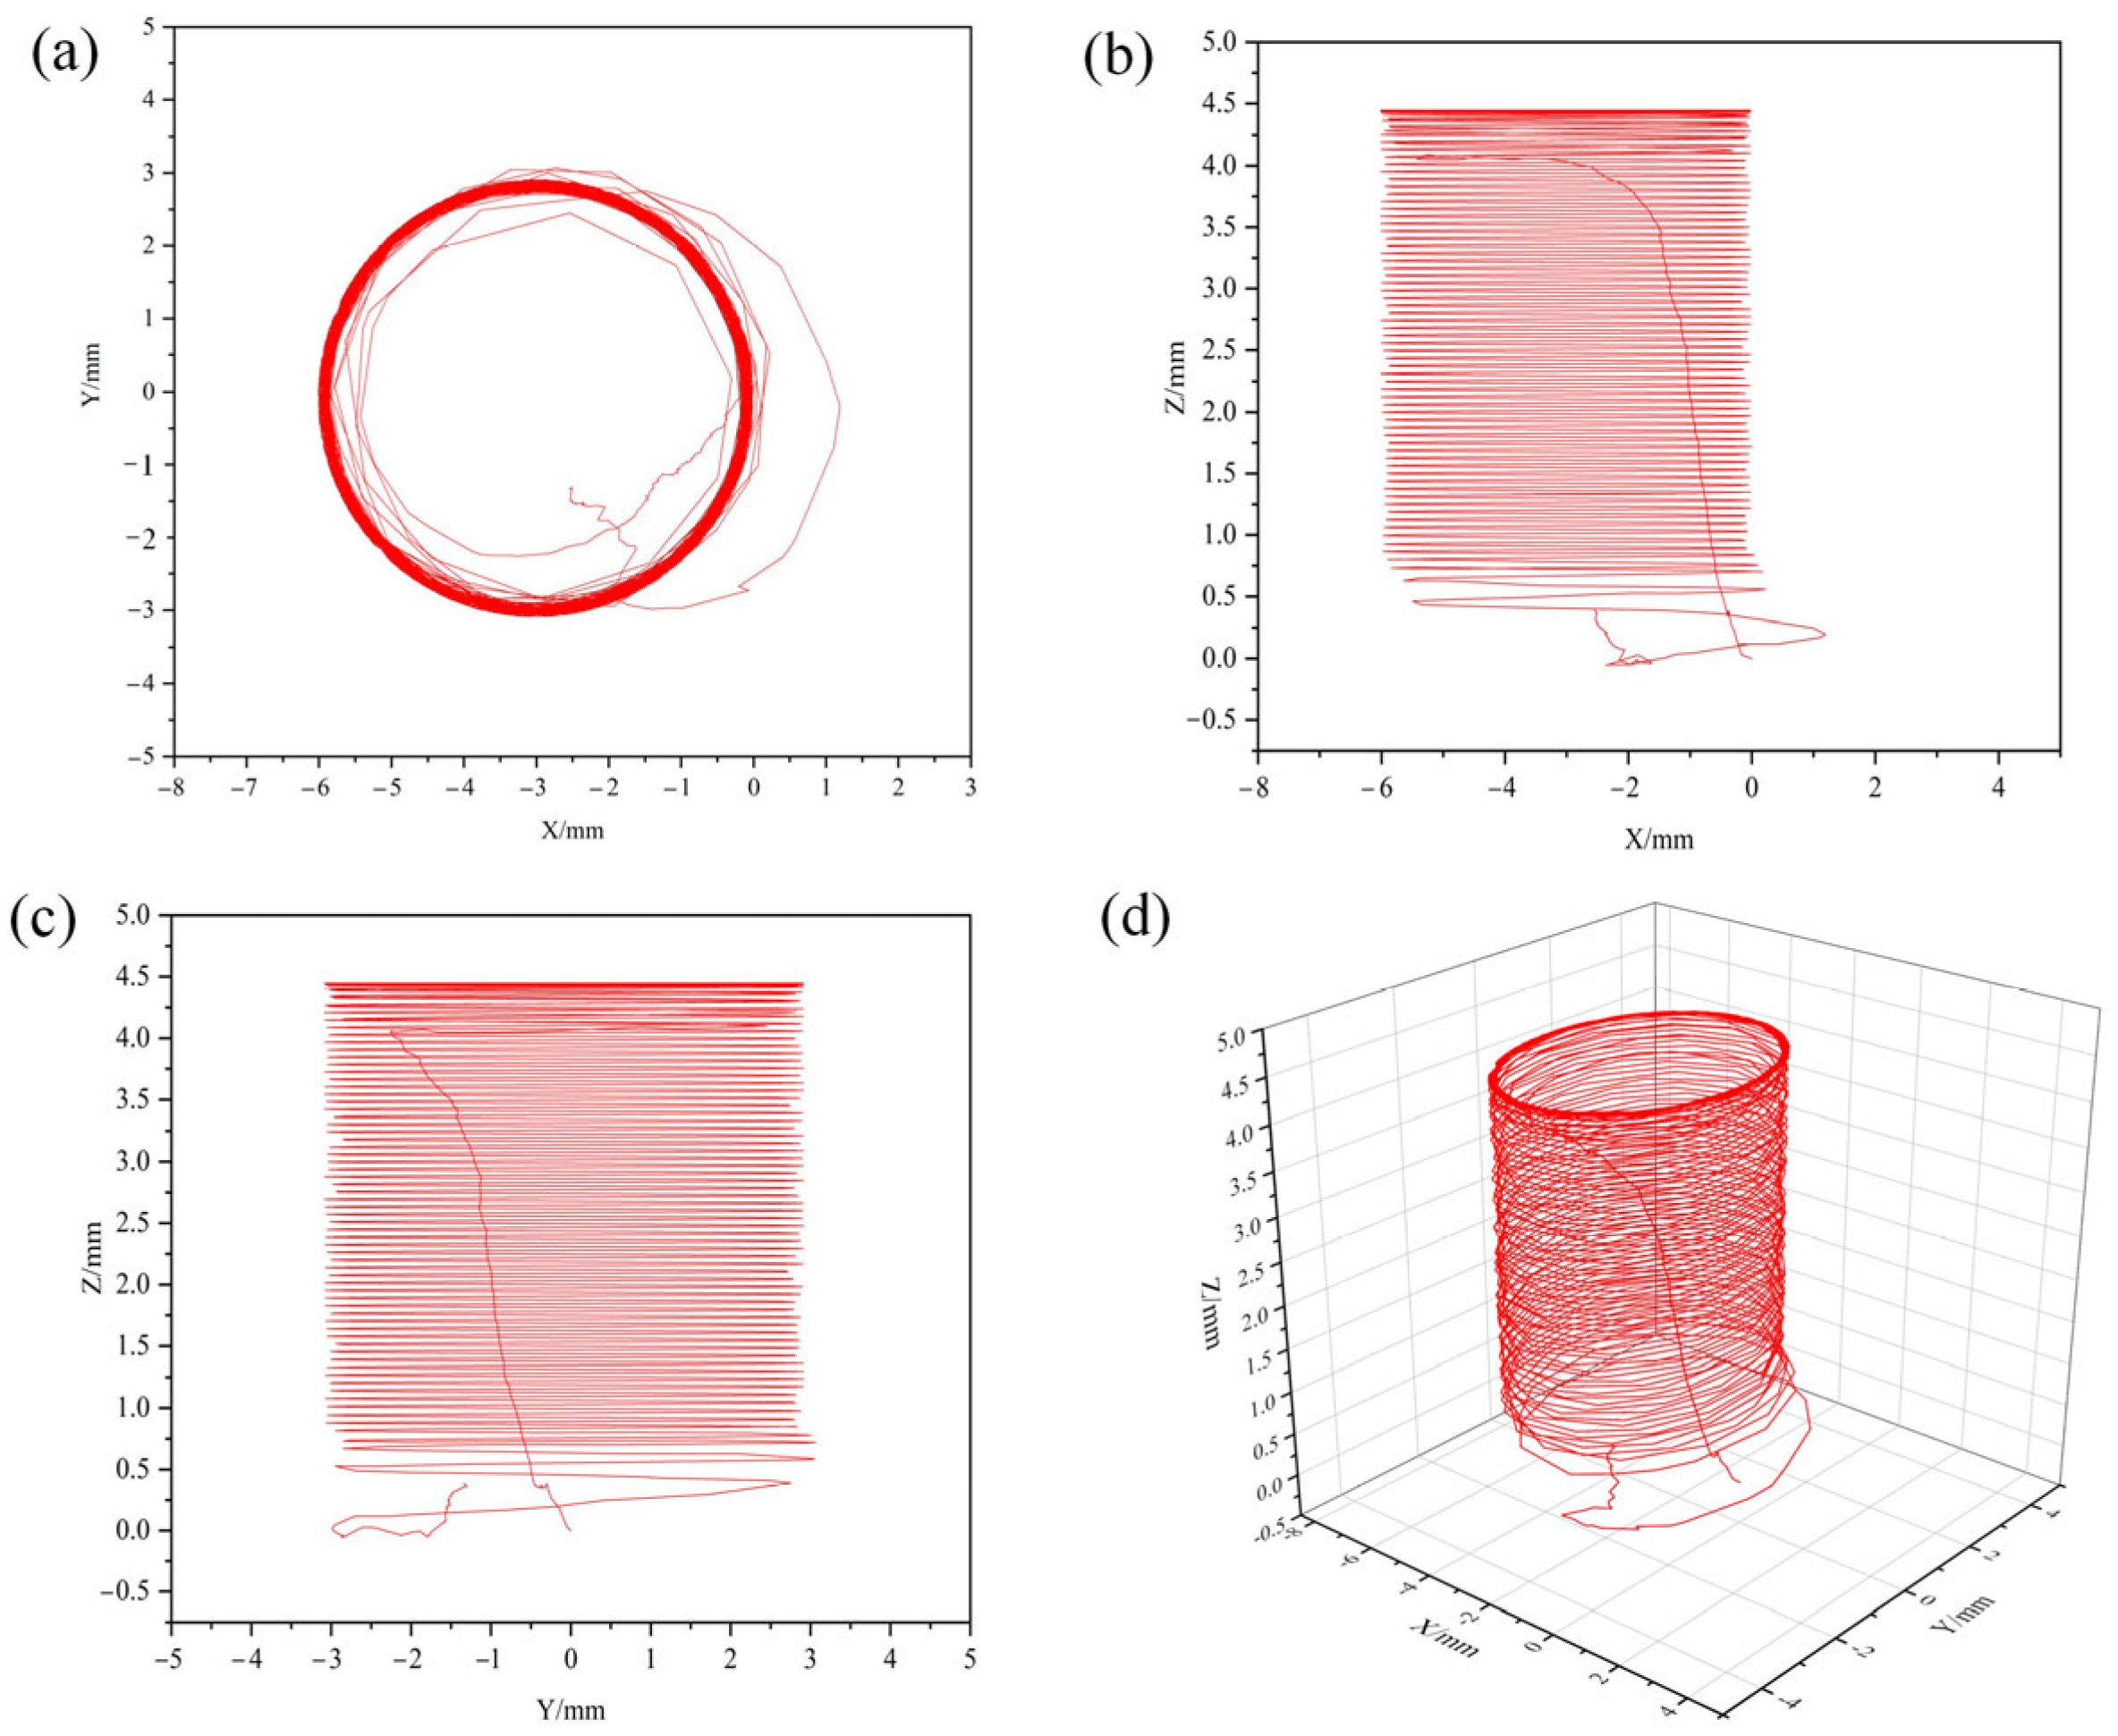
To elucidate the spatial flow dynamics of metal within the spot welding zone, Figure 10 depicts the spatial motion trajectory of point C. This trajectory clearly manifests as a distinct spiral pattern within the spot welding zone, closely resembling the motion of the stirring tool.

3.3. Results of the Penetration Stage

The analysis discussed herein demonstrates that the penetration, dwell, and refilling stages critically influence the metal flow in the spot welding zone. This flow is instrumental for the metal within the spot welding zone to become plasticized at high temperatures and subsequently form an effective welding area. Thus, a comprehensive understanding of the metal flow during these stages is imperative to elucidate the formation mechanism of the spot welding zone. In this study, the metallographic microstructure at various stages of spot welding was examined using the instantaneous stop method. Additionally, the metal flow and formation processes in the spot welding zone were elucidated through the integration of simulation analysis results.
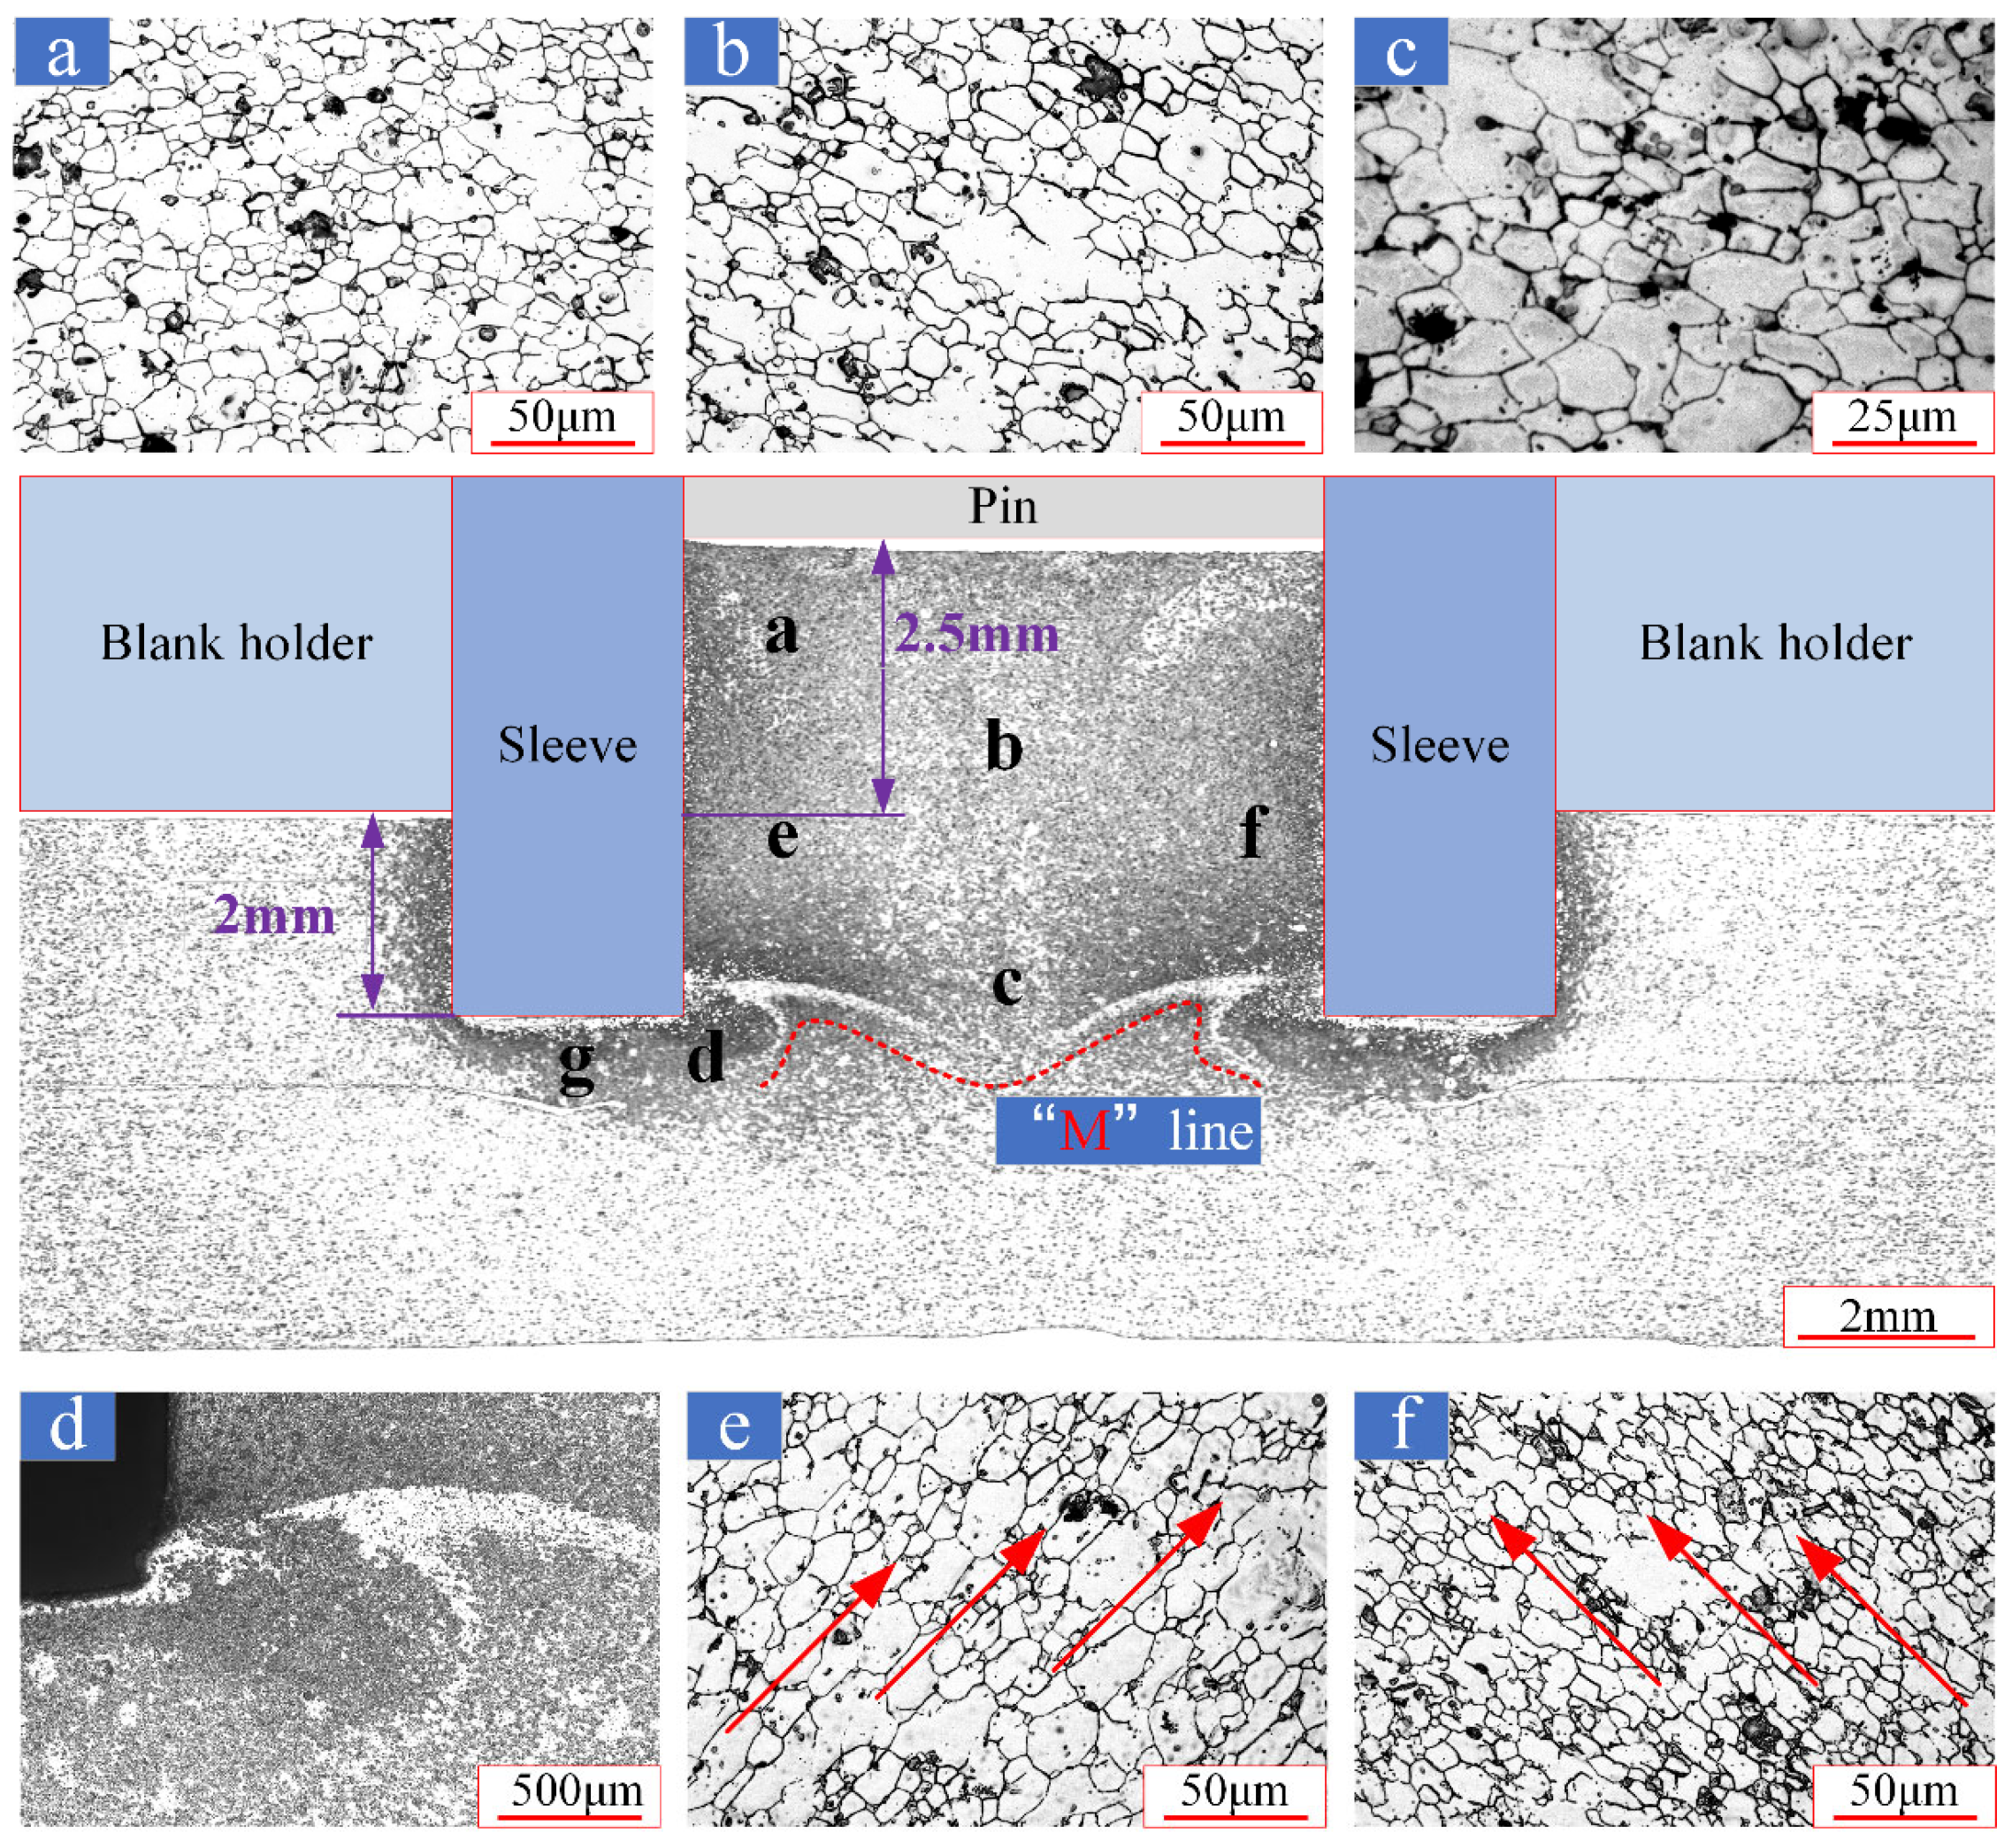
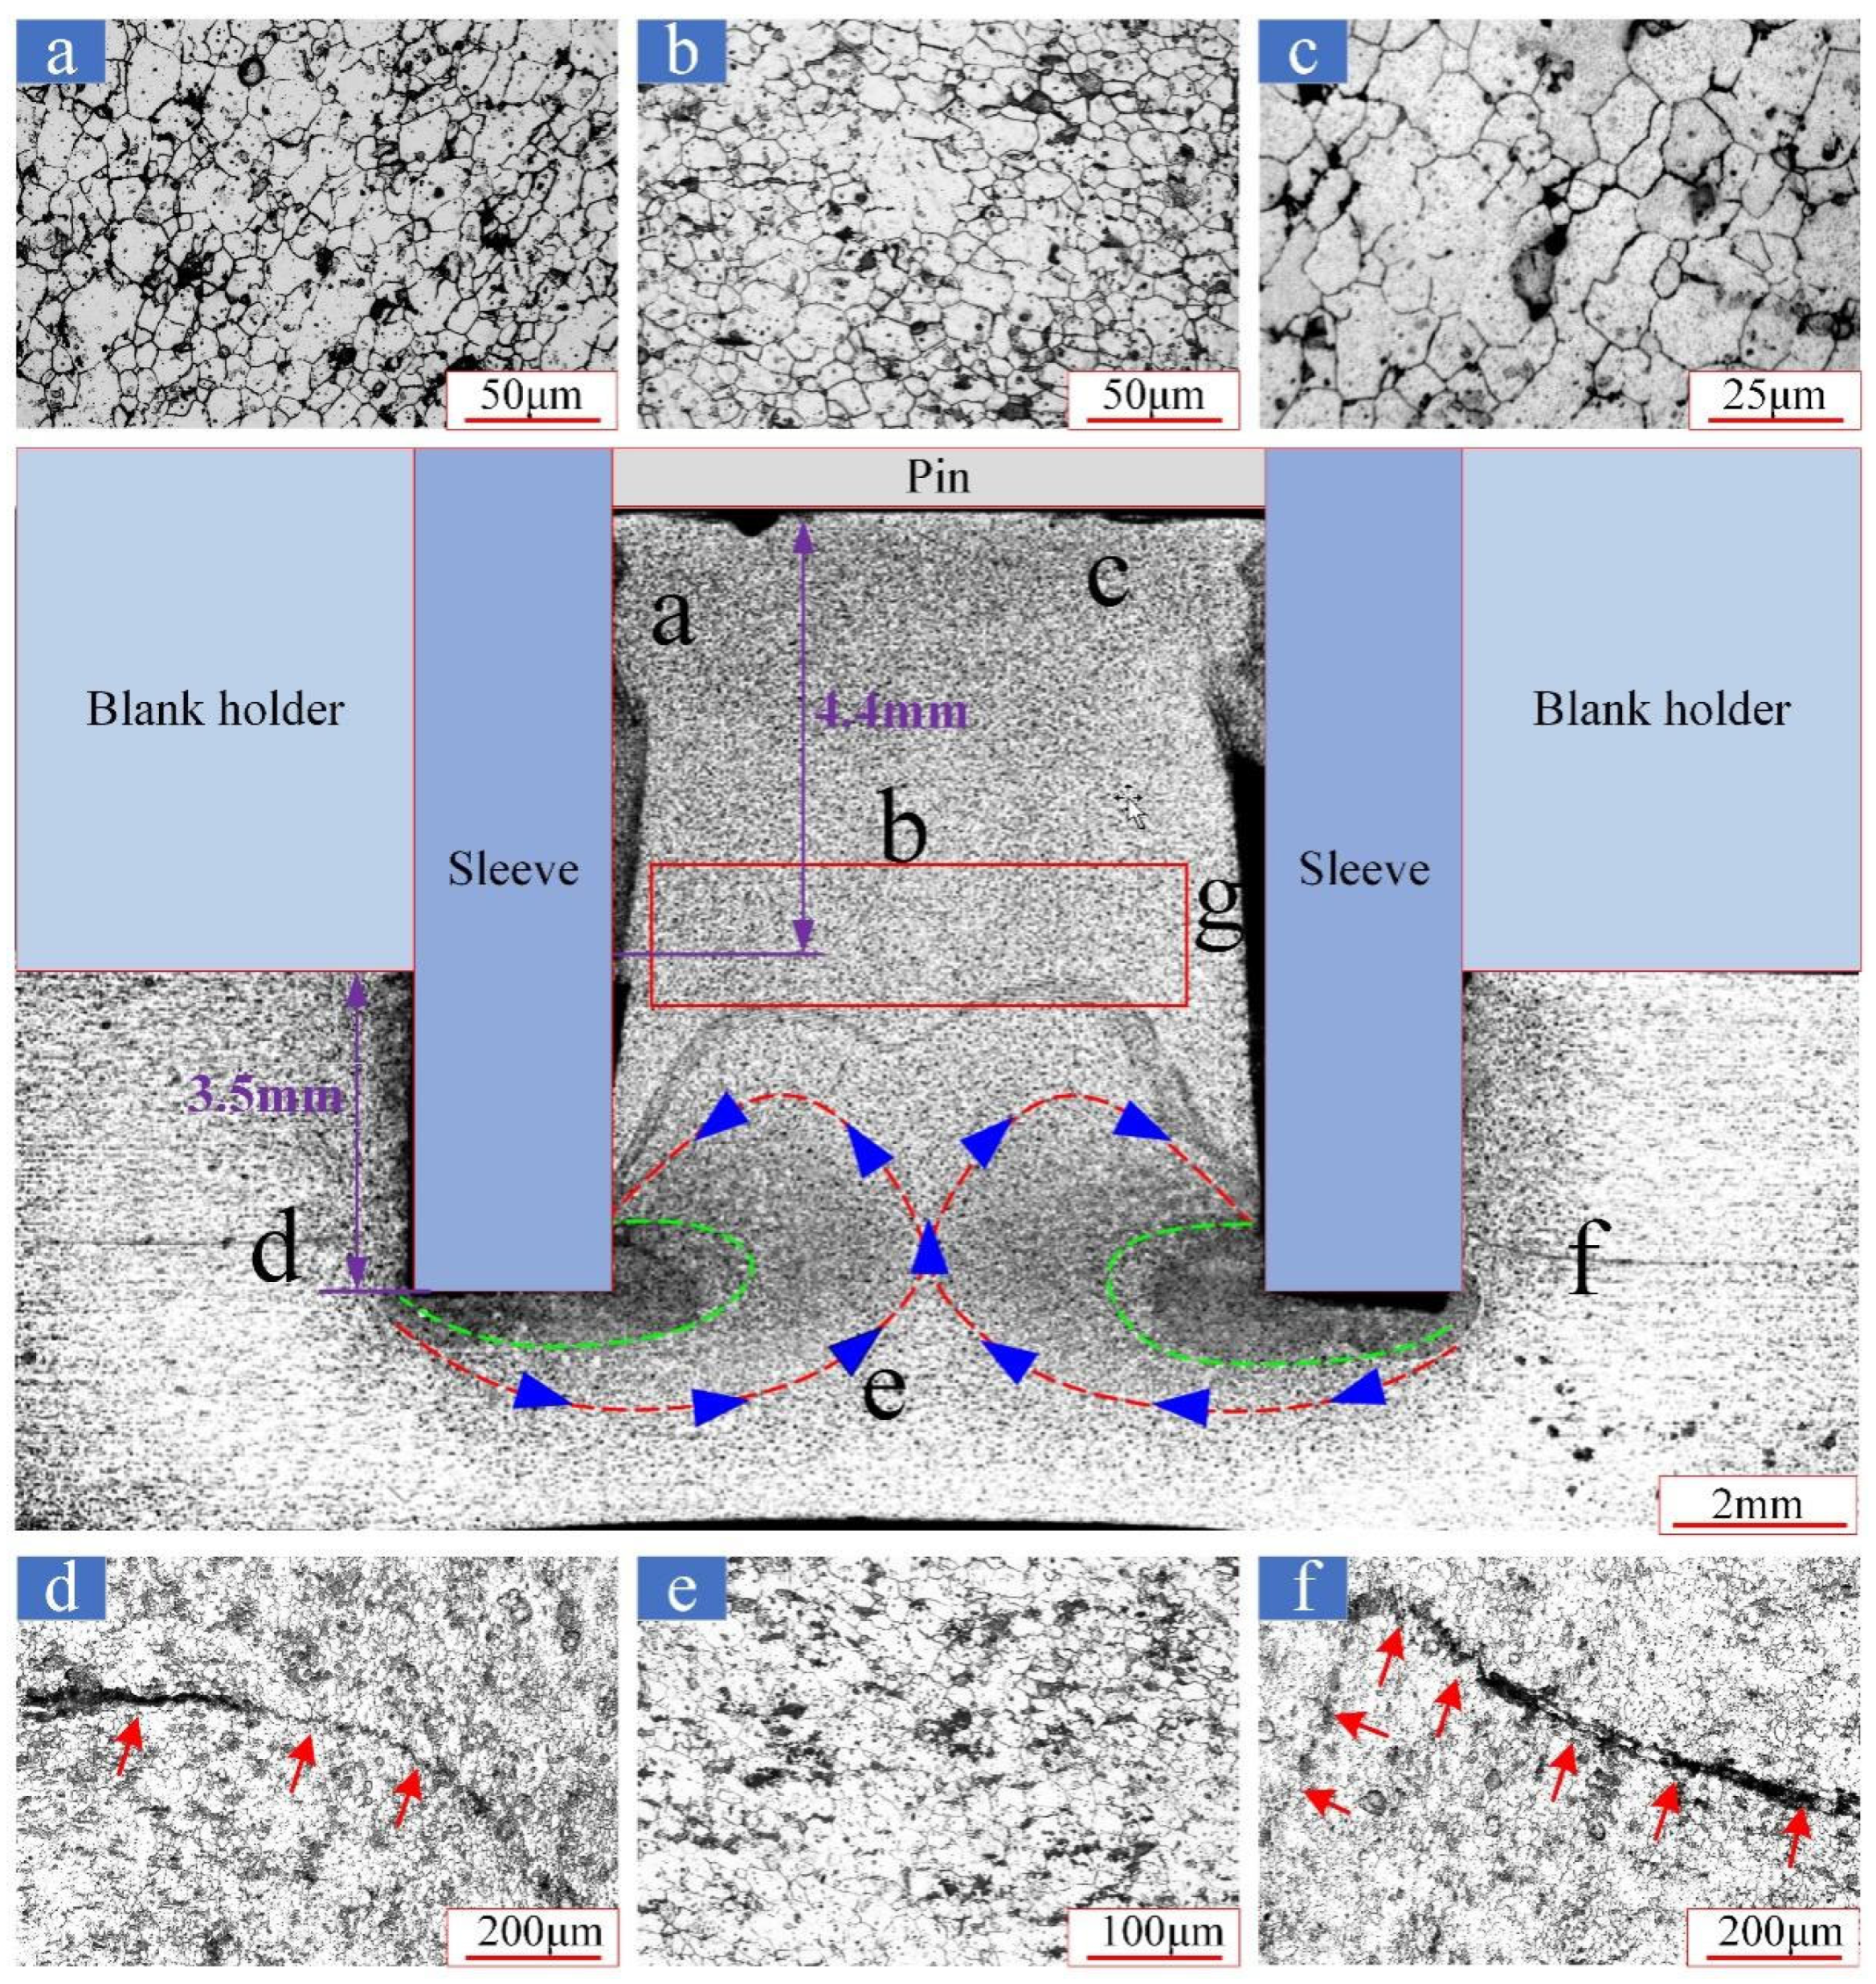
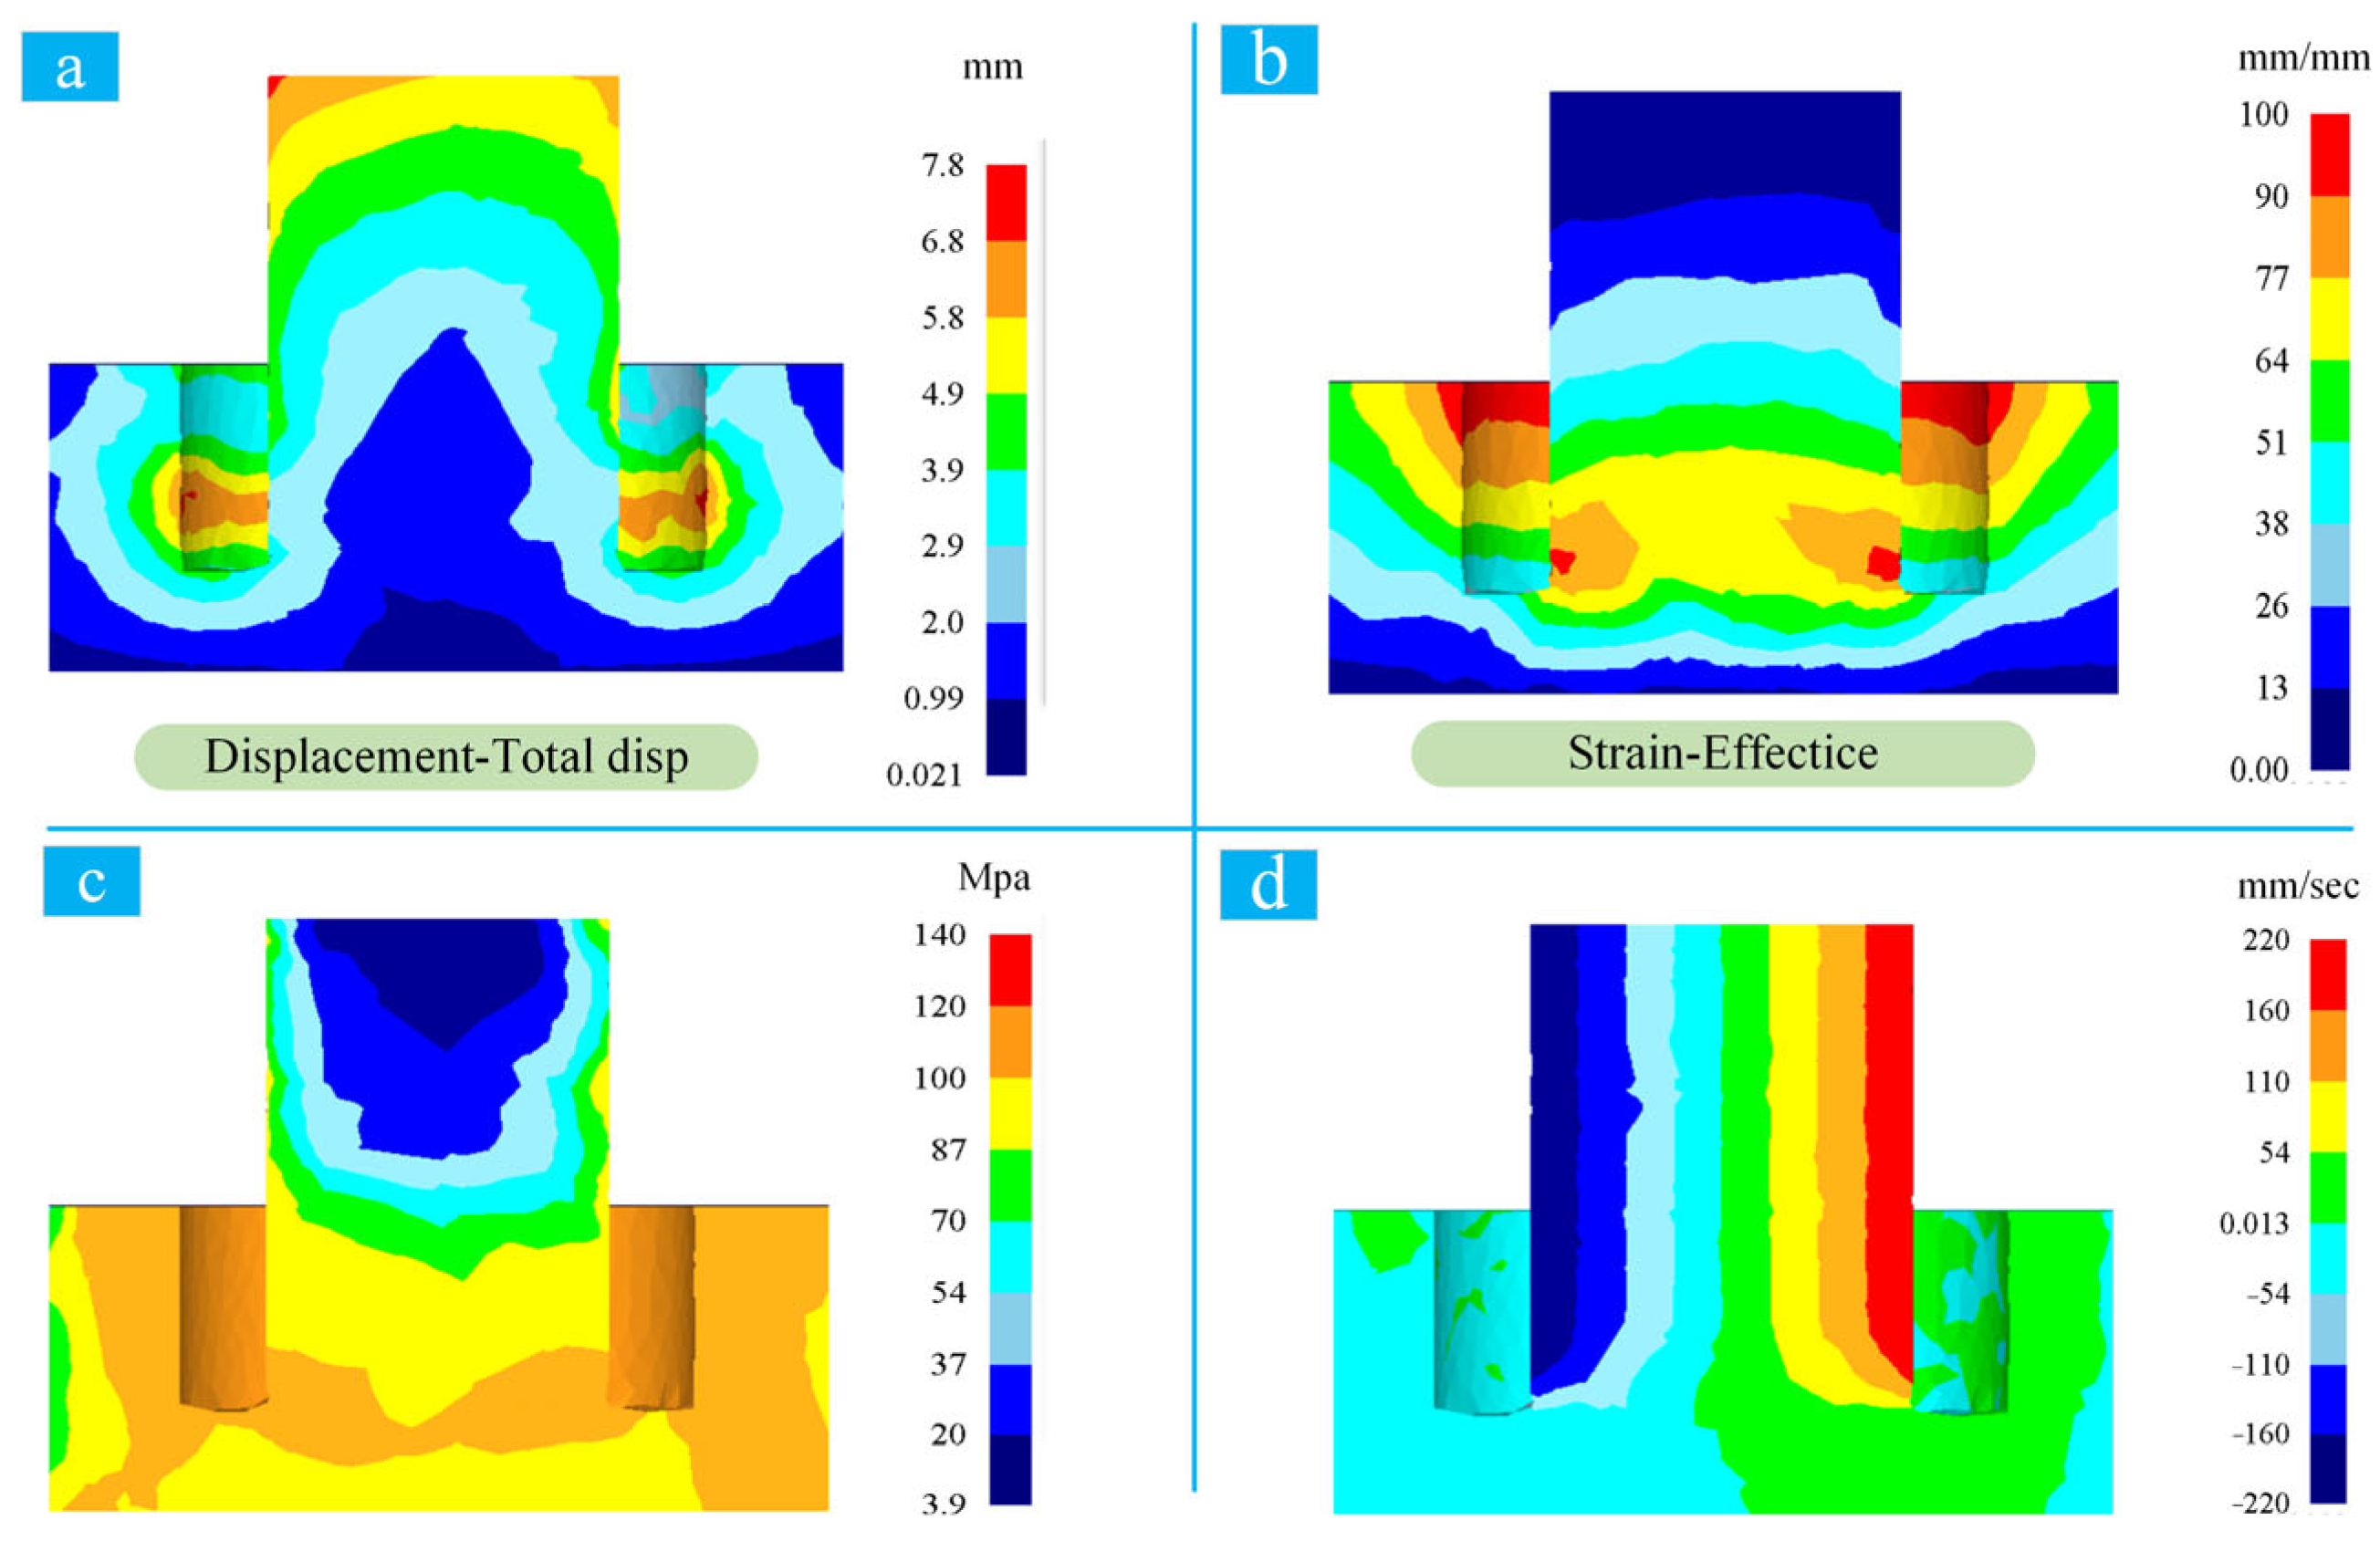
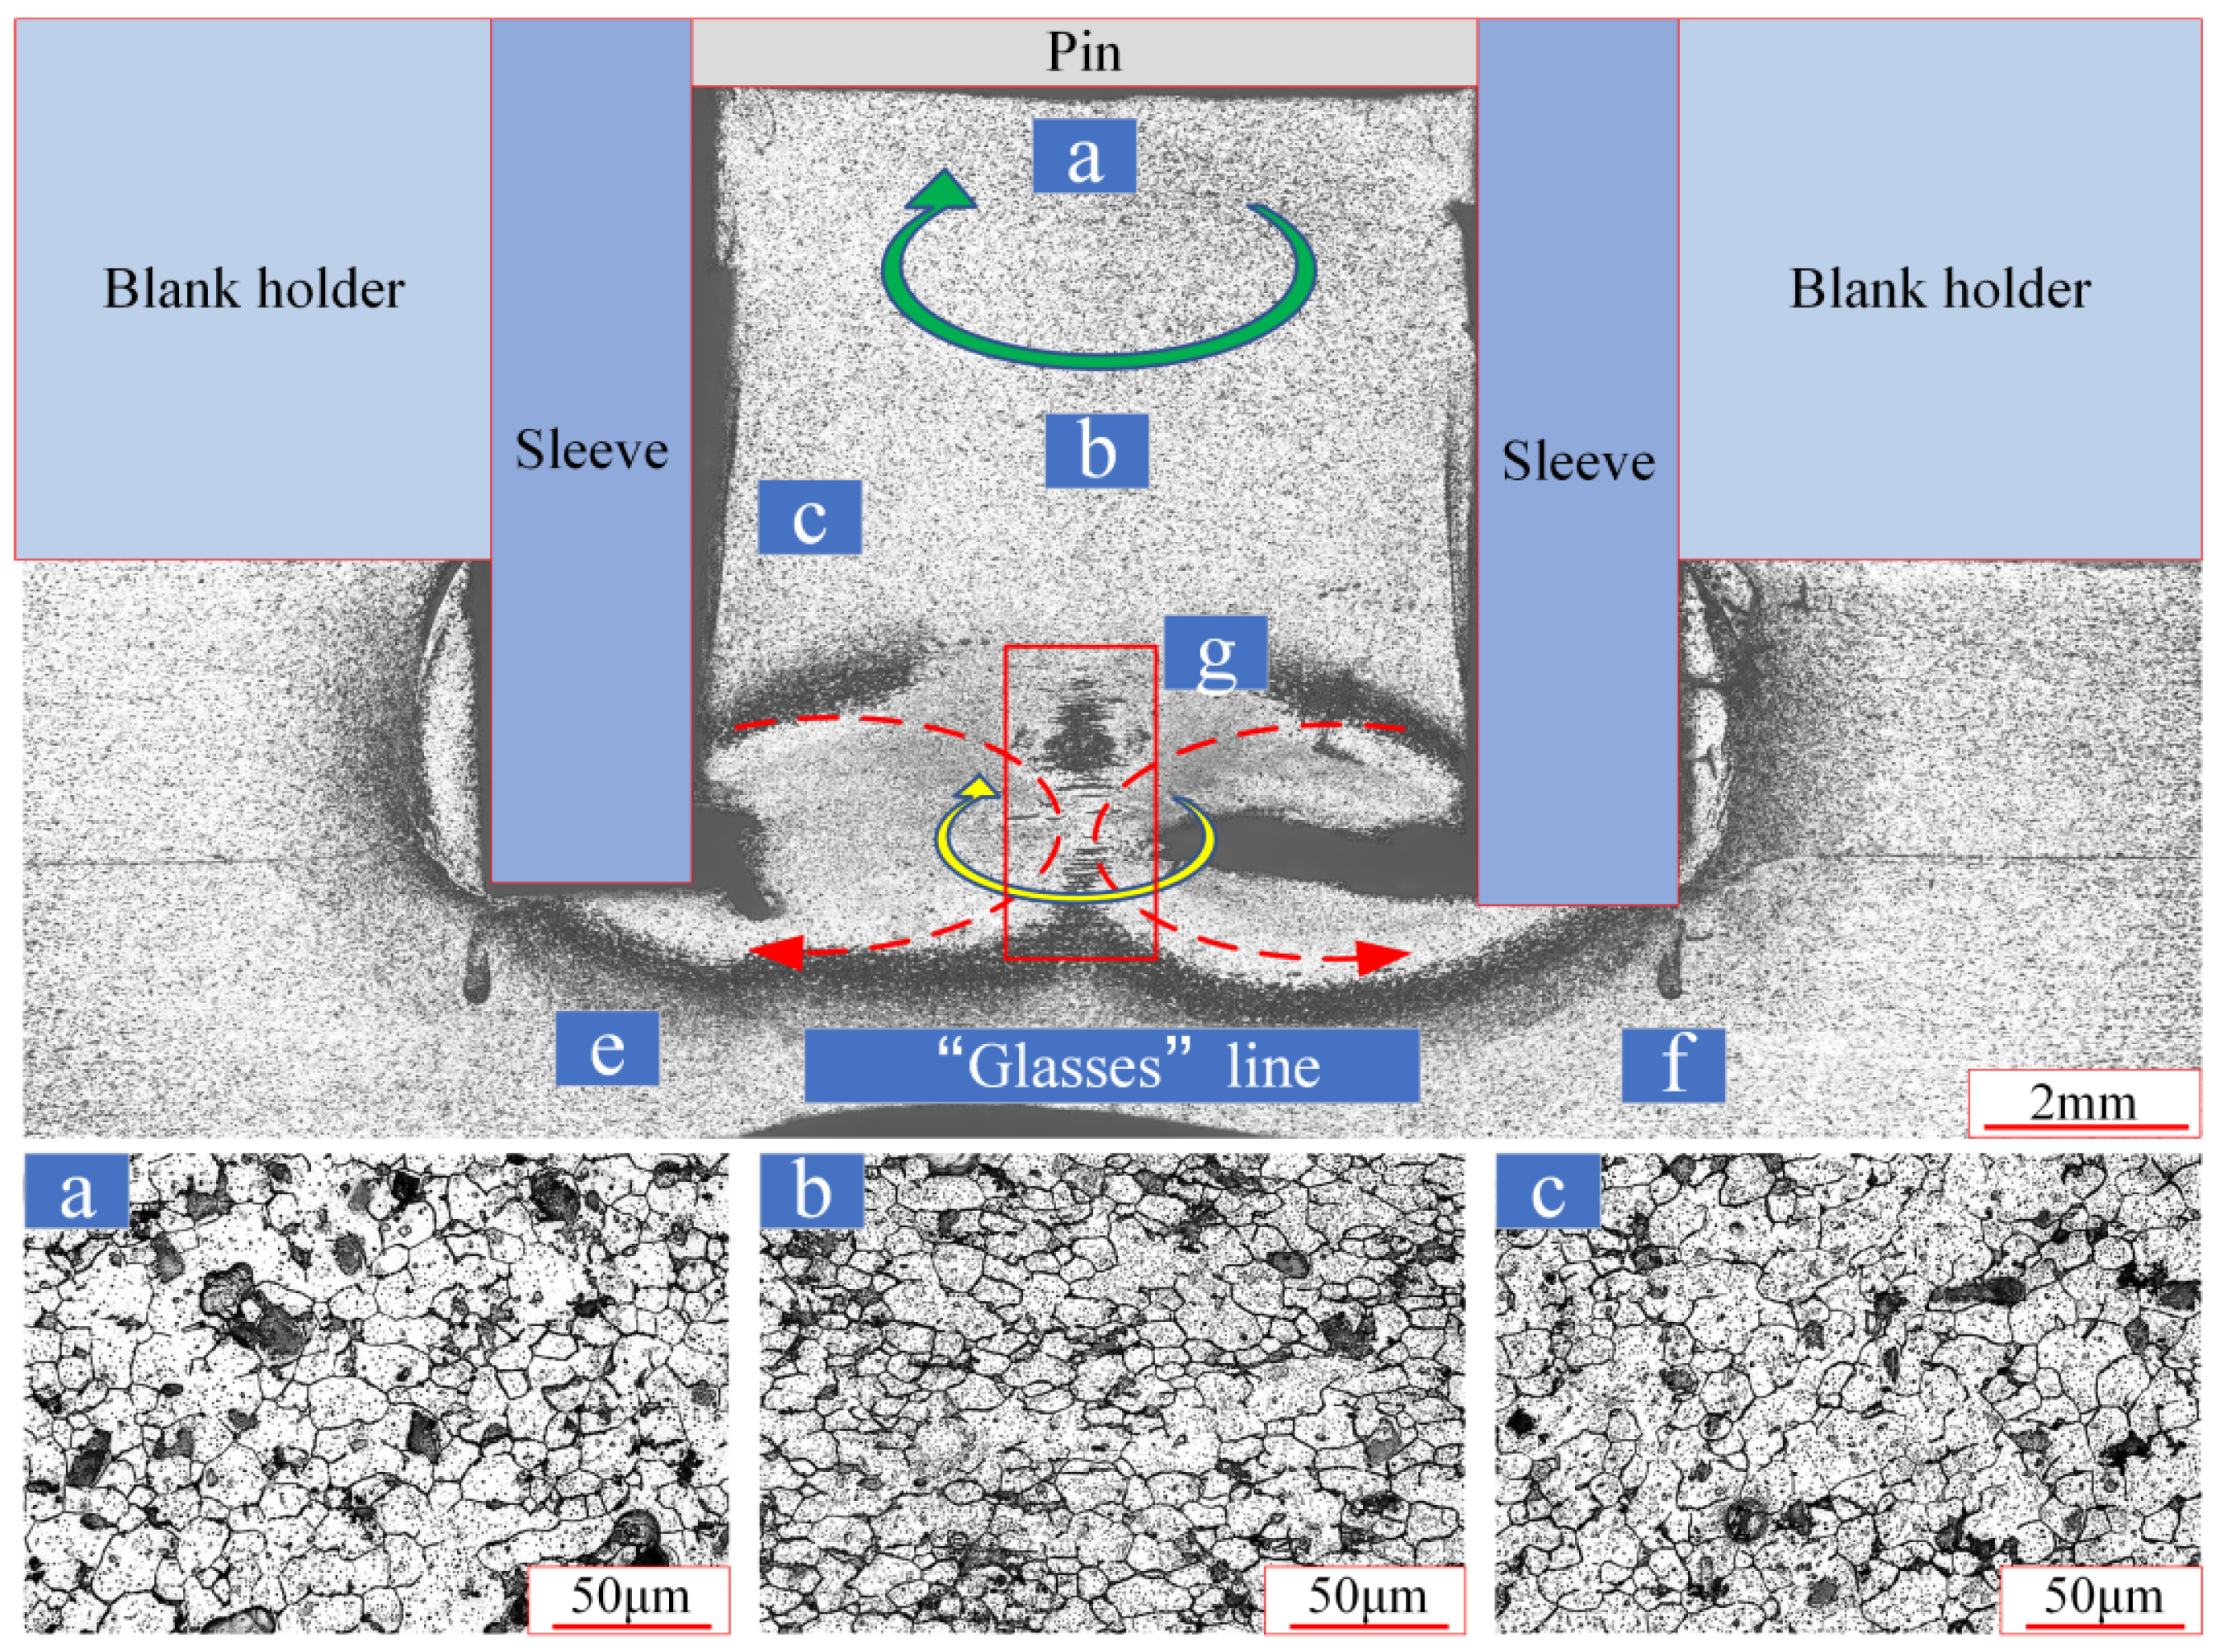
Figure 10 illustrates the morphology of the spot welding zone at a penetration depth of 2 mm. It reveals that the cavity within the stirring tool is filled with high-temperature plasticized metal. The overall appearance of the spot welding zone is characterized by a vertical convexity at the center and upward curvature on both sides. This morphology aligns closely with the strain contour diagram derived from the simulation results, as depicted in Figure 11d. This congruence suggests that the observed shape results from variations in the metallographic structure attributable to differing degrees of metal strain within the spot welding zone. The metal directly beneath the stirring tool undergoes stirring, extrusion, and fracturing, resulting in the formation of fine grains. Notably, the pin-affected zone (PAZ) directly below the stirring needle experiences the most significant displacement in the thickness direction. The edge of the PAZ, influenced directly by the stirring sleeve, exhibits pronounced grain refinement, as illustrated in Figure 11a. Although the central region of the PAZ is less directly influenced by the stirring tool, it still achieves fine-grain formation, as shown in Figure 10b. This observation indicates that the entire PAZ undergoes extensive squeezing and crushing. A distinct “M” line emerges at the base of the PAZ, represented by a red dotted line in Figure 10, which is also discernible in the horizontal velocity distribution from the simulation results, as illustrated in Figure 11b.
Integrating the data presented in Figure 11 and 
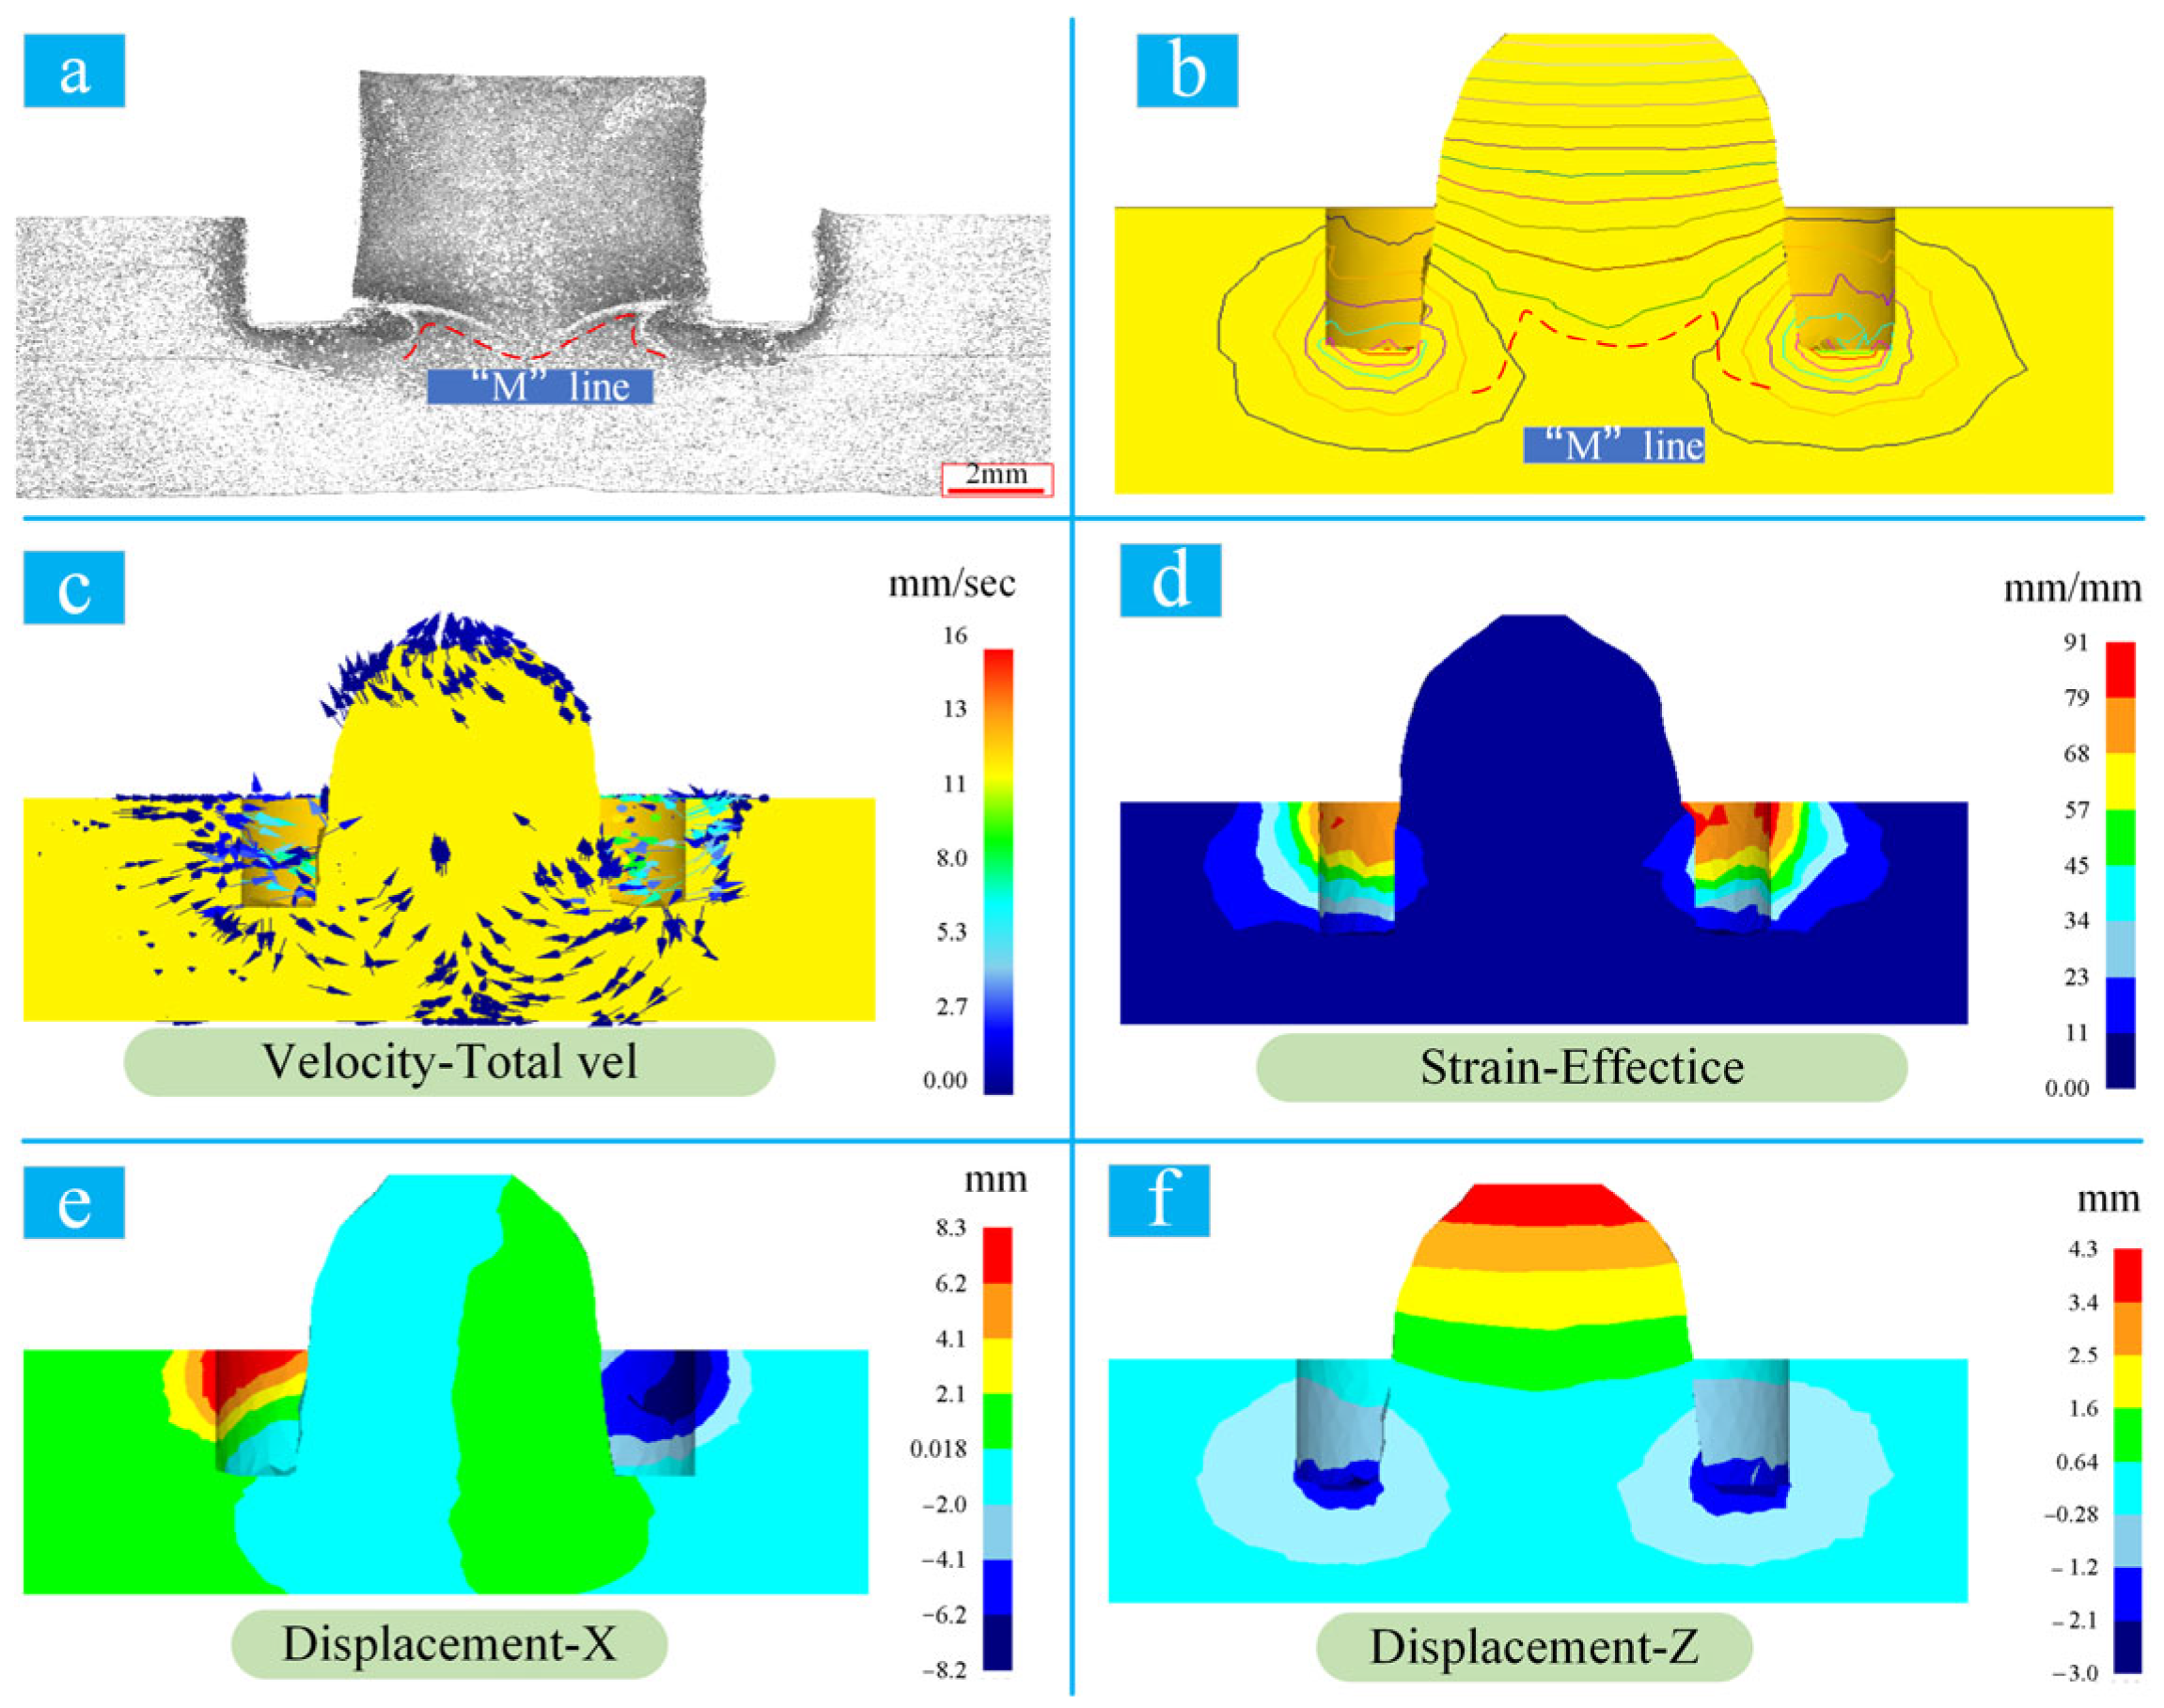
Figure 12, it becomes evident that the formation of the “M” line is attributable to significant plastic deformation of the metal, which causes a strain differential. This observation leads to the inference that the PAZ undergoes shear forces exerted by the inner side of the stirring sleeve, inducing an in situ rotational movement along its axis. This phenomenon is substantiated by Figure 11e, which distinctly illustrates that the entire spot welding zone exhibits a pronounced counter-directional movement along both flanks of the central axis. Notably, the demarcation line on the central axis of the PAZ is particularly evident. The reduced rotational speed of the metal at the base of the PAZ, resulting from its direct contact with the stirring tool, is discernible through the minimal displacement shown in Figure 12d,f. Consequently, an in situ rotational interface forms at the bottom of the PAZ, manifesting as an “M”-shaped separating line on the cross-section. This interface engenders intense shear friction in adjacent metal, thereby refining the grains in this area to the smallest size observed within the entire PAZ, as illustrated in Figure 11c.
The distinct elevation of the “M” line at its center and flanks can be attributed to the metal beneath the stirring tool, which, under the influence of high temperature and extrusion pressures, flows towards areas of lower pressure. The PAZ represents the zone of lowest pressure, resulting in substantial metal accumulation beneath it. However, the metal proximate to the inner side of the stirring sleeve is directly sheared, elevating the temperature and enhancing flow capacity. This dynamic is corroborated by Figure 6 and Figure 11c, where a substantial flow of plastically deformed metal from directly beneath the stirring sleeve to the underside of the stirring needle is observed. This area also records the highest strain rate within the PAZ, aligning with the metallographic structures depicted in Figure 11c,d. Conversely, the metal at the center of the PAZ, characterized by lower temperatures and pressures, exhibits an overall upward movement, which is further confirmed by Figure 11f, where the positive displacement values indicate upward movement. The flow dynamics, characterized by slower middle flow velocities and lower pressures juxtaposed with faster flow rates, higher temperatures, and pressures on the flanks, culminate in the formation of the “M” line. This configuration aligns perfectly with the morphology of the plastic metal flow lines depicted in Figure 12b, thereby validating the accuracy of the simulation model during the penetration stage.
As the stirring sleeve progressively penetrates the lower plate, the morphology of the spot welding zone remains relatively unchanged. However, the grain refinement in the PAZ adjacent to the stirring sleeve is notably more pronounced than in the central region of the PAZ, as evidenced by Figure 13a–c. This observation suggests that the direct interaction with the stirring tool significantly enhances shear forces, thereby facilitating grain refinement. In 
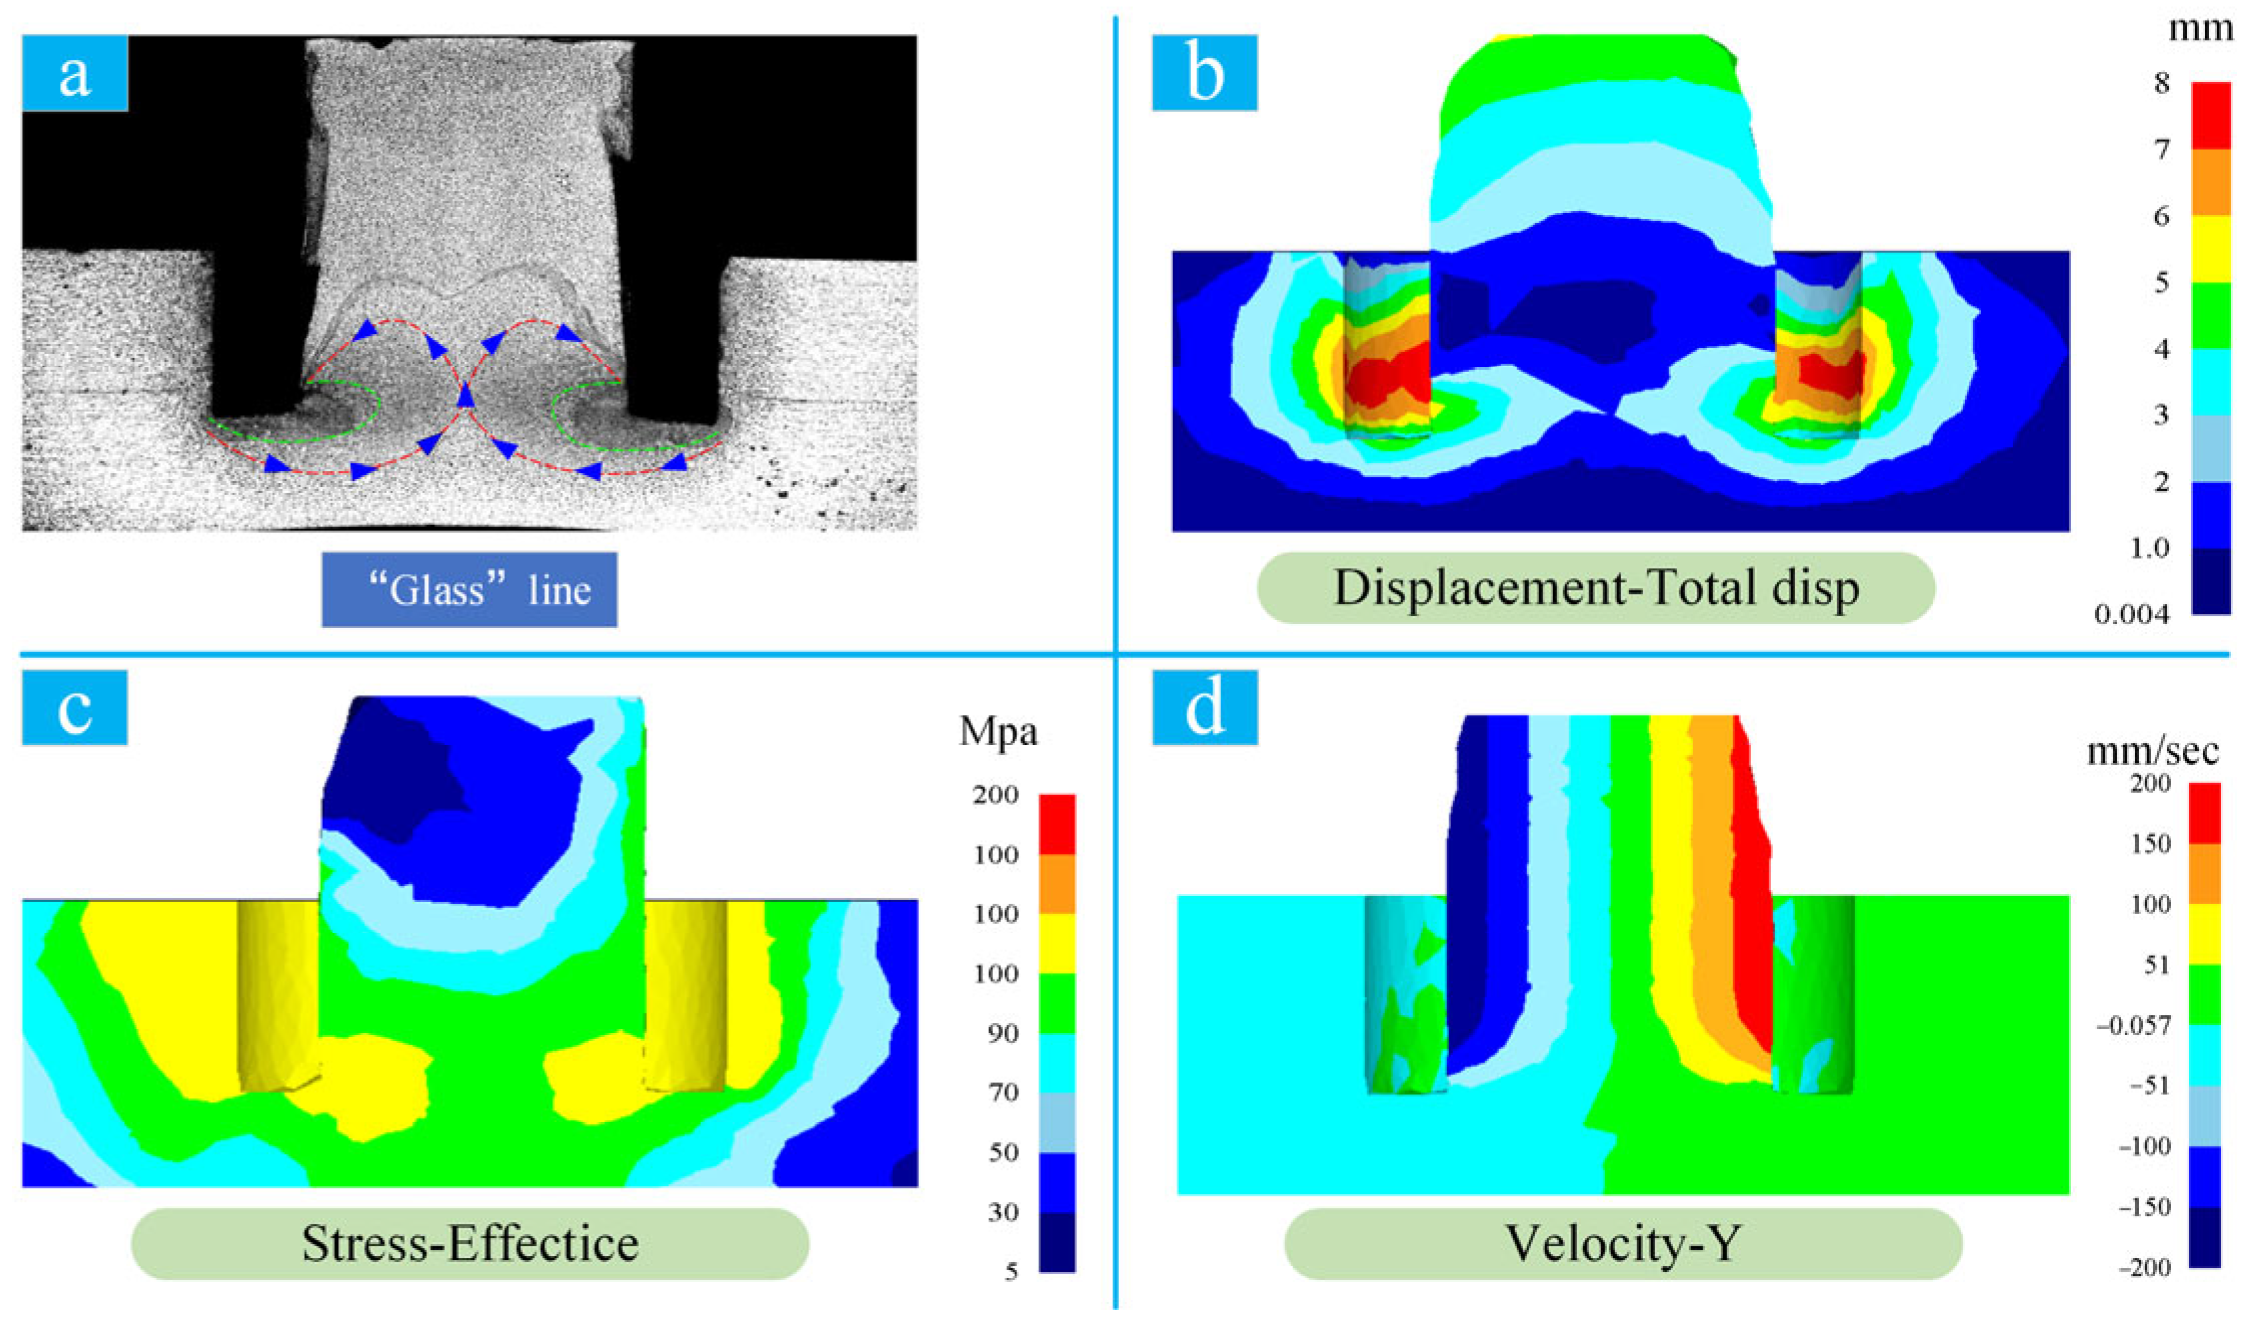
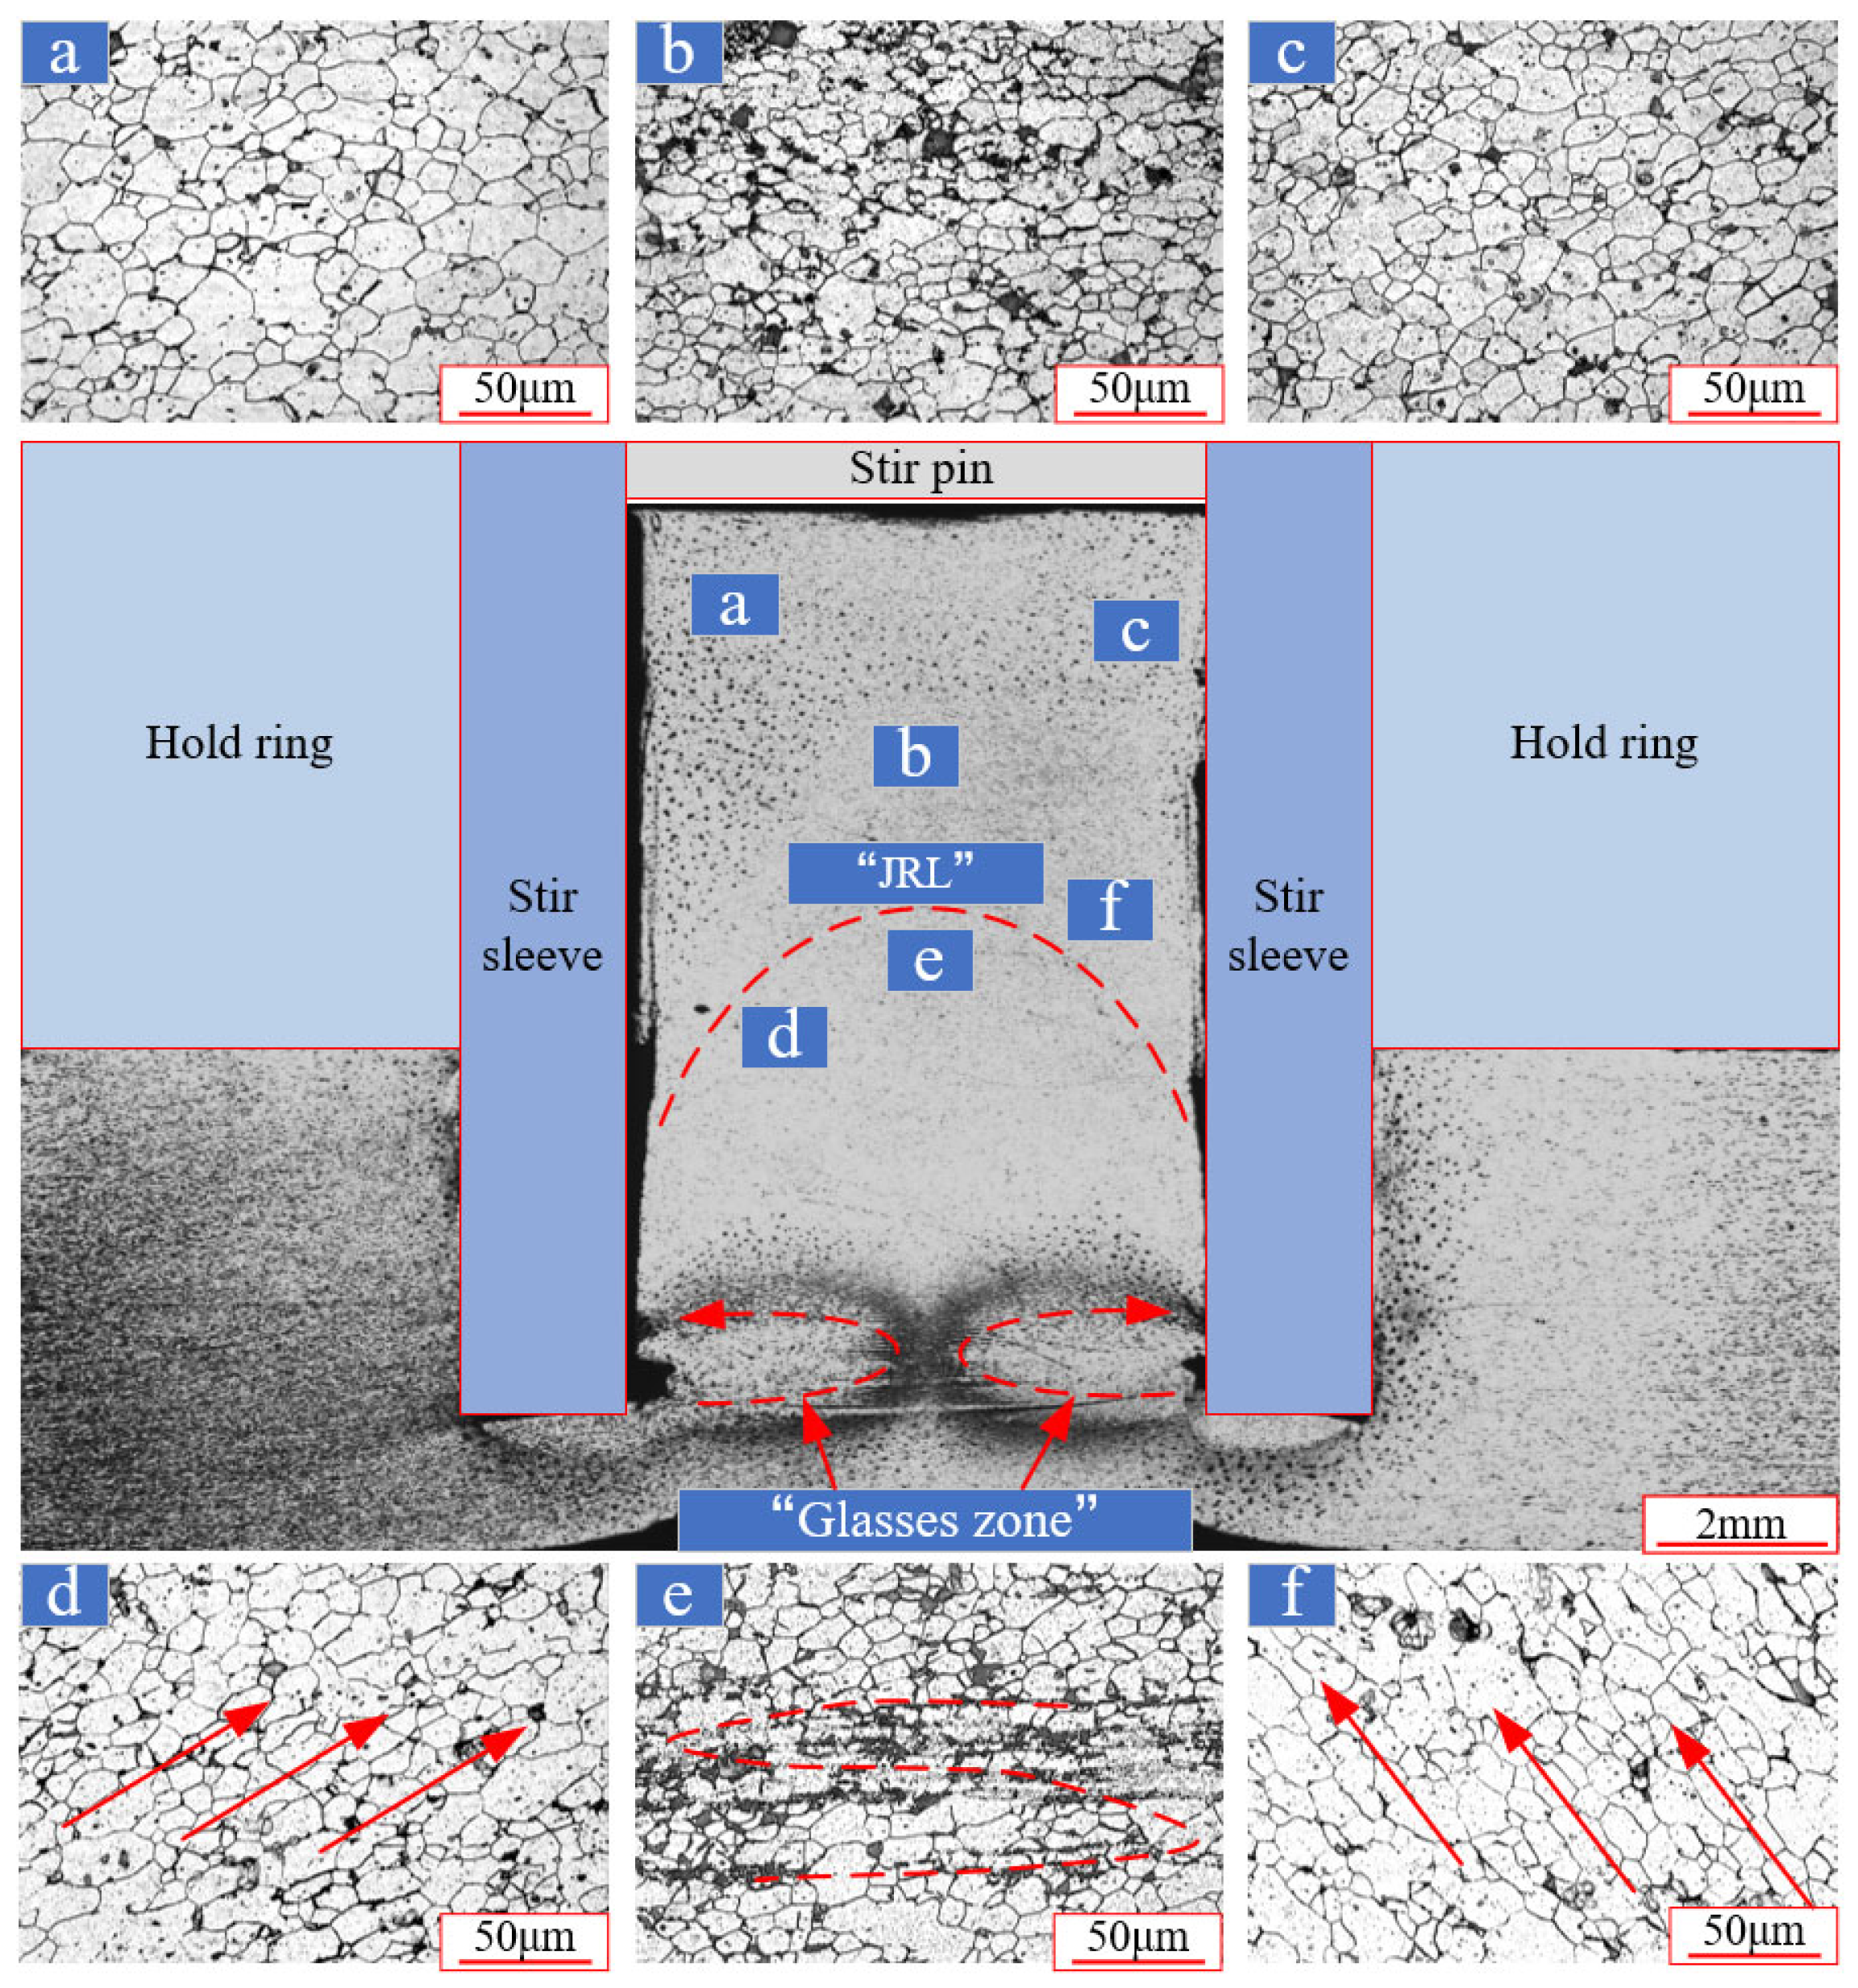
Figure 11, the “M” line gradually transitions into a “glass zone,” which exhibits a contour resembling that of eyeglasses. This transformation occurs as both the penetration depth and the ambient temperature increase; Figure 14 illustrates the specific characteristics of this zone.
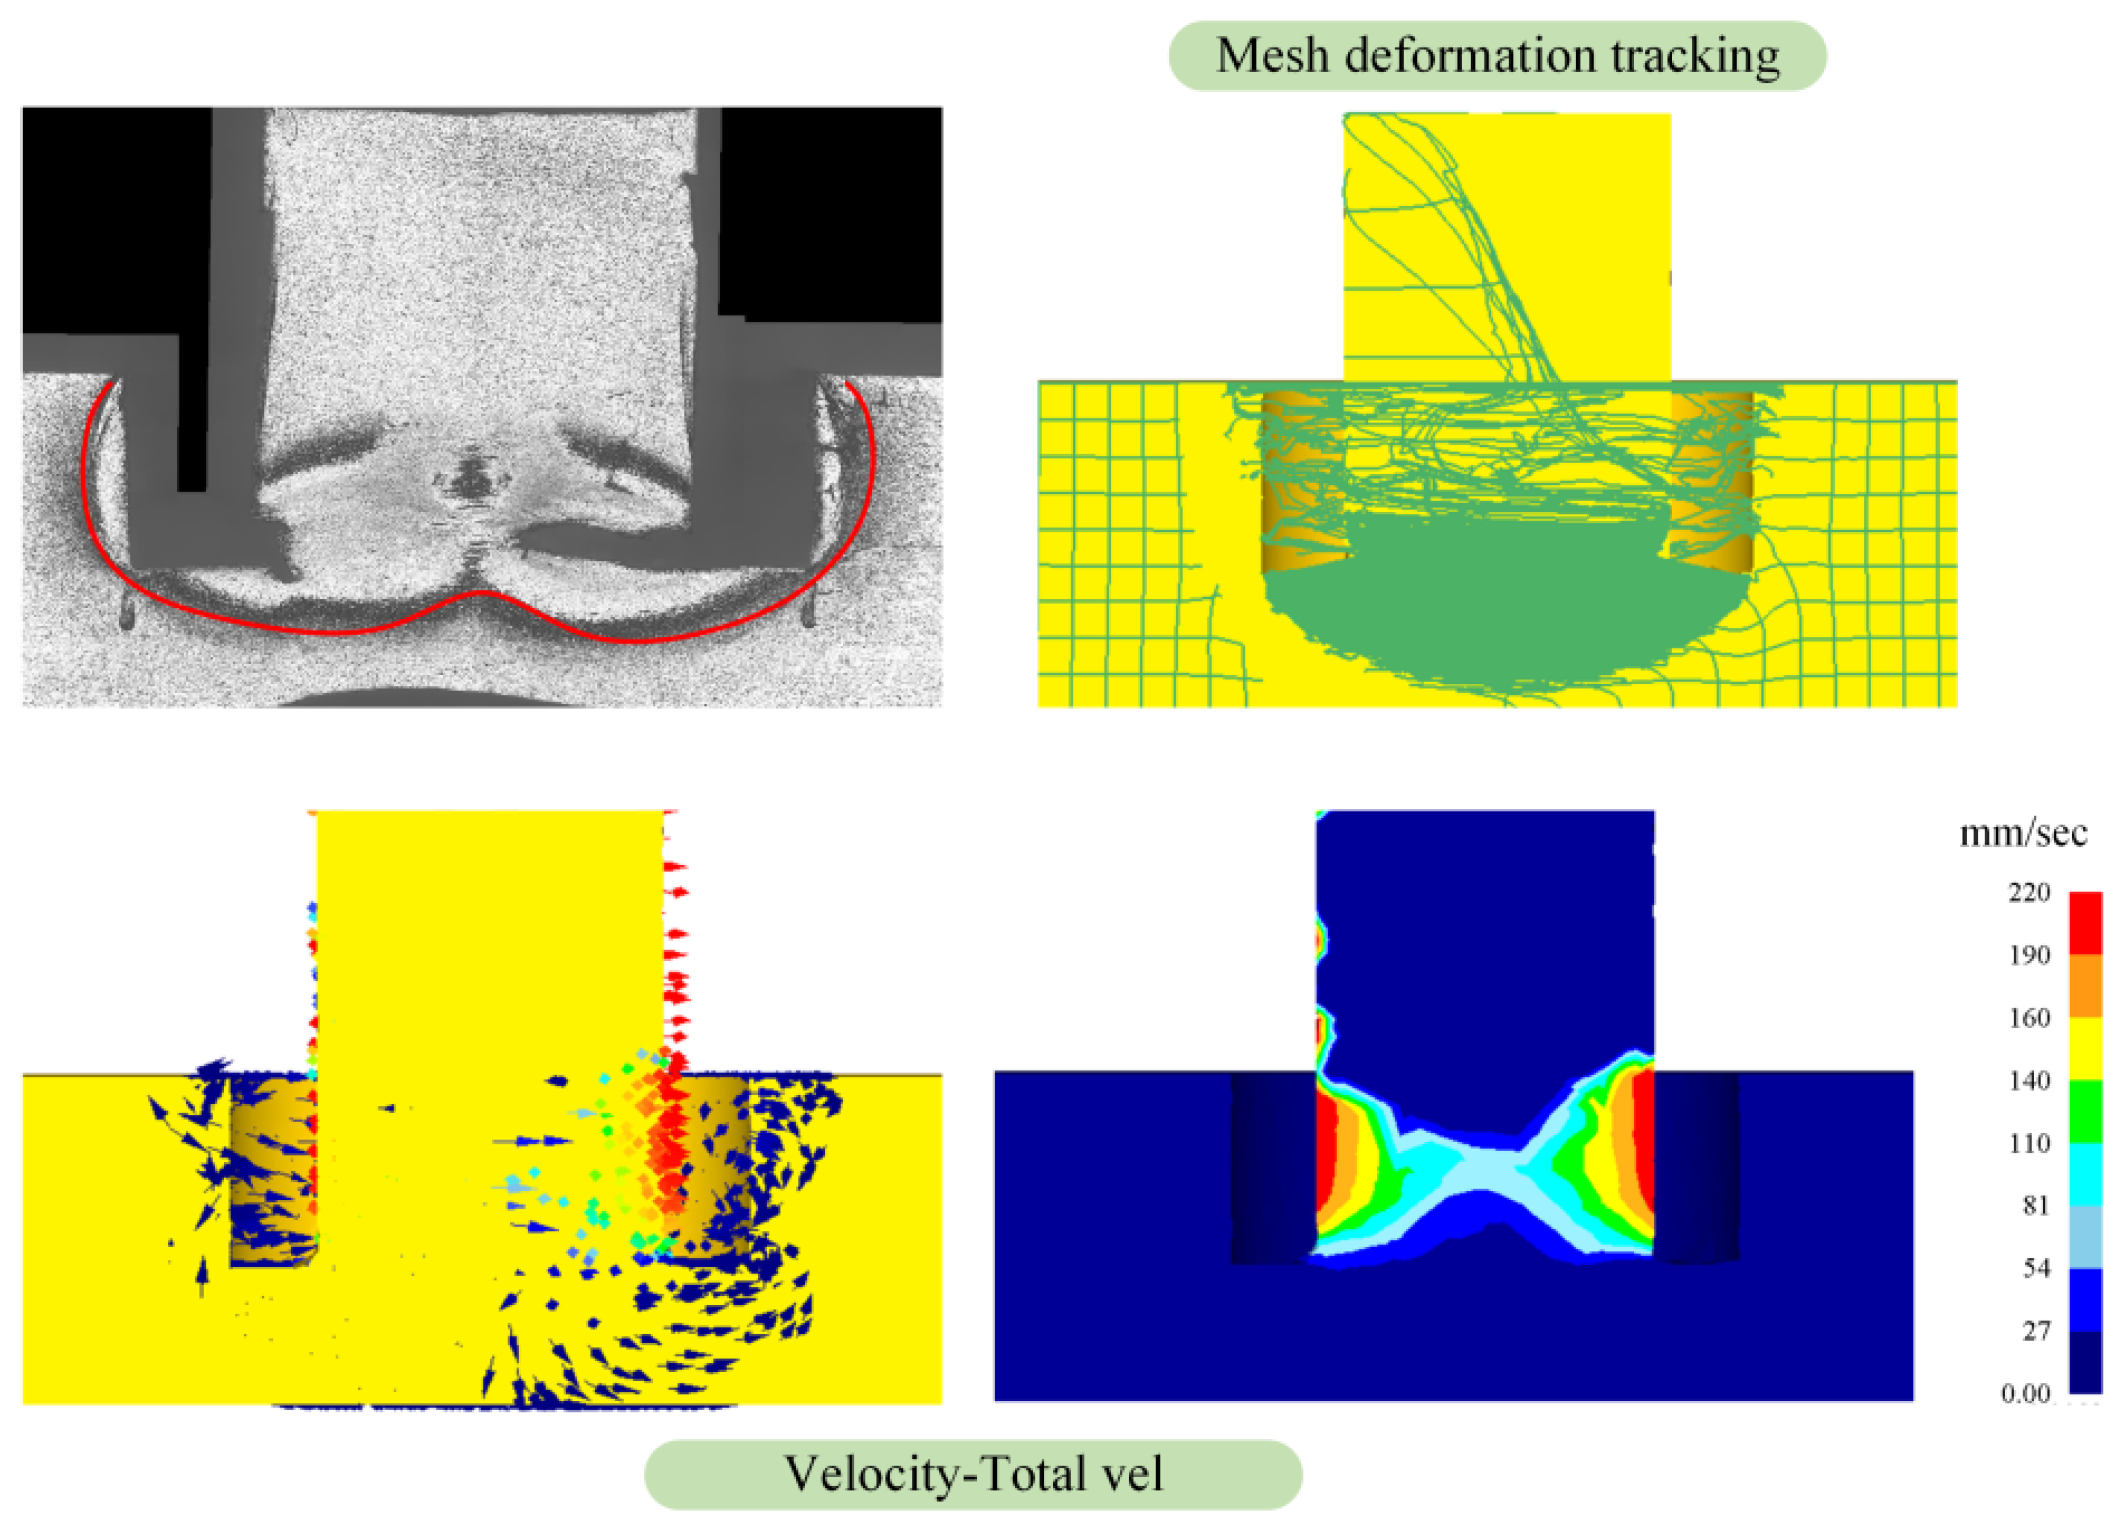
The “glass zone” is also discernible in the displacement contour depicted in Figure 14b. This zone represents a flow area where the metal, having undergone substantial displacement, is located within the spot welding zone. Similarly, the “spectacle zone” is visible in the pressure contour of Figure 14c, where it forms because of the increased pressure exerted by the metal in the spot welding zone. The velocity contours along the central axis of the spot welding zone, as shown in Figure 14d, reveal that the velocities on either side are markedly divergent, corroborating the in situ rotational dynamics previously described; the positive and negative values indicate the respective directions of these velocities.
Upon analyzing both the metallographic structures and the simulation results, it appears that the emergence of the “glass zone” is attributable to the flow of plasticized metals subjected to high temperatures, pressures, and displacements near the stirring tool. This process is fundamentally similar to that observed with the “M” line. The divergence in morphology between these two zones arises because, at this stage, the quantity of plasticized metal experiencing high temperature, pressure, and displacement increases substantially, prompting an extensive flow of such metals into the PAZ, which then transitions from the “M” line to the “glass zone”. The flow directions to the left and right of the “glass zone” are opposed, with the left side moving counterclockwise and the right side moving clockwise. This flow initiates directly beneath the exterior of the stirring sleeve and terminates at a specific elevation on the interior bottom side of the mixer sleeve, as indicated by the red line in Figure 14a and depicted by the blue arrow. This distinctive mode of plastic metal flow causes the demarcation line between the upper and lower plates to gradually ascend within the PAZ, forming an “M”-shaped Joint Residual Line (JRL), as depicted in Figure 13, with its specific morphology detailed in Figure 14.
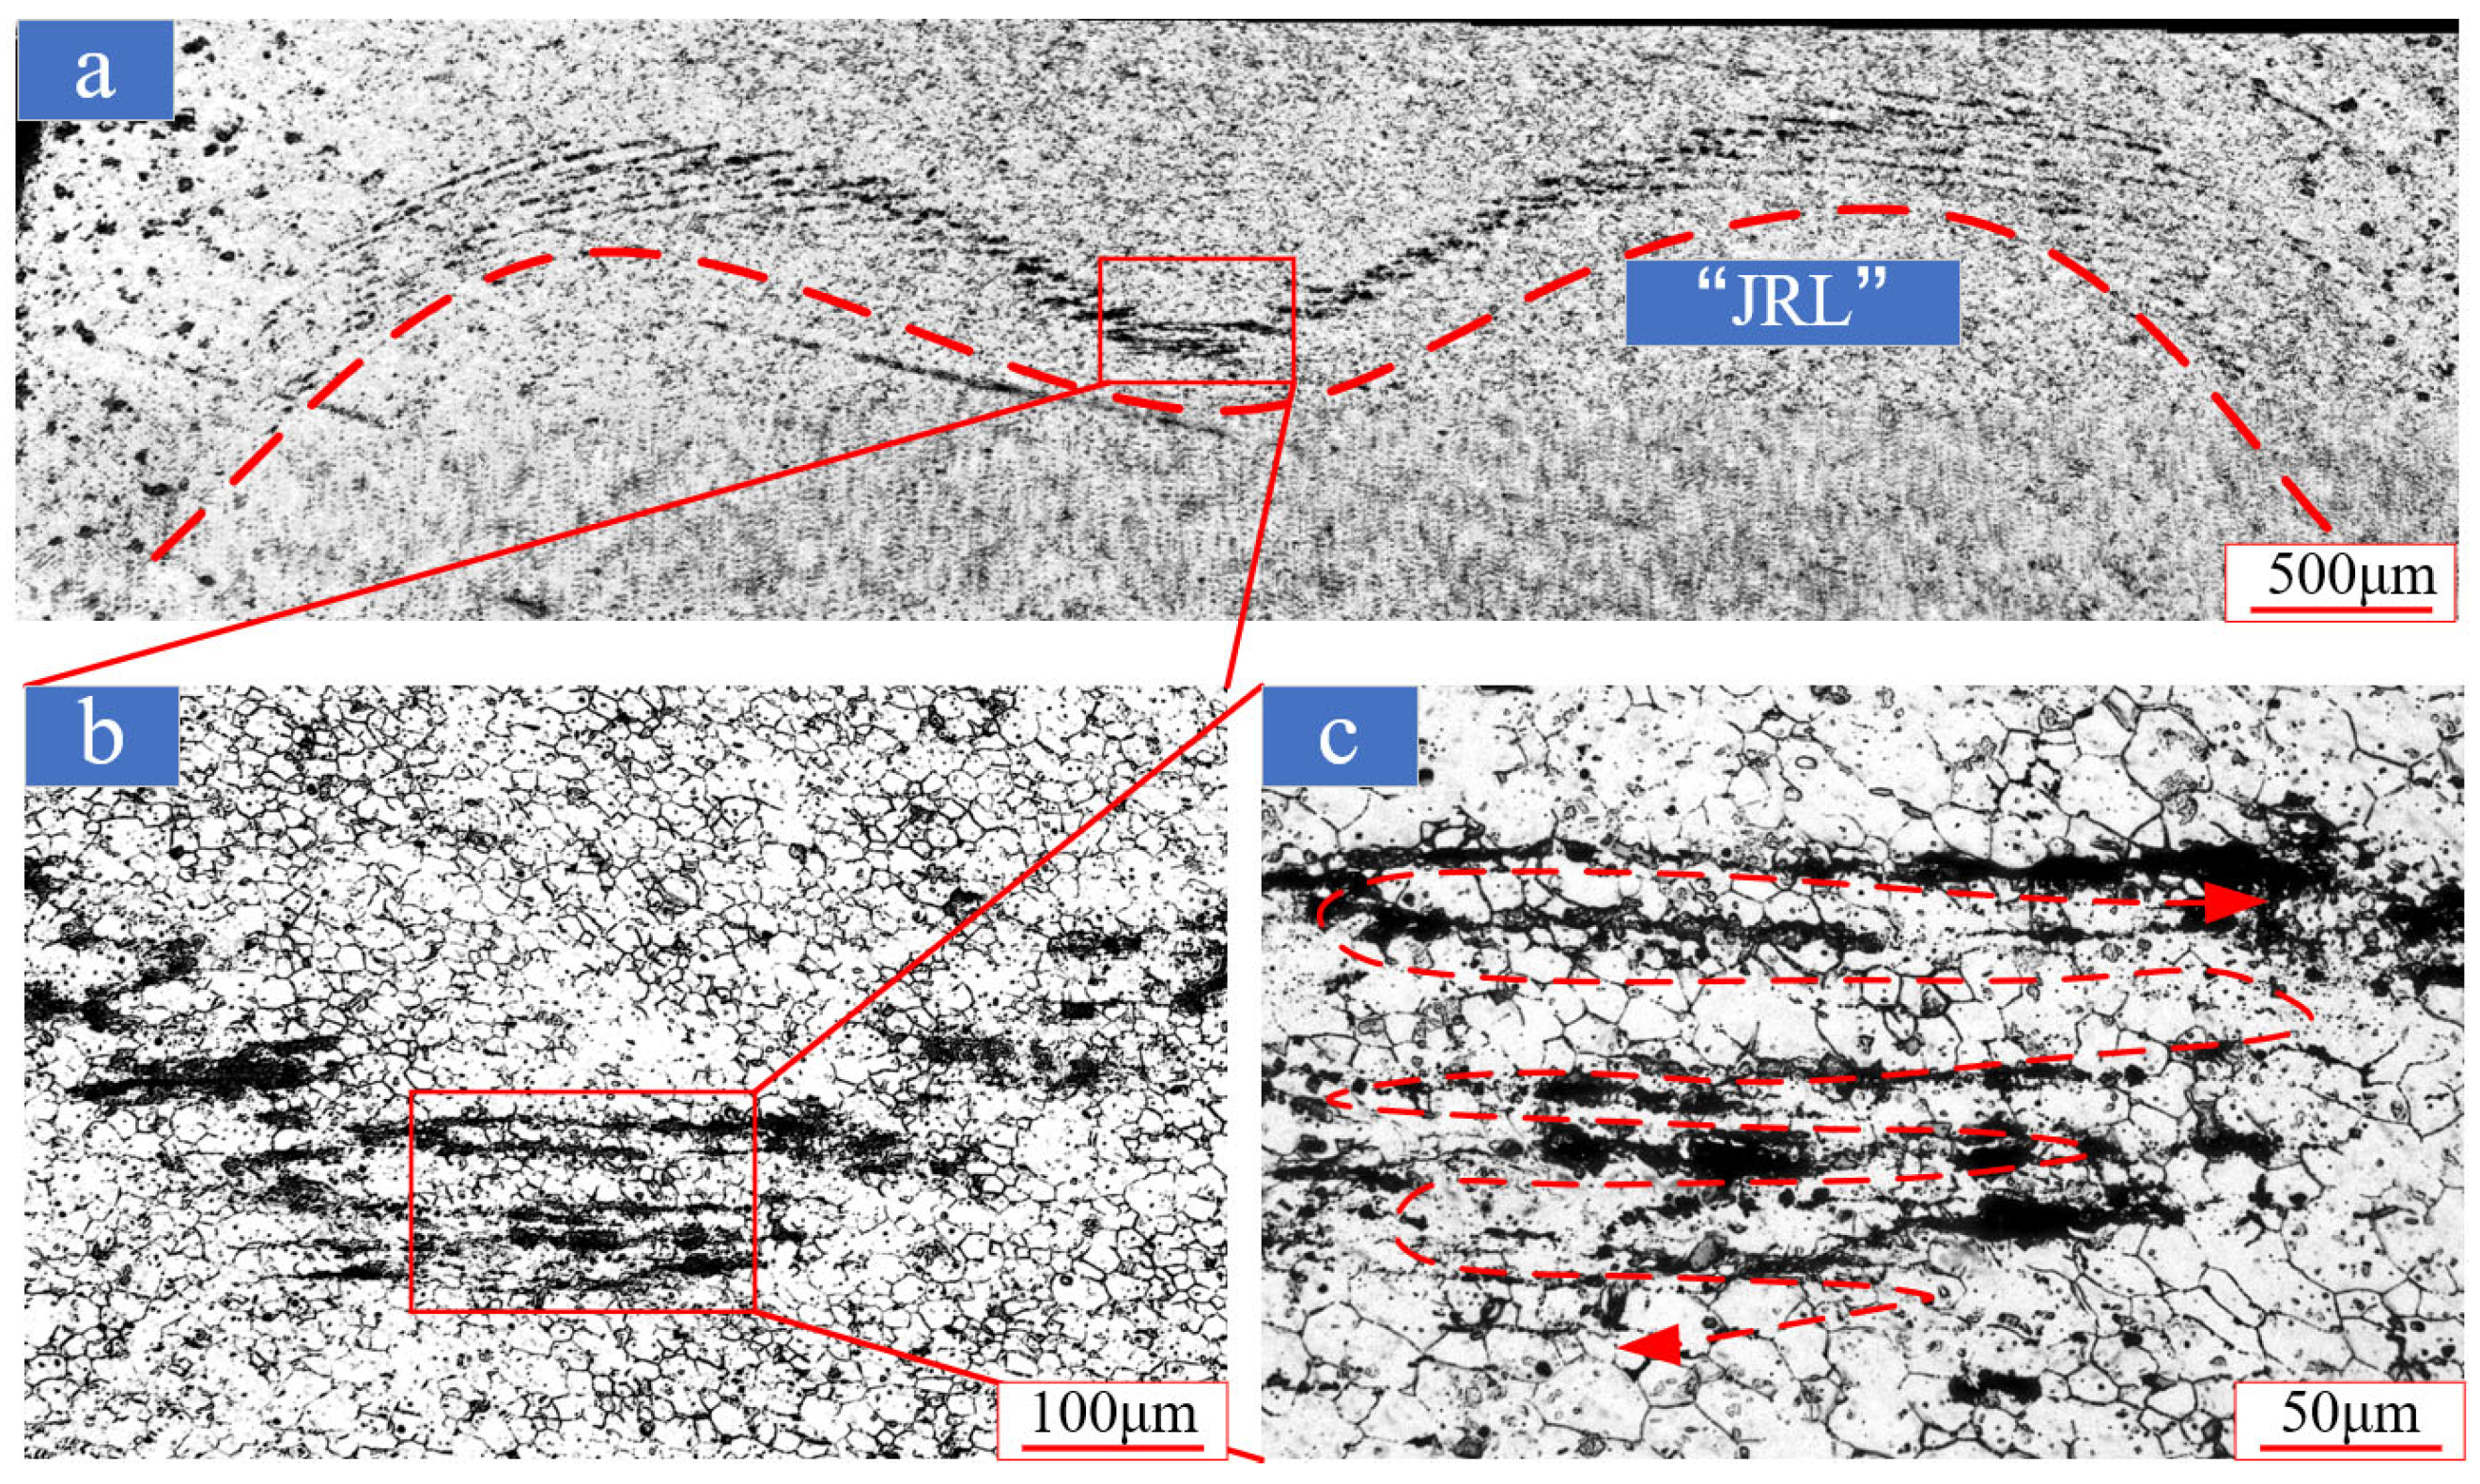
The formation of the JRL is intricately linked to the metal flow dynamics within the spot welding zone. The observed black lines in the metallographic structure are attributable to the presence of an oxide film with a high melting point on the surface of the spot-welded plate. This film undergoes corrosion and subsequently peels off upon exposure to metallographic etchants, resulting in the formation of corrosion pits and a blackened appearance [27]. Within the JRL, particularly noticeable in the central depression, a distinct spiral trajectory is evident, as illustrated in Figure 15b,c. This pattern indicates that during the penetration stage, the metal at the interface of the upper and lower plates undergoes a spiraling motion, concurrently refining the surrounding grains. This observed phenomenon correlates well with the spatial trajectories of tracer points depicted in Figure 9 and Figure 10, thereby corroborating the accuracy of the simulation model.
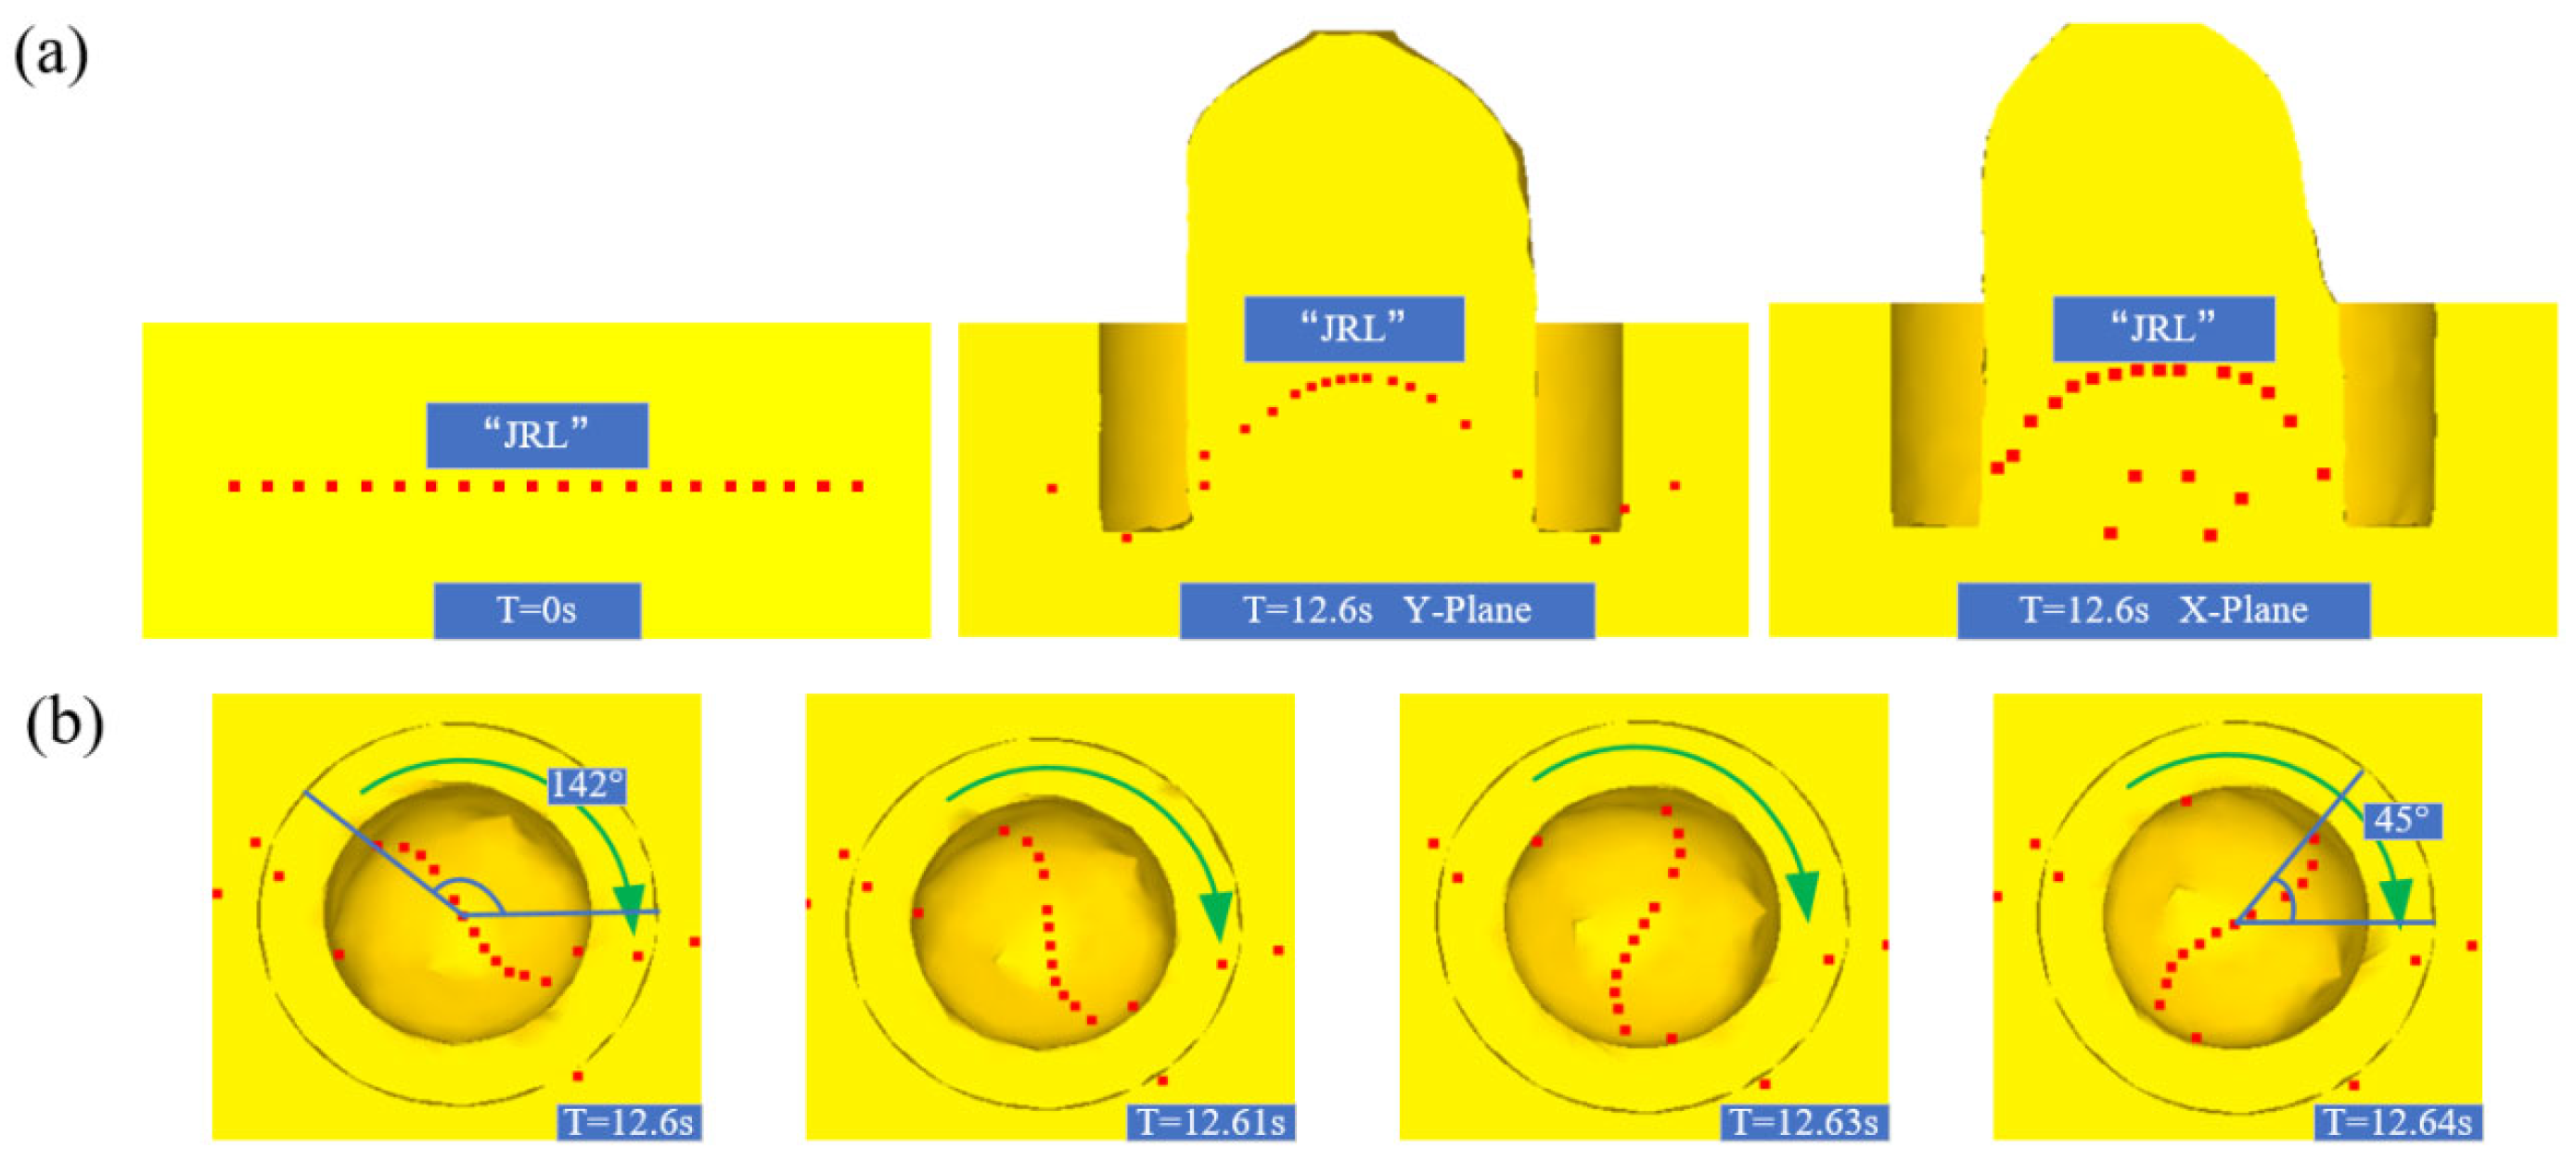
Discrete particles were utilized along the interface between the upper and lower plates for displacement tracing rather than using the dividing lines themselves. During the dwell stage, these particles displayed a “parabolic” shape in both the X and Y planes, aligning closely with the experimental findings, as illustrated in Figure 16a. In the Z-plane, the particle distribution formed a continuous rotating wavy line, consistent with the direction of the stirring tool, as depicted in Figure 16b. These lines rotated 97° in 0.04 s at a rotational speed of approximately 405 rpm, which is notably slower than the stirring tool’s speed of 1600 rpm. This indicates that the spot welding zone rotates as a unified entity and experiences relative shear slip with respect to the stirring tool. Figure 16 elaborates on the stress–strain relationships and displacement characteristics at this stage. The displacement contour distribution remains fundamentally similar to that observed during the penetration stage. However, the displacement contours near the stirring needle predominantly exhibit a “parabolic” shape, as shown in Figure 17a. The “glass zone” continues to be the region subjected to the highest pressure and strain, with the maximum pressure values significantly elevated, as demonstrated in Figure 17b,c. Moreover, the overall in situ rotational velocity during this stage is higher than that in the penetration stage, attributable to the elevated temperatures, as shown in Figure 17d. It is observed that the “glass zone” diminishes as the temperature increases and the spot welding zone becomes fully filled, with no significant metal flow into the PAZ. This observation confirms the underlying mechanism for the formation of the “glass zone”. Despite this, the stirring tool continues to rotate in situ with the metal, resulting in increased internal pressure and accelerated rotation.

3.4. Results of the Dwell Stage

To corroborate the simulation results discussed previously, the microstructural observations from the dwell stage are presented in Figure 18. During this stage, the stirring tool rotates at high speed without axial movement. The micrographs in Figure 18a,b illustrate that the grains proximal to the stirring tool do not exhibit significant refinement. Conversely, as depicted in Figure 18c, the grains in the central region of the spot weld are noticeably more refined. This suggests that while the interior of the stirring tool is completely filled, preventing metal inflow from outside, the influence of the stirring tool on the nearby area stabilizes, leading to a relatively unchanged degree of grain refinement. Nonetheless, because of the low central pressure and elevated peak temperature in the spot welding zone, the grains continue to experience substantial compression and fracturing from the surrounding high-pressure metal. At this stage, the morphology of the “JRL” line transitions from an “M” shape, observed during the piercing stage, to a “parabolic” shape, as indicated by the red dotted line in Figure 18. This transformation substantiates the simulation findings that there is no significant axial motion of the metal adjacent to the stirring sleeve, while the metal at the center is still driven upward by pressure, causing an increase in the height of the “JRL” line’s center and altering its shape to a parabolic form. The center of this “parabola” is also characterized by a spiral formation, as shown in Figure 18e. The grain orientation on both sides aligns tangentially and curves towards the center, elucidating the formation of the “parabola”, as evidenced in Figure 18d,f.
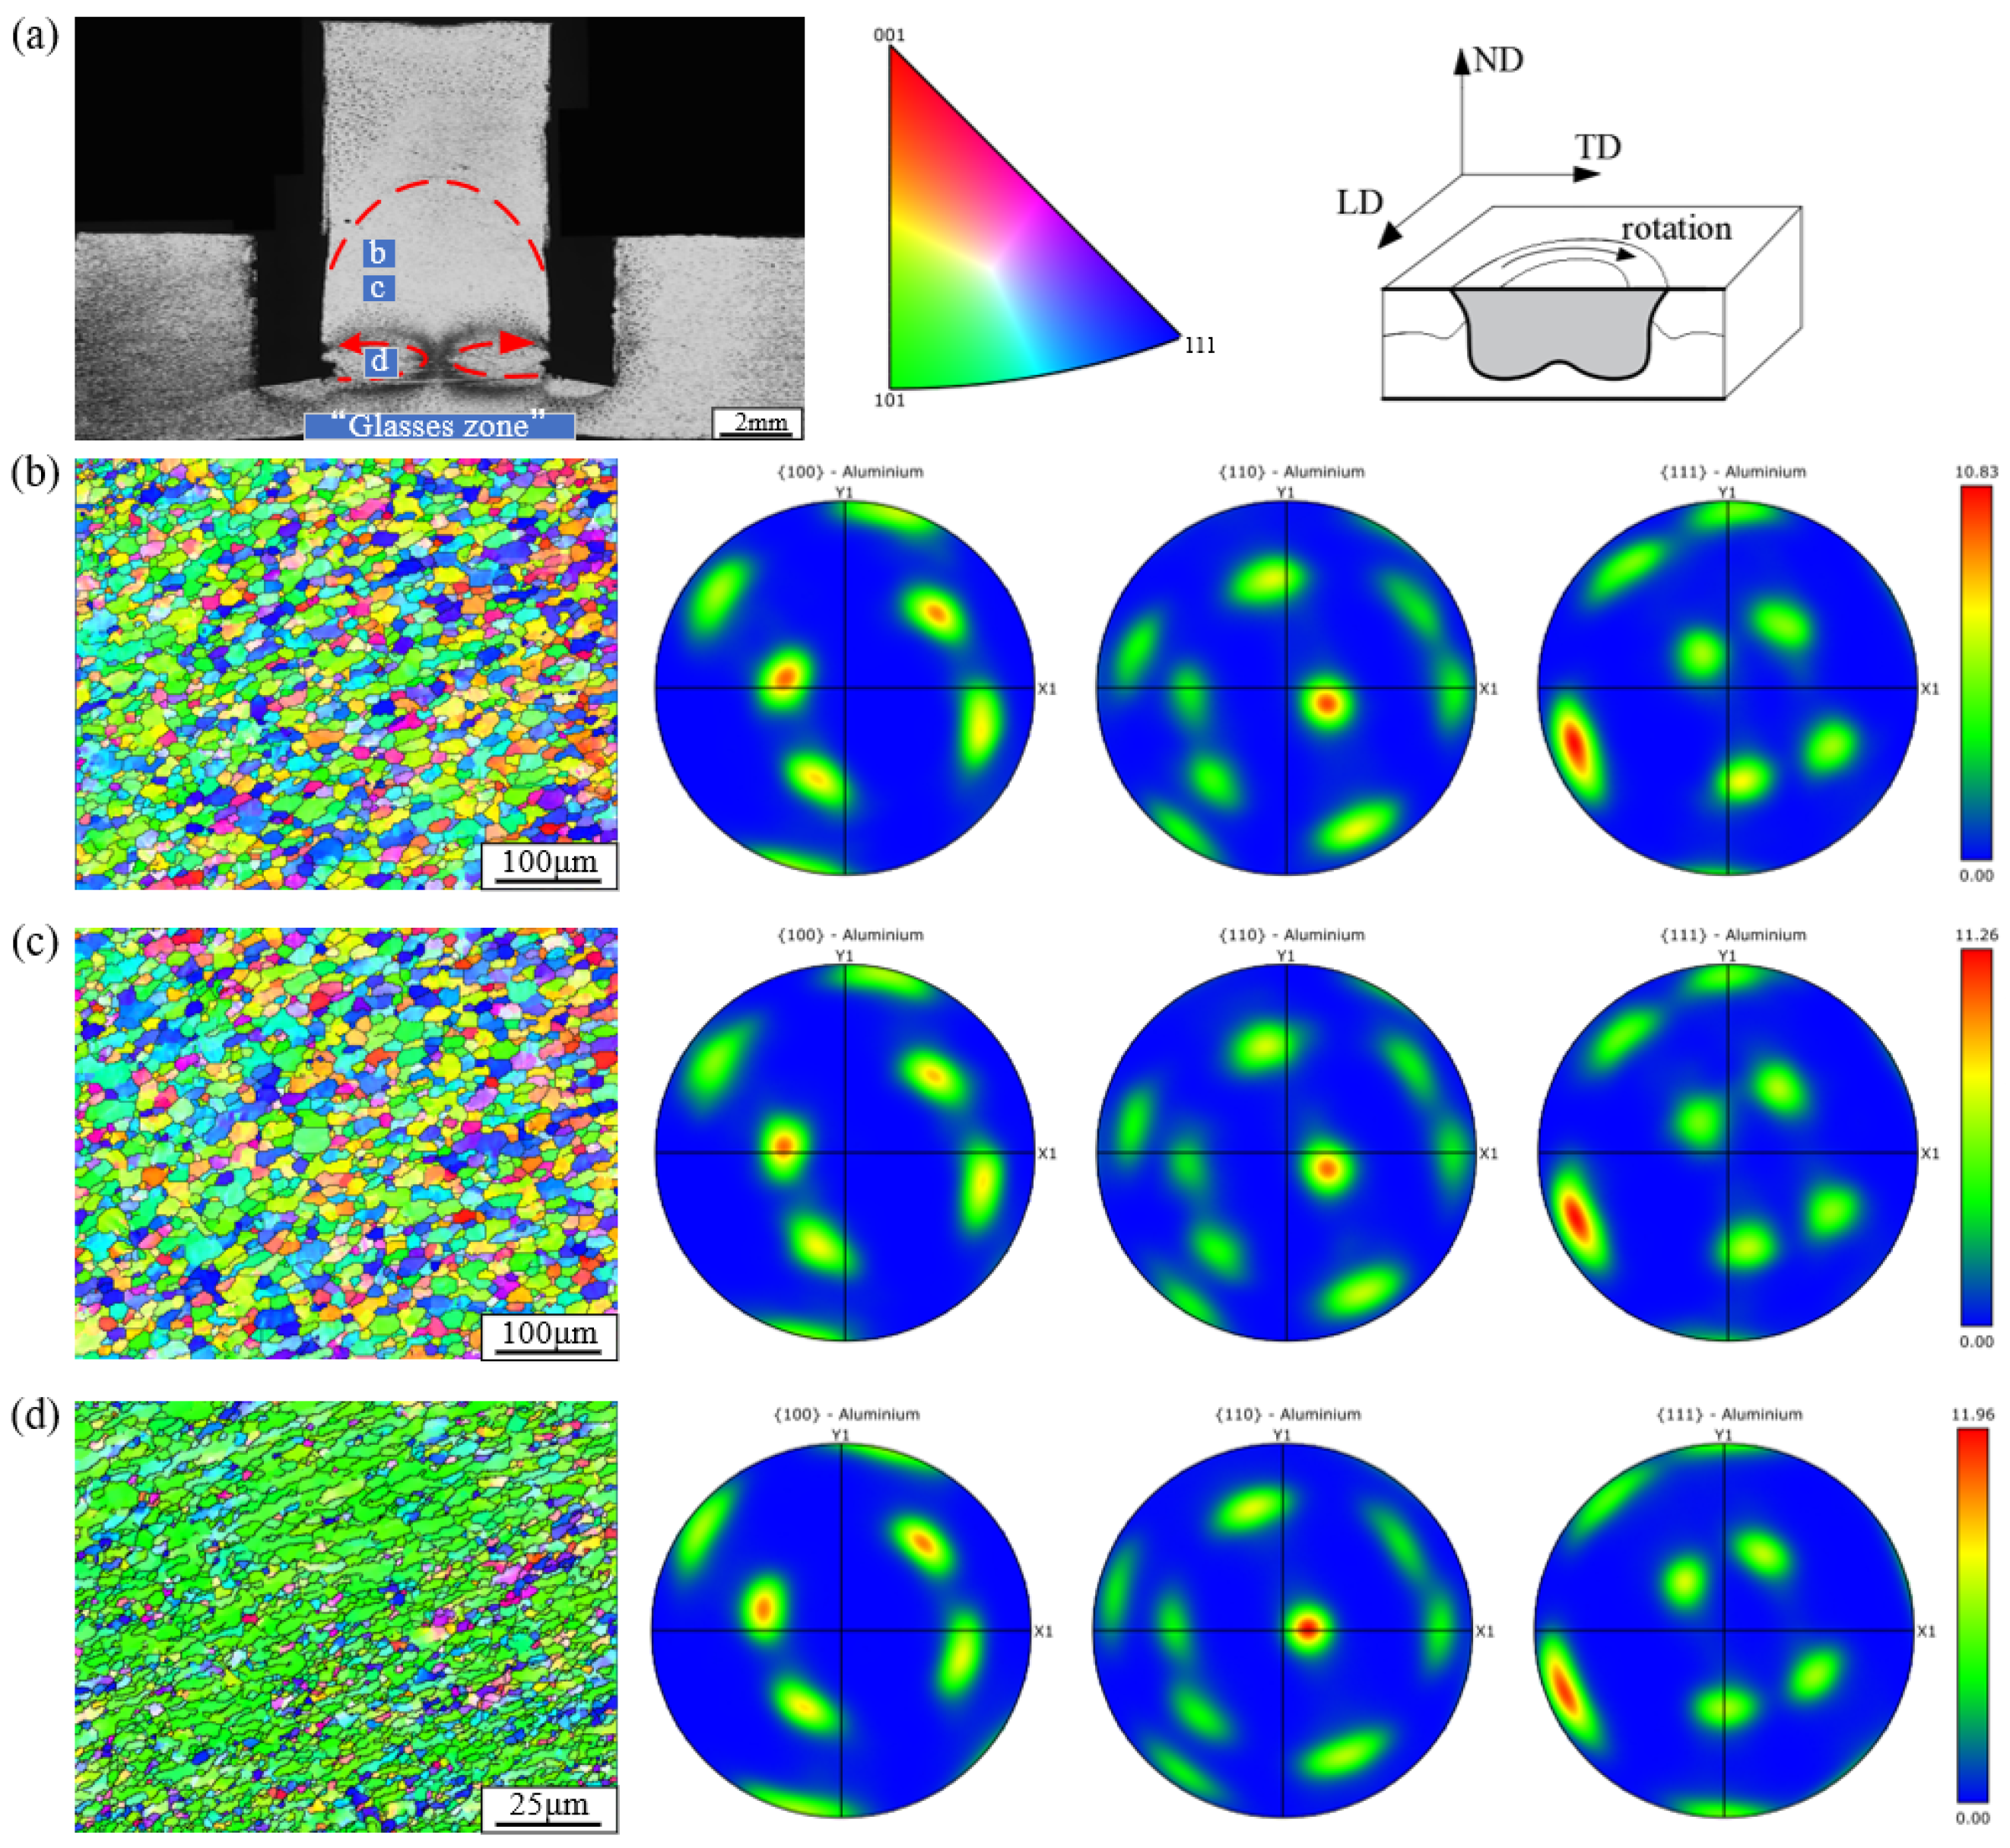
Figure 19 displays the grain distribution status of the actual spot welding zone. The average grain size within the “glass zone” measures approximately 4.2 μm, and the average grain size on the upper side of the “spectacle zone” is about 25 μm, as demonstrated in Figure 19b,c. Analyzing the grain texture orientation, the “spectacle zone” exhibits a consistency with the surrounding grain orientations, with a slightly higher orientation intensity. This consistency further supports the hypothesis that the formation of the “spectacle zone” results from the creation of very small grains under the influence of higher pressure and intense shear. Additionally, the uniformity of grain texture orientation reinforces the conclusion that a complete in situ rotation occurs at this juncture.

3.5. Results of the Refilling Stage

Upon the conclusion of the dwell stage, the process transitions into the refilling stage. Because of the insertion of the stirring tool into the lower plate during the preceding stationing stage, the refilling commences from the lower plate. A detailed analysis of the simulation results, as depicted in Figure 20, reveals that the flow direction of the plastically deformed metal near the “glass zone” reverses compared to the penetration stage. This reversal is attributed to the downward pressure exerted by the stirring needle, which forces the plastically deformed metal within the stirring tool to flow outward along the “glass zone” and fill the cavity created by the elevation of the stirring sleeve. This observation further corroborates the previously described characteristics of the “glass zone”.
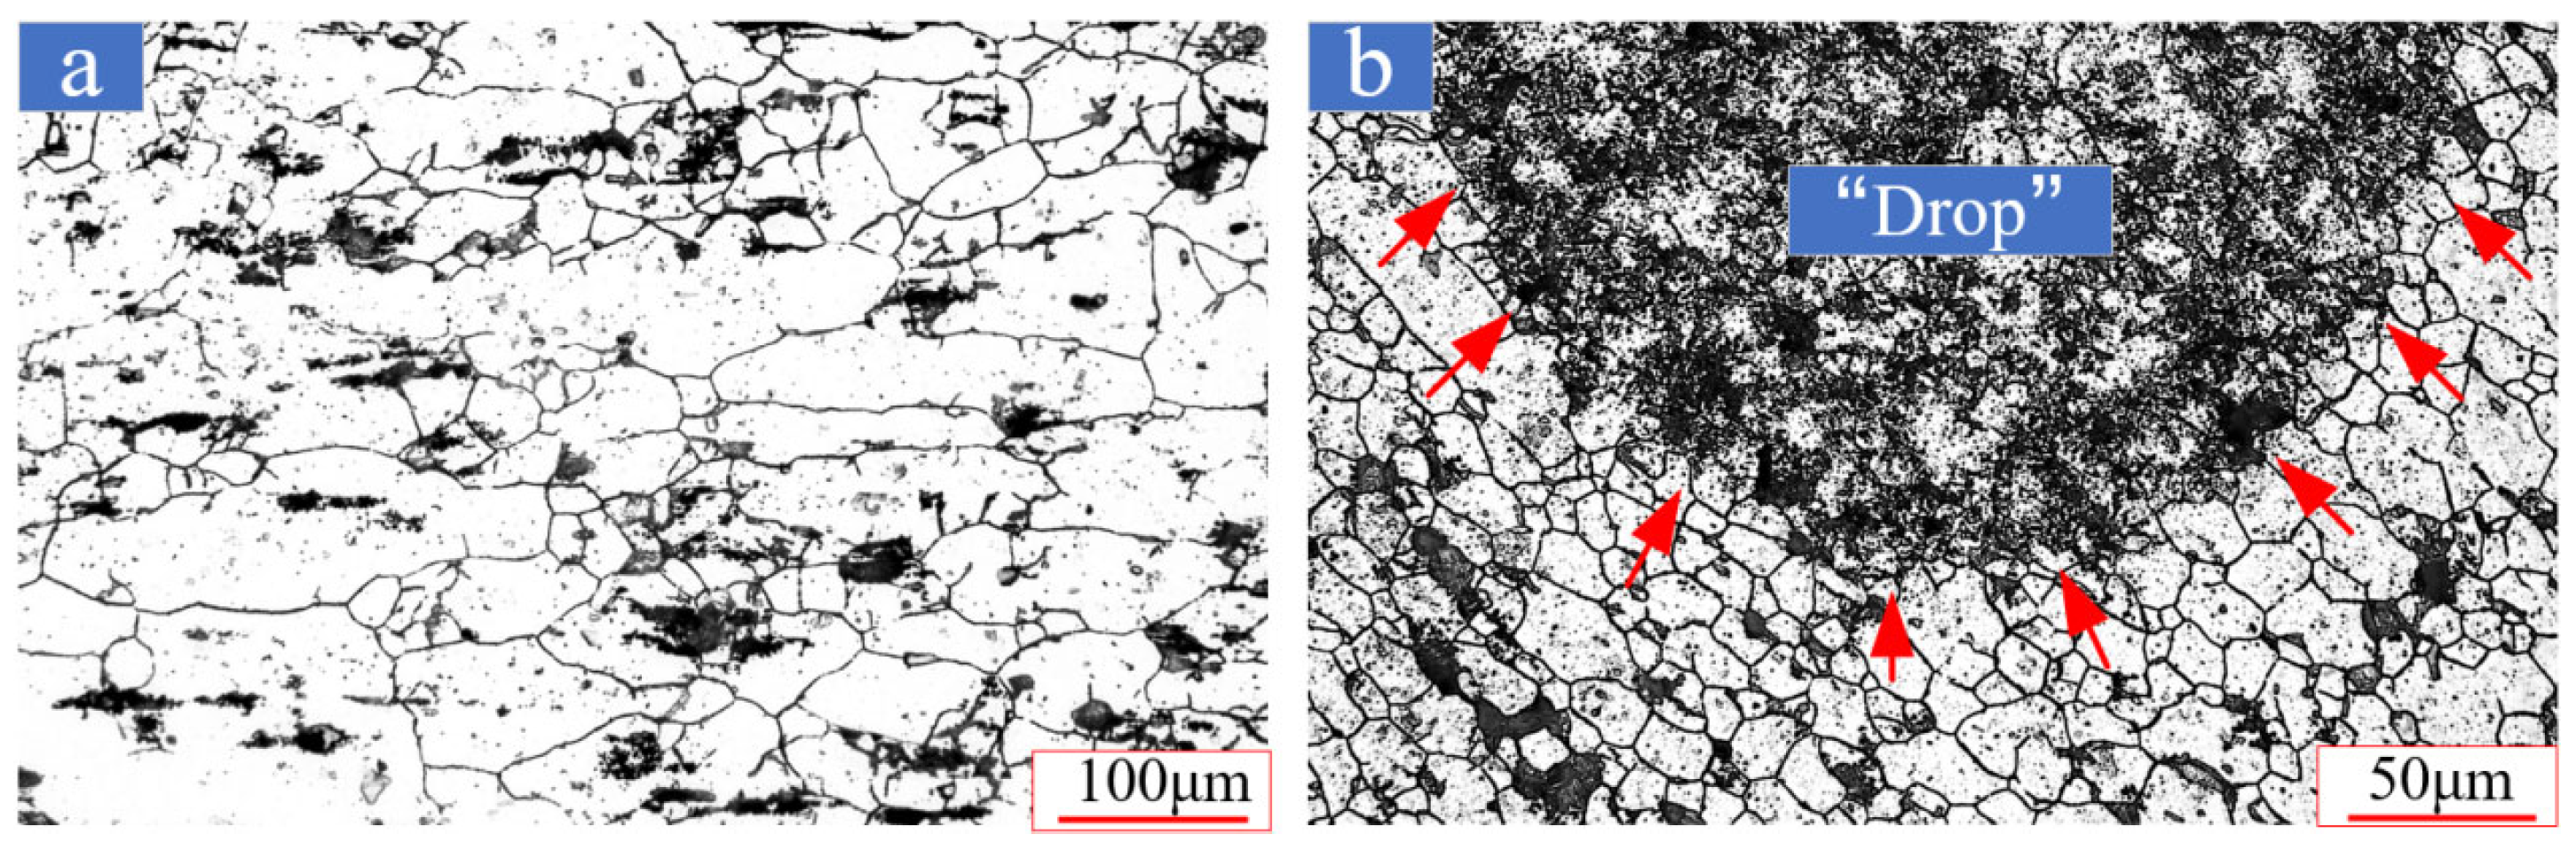
As illustrated in Figure 21, the metallographic examination of the refilling stage indicates a uniform grain size throughout the weld nugget zone, evidencing complete refinement. Directly beneath the stirring sleeve, a distinct “drop zone” is observed, and the base metal area immediately below the stirring tool exhibits significant flattening. The specific morphology is presented in Figure 22. Concurrently, the demarcation between the upper and lower plates near the stirring tool becomes increasingly indistinct, signaling the formation of an effective joint.
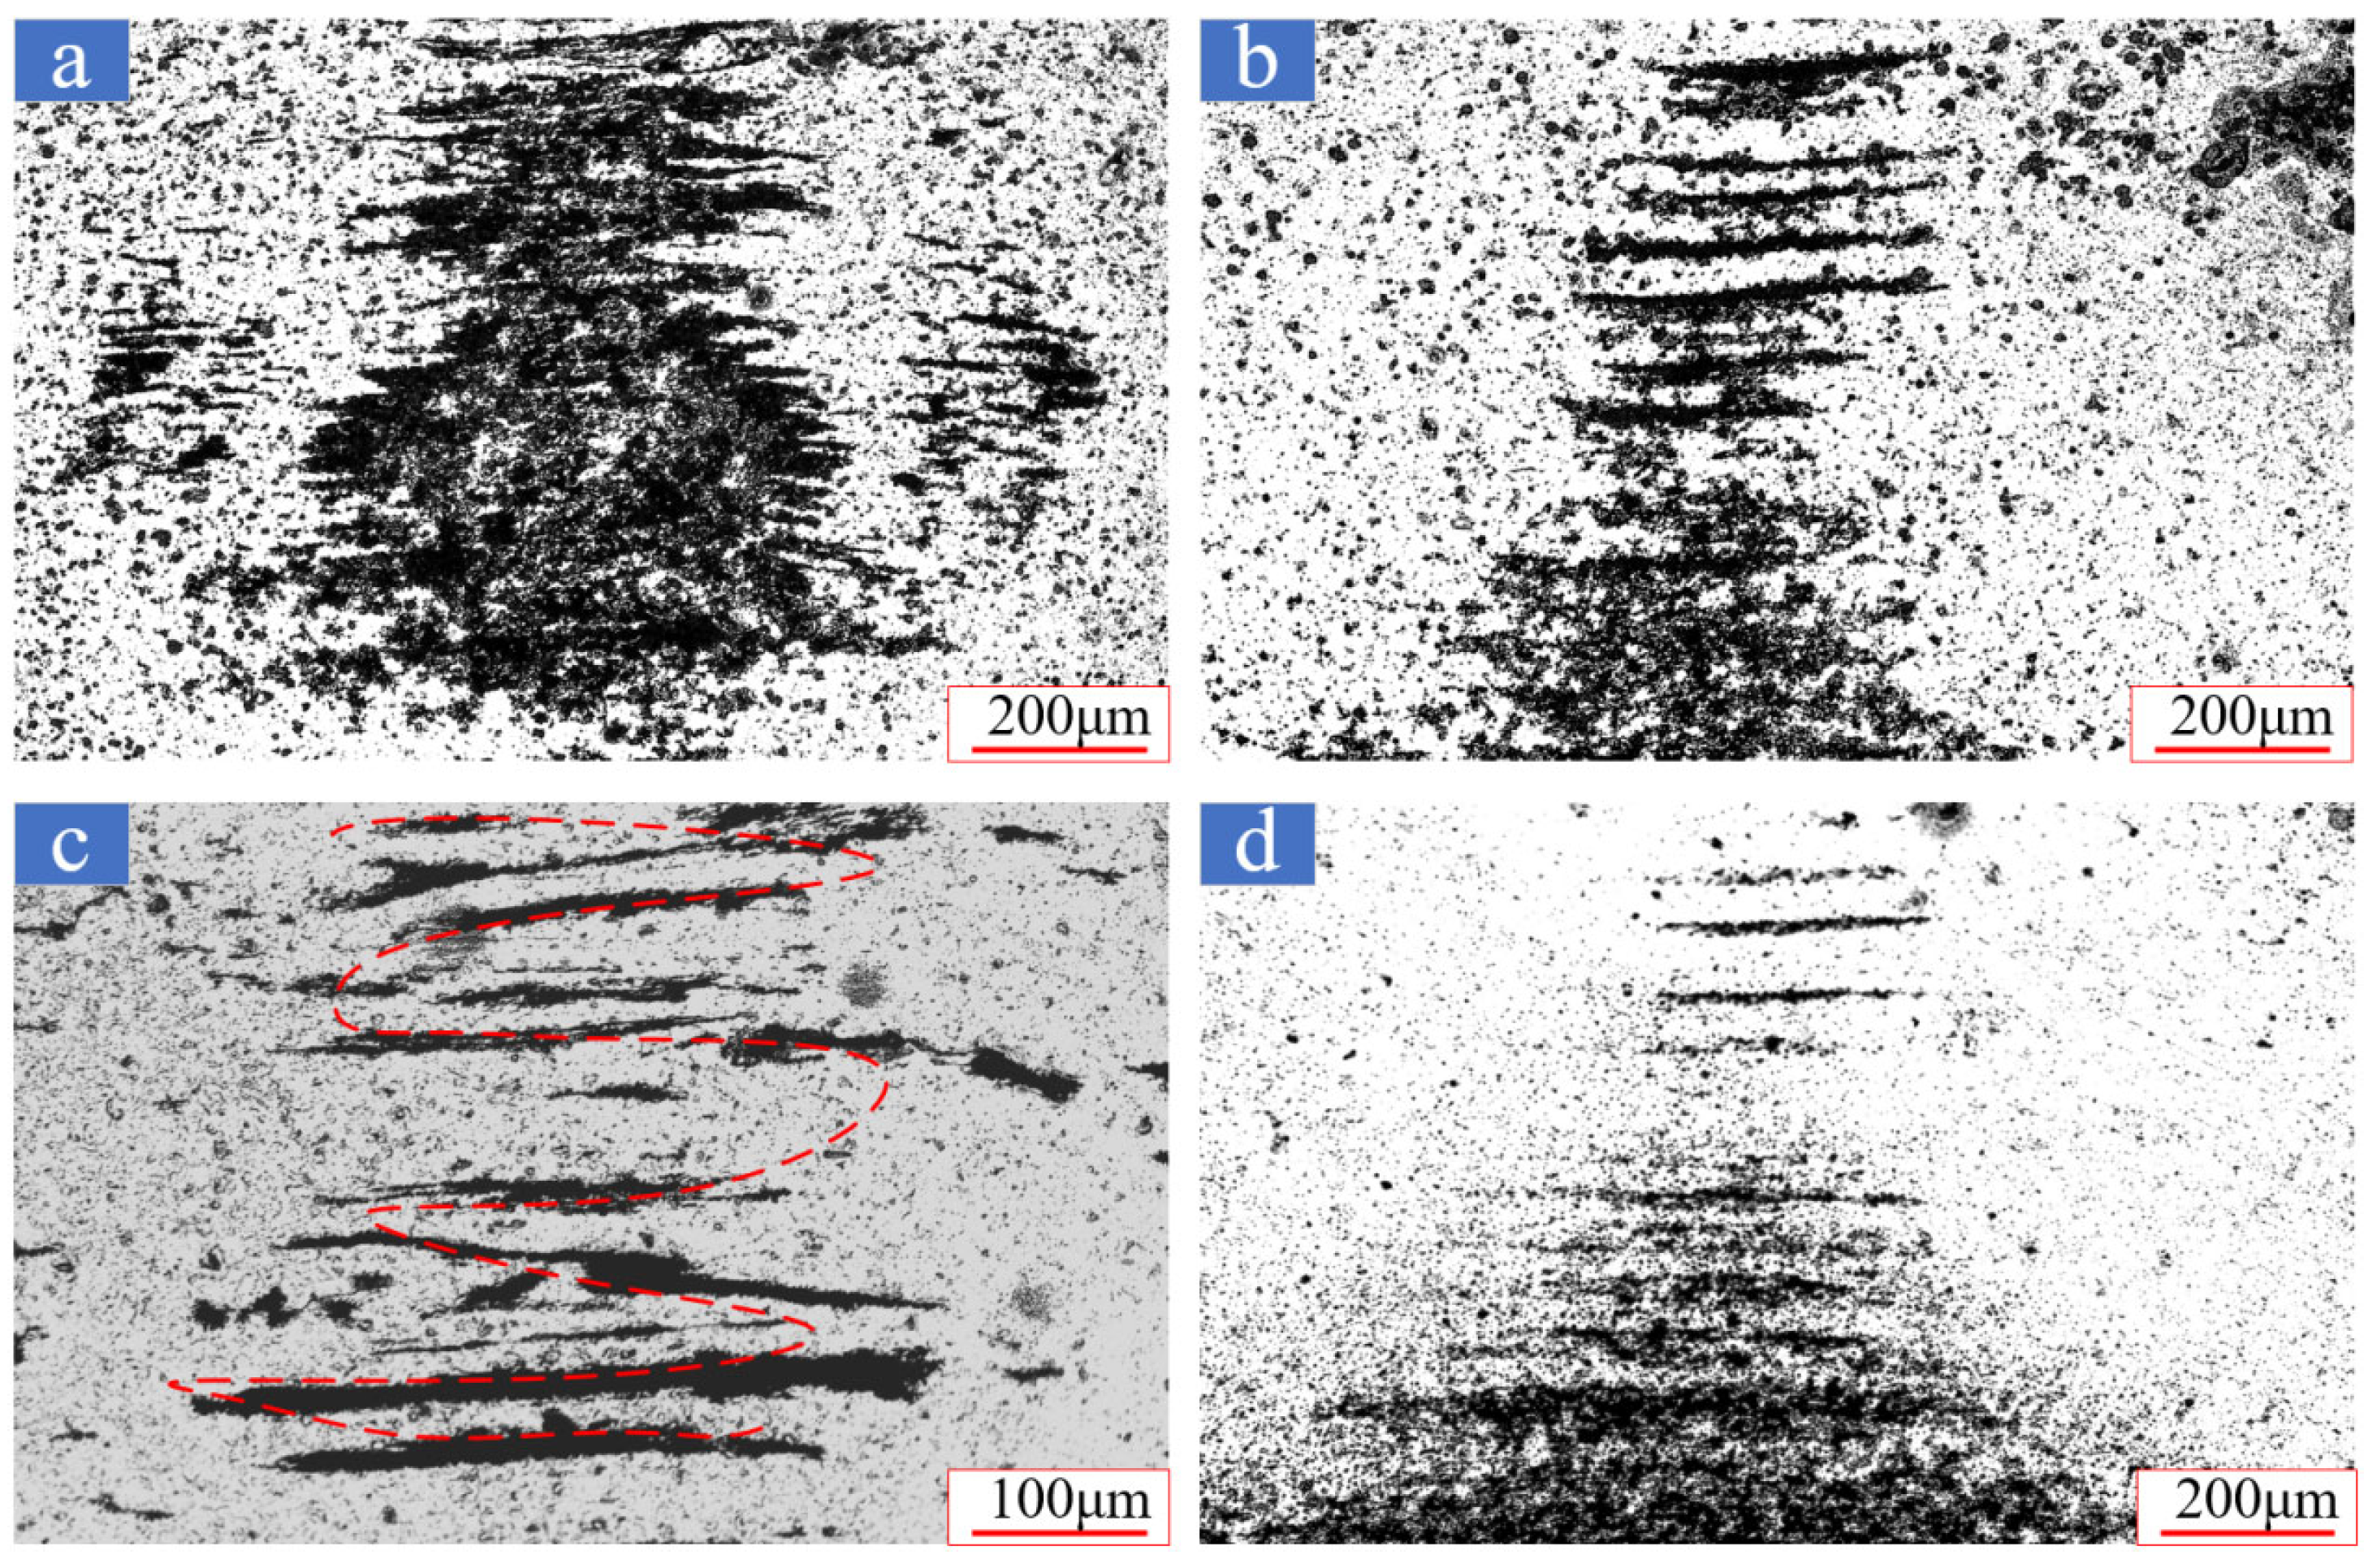
In the “glass zone”, a pronounced spiral trajectory becomes evident, traversing the center of the entire “spectacle line”, as demonstrated in Figure 22.
As observed in the spiral trajectory depicted in Figure 23, the direct extrusion exerted by the stirring tool on the plastically deformed metal at the PAZ generates increased pressure. This pressure facilitates greater shear interaction between the metal and the stirring tool, markedly differing from the dynamics observed during the penetration stage. This interaction results in a wider range of spiral trajectories at the center, albeit with a reduced pitch. As the spiral trajectory extends towards the bottom, it broadens and assumes a “triangular” shape, as illustrated in Figure 23d. This phenomenon can be attributed to the lower plasticity of the metal near the bottom and its relative distance from the mixing tool, which makes direct influence challenging, thereby limiting significant spiral motion in this area. In summary, at this stage, the metal within the stirring tool is substantially compressed and extruded, a process confirmed by the gradual disappearance of the boundary between the upper and lower plates, along with the broader expanse of the spiral trajectory paired with a finer pitch.
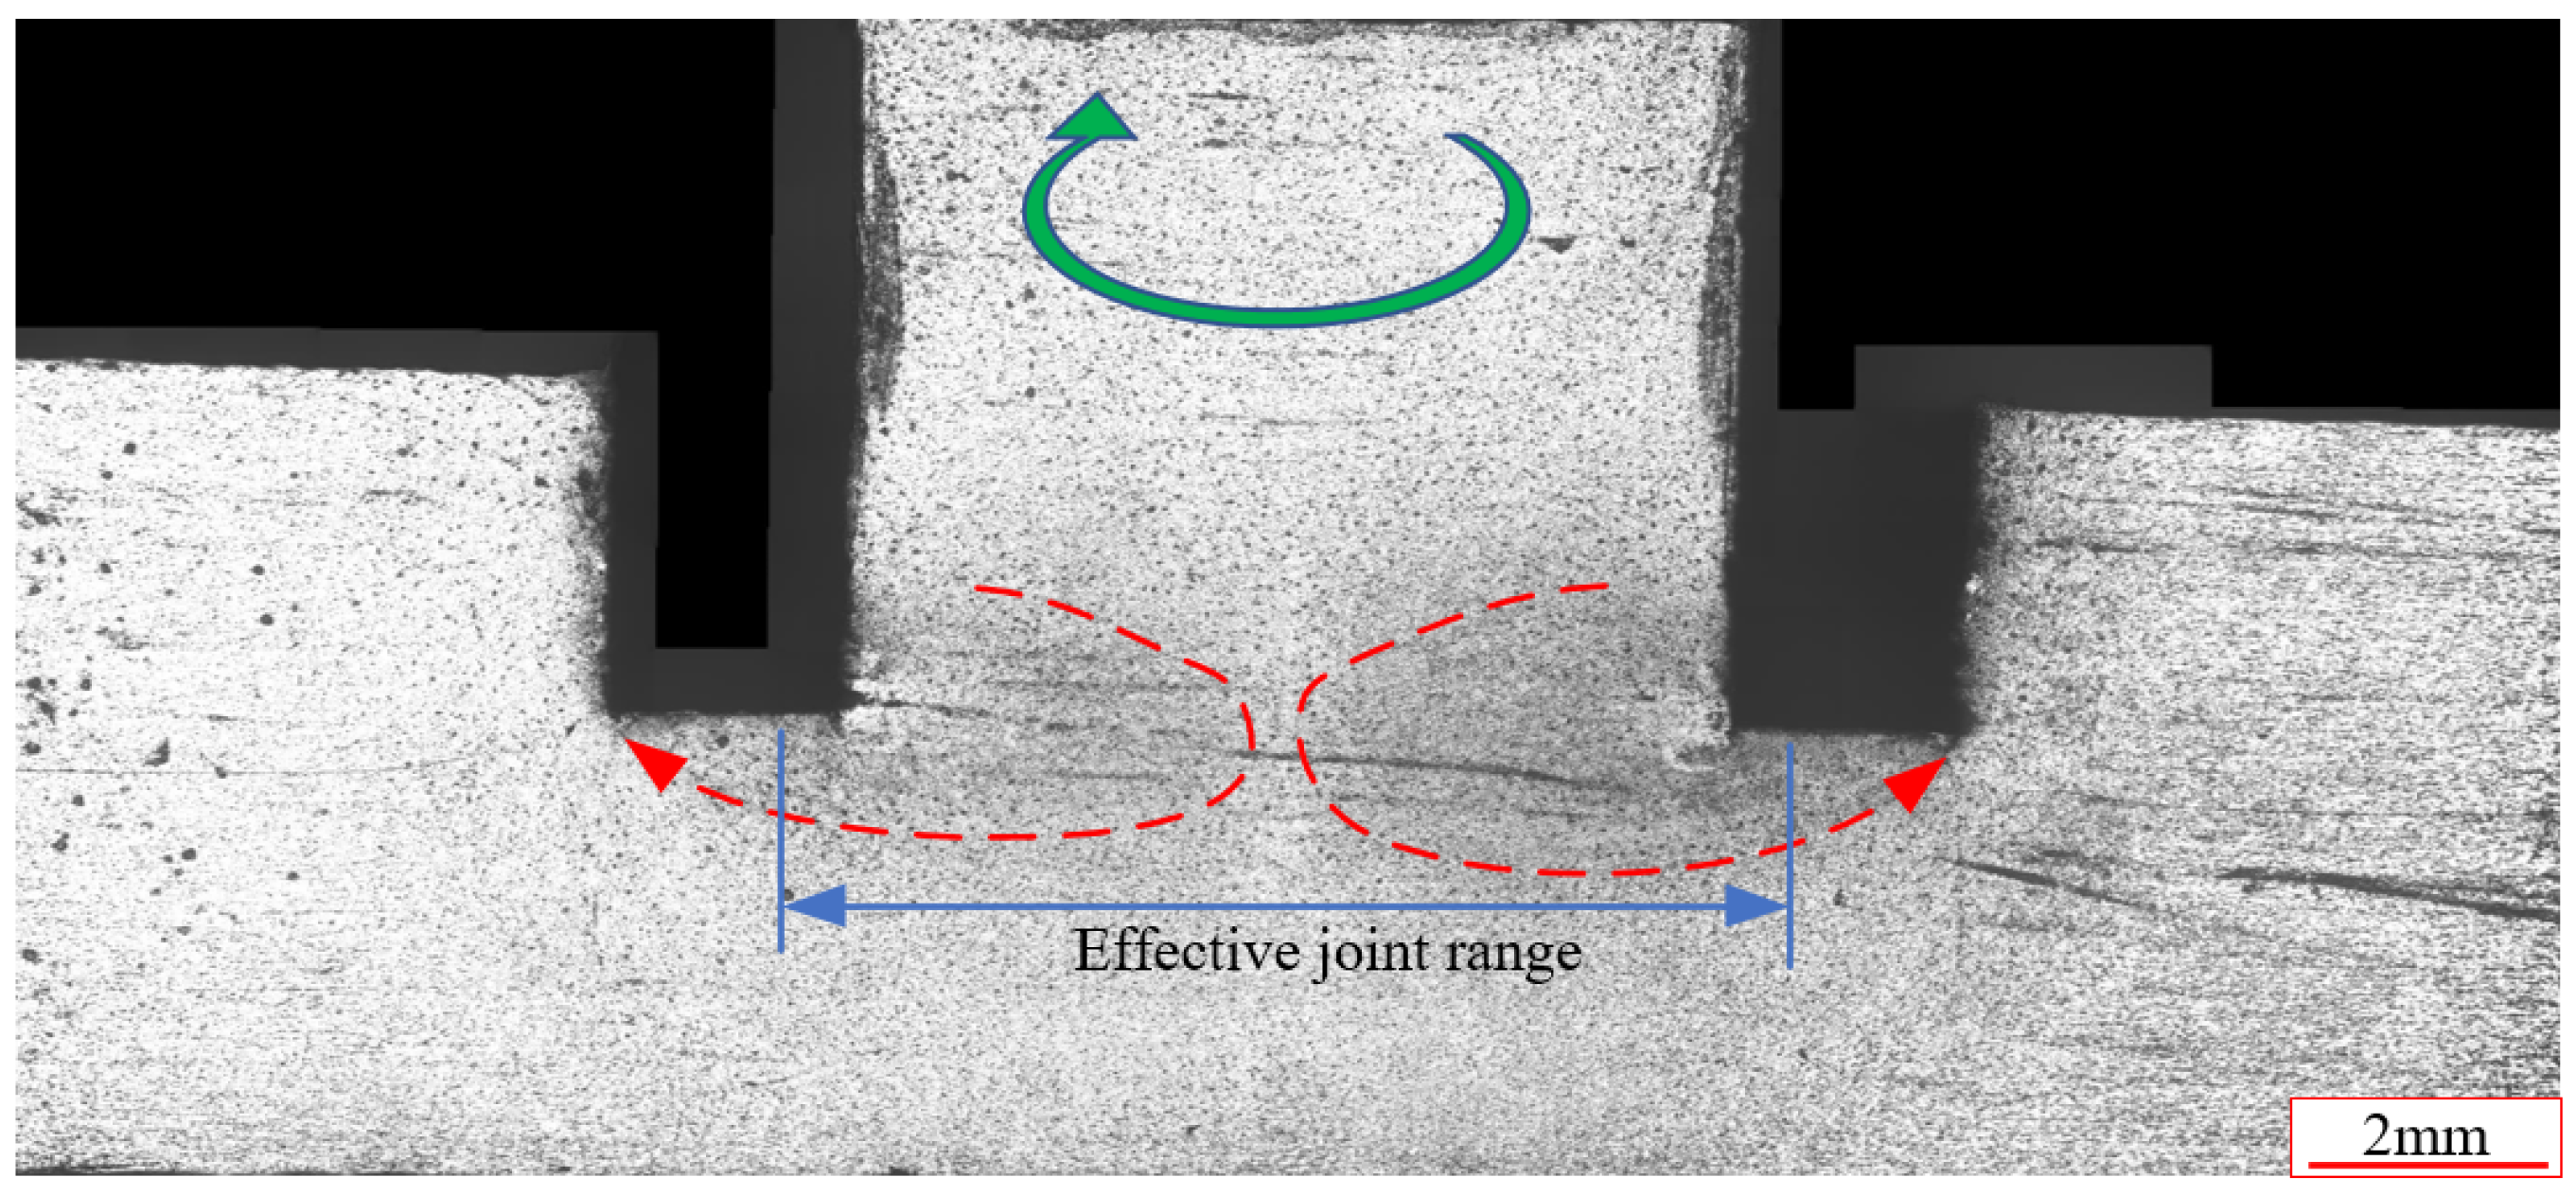
During the refilling of the upper plate, the persistence of the “glass zone” is still evident, albeit smaller and less distinct. Furthermore, the dividing line between the upper and lower plates completely vanishes within the spot welding zone, indicating the complete formation of an effective joint, as shown in Figure 24.

3.6. Formation Mechanism

To elucidate the formation process of the spot welding zone more precisely, Figure 25 presents a model illustrating the interactions between the stirring tool and the plastically deformed metal during the spot welding process.
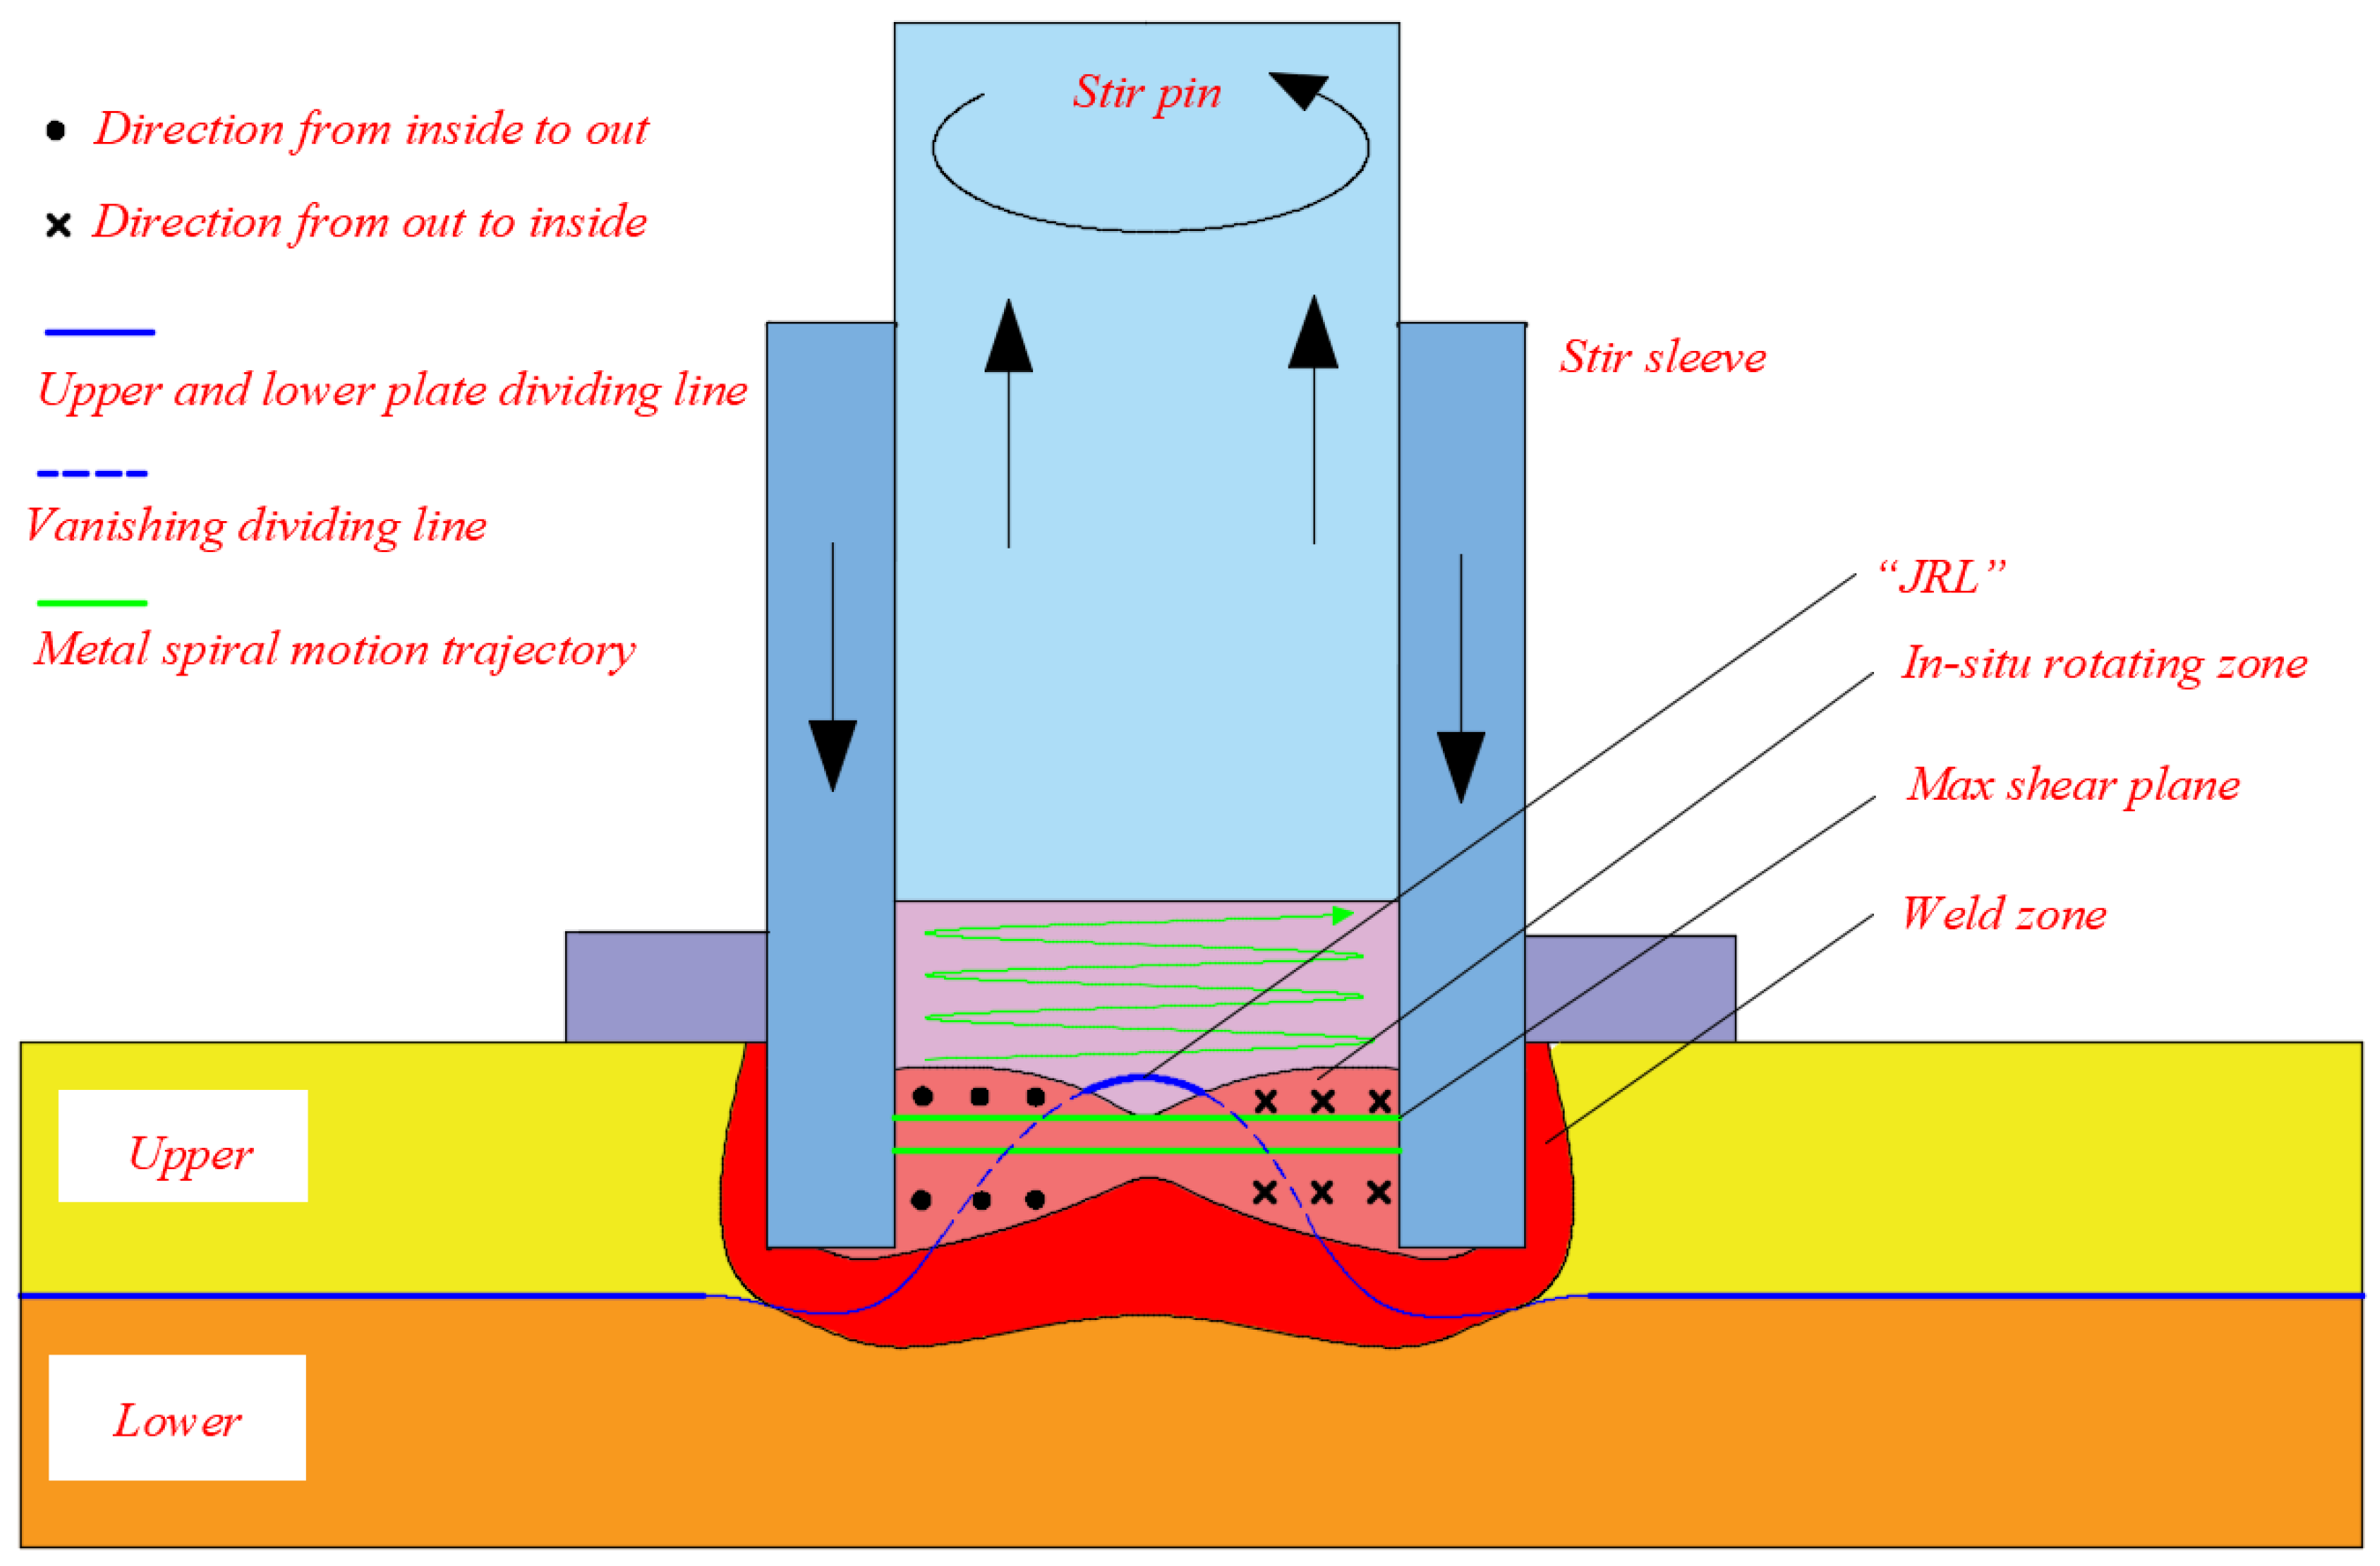
Drawing on the findings discussed previously, our analysis identifies a distinct “in situ shear rotation zone” located beneath the stirring tool, as depicted in Figure 25. This region is also referred to as the “glass zone” in metallographic microstructures. Its position shifts continuously in response to the movements of the stirring sleeve. The formation of this zone can be attributed to the relative rotational shear occurring between the rotating and stationary metal components, specifically between aluminum and aluminum, consistently positioned on the lower side of the stirring sleeve. Furthermore, this area serves as the ingress point for plastically deformed metal into the mixer tool, creating an “in situ shear rotation zone” between the aluminum alloys, which are not relatively stationary. Consequently, the rotational directions on either side of this zone are opposed. Within this zone, a maximum shear plane exists, and the width of this shear plane gradually increases as the spot welding progresses, eventually extending transversely across the entire nugget. The boundary line of the upper and lower plates continually penetrates into the in situ shear spin region under plastic deformation, being disrupted and reconstituted by this intense shear friction, as indicated by the blue dotted line in Figure 25, hence forming the aforementioned spiral pattern. The reason the central dividing line remains partially intact is due to the “JRL” phenomenon in the spot welding zone, which occurs because it is the first to deform upward, surpassing the position of the maximum shear surface. Consequently, the maximum shear surface does not extend laterally across the entire spot welding zone, as evidenced by the solid blue line in the middle of Figure 25. This observation underscores that both the duration and extent of the “in situ shear rotation zone” are intrinsically linked to the formation process of the spot welding region.
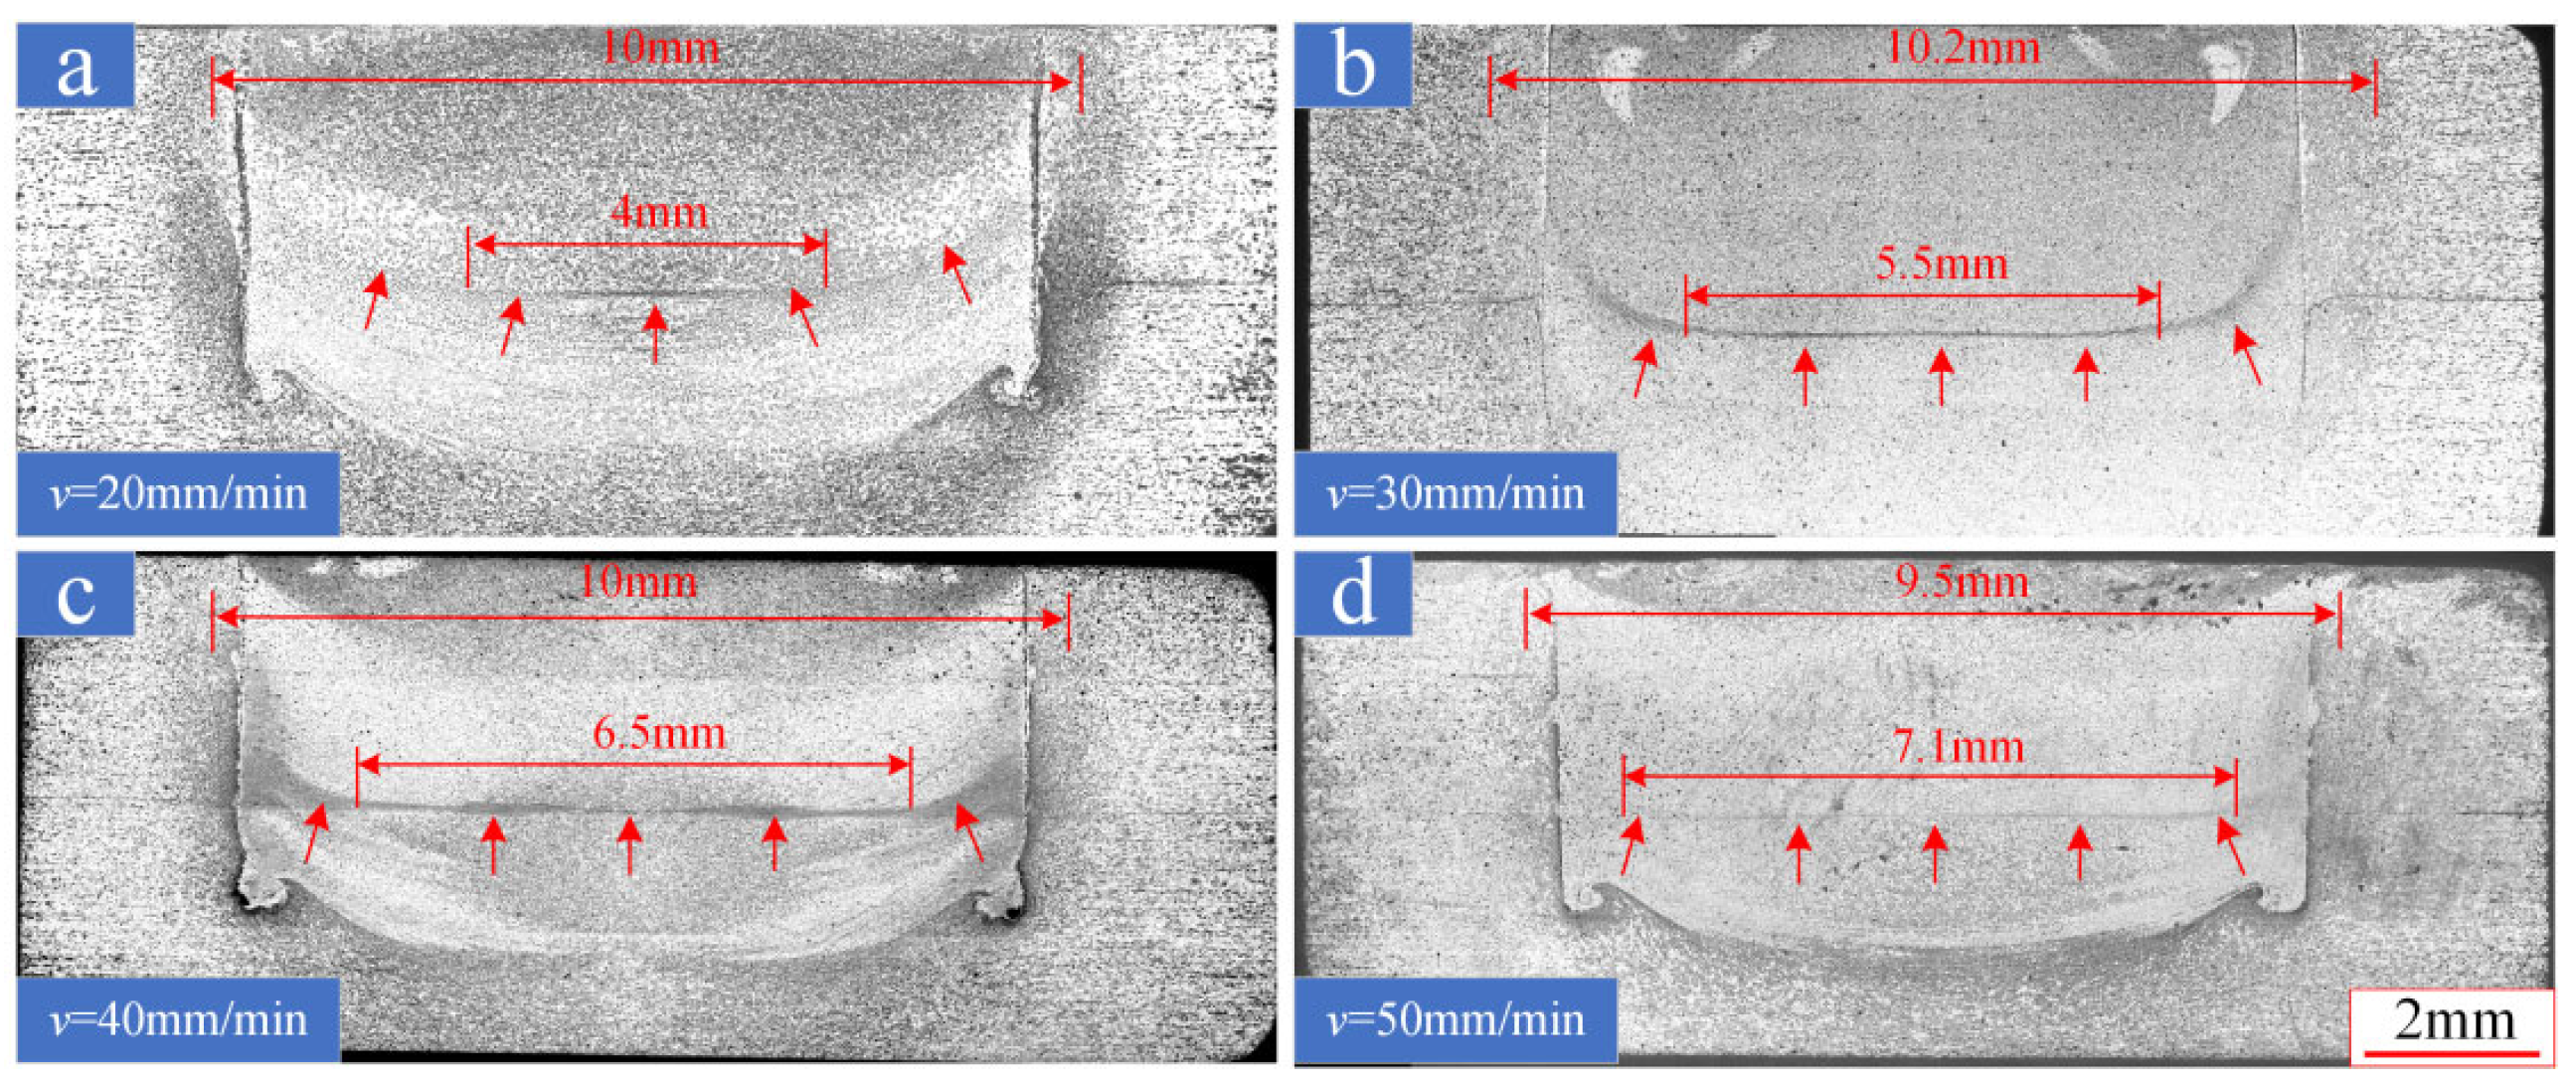
To corroborate the accuracy of the conclusions discussed earlier, Figure 26 illustrates the morphology of the “JRL” within the spot welding zone under conditions of varying welding speeds. Notably, as the welding speed increases, the “JRL” progressively widens. It is observed that a lower welding speed facilitates more thorough agitation, thereby extending the duration and expanding the range of the in situ shear spin region. This extension is advantageous for reducing the width of the “JRL”, as depicted in Figure 26a. This observation aligns perfectly with the previously mentioned impact of the in situ shear spin region on the “JRL” width and further confirms the existence of the “in situ shear rotation zone.”
In summary, the plastic flow of metal within the RFSSW zone during the entire penetration stage predominantly occurs in a spiral suction and cohesion manner and continues through the dwell stage. In this stage, there is significant shear adhesion between the stirring tool and the high-temperature plasticized metal, which undergoes overall rotational motion. During the refilling stage, the plastic metal within the stirring tool is progressively compressed and extruded by the downward force of the stirring needle, thus presenting a flow pattern of spiral compression and expansion. This process persists until the mixing tool completely detaches from the plate, and the spot welding zone is refilled in an extrusion injection accumulation manner. The validity of this model is supported by the helical patterns observed in the metallographic structure of the spot welding zone at various stages and the spatial displacement of the tracer points in the simulation results. Therefore, the formation of the entire spot welding zone can be described by the “spiral suction–refill injection stacking” model.
Moreover, the analysis indicates that the dividing line between the upper and lower plates is partially and effectively joined during the penetration stage. The subsequent spot welding process aims to further expand this joint zone. Consequently, the movement of metal within the entire spot welding zone can be characterized by “shear friction–in situ rotation.” Ultimately, the final spot welding zone between the upper and lower plates serves as the in situ rivet for the metal of the PAZ, forming a riveting zone with the surrounding metal under the frictional extrusion of the stirring tool. Hence, the spot welding process can be conceptualized as “complete friction plug riveting”.

4. Discussion

The metal flow model derived from this study is quite reliable under the current process parameters and numerical models. Such a flow model can better guide the setting of process parameters for refillable friction stir spot welding. It also helps researchers analyze the causes of internal defects in spot weld zones and find solutions, which is particularly necessary for metals that are difficult to weld. In particular, the shear friction–in situ rotation can well explain the reason for the fine grains in the PAZ and further describe the state of forming effective joints in the spot weld zone.

5. Conclusions

In this study, a numerical simulation model of refill friction stir spot welding was developed using DeformV11.0 software. The accuracy of this model was confirmed by correlating it with the metallographic structures observed at different stages of the actual spot welding process. The specific findings are as follows:
(1)
A reliable simulation model based on temperature was developed, yielding detailed analyses of the temperature field, stress field, and strain field at various stages within the spot welding zone. The dwell stage is crucial for plastic flow metal to more effectively fill the cavity formed by the stirring needle and sleeve, but the simulation model lags behind actual spot welding in terms of complete refill time. The metal at the center of the spot weld zone experiences lower pressure and fluidity throughout the entire spot welding process, while the metal at the edges of the spot weld zone has higher pressure and greater fluidity, which also explains why the grain refinement is higher there.
(2)
The microstructural characteristics of RFSSW at different stages were captured using the instant stop method. The accuracy of the numerical simulation results was validated by integrating these results with the observed microstructural transformations, thereby elucidating the path of metal flow and the evolution of grain structures during the welding process. Based on the simulation model’s tracer point movement trajectory, the metal in the spot welding area exhibits sinusoidal or quasi-sinusoidal fluctuations on the horizontal plane. It is more noticeable that the upper plate has a greater displacement and duration compared to the lower plate, indicating that the metal on the upper plate has significantly higher fluidity on the horizontal plane than the lower plate. In the entire space, the metal in the spot welding zone shows a spatial helical motion trajectory.
(3)
The numerical simulation and experimental results indicate that there is a distinct in situ shear spinning region beneath the stirring tool. Within this region, there exists a maximum shear plane whose width gradually expands until it spans horizontally across the entire weld nugget. The boundary line between the upper and lower plates continuously enters the in situ shear spinning region under plastic deformation, where it is fragmented and reorganized by intense shear friction. Furthermore, it can be concluded that the metal within the spot welding zone undergoes deformation primarily through “shear friction–in situ rotation”, resulting in the joint formation characterized as “complete friction plug riveting”. Based on these insights, the “spiral suction–refill injection stacking” model was established, providing a precise and rational description of the forming mechanism in RFSSW.

Author Contributions

As the author of this research, D.J. completed a large number of experiments and data analysis and wrote this article. I.K., as the doctoral supervisor of the author D.J., provided necessary guidance, as well as analysis of the test results. H.W., as one of the authors, carried out the theoretical guidance of the whole experiment, and X.G., as one of the authors, carried out part of the experimental data analysis. All authors have read and agreed to the published version of this manuscript.

Funding

This research was funded by [Zone integrity analysis of friction stir spot welding of thick plate aluminum alloy #1], under Grant [number 2023AH051378]; [Optimization and failure analysis of friction stir spot welding process of dissimilar materials #2], under Grant [number SGCZXYB2301]; [Aluminum alloy friction stir spot weld zone integrity analysis #3], under Grant [number 2022xkjzd002]; [National Natural Science Foundation of China Young Scientist Foundation Project #4], under Grant [number 52405479]; and [Optimization and failure analysis of friction stir spot welding process of dissimilar materials #5], under Grant [number SGCZXYB2302].

Data Availability Statement

All the data of this study are available to anyone who needs to obtain them. Please contact us at jiangdihs@163.com.

Acknowledgments

This study utilized RFSSW equipment produced by China Safeforce Company, Deform V11.0 software, and EBSD equipment manufactured by Japan Hitachi Corporation.

Conflicts of Interest

The authors declare no conflicts of interest.

Abbreviations

The following abbreviations are used in this manuscript:
RFSSWRefill Friction Stir Spot Welding
JRLJoint Residual Line
PAZPin-Affected Zone

References

  1. Zou, Y.; Li, W.; Shen, Z.; Su, Y.; Yang, X. Refill friction stir spot welding of aluminum alloys: State-of-the-art and Perspectives. Weld. World 2023, 67, 1853–1885. [Google Scholar] [CrossRef]
  2. Feng, X.S.; Li, S.B.; Tang, L.N.; Wang, H.M. Refill friction stir spot welding of similar and dissimilar alloys: A review. Acta Metall. Sin. (Engl. Lett.) 2020, 33, 30–42. [Google Scholar] [CrossRef]
  3. Zou, Y.; Li, W.; Yang, X.; Su, Y.; Chu, Q.; Shen, Z. Microstructure and mechanical properties of refill friction stir spot welded joints: Effects of tool size and welding parameters. J. Mater. Res. Technol. 2022, 21, 5066–5080. [Google Scholar] [CrossRef]
  4. Shen, Z.; Ding, Y.; Gopkalo, O.; Diak, B.; Gerlich, A. Effects of tool design on the microstructure and mechanical properties of refill friction stir spot welding of dissimilar Al alloys. J. Mater. Process. Technol. 2018, 252, 751–759. [Google Scholar] [CrossRef]
  5. Shen, Z.; Li, W.Y.; Ding, Y.; Hou, W.; Liu, X.C.; Guo, W.; Chen, H.Y.; Liu, X.; Yang, J.; Gerlich, A.P. Material flow during refill friction stir spot welded dissimilar Al alloys using a grooved tool. J. Manuf. Process. 2020, 49, 260–270. [Google Scholar] [CrossRef]
  6. Kubit, A.; Faes, K.; Derazkola, H.A. Refill friction stir spot welding tool plunge depth effects on shear, peel, and fatigue properties of Alclad coated AA7075 aluminum joints. Int. J. Fatigue 2024, 185, 108308. [Google Scholar] [CrossRef]
  7. Ji, S.; Wang, Y.; Li, Z.; Yue, Y.; Chai, P. Effect of tool geometry on material flow behavior of refill friction stir spot welding. Trans. Indian Inst. Met. 2017, 70, 1417–1430. [Google Scholar] [CrossRef]
  8. Muci-Küchler, K.H.; Kalagara, S.; Arbegast, W.J. Simulation of a refill friction stir spot welding process using a fully coupled thermo-mechanical FEM model. J. Manuf. Sci. Eng. 2010, 132, 014503. [Google Scholar] [CrossRef]
  9. Kubit, A.; Trzepiecinski, T. A fully coupled thermo-mechanical numerical modelling of the refill friction stir spot welding process in Alclad 7075-T6 aluminium alloy sheets. Arch. Civ. Mech. Eng. 2020, 20, 117. [Google Scholar] [CrossRef]
  10. Salami, K.; Abdi Behnagh, R.; Agha Mohammad Pour, M.; Brighenti, R. Numerical study of refill friction stir spot welding of dissimilar metallic materials using smoothed particle hydrodynamics (SPH). Acta Mech. 2024, 235, 6321–6339. [Google Scholar] [CrossRef]
  11. Zhang, H.F.; Zhou, L.; Li, G.H.; Tang, Y.T.; Li, W.L.; Wang, R. Prediction and validation of temperature distribution and material flow during refill friction stir spot welding of AZ91D magnesium alloy. Sci. Technol. Weld. Join. 2021, 26, 153–160. [Google Scholar] [CrossRef]
  12. Chen, S.; Li, Z.; Xiao, J.; Pu, J.; Han, Y.; Gai, S.; Wang, D.; Jiang, X. Experimental investigation of material flow behavior during refill friction stir spot welding. J. Mater. Process. Technol. 2025, 337, 118710. [Google Scholar] [CrossRef]
  13. Maranho, J.F.C.; Cui, F.; Tang, H.; Feng, X. Enhanced dissimilar aluminum alloy joints using 0.1 mm offset in refill friction stir spot welding. J. Mater. Res. Technol. 2025, 36, 1091–1104. [Google Scholar] [CrossRef]
  14. Ohashi, R.; Hatano, R.; Haruna, S. Characterization of thermoplastic composite joints fabricated by the combined refill friction stir spot welding and riveting process. J. Thermoplast. Compos. Mater. 2025, 38, 1167–1183. [Google Scholar] [CrossRef]
  15. Becker, N.; dos Santos, J.F.; Klusemann, B. Experimental investigation of crack propagation mechanism in refill friction stir spot joints of AA6082-T6. Eng. Fract. Mech. 2024, 300, 109963. [Google Scholar] [CrossRef]
  16. Belnap, R.; Smith, T.; Blackhurst, P.; Cobb, J.; Misak, H.; Bosker, J.; Hovanski, Y. Evaluating the Influence of Tool Material on the Performance of Refill Friction Stir Spot Welds in AA2029. J. Manuf. Mater. Process. 2024, 8, 88. [Google Scholar] [CrossRef]
  17. Kim, D.; Baek, S.; Nishijima, M.; Lee, H.-C.; Geng, P.; Ma, N.; Zhang, Z.; Park, H.; Chen, C.; Lee, S.-J.; et al. Toward defect-less and minimized work-hardening loss implementation of Al alloy/high-purity Cu dissimilar lap joints by refill friction stir spot welding for battery tab-to-busbar applications. Mater. Sci. Eng. A 2024, 892, 146089. [Google Scholar] [CrossRef]
  18. Yuan, Y.; Wu, Z.; Chen, K.; Liu, H.; Huang, H.; Li, Y. Effects of plunge depth on macro-/microstructure and mechanical properties of refill friction stir spot welded 2195-T6 Al–Li alloy. J. Mater. Res. Technol. 2025, 35, 6026–6041. [Google Scholar] [CrossRef]
  19. Wang, Y.; Li, P.; Jiang, H.; Yang, K.; Chen, Z.; Chuai, H.; Wu, X.; Meng, Q.; Ma, L. Microstructure and Mechanical Properties of Refill Friction Stir Spot-Welded Joints of 2A12Al and 7B04Al: Effects of Tool Size and Welding Parameters. Materials 2024, 17, 716. [Google Scholar] [CrossRef]
  20. Jiang, D.; Kolupaev, I.N.; Wang, H.; Ge, X. Process optimization of refill friction spot stir of AA6061-T6 aluminum alloy for thick plate. J. Adhes. Sci. Technol. 2025, 39, 555–573. [Google Scholar] [CrossRef]
  21. Zhou, L.; Luo, L.Y.; Zhang, T.P.; He, W.X.; Huang, Y.X.; Feng, J.C. Effect of rotation speed on microstructure and mechanical properties of refill friction stir spot welded 6061-T6 aluminum alloy. Int. J. Adv. Manuf. Technol. 2017, 92, 3425–3433. [Google Scholar] [CrossRef]
  22. Zhao, Y.; Zhao, Y.; Liu, Z.; Lin, Z.; Dong, C.; Deng, J. Temperature field and joint microstructure and performance control of variable speed backfill friction stir spot welding of high-strength aluminum alloy. J. Weld. 2022, 43, 50–55+115–116. [Google Scholar]
  23. Yousefi, A.; Serjouei, A.; Hedayati, R.; Bodaghi, M. Fatigue modeling and numerical analysis of re-filling probe hole of friction stir spot welded joints in aluminum alloys. Materials 2021, 14, 2171. [Google Scholar] [CrossRef] [PubMed]
  24. Bîrsan, D.C.; Susac, F.; Teodor, V.G. Optimization and Analysis of Refill Friction Stir Spot Welding (RFSSW) Parameters of Dissimilar Aluminum Alloy Joints by FE and ANN Methods. Materials 2024, 17, 4586. [Google Scholar] [CrossRef]
  25. Xiong, J.; Peng, X.; Shi, J.; Wang, Y.; Sun, J.; Liu, X.; Li, J. Numerical simulation of thermal cycle and void closing during friction stir spot welding of AA-2524 at different rotational speeds. Mater. Charact. 2021, 174, 110984. [Google Scholar] [CrossRef]
  26. Bîrsan, D.C.; Păunoiu, V.; Teodor, V.G. Neural networks applied for predictive parameters analysis of the refill friction stir spot welding process of 6061-T6 aluminum alloy plates. Materials 2023, 16, 4519. [Google Scholar] [CrossRef]
  27. Sato, Y.S.; Yamashita, F.; Sugiura, Y.; Park, S.H.C.; Kokawa, H. FIB-assisted TEM study of an oxide array in the root of a friction stir welded aluminium alloy. Scr. Mater. 2004, 50, 365–369. [Google Scholar] [CrossRef]
Figure 1. Schematic diagram of the RFSSW process. (a) Preheating stage, lasting for 3 s; (b) spot welding penetration stage; (c) spot welding refilling stage; (d) spot welding stop stage, also lasting for 3 s.
Crystals 15 00555 g001
Figure 2. Stress–strain curves. (a) Base material. (b) Spot welding zone.
Crystals 15 00555 g002
Figure 3. Schematic diagram of temperature measurement for RFSSW.
Crystals 15 00555 g003
Figure 4. Diagram showing the relative position of spot welding materials and the meshing schematic. (a) Schematic diagram of numerical simulation model. (b) Relative positions between stirring tools. (c) Meshing diagram for stirring tools. (d) Meshing diagram for the spot welding zone.
Crystals 15 00555 g004
Figure 5. Motion attribute settings of the stirring tool.
Crystals 15 00555 g005
Figure 6. Comparison of numerical simulation and actual spot welding results. (a) Comparison of simulated and experimental molding outcomes. (b) Comparison of simulated and actual temperature measurements.
Crystals 15 00555 g006
Figure 7. Temporal trends in the temperature distribution within the spot welding zone.
Crystals 15 00555 g007
Figure 8. Schematic diagram of particle tracking tracer point positions.
Crystals 15 00555 g008
Figure 9. Trajectories of different tracer points. (a) Horizontal trajectory of tracer points on the upper plate. (b) Horizontal trajectory of tracer points on the lower plate. (c) Thickness trajectory of tracer points on the upper plate. (d) Thickness trajectory of tracer points on the lower plate.
Crystals 15 00555 g009
Figure 10. The trajectory of tracer point C in space. (a) XY plane motion trajectory; (b) XZ plane motion trajectory; (c) YZ plane motion trajectory; (d) spatial motion trajectory.
Crystals 15 00555 g010
Figure 11. Morphology of spot welding in the penetration stage (penetration depth: 2 mm). (a) Top-right corner of PAZ; (b) Paz central zone; (c) The lower area of the PAZ center; (d) PAZ is near the SAZ; (e) In the middle of PAZ and near the left side of the SAZ; (f) In the middle of PAZ and near the right side of the SAZ.
Crystals 15 00555 g011
Figure 12. Simulation results of the spot welding zone in the penetration stage. (a) Macroscopic morphology of “M” line; (b) Simulation model morphology of “M” line; (c) Metal flow rate in the spot welding zone; (d) The metal strain rate in the spot welding zone; (e) Spot welding zone has shifted in the X direction; (f) Spot welding zone has shifted in the Z direction.
Crystals 15 00555 g012
Figure 13. Morphology of penetration into the lower plate (at a depth of 3.5 mm). (a) The top-right corner of PAZ; (b) The central area of PAZ; (c) The upper-left corner of PAZ; (d) Left side upper and lower plate boundary; (e) Directly below PAZ; (f) Right side upper and lower plate boundary.
Crystals 15 00555 g013
Figure 14. Simulation results of the penetration stage (at a depth of 3.5 mm). (a) The macroscopic morphology of the “Glass” line; (b) Total displacement of the spot welding zone; (c) Stress distribution in the spot welding zone; (d) Spot welding zone speed distribution in the Y direction.
Crystals 15 00555 g014
Figure 15. JRL morphology during the stage of penetration into the lower plate. (a) The macroscopic morphology of “JRL”; (b) Macroscopic morphology of the “JRL” center; (c) Magnify the macroscopic morphology at the “JRL” center.
Crystals 15 00555 g015
Figure 16. Simulation results of the dwell stage. (a) Trend of discrete particles over time; (b) The rotational state of discrete particles over time.
Crystals 15 00555 g016
Figure 17. The simulation results for the dwell stage. (a) Total displacement of the spot welding zone; (b) Strain of the spot welding zone; (c) Stress distribution in the spot welding zone; (d) Spot welding zone speed distribution in the Y direction.
Crystals 15 00555 g017
Figure 18. Morphology of the spot welding zone during the dwell stage (at a depth of 4 mm). (a) The top-right corner of PAZ; (b) The central zone of PAZ; (c) The upper-left corner of PAZ; (d) The left corner of “JRL”; (e) The central zone of “JRL”; (f) The right corner of “JRL”.
Crystals 15 00555 g018
Figure 19. Microstructure and morphology during the dwell stage (at a depth of 4 mm). (a) Macroscopic morphology of the “Glasses zone”; (b) EBSD image of zone b in the (a); (c) EBSD image of zone c in the (a); (d) EBSD image of zone d in the (a).
Crystals 15 00555 g019
Figure 20. Simulation results of the refilling stage (at a depth of 4 mm).
Crystals 15 00555 g020
Figure 21. Morphology of the refilling stage (at a depth of 3 mm). (a) The upper side of the center of PAZ. (b) The center of PAZ. (c) The lower right side of PAZ.
Crystals 15 00555 g021
Figure 22. Morphology of the refilling stage. (a) Base metal, with sampling of the grain morphology at point e in Figure 21. (b) Drop zone, with sampling at point f in Figure 21.
Crystals 15 00555 g022
Figure 23. Morphology of the refilling stage (sampling of the g zone in Figure 20). (a) Macroscopic morphology of helical trajectory; (b) Magnified morphology of a spiral trajectory; (c) An enlarged view of (b); (d) The morphology at the bottom of the spiral trajectory.
Crystals 15 00555 g023
Figure 24. Morphology of the spot welding zone at the end of the refilling stage.
Crystals 15 00555 g024
Figure 25. Schematic representation of metal flow within the spot welding zone.
Crystals 15 00555 g025
Figure 26. Macroscopic structure under various penetration speeds. (a) Welding speed is 20 mm/min; (b) Welding speed is 30 mm/min; (c) Welding speed is 40 mm/min; (d) Welding speed is 50 mm/min.
Crystals 15 00555 g026
Table 1. Chemical composition (%) of 6061-T6 aluminum alloy by mass fraction.
Composition of Each Element (Mass Fraction) %
SiFeCuMgMnCrZnTiAl
0.650.560.281.080.0520.20.010.019Others
Table 2. Mechanical properties and physical properties of the 6061-T6 aluminum alloy sheet.
Tensile Strength
Rm/MPa
Elongation
%
Coefficient of Thermal
Expansion, 10−5/°C
Melting
°C
Hardness
HV
Grain Size
μm
304142.366509260
Table 3. Basic physical parameters of the base metal and stirring tool.
TypeMetalBoardPinSleeveRing
Initial temperature/°C20 100 450450425
State propertyPlasticityRigidityRigidityRigidityRigidity
Heat transfer coefficient0.56111111
Young’s modulus68,900212,000212,000212,000212,000
Poisson’s ratio0.330.30.30.30.3
Thermal expansion (e − 05)2.21.251.251.25 1.25
Thermal conductivity18043.443.443.443.4
Specific heat capacity J/(kg·°C)8804430243024302430
Thermal radiation0.90.70.70.70.7
Disclaimer/Publisher’s Note: The statements, opinions and data contained in all publications are solely those of the individual author(s) and contributor(s) and not of MDPI and/or the editor(s). MDPI and/or the editor(s) disclaim responsibility for any injury to people or property resulting from any ideas, methods, instructions or products referred to in the content.

