Article

Synthesis and Characterization of MgO-ZrO2 Heterostructure: Optical, Mechanical and Electrical Properties

1
Faculty of Metallurgical and Energy Engineering, Kunming University of Science and Technology, Kunming 650093, China
2
Faculty of Materials Science and Engineering, Kunming University of Science and Technology, Kunming 650093, China
3
Department of Computing and Technology, Iqra University H9, Islamabad 44000, Pakistan
4
Department of Biochemistry, Center for Structural Biology, School of Medicine, Wake Forest University, Winston-Salem, NC 27101, USA
*
Author to whom correspondence should be addressed.
Crystals 2025, 15(5), 465; https://doi.org/10.3390/cryst15050465
Submission received: 10 March 2025 / Revised: 25 April 2025 / Accepted: 30 April 2025 / Published: 15 May 2025
(This article belongs to the Section Hybrid and Composite Crystalline Materials)

Abstract

:
The synthesis and characterization of MgO-ZrO2 heterostructures are examined in this work. To promote the creation of nanowires, the Si substrate is first covered with a catalyst layer of various Au thicknesses. Sputtering is used to achieve this deposition. After that, chemical vapor deposition (CVD) with a Au catalyst layer is used to create MgO nanowire arrays on the silicon substrate. Second, MgO/ZrO2 Core–shell Nanowire Arrays are created by applying ZrO2 layers to the surface of MgO nanowires of different diameters using chemical vapor deposition (CVD) procedures. The presence of both magnesium oxide (MgO) and zirconium dioxide (ZrO2) in their oxidized forms was shown by the detailed characterization of the MgO-ZrO2 core–shell nanowire samples utilizing a variety of methods. Phase formation, mechanical homogeneity, optical characteristics, and topographical structure and roughness were all thoroughly examined at various stresses. MgO hardness values ranged from 1.4 to 3.2 GPa, whereas MgO-ZrO2 ranged from 0.38 to 1.2 GPa. The I–V parameter study was a further step in the examination of the heterostructure’s electrical properties. The structural, morphological, optical, mechanical, and electrical properties of the MgO-ZrO2 heterostructure were all thoroughly described using these techniques.

1. Introduction

Magnesium oxide (MgO) is a face-centered cubic crystal exhibiting a rock-salt structure. Owing to its non-toxicity, affordability, thermal stability, corrosion resistance, excellent thermal conductivity, and optical characteristics, MgO has been extensively utilized in solar cells, antibacterial agents, sewage treatment, building material additives, and electron emission materials. Due to the surface effect and size impact of nanomaterials, MgO nanostructures have enhanced physical and chemical characteristics compared to bulk materials. Nano-MgO has significant catalytic activity and is effectively used in water vapor and CO catalysis due to the active sites on its surface and edge that possess charge transfer potential [1]. At room temperature, pure ZrO2 has a monoclinic crystal structure. However, at around 1170 °C, it transforms a tetragonal structure, and at temperatures above 2370 °C, it converts to a cubic fluorite structure [2,3]. The t→m transformation in ZrO2 is known to cause a large volume expansion of approximately 4.5%. This expansion can lead to the catastrophic fracture and structural unreliability of prepared components, which greatly limits the application of ZrO2 as an engineering ceramic [4,5]. The addition of low-valent binary oxides, such as Y2O3, CaO, and MgO, can help to stabilize high-temperature polymorphs of ZrO2 at room temperature. This is because these oxides can modify the crystal structure and control the grain size of ZrO2, which in turn improves its mechanical properties and makes it suitable for a wide range of applications [6]. Out of the various stabilized zirconia materials, the ones stabilized with MgO have been found to possess superior fracture toughness, high chemical stability, and excellent ionic conductivity [7,8,9]. MgO-stabilized ZrO2 has found wide applications in various fields such as refractory materials, thermal barrier-coating systems, ceramic electrolytes for oxygen sensors, and dental restorative materials due to its superior fracture toughness, excellent ionic conductivity, and high chemical stability. Consequently, significant research efforts have been directed towards the synthesis of MgO-stabilized ZrO2 powders [10,11], but energy-saving and scalable methods for preparing MgO-stabilized ZrO2 powders still need to be explored [8]. Photocatalysis has gained significant attention in recent years as an environmentally friendly and sustainable technology to address various environmental issues such as air and water pollution [12,13,14]. ZrO2, on the other hand, exhibits high photocatalytic activity due to its unique structural and electronic properties, such as high surface area, large bandgap, and efficient electron–hole separation [15,16,17]. MgO-ZrO2 nanomaterials are a class of mixed metal oxides that have attracted significant research interest due to their unique physical and chemical properties [18,19,20,21]. These nanomaterials are composed of magnesium oxide (MgO) and zirconium dioxide (ZrO2) in varying ratios, depending on the synthesis method used. MgO and ZrO2 are both well-known materials with distinct properties that make them useful in a wide range of applications. MgO is an alkaline earth oxide with a high melting point and excellent thermal stability [22,23]. It is widely used as a catalyst support due to its high surface area and basicity. On the other hand, ZrO2 is a transition metal oxide with high thermal stability, mechanical strength, and excellent chemical resistance [24,25]. It has been utilized in a range of applications such as ceramic coatings, fuel cell membranes, and catalysis [26,27]. The combination of these two materials in a mixed metal oxide provides a material with unique properties that make it attractive for various applications such as catalysis, gas sensors, photocatalysis, and biomedical applications [28,29]. The synergistic effect of MgO and ZrO2 in the mixed oxide can lead to enhanced catalytic activity, increased surface area, improved thermal stability, and higher mechanical strength compared to the individual components. The synthesis of MgO-ZrO2 nanomaterials can be achieved using various methods such as co-precipitation [18,19,30], sol–gel [31], hydrothermal synthesis [32,33], and combustion synthesis [33]. These methods offer control over the composition, particle size, and morphology of the resulting nanomaterials, allowing for tailoring of their properties for specific applications. Overall, MgO-ZrO2 nanomaterials have shown great promise in various fields, and their unique properties make them attractive for further research and development. The synthesis method can significantly influence the properties and performance of the resulting nanomaterials. Thus, the choice of the synthesis method is critical in obtaining MgO-ZrO2 nanomaterials with desirable properties for photocatalytic applications. The MgO-ZrO2 heterostructure has been a topic of interest for researchers due to its unique properties and potential applications. Various analytical techniques have been employed to extensively characterize this heterostructure. X-ray photoelectron spectroscopy (XPS) was used to investigate the surface chemistry and revealed the presence of Mg and Zr elements in their respective oxidation states. XPS has proven to be a powerful tool for analyzing the surface chemistry of materials due to its high sensitivity and ability to detect trace elements. Scanning electron microscopy (SEM) was utilized to analyze the surface morphology of the MgO-ZrO2 heterostructure. SEM is a valuable technique for investigating the topography and texture of surfaces at high magnifications, providing a clear picture of the material’s morphology. UV-spectroscopy was employed to evaluate the optical properties of the heterostructure. UV-spectroscopy is a non-destructive technique that allows for the characterization of the optical properties of materials, including the absorption and transmission of light. The results of UV-spectroscopy provided insight into the bandgap and the absorption properties of the MgO-ZrO2 heterostructure. X-ray diffraction (XRD) was performed to assess the crystallinity of the materials. XRD is a powerful tool for the structural characterization of materials, providing information on crystal structure, phase purity, and crystallite size. The results of XRD analysis provided information on the crystal structure of the MgO-ZrO2 heterostructure. Heterostructures are semiconductor structures with a unique natural structure. A heterostructure is a crucial structure composed of two distinct semiconductor materials mixed together [34]. A common method for assessing the nanomechanical characteristics of nanomaterials [35,36] and thin films [37,38,39] is nanoindentation. Because of its high sensitivity and excellent resolution, this approach makes it easy to determine properties such as nano-hardness, elastic modulus, and elastic/plastic deformation behavior. A diamond tip is used to apply pressure on the specimen until a predefined maximum load or depth is achieved, at which point the force is released. Both the weight placed on the indenter and the indenter’s displacement are continually measured and recorded during the test.
Moreover, nanoindentation testing was carried out to assess the mechanical strength and hardness of the MgO-ZrO2 heterostructure. Nanoindentation testing is a non-destructive technique used to evaluate the hardness of materials, providing an indication of the material’s resistance to deformation under an applied load. The I–V characteristics of the heterostructure were examined to investigate its electrical properties. The results of the I–V characteristics revealed the electrical behavior of the MgO-ZrO2 heterostructure. These various analytical techniques provide comprehensive insights into the structural, morphological, optical, mechanical, and electrical properties of the MgO-ZrO2 heterostructure. This information is useful for understanding the properties and potential applications of the MgO-ZrO2 heterostructure in various fields such as electronics, optics, and energy storage.

2. Materials and Methods
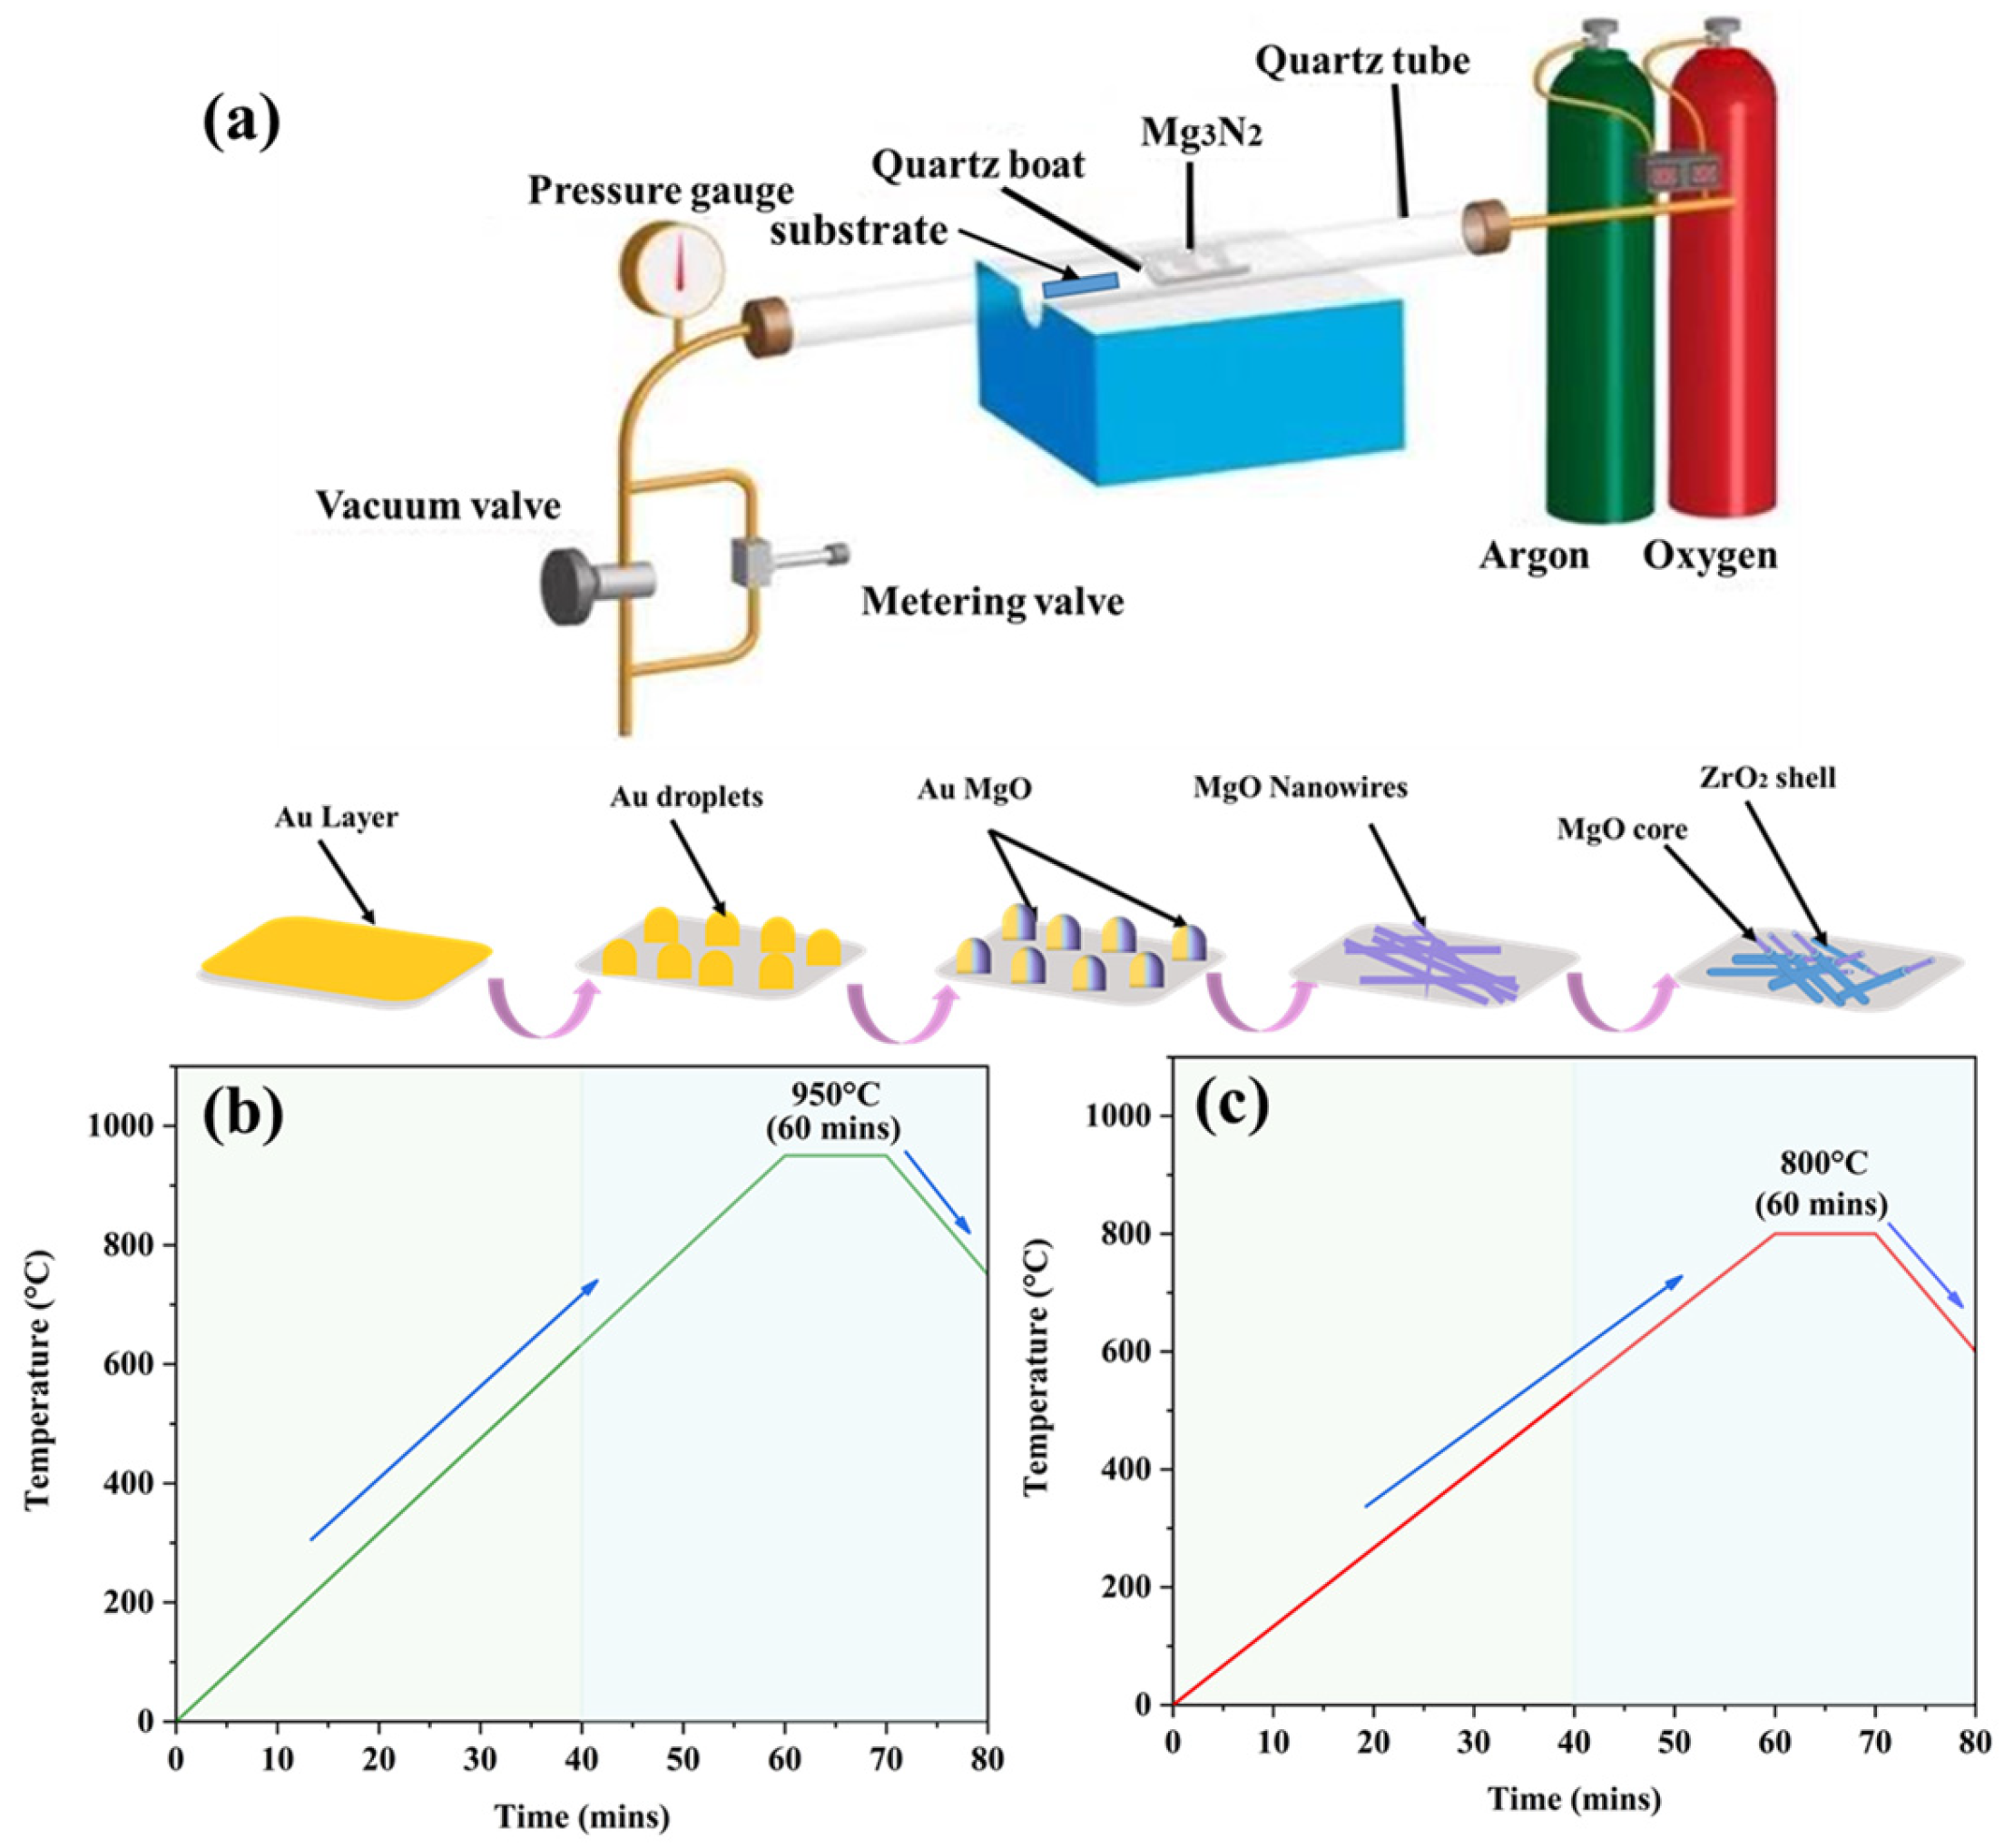
Sample Preparation

Nanowires were synthesized on a silicon (n-type) (100) substrate measuring 11 cm in length using chemical vapor deposition. The surfaces were cleaned with acetone and ethanol using ultrasonic cleaning for 20 min to remove any kind of contaminants from the surface, followed by rinsing with deionized water and air drying. A 2 nm thick gold layer was deposited on the silicon substrate using SEM grid sputtering as a catalyst in the nanowires growth process, helping to initiate and control the nucleation of the nanowires. The gold-coated silicon substrate was placed 10 cm away from 99.99% Mg3N2 powder in a quartz glass boat. The furnace was heated to 950 °C at a rate of 10 °C per minute for 60 min under a reaction pressure of argon flow 100 SCCM, and oxygen with a flow of 160 SCCM was introduced for 10 min after the furnace reached the highest temperature; then, it was cooled naturally, enabling the formation of MgO nanowires, as shown in Figure 1b. In the second step, the substrate coated with the MgO nanowires was placed in the quartz tube using ZrCl4 as a precursor at 800 °C for 60 min, with a nitrogen flow of 100 SCCM and an oxygen flow of 6 SCCM, as shown in Figure 1c. Finally, a heterostructure was created by covering the MgO nanowires with ZrO2. The MgO nanowires serve as the core while the ZrO2 forms the protective shell, resulting in enhanced material properties. Figure 1a shows the schematic of the CVD and deposition process of the MgO-ZrO2 core–shell heterostructure. The growth conditions for the heterostructures are shown in Table 1.
The condensation process can be regulated by adjusting the substrate temperature. At elevated substrate temperatures, the thermal energy and surface mobility of adsorbed molecules increase, promoting improved film diffusion and annealing. However, excessive heat can cause desorption and evaporation of the deposited layer. By carefully selecting the type of gas, growth temperature, catalyst material, and substrate position, various structural configurations of MgO/ZrO2 heterostructures can be achieved. A summary of these possibilities is provided in Table 2.

3. Results and Discussion

3.1. XRD Analysis and Phase Identification

XRD analysis was performed using a Miniflex-600 diffractometer (Rigaku Americas Corporation, The Woodlands, TX, USA) with Cu Kα radiation to examine the crystallinity of MgO-ZrO2. A previous study revealed that pure MgO exhibited the same crystalline phase in all conditions, corresponding to the reference database (ICDD 30-0794). The XRD patterns exhibited characteristic peaks at 2θ values of 37.93°, 41.91°, 61.3°, 65.64°, 71.93°, and 80° with preferred orientations in crystallographic planes (222), (400), (511), (440), (620), and (444), respectively, according to Figure 2. Additionally, the ZrO2 phase (ICDD 34-1084) was identified at 2θ values of 30.27°, 34.25°, 36.11, 51.37°, 52.37°, 56.32°, 59.12°, 62.23°, 64.17°, and 66.20°, with planes diffracted in (111), (022), (200), (202), (202), (122), (103), (113), (311), (222), and (302). The research findings show that the ZrO2 nanowires were fully encapsulated by MgO particles, which form the matrix constituent. The MgO-ZrO2 binary diagram supports this observation, indicating that the tetragonal phase of ZrO2 can contain up to 10% MgO, while the cubic phase can have as much as 27% MgO in solid solution. Furthermore, the XRD analysis revealed the presence of small peaks with low intensity, corresponding to the magnesium zirconate phase (MgZrO3) (ICDD 35-0790). Moreover, the crystallinity of the MgO-ZrO2 nanocomposite was determined by calculating the ratio of the sum of the areas of the most intense peaks to the total area of all the crystalline and amorphous peaks. The resulting crystallinity value was 99.99%. The size of the nanowires in the MgO-ZrO2 nanocomposite was estimated using XRD line-broadening methods and Scherrer’s equation.
d = 0.9 λ β cos θ
The equation used to calculate the nanowires size via XRD line-broadening methods involves the average crystallite size (d), the excess width line of diffraction peaks in radians (β), and the Bragg angle in degrees (θ). The average size of the crystallites was determined to be 130.75 nm and 128.12 nm.
The Williamson–Hall formula was employed to determine the crystalline size of the MgO-ZrO2 nanocomposite, yielding sizes of 129.70 nm and 126.12 nm, respectively. In this equation, the grain size is denoted by d, the FWHM by β, the wavelength of Cu-Kα by λ, and the constant values ε and A are both equal to one. The crystal strain is represented by η, while k is another constant with a value ranging between 0.8 and 1.39.
β cos θ = 0.9 λ d + A ε sin θ = ( k λ d ) + η sin θ  
The W-H equation simultaneously describes crystal strain and grain size, both of which are obtained from peak width. The equation defines the crystal strain as 1/cosθ and crystallite size as tan θ, where θ is obtained from peak width. The slope η is determined by plotting a linear line between (β cosθ) and (η sinθ), and the intercept of this equation is equal to (kλ/d). The results of the Scherrer and Williamson–Hall equations are approximately equal, with an R2 value of 99%.

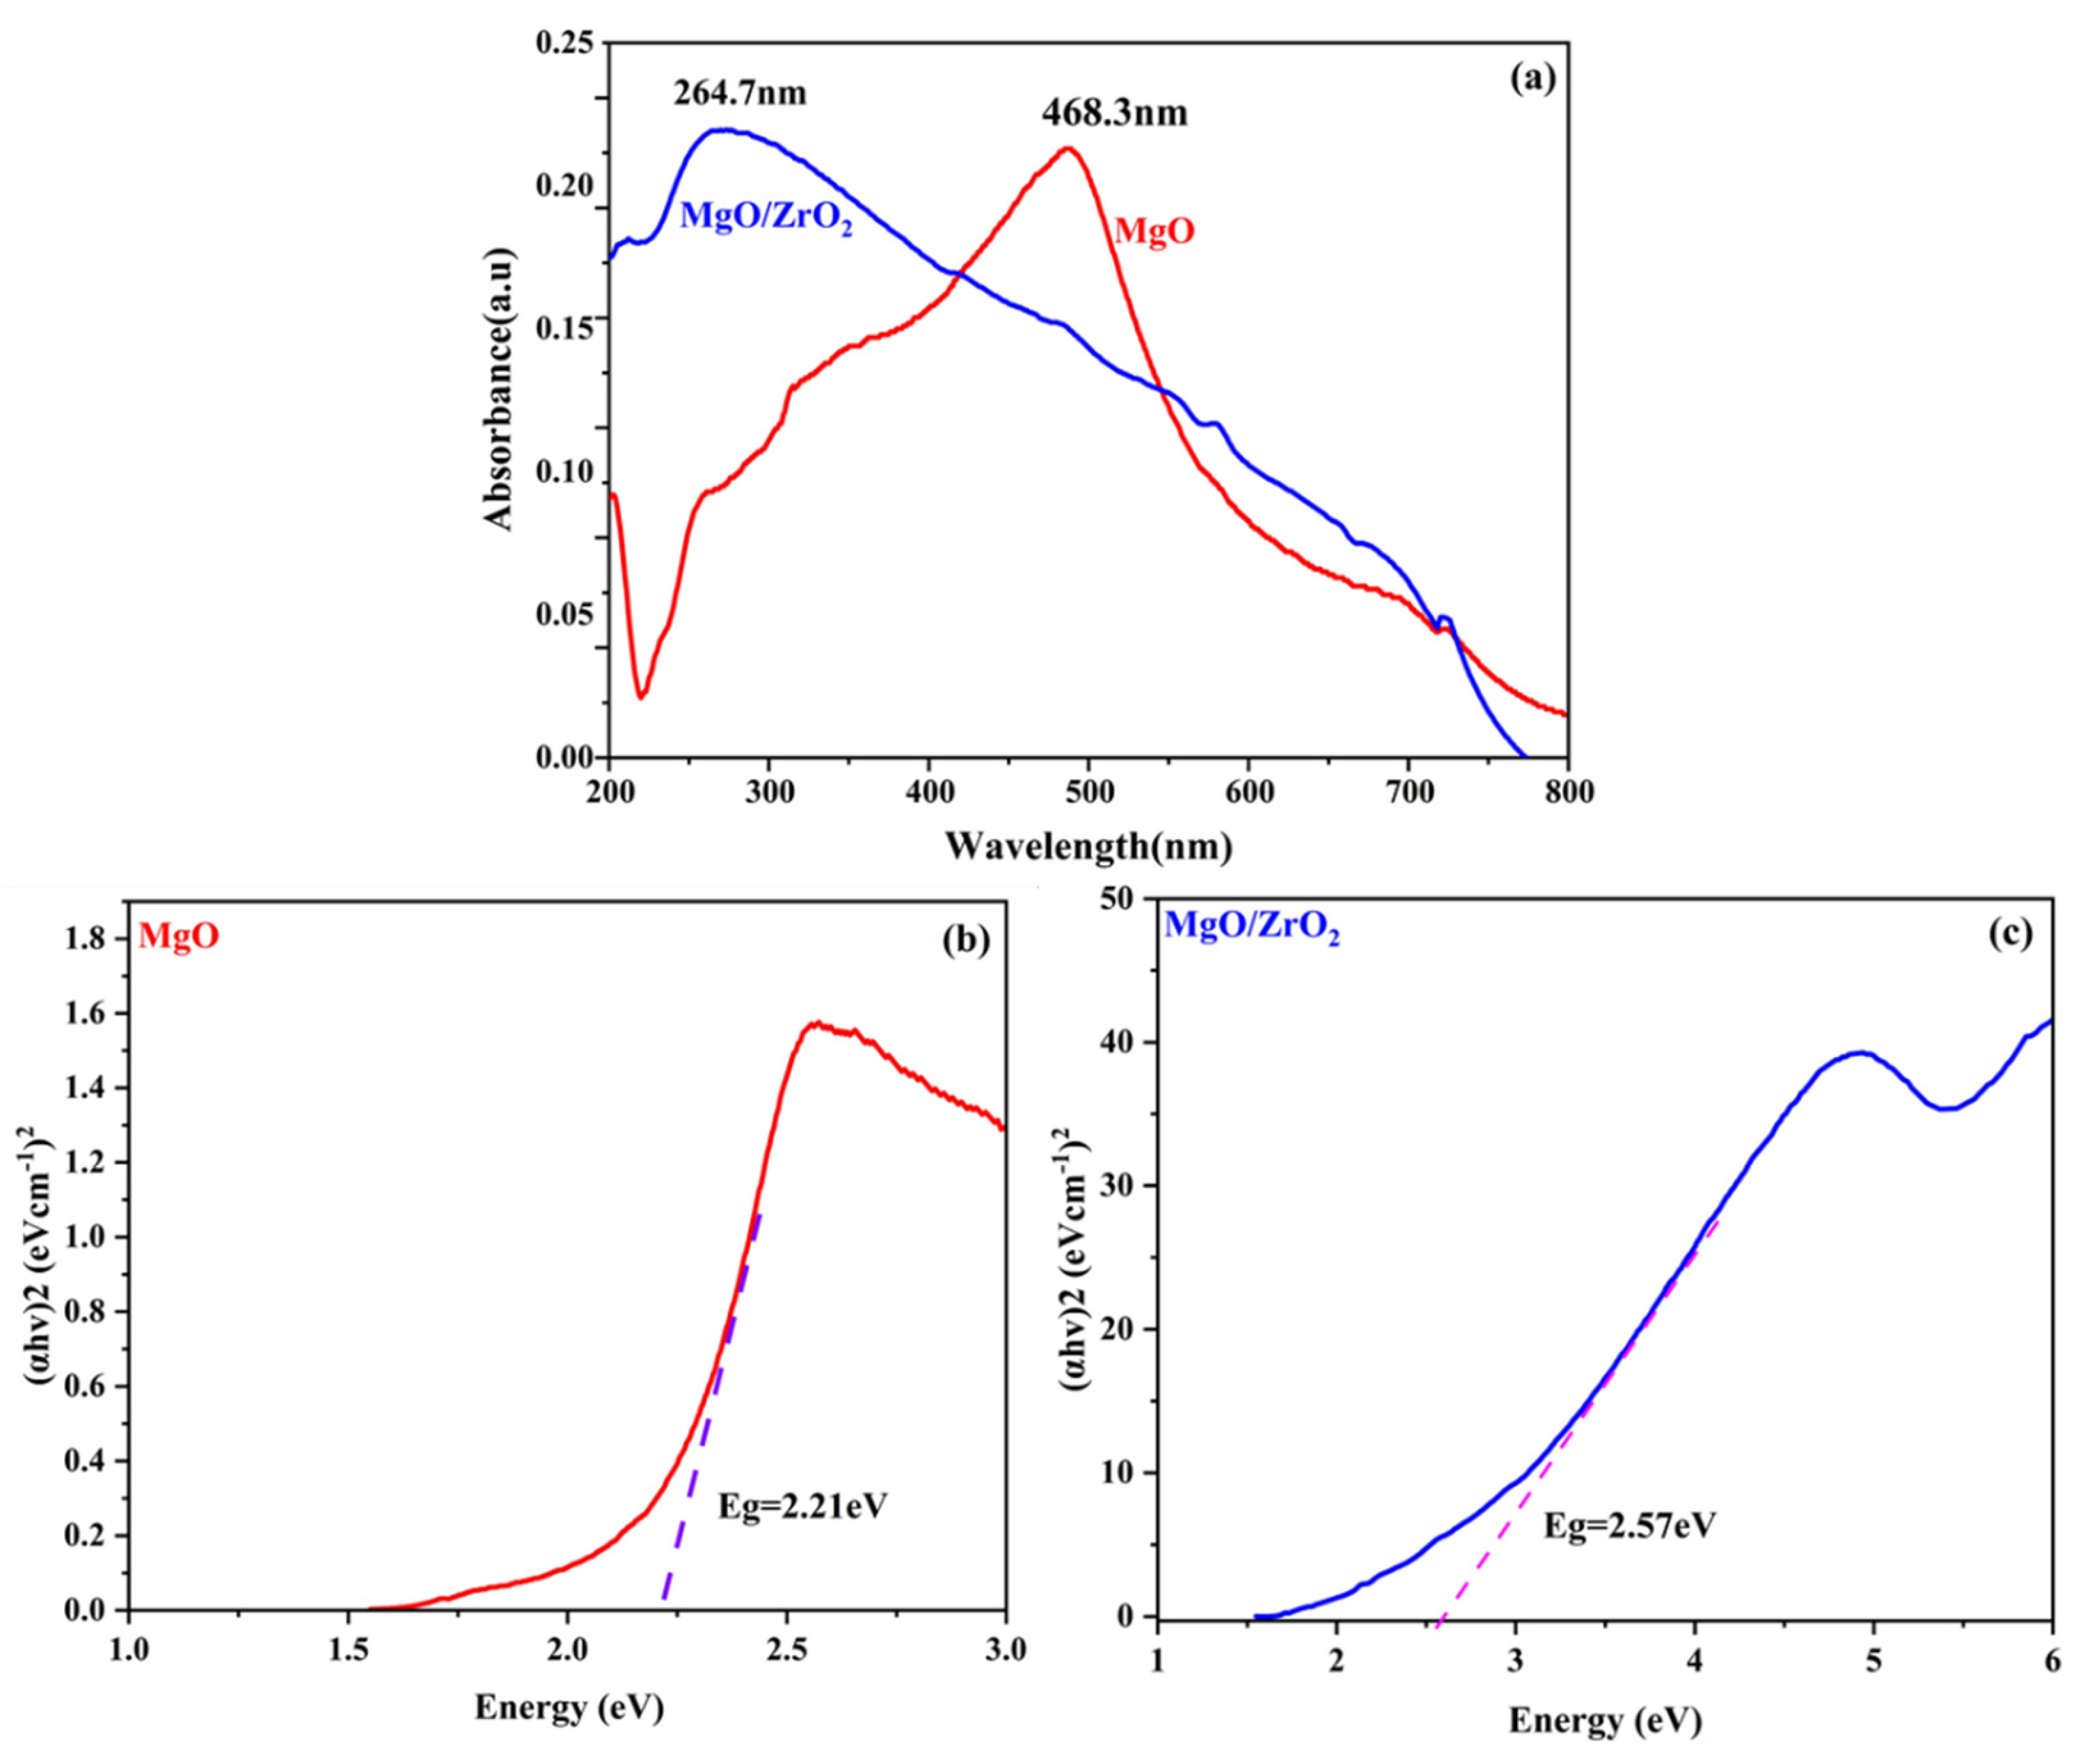
3.2. Optical Properties
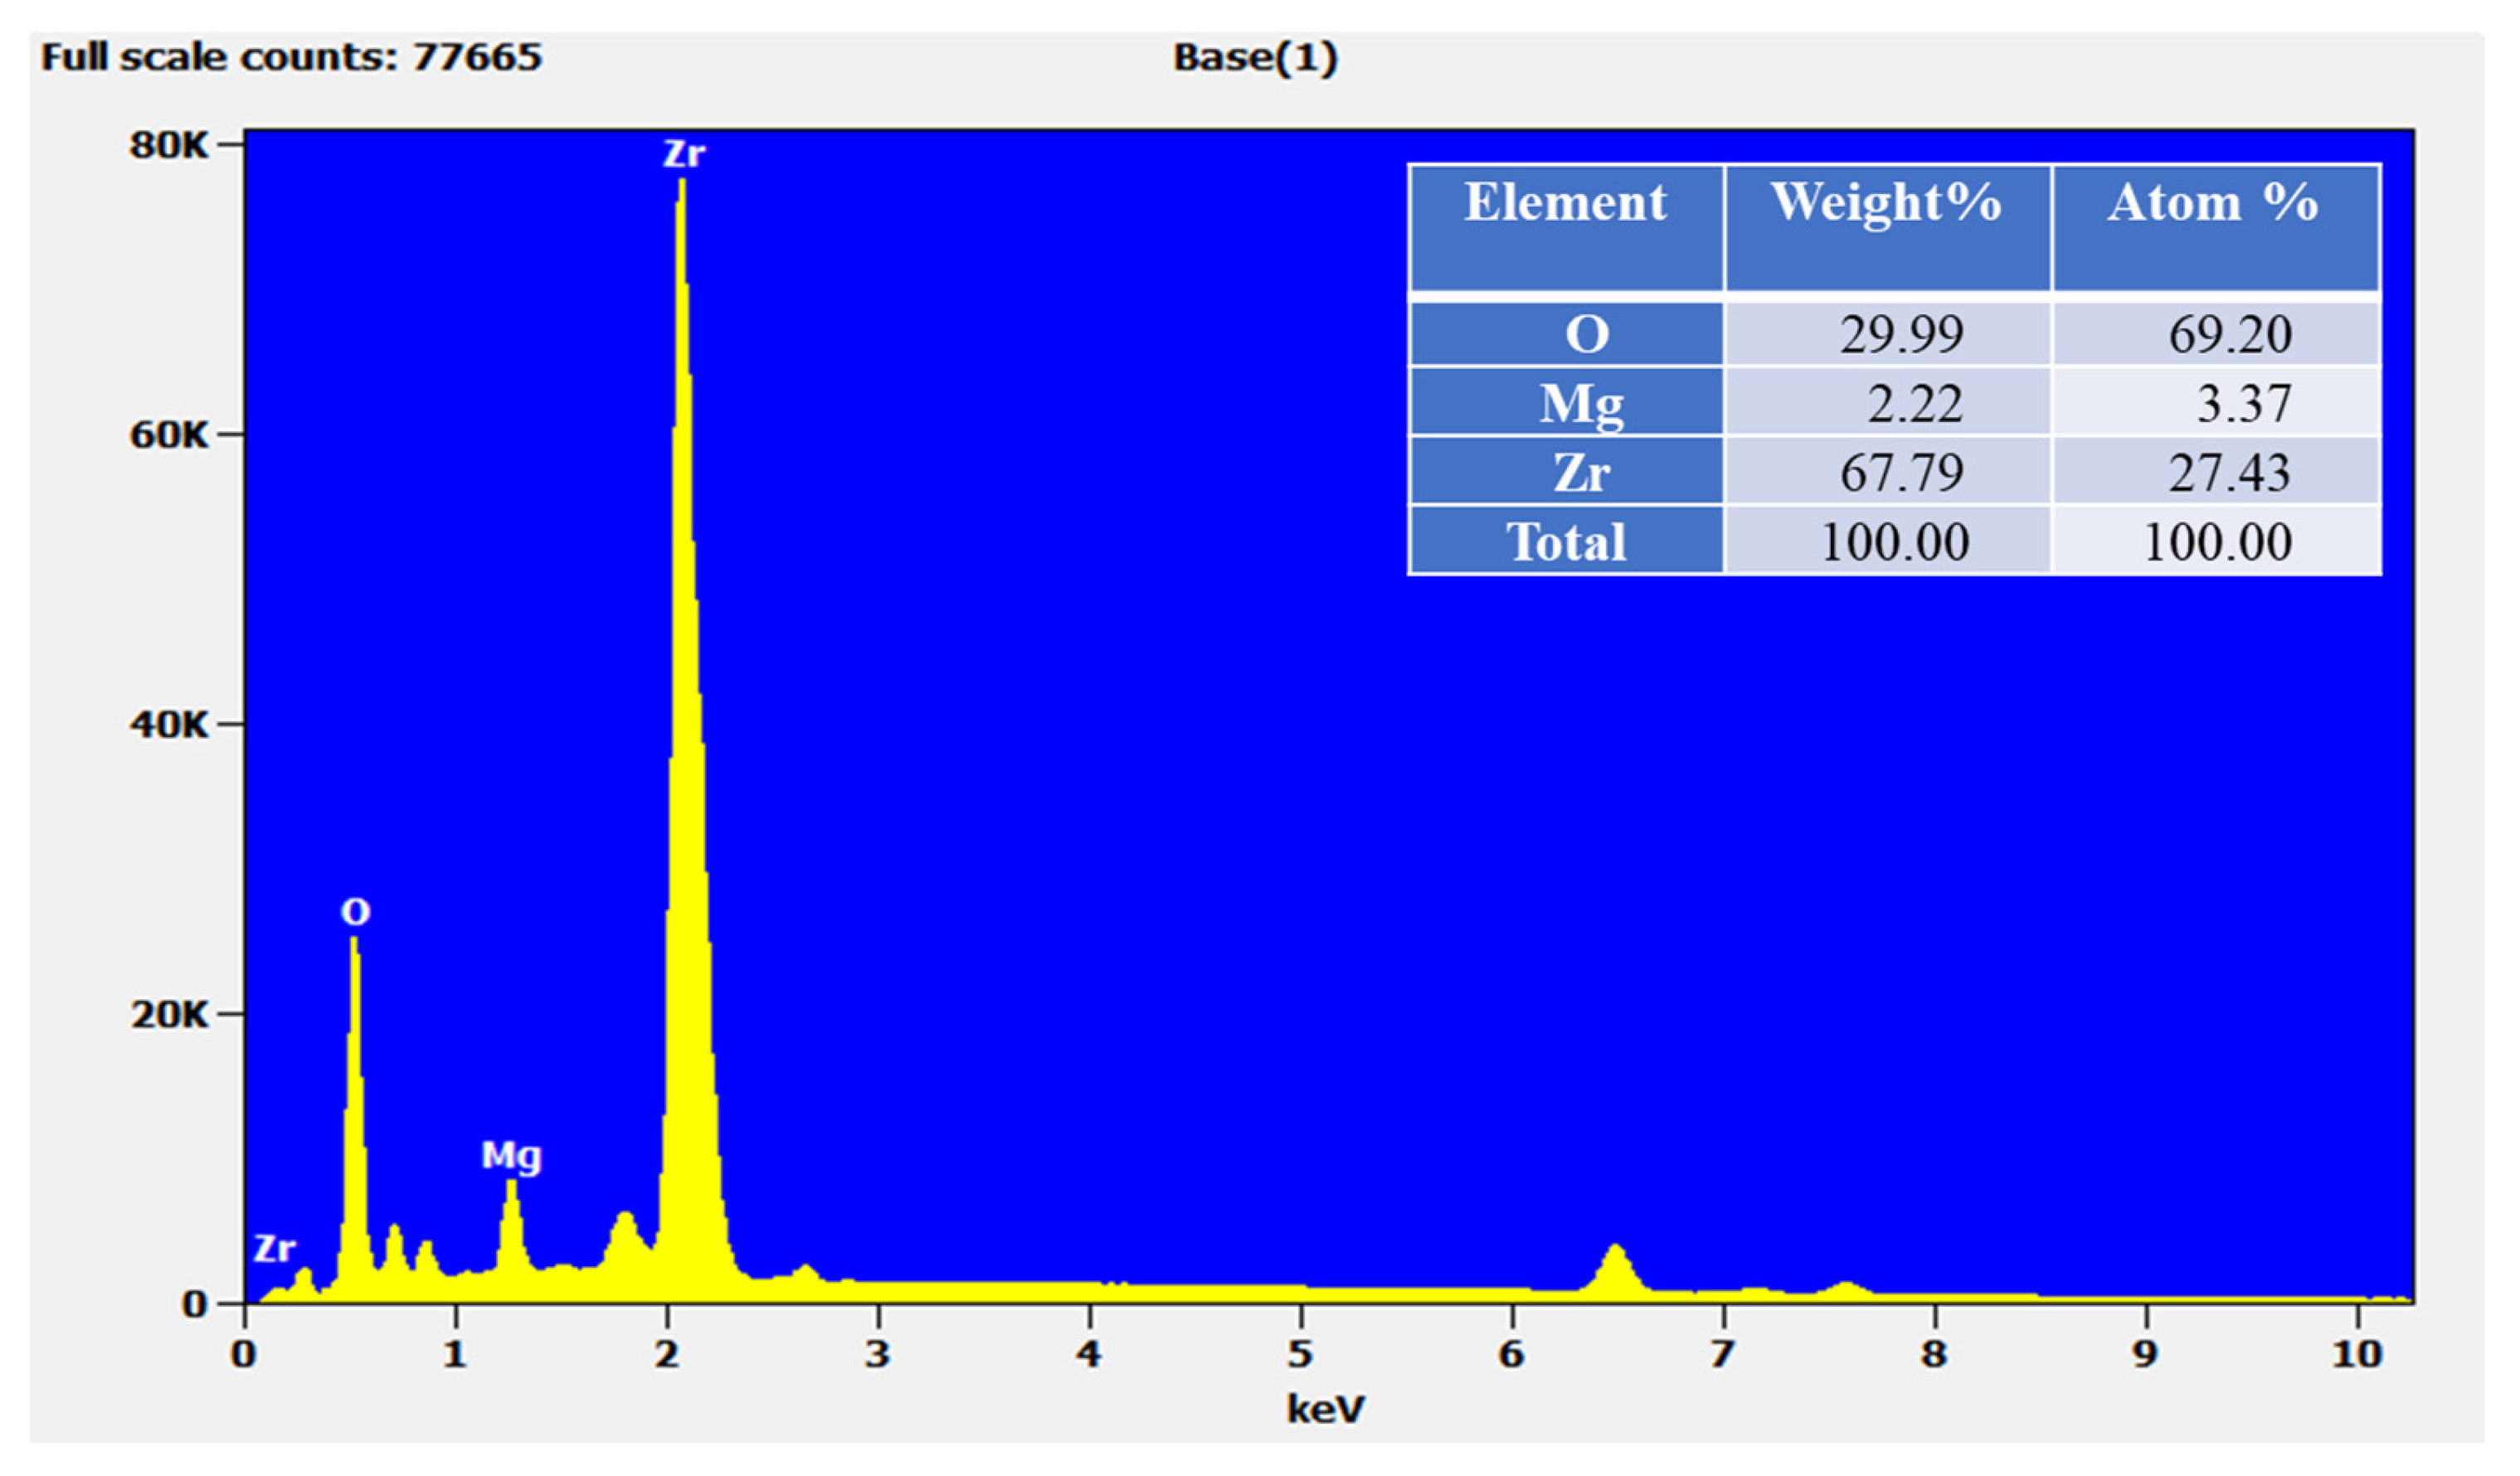
The UV-Vis spectra of pure MgO and MgO-ZrO2 composites were recorded using an Escalab spectrometer (Thermo Fisher, Waltham, MA, USA) and are presented in Figure 3a. The absorption edge of MgO is observed at 468.3 nm. The MgO-ZrO2 composites display a more intense absorption in the ultraviolet region at 264.7 nm due to the absorption contribution of MgO-ZrO2 and the increase in the surface electric charge of the oxides as a result of the introduction of ZrO2. This is beneficial for improving light utilization. The absorbance did not significantly increase as the MgO-ZrO2 content increased from 0.25 to 0.85%. The bandgap of the prepared samples can be estimated using a Tauc equation.
α h ν = A ( h ν E g ) n 2
To estimate the bandgap energy of the MgO-ZrO2 composites, the absorption coefficient α, Planck’s constant h, and frequency of UV-visible light ν were used in the formula, where Eg is the gap between the bottom of the conduction band and the top of the valence band, and n is determined by the type of optical transition (n) = 1 for direct and n = 4 for indirect). By plotting (αhν)2 versus hν and finding the point where α = 0 on the energy axis, the direct bandgap of pure MgO nanowires was calculated to be approximately 2.21 eV based on the nature of the observed absorption edge in the UV-visible spectra. This value is usual for MgO and corresponds to the material’s capacity to mainly absorb light in the visible range; the presence of oxygen vacancies, other point defects, and possible unintentional impurities can introduce defect levels within the bandgap, leading to a substantial reduction in the effective optical bandgap observed in the absorption spectra. The bandgap energy of the MgO/ZrO2 nanowires was 2.57 eV. The band gap of the MgO nanowires increased from 2.21 eV to 2.57 eV after depositing ZrO2, as shown in Figure 3c. This is likely because the ZrO2 layer acts as a barrier to electron tunneling, which effectively increases the band gap of the MgO nanowires, and the ZrO2 layer affects the electronic structure of the MgO nanowires. ZrO2, being a wide-bandgap material itself, can introduce changes at the MgO-ZrO2 interface that influence electron behavior.
The incorporation of ZrO2 affects the enhanced optical properties of MgO and mainly the absorptive coefficient for UV light. This change suggests that the substance is better suited to applications such as photocatalysis and UV sensors and shielding, where an interaction between the UV light is desired. The formation of the MgO-ZrO2 heterostructure by electronic alteration may enhance charge separation and raise UV absorption for photocatalytic and optoelectronic application and enhance efficiency. As such, the optical characteristic determined herein afford insights into the enhanced performance of the heterostructure in various light-driven applications.

3.3. EDS Analysis

It is crucial to understand the surface topology of the MgO-ZrO2 nanocomposite material since it significantly impacts its catalytic performance. The nanomaterial content of the MgO-ZrO2 nanocomposite was verified through an EDX spectrum analysis. Figure 4 displays clear peaks from the Zr atoms in the nanowires, which are observed at 2 keV. Additionally, the presence of the optical absorbance band at 1.5 keV reveals the presence of Mg nanowires. The element’s composition was briefly studied via EDS analysis and further displayed in the figure.

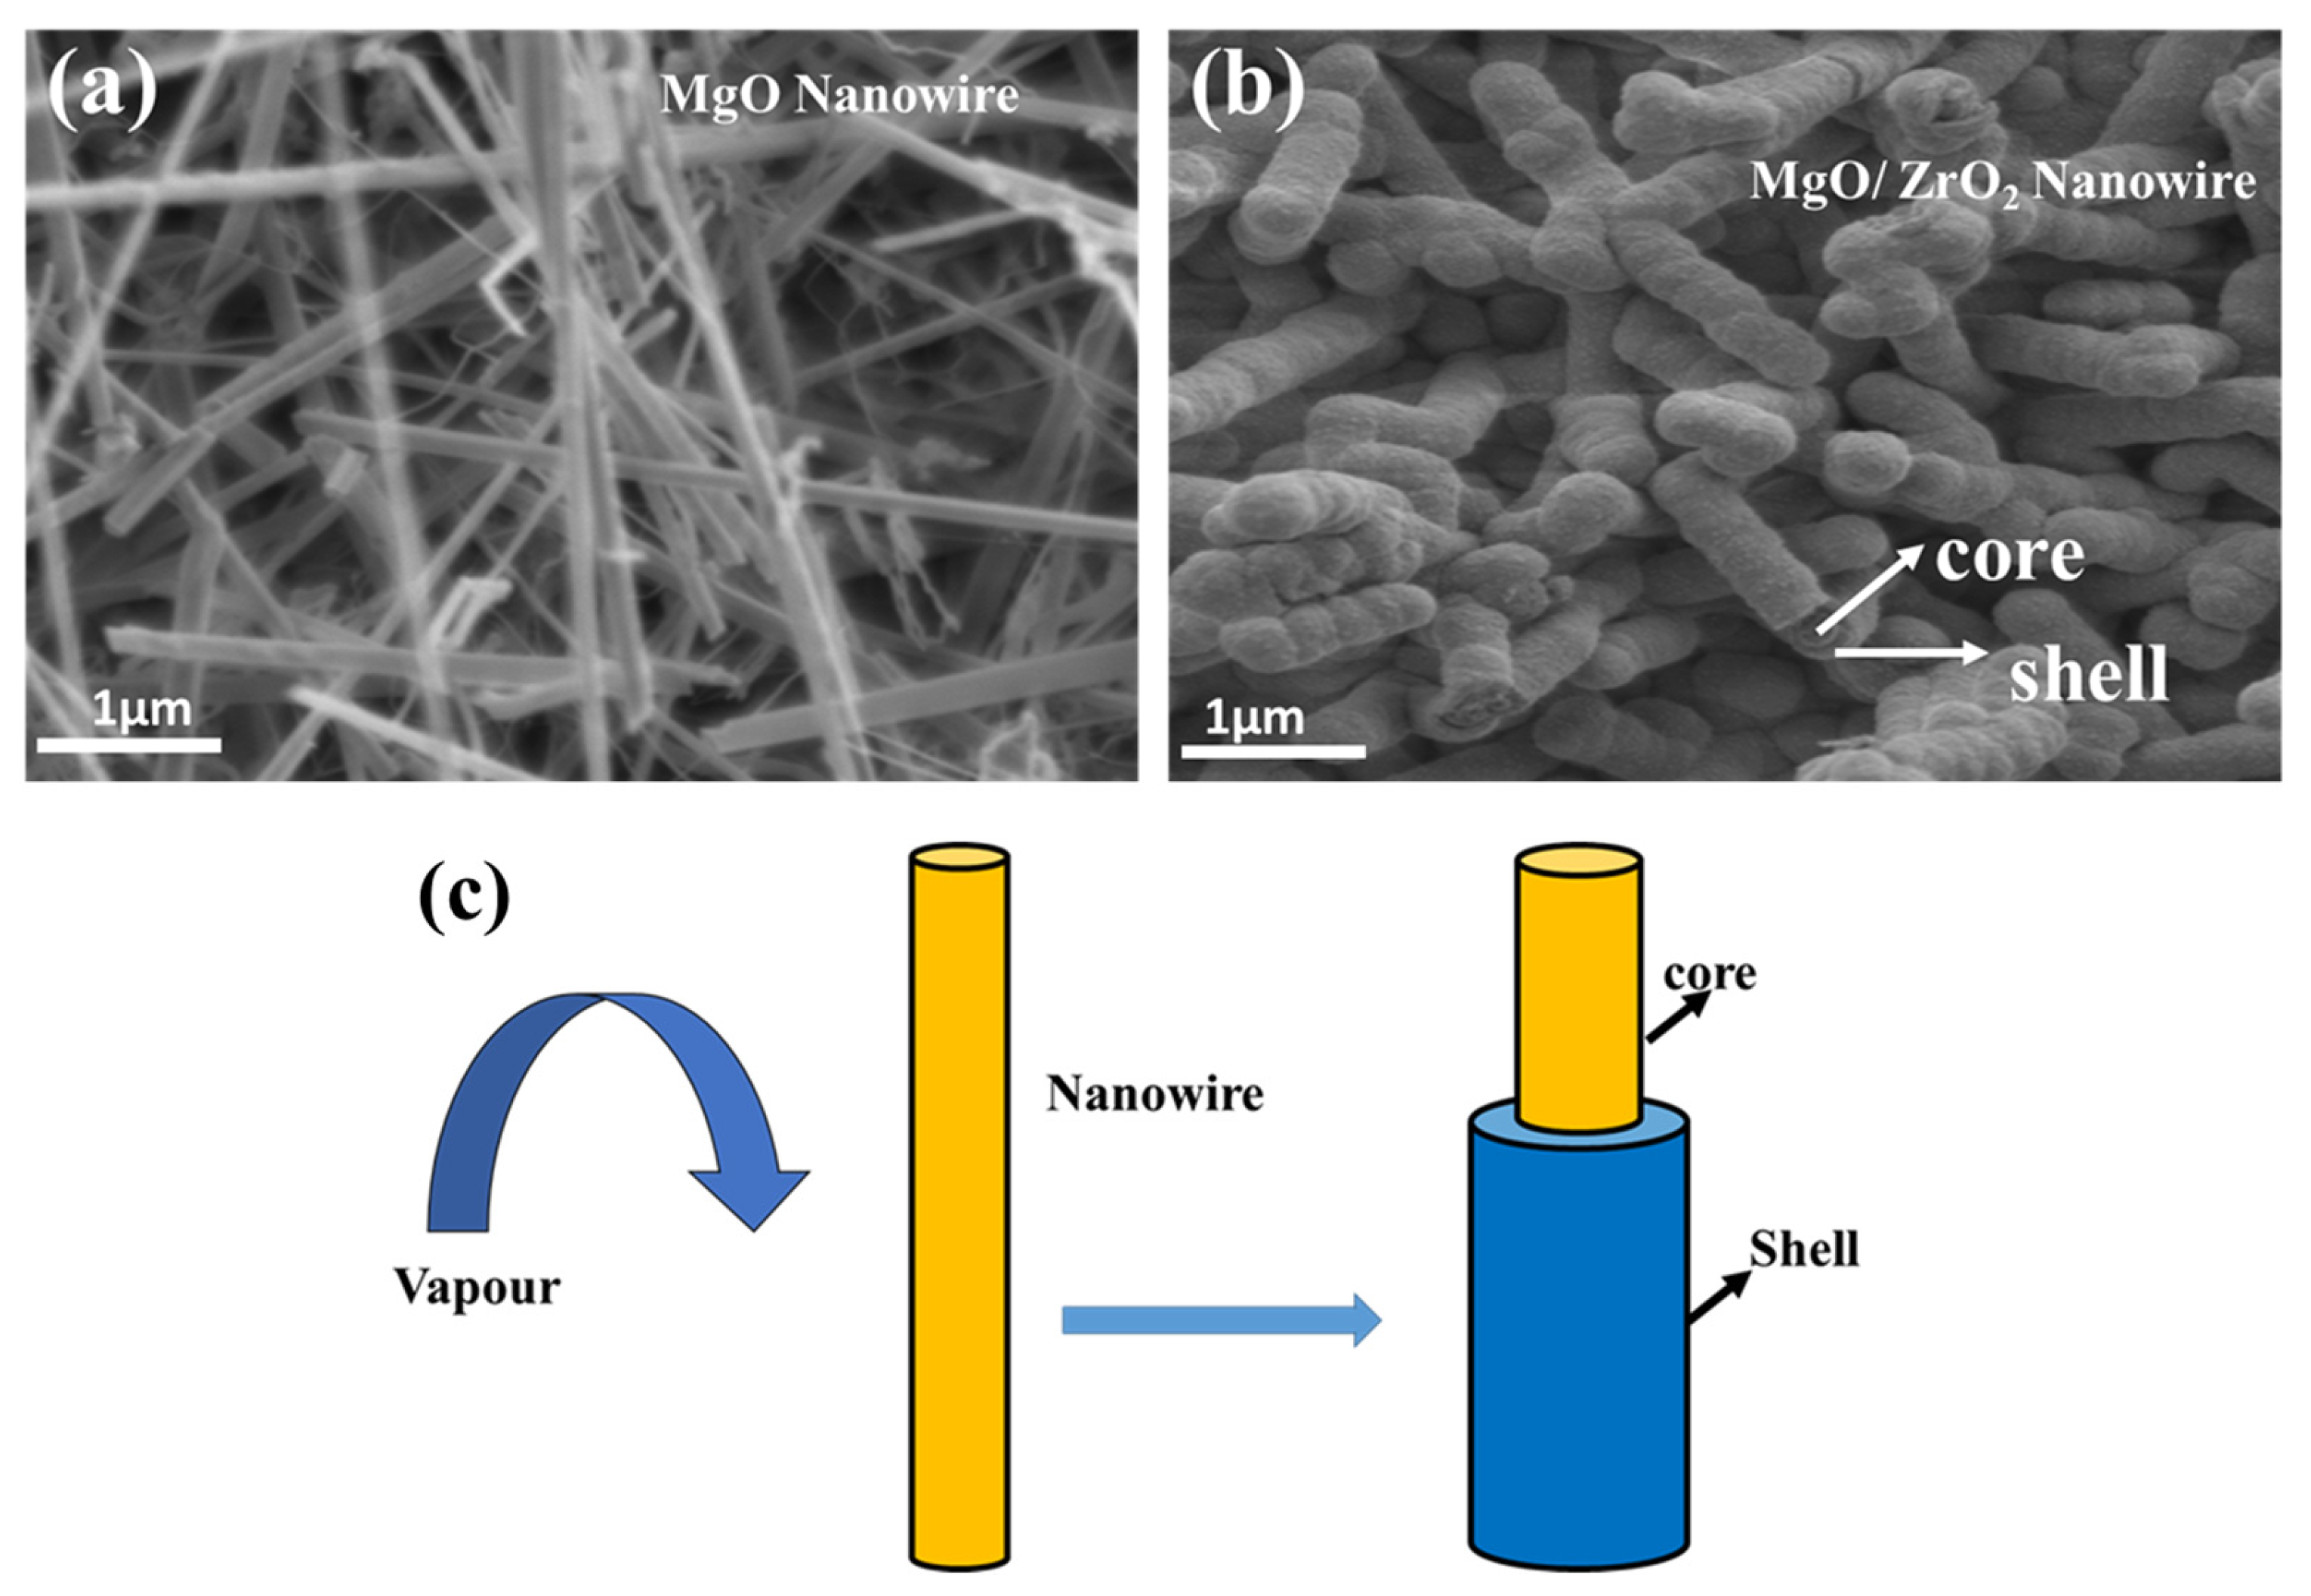
3.4. Morphological and Compositional Analysis

To characterize the size, shape, and morphologies of the formed MgO nanowires, scanning electron microscopy (EV018) was utilized. The resulting SEM image of the sample is displayed in Figure 5. The morphology of the MgO-ZrO2 heterostructure material was observed more clearly, and the nanowires of the MgO were observed as shown in Figure 5a. In Figure 5b, MgO shows in the core and how the ZrO2 nanowires spherically covered the MgO and act as shell around it. Figure 5c represents a systematic image which more clearly shows that the MgO nanowires act as a core while ZrO2 acts as a shell indicated with a blue color. The ZrO2 covers the MgO nanowires in a spherical manner, meaning that the ZrO2 layer evenly coats the MgO rather than being patchy or irregular. Moreover, the MgO and ZrO2 nanowires reveal circular and poly-dispersed particle shapes, which means the particles vary in size and shape, reflecting a certain level of heterogeneity in their formation. Despite being nanowires, they exhibit poly-dispersity, which refers to a mixture of sizes or shapes rather than to a uniform distribution. The observed nanowires have a diameter between 1.04 μm and 93 μm. This broad range of thickness implies that the nanowires are synthesized under conditions that permit their dimension to be controlled, to a certain extent, by factors such as temperature, time, or concentration of precursor, among others. The fact that the structures are larger in size also indicates that the wires could have perhaps grown longer as a result of the longer reaction time or higher growth rates. These findings provide valuable insights into the physical characteristics of the nanowires, allowing for a more thorough understanding of their potential applications.
The SEM analysis gives a clear understanding of the size, shape, and morphology of the MgO and MgO-ZrO2 nanowires. The elemental configuration of MgO as the core layer with ZrO2 as a layer which surrounds this core layer greatly improves the features of the material, including the surface area, electrical properties, and thermal co-efficient of the material. These morphological features put the heterostructure nanowires in a good position for use in catalysis, sensors, and optoelectronics, where these characteristics are desirable to enhance performance.

Transmission Electron Microscopes (TEM)

The TEM (JEM-2100F and Tecnai G2 F30) images of the MgO-ZrO2 solid base provide a clear view of the sponge-like mesoporous network. As shown in Figure 6, the particle size of the nanowires was approximately 10 nm and uniform in size. The particles were linked in a three-dimensional structure to form the mesoporous framework, with pore sizes ranging from 5 to 10 nm. A high-resolution TEM photograph demonstrates the presence of nanocrystals tethered to each other, which formed the mesoporous nanowires.
The TEM analysis shows two materials labeled as c and d. The TEM image in Figure 6a shows these two materials, and an SAED pattern is shown in Figure 6b,c, which was used to determine the crystal structure of the nanowires. The SAED pattern was divided into two categories and labeled with yellow and red dots, as shown in Figure 6. In Figure 6c, the portion labeled as C (in red color) was recorded perpendicular to the nanowire long axis and can be indexed for the [2 0 2] zone axis of crystalline MgO. The length direction is supposed to be along the [2 2 0] direction, and the HRTEM image in Figure 6c shows the good crystallinity of material c. The interplanar spacings are about 0.1524 nm. In Figure 6d, the portion labeled as D (in yellow color) was recorded perpendicular to the nanowire long axis and can be indexed for the [2 0 2] zone axis of crystalline ZrO2. The length direction is supposed to be along the [1 1 1] direction, and the HRTEM image in Figure 6d shows the good crystallinity of material d. The interplanar spacings are about 0.2687 nm, corresponding to the (1 1 1) plane of monoclinic ZrO2. Overall, Figure 6 shows that materials c and d have different crystal structures, with material c identified as crystalline MgO with a cubic crystal structure, while material d is identified as crystalline ZrO2 with a monoclinic crystal structure.
The SAED pattern and HRTEM image were used to determine the crystal structures and interplanar spacings of the materials.

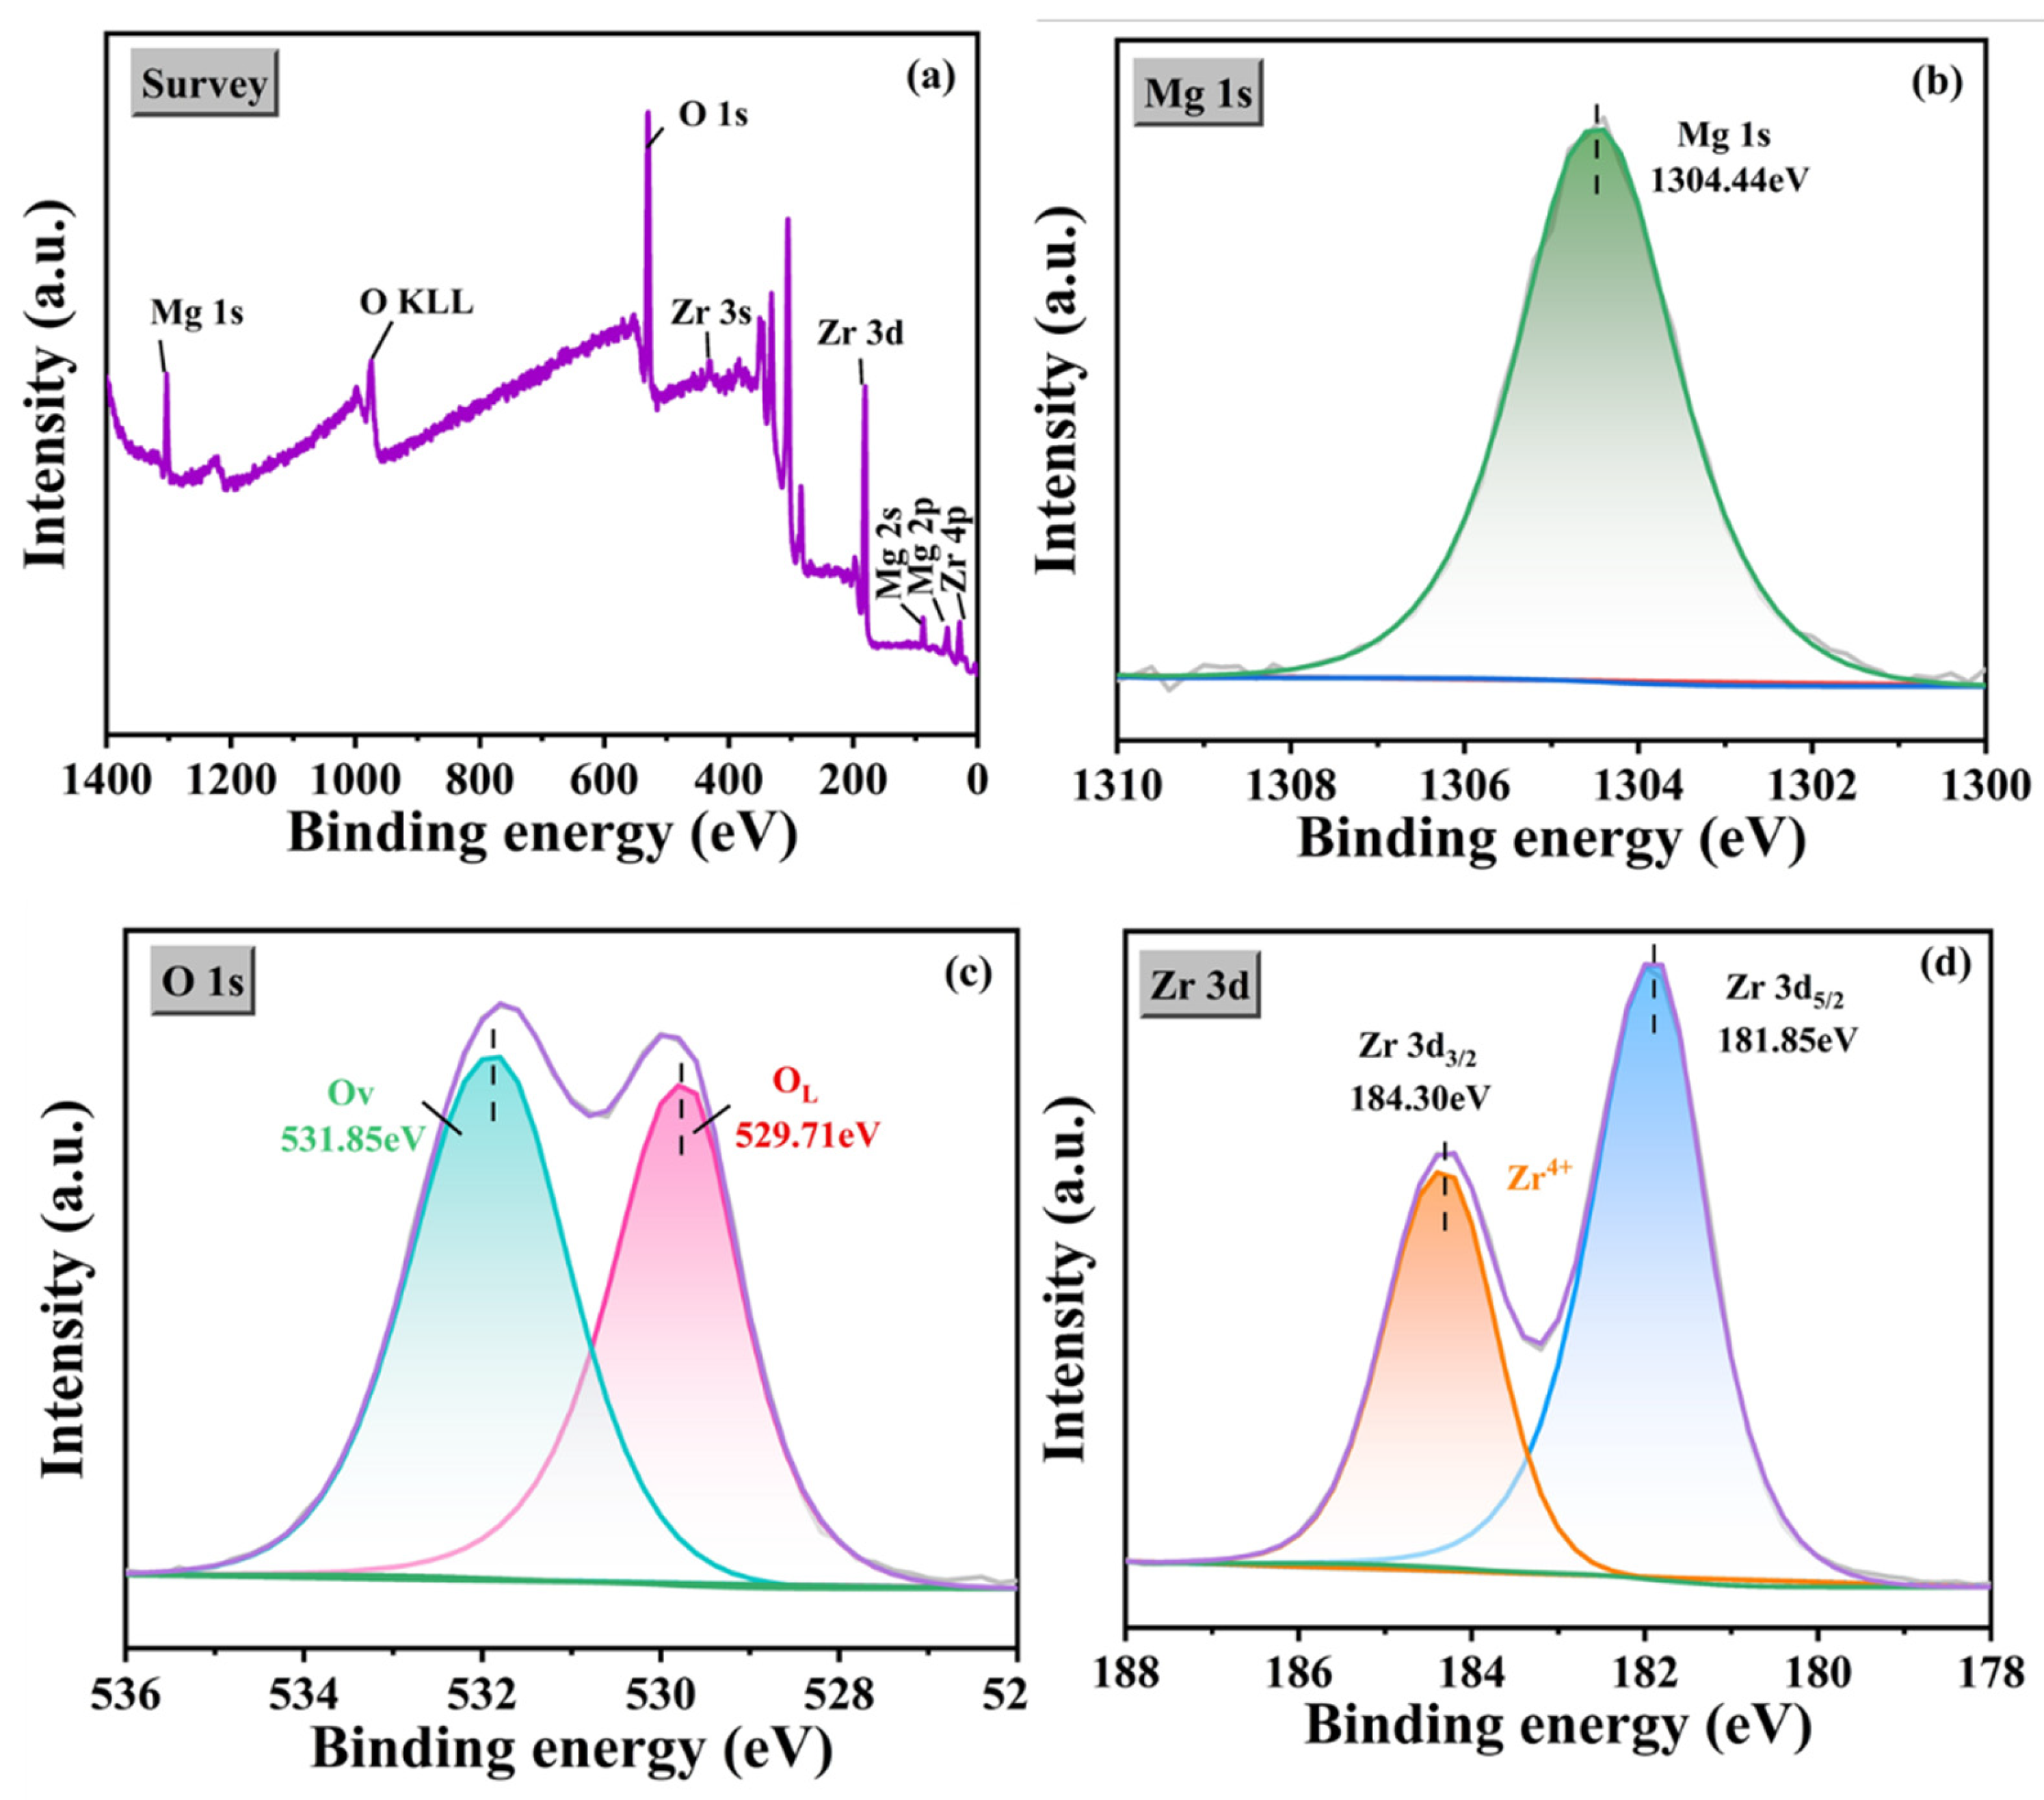
3.5. Chemical State Analysis

To corroborate the results obtained from the XRD analysis, an XPS (Escalab 250Xi spectrometer Thermo Fisher) analysis was conducted in this study. After careful consideration, the sample was studied using high-resolution XPS spectra after the sintering process, as shown in Figure 7. The peaks of the binding energy of Mg 1s and O 1s for MgO are depicted in Figure 7b,c, respectively. On the other hand, Figure 7d exhibits the high-resolution spectra of the zirconia nanowires powders before they were integrated into the matrix (MgO). In this case, two peaks are visible, which are ascribed to the Zr 3d components of spin–orbit splitting (three d5/2 and three d3/2 orbitals), with binding energies of 181.85 eV and 184.30 eV, respectively. The energy difference between the Zr 3d doublets, ΔE, corresponds to 2.45 eV. The image inserted in Figure 7c presents the high-resolution O 1s peaks in the binding energies at 529.71 eV and 531.84 eV, corresponding to ZrO2 nanowires and the carbon tape. Overall, the XPS technique identified changes in the chemical states of the analyzed samples’ elements (Mg, O, Zr). The MgO-ZrO2 phase formed during the sintering process led to significant changes in Mg, O, and Zr. According to the literature in Table 1, the bond energies detected at 529.71 eV and 531.85 eV for oxygen represent the formation of the MgO-ZrO2 phase. Furthermore, Mg and Zr displayed shifts towards lower bond energies, corresponding to a reduction in each element. Binding energy corresponds to Mg 1s and Zr 3d are mentioned in Table 3.

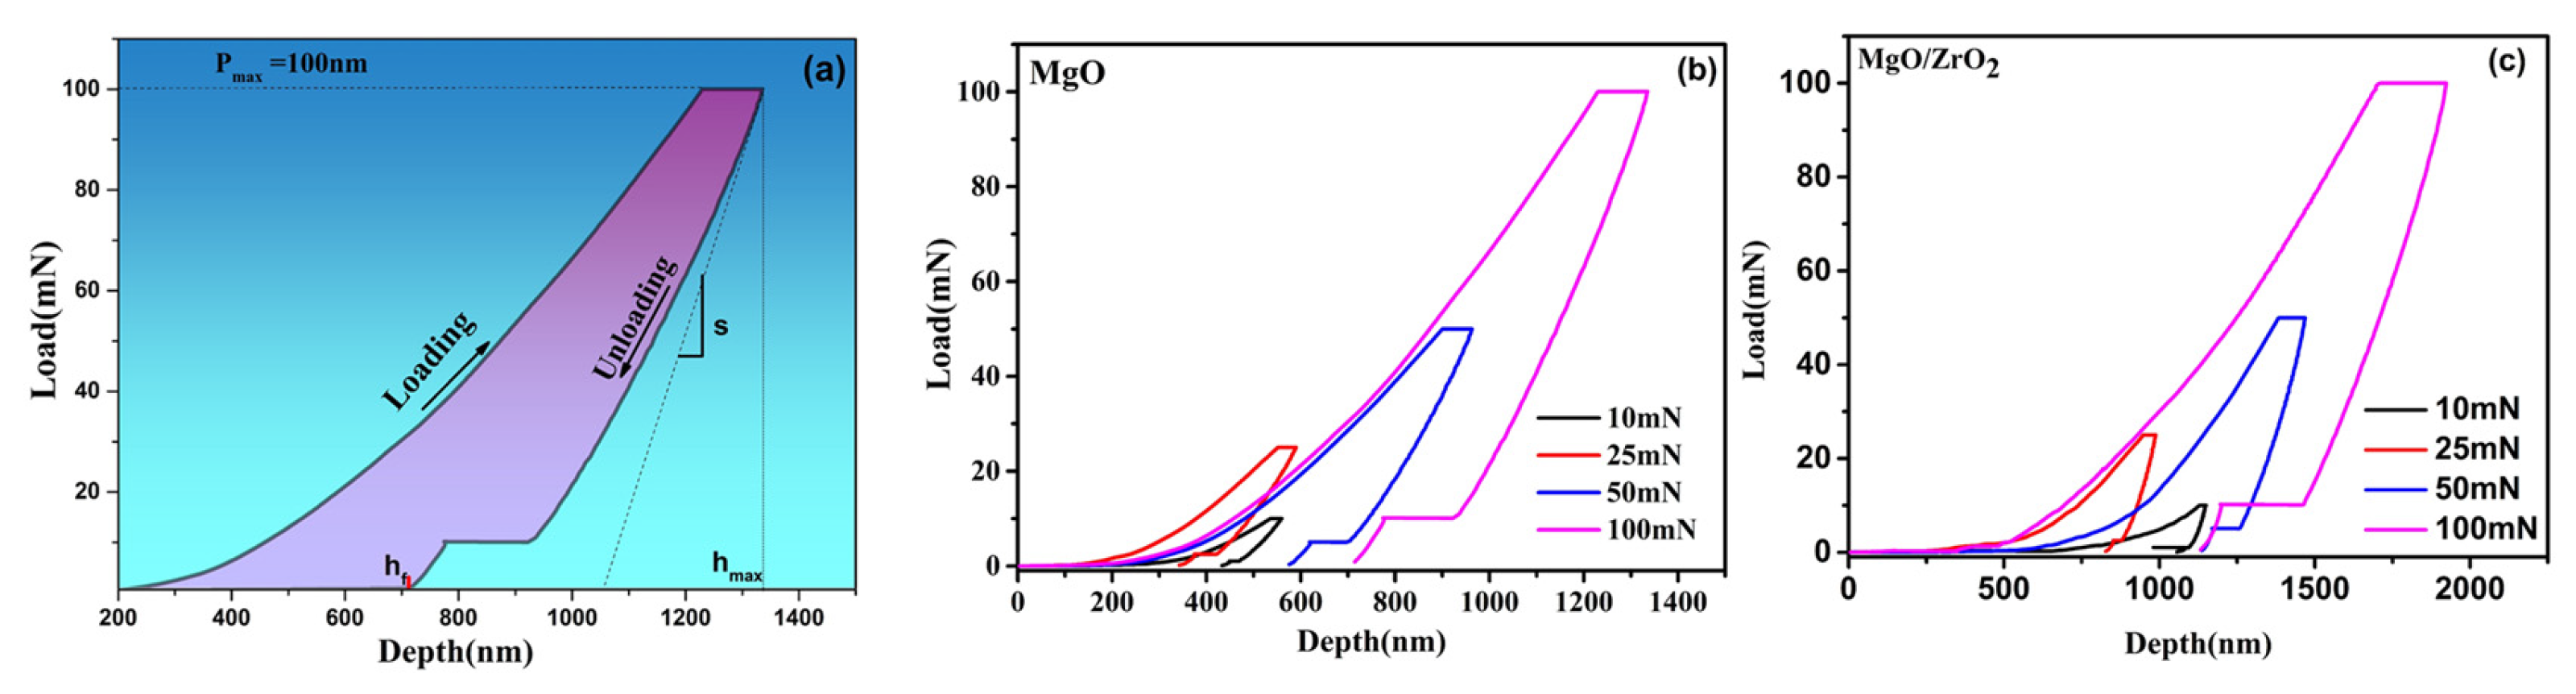
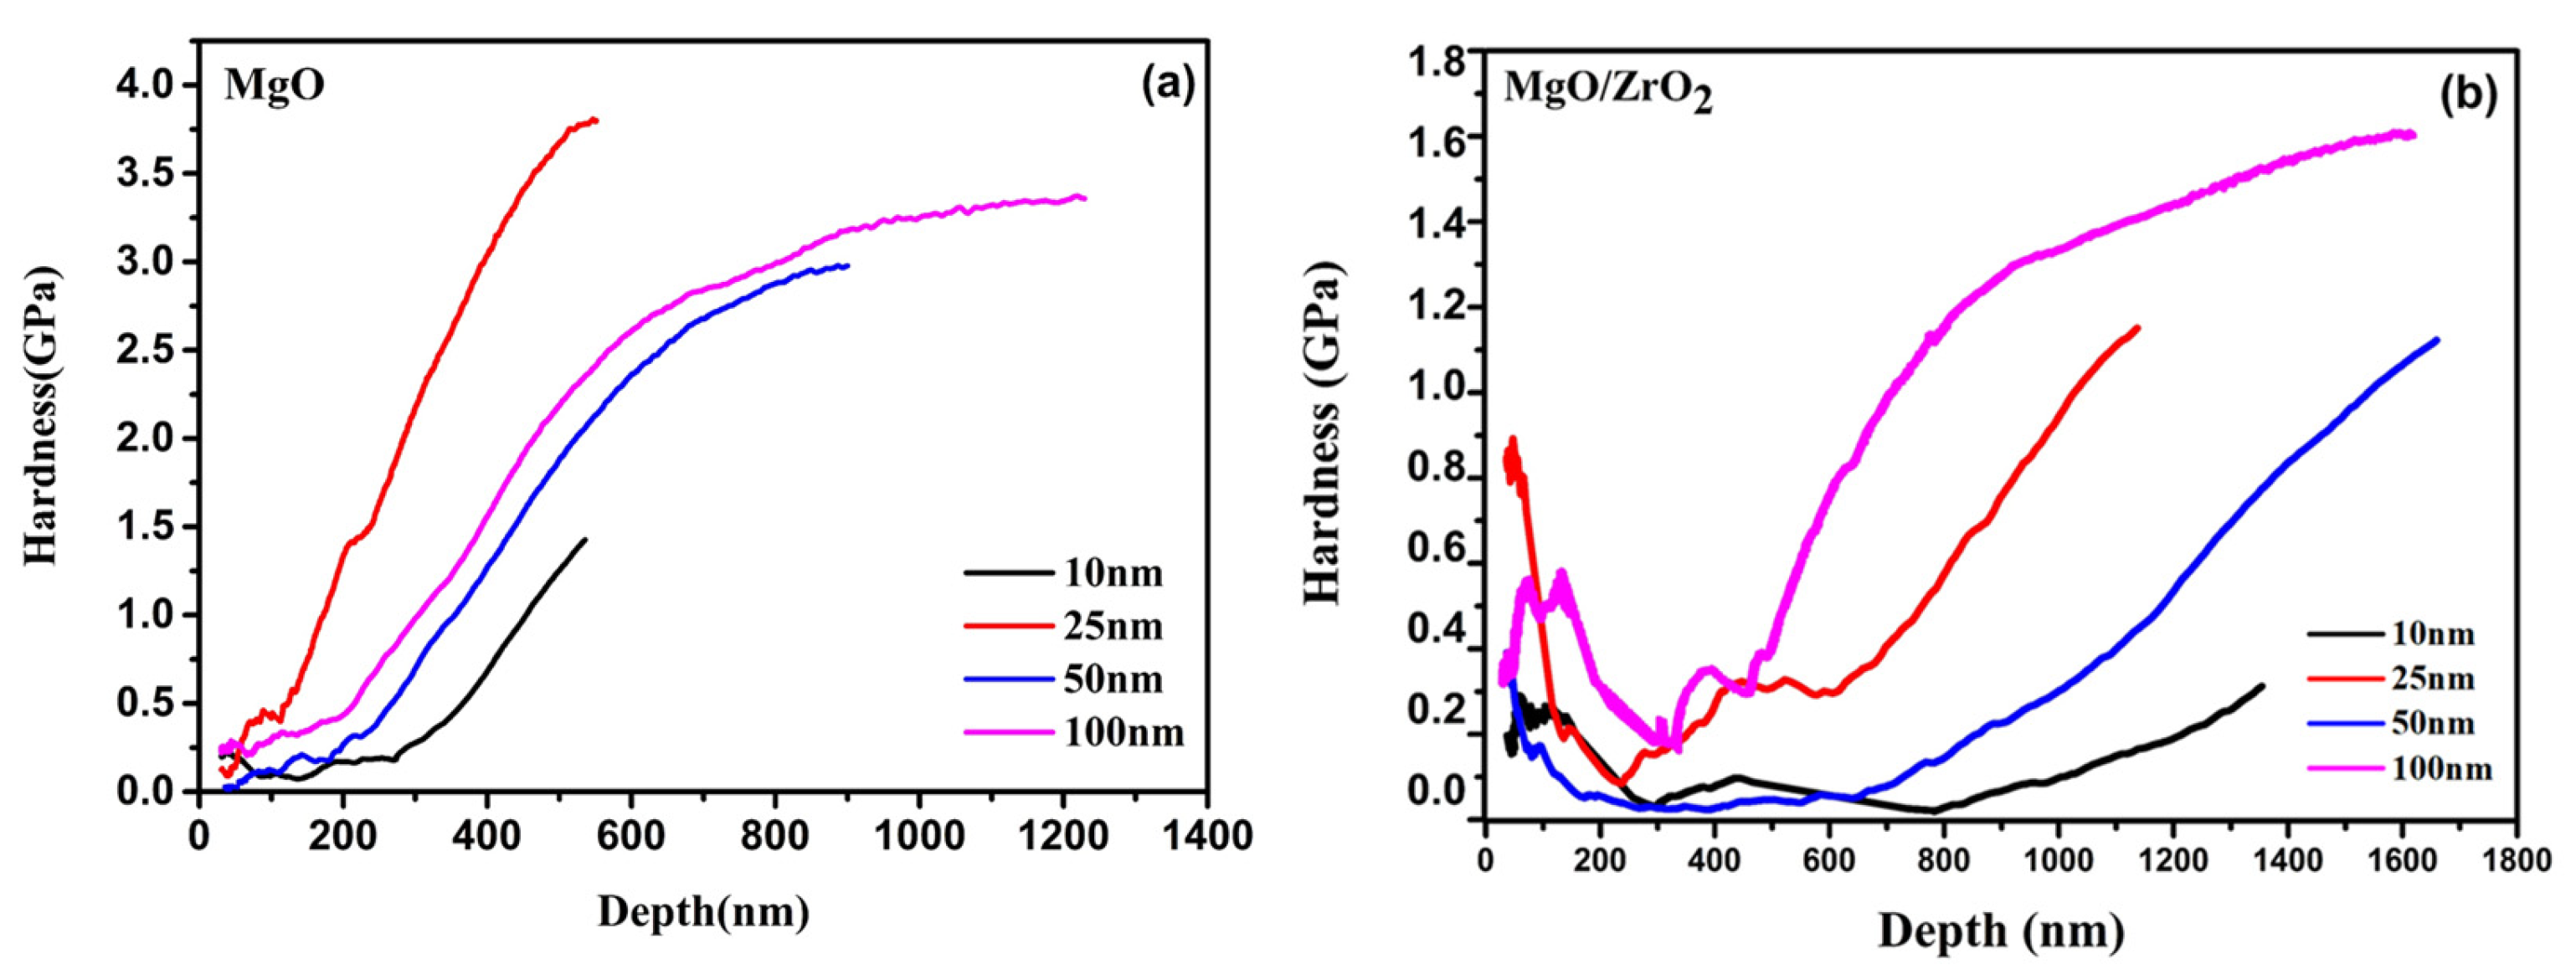
3.6. Mechanical Properties

The mechanical properties of engineering materials include properties like strength, elasticity, plasticity, ductility, brittleness, stiffness, hardness, and toughness. These properties characterize the behavior of such materials when in use under different forces and conditions. The graph in Figure 8 displays the load–displacement behavior of the MgO and MgO/ZrO2 nanowires, depicting a complete loading–unloading cycle. The loading phase can be characterized by three distinct stages. Initially, there is a gradual increase in the load applied on the nanowires, followed by a sudden drop in slope resulting in a flat curve. Finally, the third stage shows an increasing load being applied to the nanowires. Figure 8 exhibits the load–depth and hardness–depth that were obtained through the nanoindentation method using the continuous stiffness model. Figure 8a demonstrates a load–depth curve with a load of 100 mN, presenting both the elastic and plastic deformation that transpired when the indenter entered the sample, creating a hardness impression identical to the indenter’s shape. As the indenter was withdrawn, only the elastic part of the displacement returned to its original state, allowing for an elastic solution for modeling the contact process [25,26]. The maximum depth at the peak load (Pmax) is represented by hmax in Figure 8a, while S shows the initial unloading contact stiffness defined by Sneddon.
S = d P d h = 2 A π E r = 2 24.5 h c π E r
The final depth of contact (hf) after the complete unloading process and the contact area (A), which can be calculated using the equation ( A = 24.5 h c 2 ), are important parameters to determine the mechanical properties of the sample. The contact depth (hc) between the indenter and the sample under a load is crucial to calculate the maximum indentation depth. Meanwhile, the reduced elastic modulus (Er) considers both the elastic deformation occurring in the indenter and the sample. Figure 8a,b shows the load and depth curves for MgO and MgO/ZrO2. These essential parameters can be determined by using Equations (5) and (6), which, respectively, calculate the contact depth (hc) and the reduced elastic modulus (Er).
h c = h m a x ε P m a x S
1 E r = 1 σ 2 E + 1 σ i 2 E i
The equation for nanoindentation of samples involves several variables, including a constant, ε, which depends on the geometry of the indenter being used. For example, a Berkovich indenter has a value of ε equal to 0.75 [25]. Additionally, the equation includes two other key variables, the elastic modulus, E, and Poisson’s ratio, σ, both of which are specific to the sample being tested.
To accurately measure the mechanical properties of different samples under varying conditions, micromechanical tests were conducted using nanoindentation. The maximum loads used during these tests ranged from 10 to 100 mN. The elastic modulus and Poisson’s ratio for the diamond indenter were also taken into consideration to ensure the accuracy of the results. The elastic modulus for the diamond indenter, Ei, was measured at 1141 GPa while its Poisson’s ratio, σi, was measured at 0.07 [25]. By conducting tests with different loads and verifying the consistency of the hardness and Young’s modulus at various positions, researchers were able to obtain a comprehensive understanding of the mechanical properties of the samples under study.
MgO and MgO/ZrO2 core–shell nanowires were subjected to nanoindentation testing to ascertain their hardness by using a nanoindenter (iMicro, Nanomechanic, Inc., Oak Ridge, TN, USA) with a diamond-shaped tip. According to the findings, the core (MgO) and shell (ZrO2) possess dissimilar mechanical properties that cause variation in the hardness of the materials. MgO (magnesium oxide) is a slightly harder material which has hardness of 1.4–3.2 GPa, and it revealed the ability to protrude deformations and the regular structure in the lattice. On the other hand, the ZrO2 (zirconium dioxide) shell, which is generally categorized as a hard material, reports lower hardness values in MgO/ZrO2 core shell structure in the range of 0.38–1.2 GPa. This decrease appears to be attributed to the mechanical coupling between the MgO core and ZrO2 outer layer, alongside structural flaws, such as porosity or stain on the outer layer. Collectively, the core offers solidity while the shell provides extra elements, although with a lower density of mechanical rigidity, as shown in Figure 9a,b. Peak load Pmax (mN), maximum depth hmax (nm), contact stiffness S (mN/nm), contact depth hc (nm), hardness H (GPa), elasticity modulus E (GPa), and reduced modulus Er (GPa) of sample measured from load–depth, hardness–depth and modulus–depth curves for MgO and MgO/ZrO2 are mentioned in Table 4 and Table 5.
The researchers found that the hardness of the thin film reduced as the indentation depth grew throughout the first phases of indentation measurement. However, after a certain amount of time, the hardness gradually increased to its actual value. It is vital to remember that when applying an excessive indentation depth, the substrate effect might change how hard the film is. At larger indentation depths, the substrate effect becomes more pronounced. In the nanoindentation of thin films, if the indenter penetrates too deeply, it may start to probe the underlying substrate or support material rather than just the nanowire itself. This can artificially increase or decrease the measured hardness, depending on the relative hardness of the substrate compared to the nanowire. For instance, if the substrate is harder than the nanowire, the hardness value will increase as the depth grows. The hardness of the nanoindentation on nanowires is shown in Figure 9a,b, along with the findings from this study.

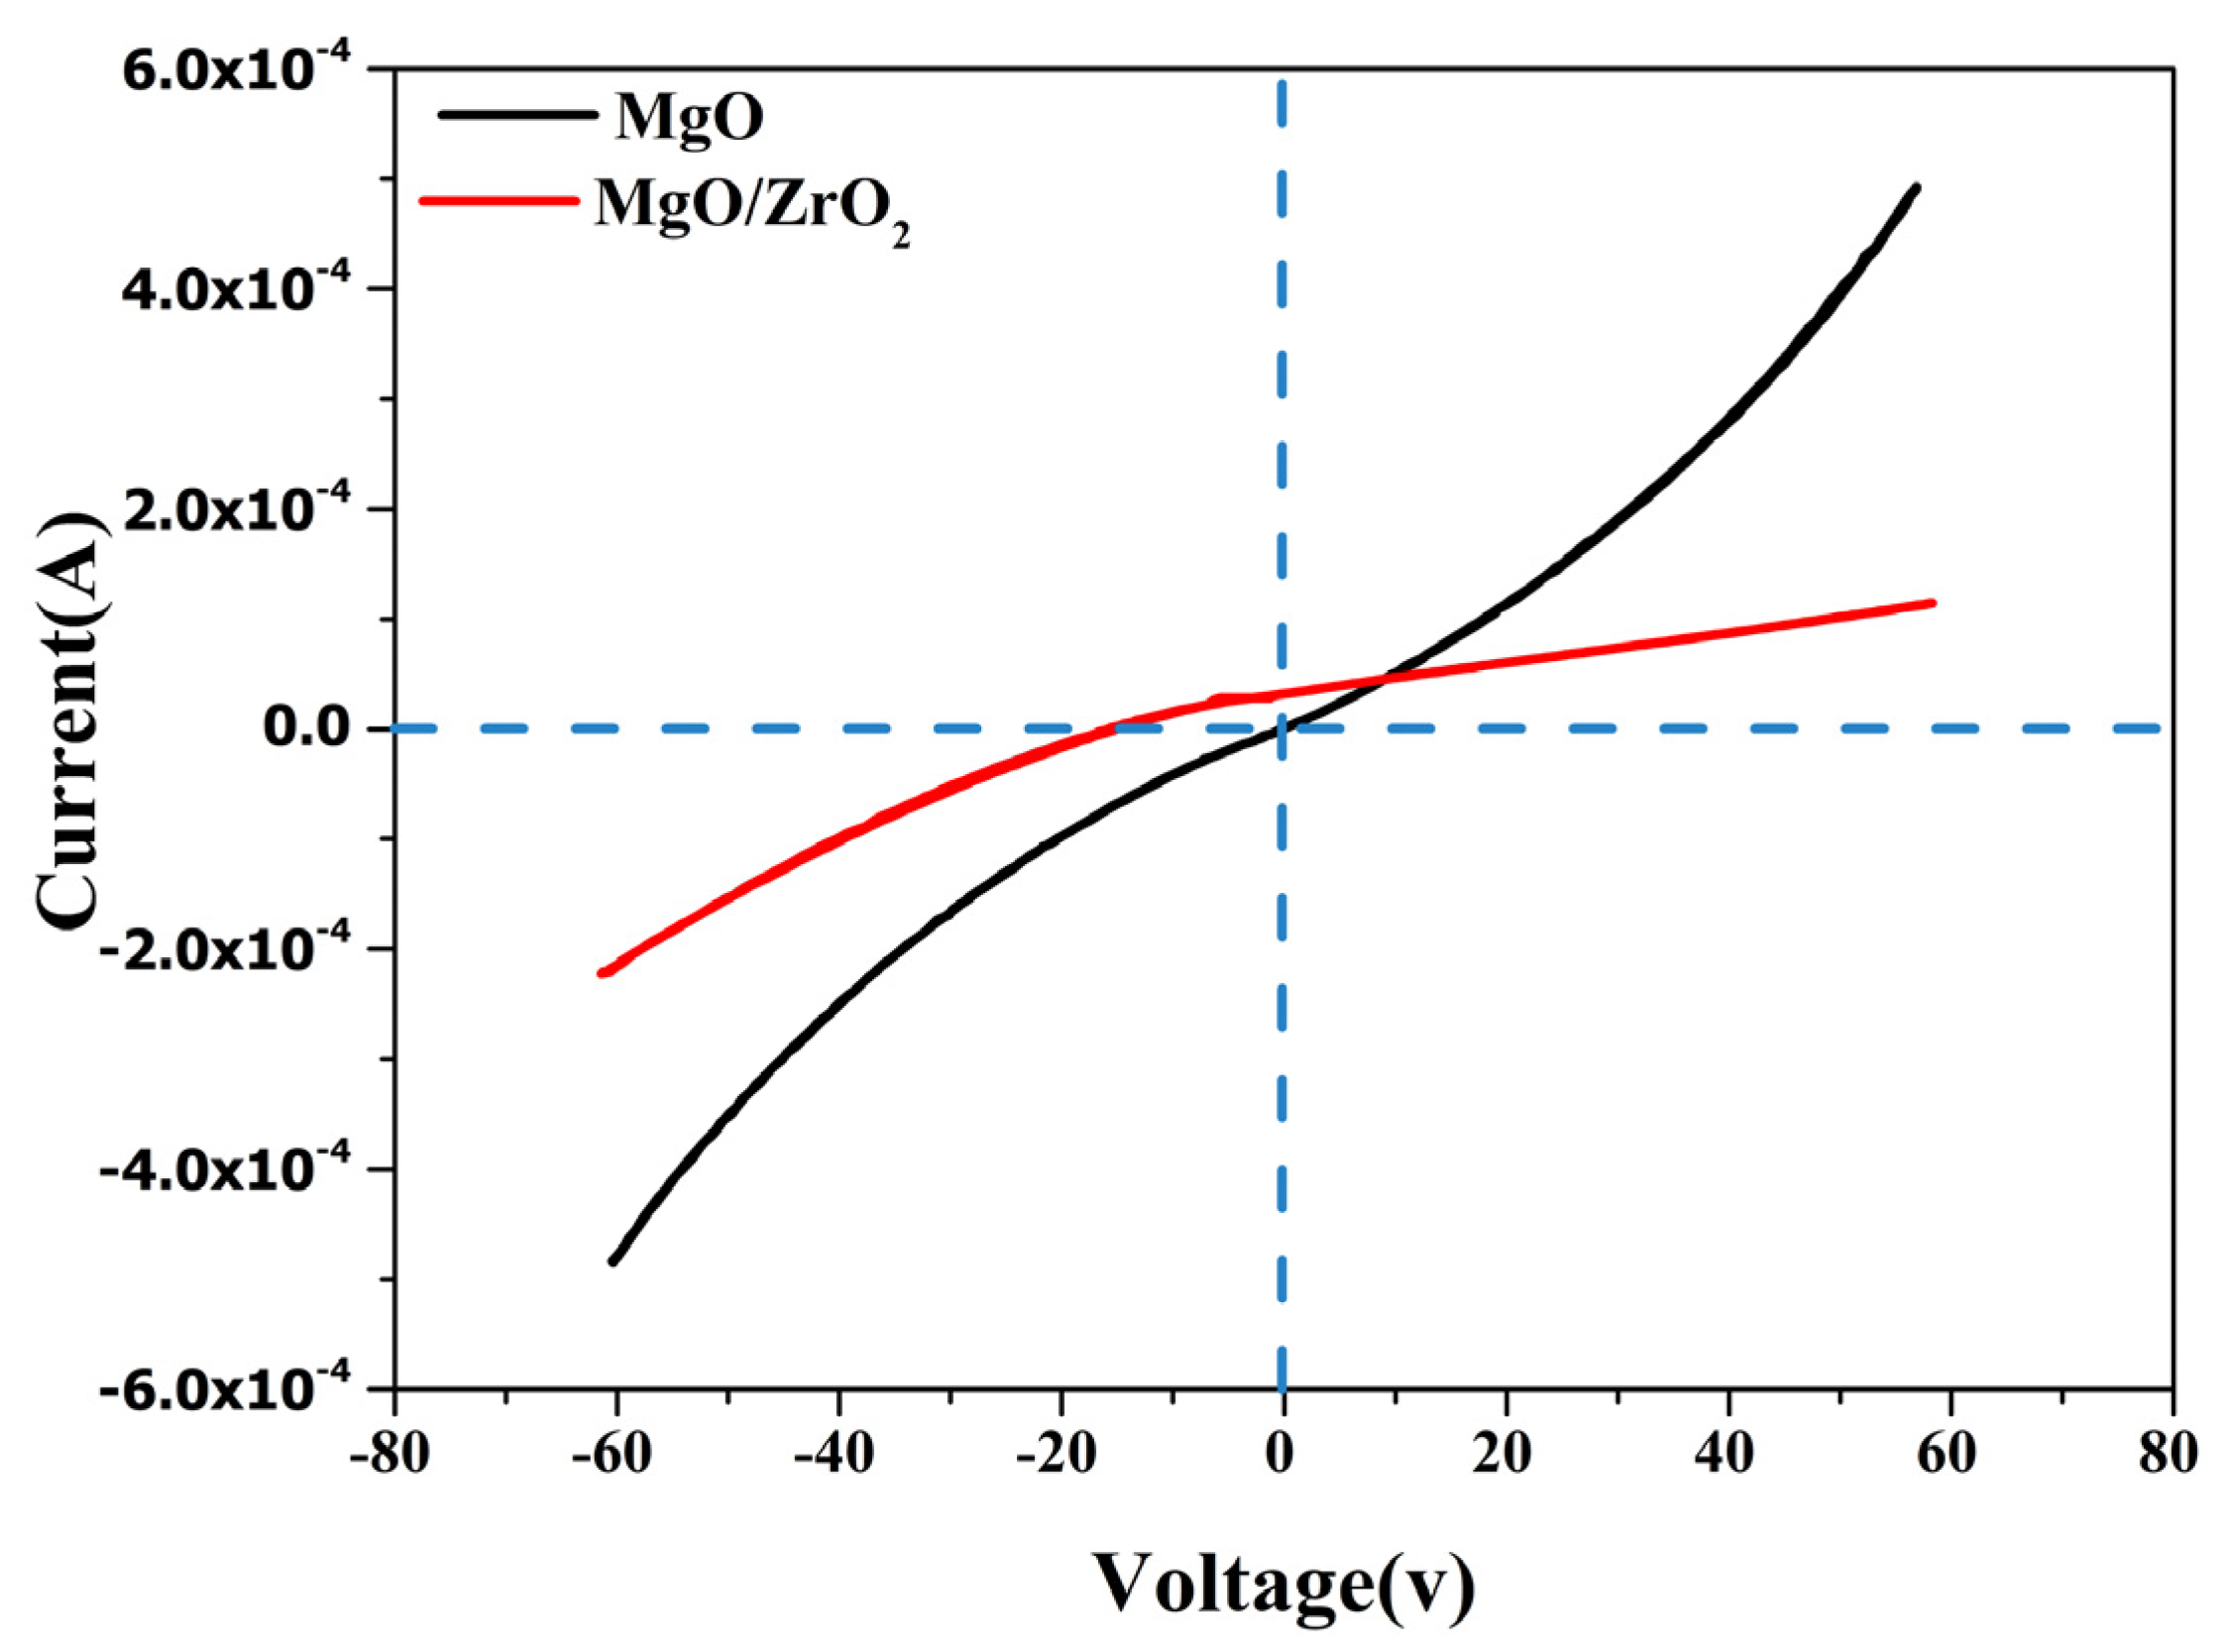
3.7. I–V Characteristics of the MgO-ZrO2 Heterostructure

Figure 10 illustrates the I–V characteristics of the fabricated MgO and MgO-ZrO2 nanowires. We used a Hall effect instrument for measuring the current voltage values of the nanowires, where the Ag electrode was connected to the positive voltage. A nonlinear rectifying behavior was observed, wherein the reverse current gradually increased with the bias voltage, consistent with findings in previous studies. Additionally, an increase in the applied voltage resulted in a corresponding increase in the current. At 56.5 V, the current flow in the MgO nanowires approached 5.0 × 10⁻⁴; after depositing ZrO2 at 58.4 V, the current reached 1.14 × 10⁻⁴.
The reason that the current and voltage values of the MgO nanowires are higher may be explained by research which has shown that MgO nanowires exhibit greater electrical conductivity and lower resistivity compared to their ZrO2 counterparts due to their unique crystal structure. MgO nanowires have a face-centered cubic structure, while ZrO2 boasts a monoclinic or tetragonal structure. Moreover, the size and shape of these nanowires can also impact their electrical properties. The I–V characteristics of the studied MgO and MgO-ZrO2 heterostructure are depicted in Figure 10.

4. Conclusions

In conclusion, we successfully fabricated MgO/ZrO2 core–shell nanowire heterostructures using an Au catalyst-assisted CVD technique employing Mg3N2 and ZrCl4 as precursors under oxygen and argon gases. The mechanical properties of the nanowires were tested using nanoindentation, which shows that the hardness range of the MgO nanowires is higher than of the MgO/ZrO2 nanowires. The I–V characteristics of the heterostructure were also examined to investigate its electrical properties, showing that the values of the MgO nanowires are greater than the values of the MgO-ZrO2 nanowires. Research has shown that MgO nanowires exhibit better electrical conductivity and lower resistivity compared to their ZrO2 counterparts due to their unique crystal structure. The results obtained from these various techniques provide comprehensive insights into the structural, morphological, optical, mechanical, and electrical properties of the MgO-ZrO2 heterostructure.

Author Contributions

T.H. (Tabasum Huma): Writing—review and editing, Data curation and Original draft; N.H.: Image editing and revision; T.H. (Tanzeel Huma): software; M.A.u.h. revisions; X.Z. and L.X.: supervision and participated in the acquisition of funding. All authors have read and agreed to the published version of the manuscript.

Funding

This research was supported by the Advanced low dimensional materials and devices Laboratory, Kunming university of Science and Technology (No. 109820240011/1302).

Data Availability Statement

The data that support the findings of this study are included in the article.

Conflicts of Interest

The authors categorically declare that they have no personal or financial connections or financial conflicts of interest that could be seen as having influenced the work outlined in this.

References

  1. Min, Y.; Yan, T.; Lee, C.-Y.; Miao, Y.; Chen, C.; Luo, M.; Ye, N.J. Epitaxial growth of aligned MgO nanowire arrays on a single crystalline substrate. Dalton Trans. 2022, 51, 3740–3746. [Google Scholar] [CrossRef] [PubMed]
  2. Lee, J.-K.; Shon, I.-J. Mechanochemical synthesis and fast low-temperature consolidation of nanostructured Ni-ZrO2 composite and its mechanical properties. Mater. Trans. 2015, 56, 171–174. [Google Scholar] [CrossRef]
  3. Li, K.; Chen, J.; Peng, J.; Koppala, S.; Omran, M.; Chen, G. One-step preparation of CaO-doped partially stabilized zirconia from fused zirconia. Ceram. Int. 2020, 46, 6484–6490. [Google Scholar] [CrossRef]
  4. Tang, J.; Zhang, F.; Zoogman, P.; Fabbri, J.; Chan, S.W.; Zhu, Y.; Brus, L.E.; Steigerwald, M.L. Martensitic phase transformation of isolated HfO2, ZrO2, and HfxZr1–xO2 (0 < x < 1) nanocrystals. Adv. Funct. Mater. 2005, 15, 1595–1602. [Google Scholar]
  5. Kelly, J.R.; Denry, I. Stabilized zirconia as a structural ceramic: An overview. Dent. Mater. 2008, 24, 289–298. [Google Scholar] [CrossRef]
  6. Fernández-Garcia, M.; Rodgriguez, J. Metal Oxide Nanoparticles; Brookhaven National Lab. (BNL): Upton, NY, USA, 2007. [Google Scholar]
  7. Deng, W.; Li, Y. High-temperature electrical properties of polycrystalline MgO-doped ZrO2. Mater. Res. Bull. 2019, 113, 182–189. [Google Scholar] [CrossRef]
  8. Lu, N.; He, G.; Yang, Z.; Yang, X.; Li, Y.; Li, J. Fabrication and reaction mechanism of MgO-stabilized ZrO2 powders by combustion synthesis. Ceram. Int. 2022, 48, 7261–7264. [Google Scholar] [CrossRef]
  9. Hu, Z.; Xu, Y.; Li, Y.; Li, Z.; Nath, M.; Sang, S.; Wang, Q.; Zhu, T.; Liao, N.; Liang, X. Role of ZrO2 in sintering and mechanical properties of CaO containing magnesia from cryptocrystalline magnesite. Ceram. Int. 2022, 48, 6236–6244. [Google Scholar] [CrossRef]
  10. Muccillo, R.; Muccillo, E.; Saito, N. Thermal shock behavior of ZrO2: MgO solid electrolytes. Mater. Lett. 1998, 34, 128–132. [Google Scholar] [CrossRef]
  11. Dongare, M.; Sinha, A. Low temperature preparation of stabilized zirconia. J. Mater. Sci. 1984, 19, 49–56. [Google Scholar] [CrossRef]
  12. Danish, M.S.S.; Estrella, L.L.; Alemaida, I.M.A.; Lisin, A.; Moiseev, N.; Ahmadi, M.; Nazari, M.; Wali, M.; Zaheb, H.; Senjyu, T. Photocatalytic applications of metal oxides for sustainable environmental remediation. Metals 2021, 11, 80. [Google Scholar] [CrossRef]
  13. Li, X.; Yu, J.; Jaroniec, M. Hierarchical photocatalysts. Chem. Soc. Rev. 2016, 45, 2603–2636. [Google Scholar] [CrossRef] [PubMed]
  14. Murillo-Sierra, J.; Hernández-Ramírez, A.; Hinojosa-Reyes, L.; Guzmán-Mar, J. A review on the development of visible light-responsive WO3-based photocatalysts for environmental applications. Chem. Eng. J. Adv. 2021, 5, 100070. [Google Scholar] [CrossRef]
  15. Lv, X.; Wei, W.; Sun, Q.; Li, F.; Huang, B.; Dai, Y. Two-dimensional germanium monochalcogenides for photocatalytic water splitting with high carrier mobility. Appl. Catal. B: Environ. 2017, 217, 275–284. [Google Scholar] [CrossRef]
  16. Ibrahim, M. Photocatalytic activity of nanostructured ZnO–ZrO2 binary oxide using fluorometric method. Spectrochim. Acta Part A: Mol. Biomol. Spectrosc. 2015, 145, 487–492. [Google Scholar] [CrossRef]
  17. Zhang, X.; Li, L.; Zhou, Q.; Liang, X.; Liu, D. Facile synthesis of novel gully-like double-sized mesoporous structural Sr-doped ZrO2–TiO2 composites with improved photocatalytic efficiency. J. Solid State Chem. 2019, 269, 375–385. [Google Scholar] [CrossRef]
  18. Gawande, M.B.; Branco, P.S.; Parghi, K.; Shrikhande, J.J.; Pandey, R.K.; Ghumman, C.A.A.; Ghumman, C.A.A.; Bundaleski, N.; Teodoro, O.M.N.D.; Jayaram, R.V. Synthesis and characterization of versatile MgO–ZrO2 mixed metal oxide nanoparticles and their applications. Catal. Sci. Technol. 2011, 1, 1653–1664. [Google Scholar] [CrossRef]
  19. Gawande, M.B.; Rathi, A.K.; Branco, P.S.; Potewar, T.; Velhinho, A.; Nogueira, I.D.; Tolstogouzov, A.; Ghumman, C.A.A.; Teodoro, O.M. Nano-MgO–ZrO2 mixed metal oxides: Characterization by SIMS and application in the reduction of carbonyl compounds and in multicomponent reactions. RSC Adv. 2013, 3, 3611–3617. [Google Scholar] [CrossRef]
  20. Prasad, G.; Kumar, J.P.; Pandey, L.; Singh, B. Nanoporous materials for the remediation of industrial toxic chemicals. Adv. Porous Mater. 2017, 5, 1–16. [Google Scholar] [CrossRef]
  21. Makhanya, N.P. Solvent-Free Knoevenagel Condensation over Supported Mixed Metal Oxides Catalysts. Ph.D. Thesis, Durban University of Technology, Durban, South Africa, 2017. [Google Scholar]
  22. Liu, Z.; Yin, Z.; Cox, C.; Bosman, M.; Qian, X.; Li, N.; Zhao, H.; Du, Y.; Li, J.; Nocera, D.G. Room temperature stable CO x-free H2 production from methanol with magnesium oxide nanophotocatalysts. Sci. Adv. 2016, 2, e1501425. [Google Scholar] [CrossRef]
  23. Sugiyama, S.; Sato, K.; Yamasaki, S.; Kawashiro, K.; Hayashi, H. Ketones from carboxylic acids over supported magnesium oxide and related catalysts. Catal. Lett. 1992, 14, 127–133. [Google Scholar] [CrossRef]
  24. Yang, J.; Chen, A.; Liu, F.; Gu, L.; Xie, X.; Ding, Z. Hybrid coating of polydimethylsiloxane with nano-ZrO2 on magnesium alloy for superior corrosion resistance. Ceram. Int. 2022, 48, 35280–35289. [Google Scholar] [CrossRef]
  25. Cubillos, G.; Bethencourt, M.; Olaya, J.; Alfonso, J.; Marco, J. The influence of deposition temperature on microstructure and corrosion resistance of ZrOxNy/ZrO2 coatings deposited using RF sputtering. Appl. Surf. Sci. 2014, 309, 181–187. [Google Scholar] [CrossRef]
  26. Qing, W.; Liu, F.; Yao, H.; Sun, S.; Chen, C.; Zhang, W. Functional catalytic membrane development: A review of catalyst coating techniques. Adv. Colloid Interface Sci. 2020, 282, 102207. [Google Scholar] [CrossRef]
  27. Luo, J.; Zhao, K.; Zhao, J.; Li, J.; Liu, Y.; Chen, D.; Xu, Q.; Chen, M. Functional ceramic support as an independent catalyst layer for direct liquid fuel solid oxide fuel cells. J. Adv. Ceram. 2023, 12, 474–486. [Google Scholar] [CrossRef]
  28. Khan, M.E.; Mohammad, A.; Ali, W.; Imran, M.; Bashiri, A.H.; Zakri, W. Properties of metal and metal oxides nanocomposites. In Nanocomposites-Advanced Materials for Energy and Environmental Aspects; Elsevier: Amsterdam, The Netherlands, 2023; pp. 23–39. [Google Scholar]
  29. Sanchis-Gual, R.; Coronado-Puchau, M.; Mallah, T.; Coronado, E. Hybrid nanostructures based on gold nanoparticles and functional coordination polymers: Chemistry, physics and applications in biomedicine, catalysis and magnetism. Coord. Chem. Rev. 2023, 480, 215025. [Google Scholar] [CrossRef]
  30. Cheng, F.; Nie, F.; Zhao, C.; Li, W.; Pan, J. Efficient and stable removal of phosphate from aqueous solutions by hollow microspheres of MgO/ZrO2 composite oxide. Colloids Surf. A: Physicochem. Eng. Asp. 2022, 635, 128095. [Google Scholar] [CrossRef]
  31. Sajjadi, S.M.; Haghighi, M.; Rahmani, F. Sol–gel synthesis of Ni–Co/Al2O3–MgO–ZrO2 nanocatalyst used in hydrogen production via reforming of CH4/CO2 greenhouse gases. J. Nat. Gas Sci. Eng. 2015, 22, 9–21. [Google Scholar] [CrossRef]
  32. Keerthana, L.; Sakthivel, C.; Prabha, I. MgO-ZrO2 mixed nanocomposites: Fabrication methods and applications. Mater. Today Sustain. 2019, 3, 100007. [Google Scholar] [CrossRef]
  33. Śnieżek, E.; Szczerba, J.; Stoch, P.; Prorok, R.; Jastrzębska, I.; Bodnar, W.; Burkel, E. Structural properties of MgO–ZrO2 ceramics obtained by conventional sintering, arc melting and field assisted sintering technique. Mater. Des. 2016, 99, 412–420. [Google Scholar] [CrossRef]
  34. Huma, T.; Hakimi, N.; Younis, M.; Huma, T.; Ge, Z.; Feng, J.J.N. MgO heterostructures: From synthesis to applications. Nanomaterials 2022, 12, 2668. [Google Scholar] [CrossRef]
  35. Palacio, M.L.; Bhushan, B.J. Depth-sensing indentation of nanomaterials and nanostructures. Mater. Charact. 2013, 78, 1–20. [Google Scholar] [CrossRef]
  36. Lee, S.; Choi, B.G.; Choi, D.; Park, H.S. Nanoindentation of annealed Naf ion/sulfonated graphene oxide nanocomposite membranes for the measurement of mechanical properties. J. Membr. Sci. 2014, 451, 40–45. [Google Scholar] [CrossRef]
  37. Jian, S.-R.; Chen, G.-J.; Hsu, W.-M. Mechanical properties of Cu2O thin films by nanoindentation. Materials 2013, 6, 4505–4513. [Google Scholar] [CrossRef]
  38. Jian, S.-R.; Lin, Y.-Y.; Ke, W.-C. Effects of thermal annealing on the structural, electrical and mechanical properties of Al-doped ZnO thin films deposited by radio-frequency magnetron sputtering. Sci. Adv. Mater. 2013, 5, 7–13. [Google Scholar] [CrossRef]
  39. Jian, S.-R.; Lee, Y.-H. Nanoindentation-induced interfacial fracture of ZnO thin films deposited on Si (1 1 1) substrates by atomic layer deposition. J. Alloys Compd. 2014, 587, 313–317. [Google Scholar] [CrossRef]
  40. Shi, Z.-F.; Zhang, Y.-T.; Cui, X.-J.; Zhuang, S.-W.; Wu, B.; Chu, X.-W.; Dong, X.; Zhang, B.-L.; Du, G.-T. Photoluminescence performance enhancement of ZnO/MgO heterostructured nanowires and their applications in ultraviolet laser diodes. Phys. Chem. Chem. Phys. 2015, 17, 13813–13820. [Google Scholar] [CrossRef]
  41. Kim, G.; Martens, R.L.; Thompson, G.B.; Kim, B.C.; Gupta, A. Selective area synthesis of magnesium oxide nanowires. J. Appl. Phys. 2003, 370, 770–773. [Google Scholar]
  42. Yin, Y.; Zhang, G.; Xia, Y. Synthesis and characterization of MgO nanowires through a vapor-phase precursor method. Adv. Funct. Mater. 2002, 12, 293–298. [Google Scholar] [CrossRef]
  43. Ma, R.; Bando, Y.J. Uniform MgO nanobelts formed from in situ Mg3N2 precursor. Chem. Phys. Lett. 2003, 370, 770–773. [Google Scholar] [CrossRef]
  44. Ko, J.B.; Kim, S.M. Preparation and electric characteristics of MgO films deposited by plasma-enhanced chemical vapor deposition. J. Ceram. Process. Res. 2009, 10, 643–646. [Google Scholar]
  45. Wu, Y.; Wu, W.; Zou, X.; Xu, L.; Li, J.J. Growth and great UV emission improvement of highly crystalline quality core–shell ZnO/MgO nanowires. Mater. Lett. 2012, 84, 147–150. [Google Scholar] [CrossRef]
  46. Kim, H.W.; Kim, H.S.; Lee, C.; Kebede, M.A.; Yoo, K.-H.; Kim, D.Y. MgO-core/ZnO-shell nanocables sheathed by using the sputtering technique. J. Korean Phys. Soc. 2009, 55, 1887–1891. [Google Scholar] [CrossRef]
  47. Haycock, D.E.; Kasrai, M.; Nicholls, C.J.; Urch, D.S. The electronic structure of magnesium hydroxide (brucite) using X-ray emission, X-ray photoelectron, and auger spectroscopy. J. Chem. Soc. Dalton Trans. 1978, 12, 1791–1796. [Google Scholar] [CrossRef]
  48. García, L.; Mendivil, M.; Roy, T.D.; Castillo, G.; Shaji, S. Laser sintering of magnesia with nanoparticles of iron oxide and aluminum oxide. Appl. Surf. Sci. 2015, 336, 59–66. [Google Scholar] [CrossRef]
  49. Wan, Y.; Samundsett, C.; Bullock, J.; Hettick, M.; Allen, T.; Yan, D.; Peng, J.; Wu, Y.; Cui, J.; Javey, A. Conductive and stable magnesium oxide electron-selective contacts for efficient silicon solar cells. Adv. Energy Mater. 2017, 7, 1601863. [Google Scholar] [CrossRef]
  50. Koirala, R.; Gunugunuri, K.R.; Pratsinis, S.E.; Smirniotis, P.G. Effect of zirconia doping on the structure and stability of CaO-based sorbents for CO2 capture during extended operating cycles. J. Phys. Chem. C 2011, 115, 24804–24812. [Google Scholar] [CrossRef]
  51. Li, W.; Liu, X.; Huang, A.; Chu, P.K. Structure and properties of zirconia (ZrO2) films fabricated by plasma-assisted cathodic arc deposition. J. Phys. D Appl. Phys. 2007, 40, 2293. [Google Scholar] [CrossRef]
  52. Rameshan, C.; Li, H.; Anic, K.; Roiaz, M.; Pramhaas, V.; Rameshan, R.; Blume, R.; Hävecker, M.; Knudsen, J.; Knop-Gericke, A. In situ NAP-XPS spectroscopy during methane dry reforming on ZrO2/Pt (1 1 1) inverse model catalyst. J. Phys. Condens. Matter 2018, 30, 264007. [Google Scholar] [CrossRef]
  53. Bumajdad, A.; Nazeer, A.A.; Al Sagheer, F.; Nahar, S.; Zaki, M.I. Controlled synthesis of ZrO2 nanoparticles with tailored size, morphology and crystal phases via organic/inorganic hybrid films. Sci. Rep. 2018, 8, 3695. [Google Scholar] [CrossRef] [PubMed]
Figure 1. (a) Schematic process of the MgO-ZrO2 core–shell heterostructure. Progression of deposition, where temperature is set in relation to time (b) for MgO (c) for MgO-ZrO2.
Crystals 15 00465 g001
Figure 2. XRD of heterostructure MgO-ZrO2.
Crystals 15 00465 g002
Figure 3. UV-visible spectra: (a) blue line shows the MgO-ZrO2; red line spectra shows the MgO. (b) Energy band gap of MgO. (c) Energy band gap of MgO-ZrO2.
Crystals 15 00465 g003
Figure 4. EDX analysis of MgO-ZrO2.
Crystals 15 00465 g004
Figure 5. (a) MgO nanowire; (b) MgO and ZrO2 nanowires show core and shell behavior; (c) systematic diagram illustrating the structural configuration of MgO nanowires and MgO-ZrO2 core–shell nanowires.
Crystals 15 00465 g005
Figure 6. (a) TEM analysis of MgO and ZrO2 nanowires highlighting the two materials labeled as c and d in the selected portion. (b) The SAED patterns of nanowires. (c,d) The HRTEM images of the nanowires of MgO and ZrO2 respectively.
Crystals 15 00465 g006
Figure 7. XPS spectra of MgO-ZrO2. (a) Combined survey. (b) Mg1s. (c) O1s. (d) Zr3d.
Crystals 15 00465 g007
Figure 8. (a) Load–depth curves at 100 mN load. (b) Load–depth curves at different load levels for MgO nanowires. (c) Load–depth curves at different load levels for MgO/ZrO2 core–shell nanowires.
Crystals 15 00465 g008
Figure 9. Hardness and depth curves at different load levels: (a) MgO, (b) MgO/ZrO2.
Crystals 15 00465 g009
Figure 10. I–V characteristics of the MgO-ZrO2 heterostructure.
Crystals 15 00465 g010
Table 1. MgO/ZrO2 heterostructure growth conditions.
ParametersNanowire Growth
SubstrateSi (n-type) (100)
PrecursorMg3N2, ZrCl4
Gas FlowArgon, Nitrogen, Oxygen
Growth Temperature800 °C, 950 °C
Growth rate10 °C/min
Growth Pressure160SCCM, 100SCCM, 6SCCM
Table 2. Survey of MgO and heterostructures by chemical vapor deposition.
Precursor UsedSubstrateCarrier GasTimeNanostructureRef
ZnO/MgO (800 °C)c-Al2O3O230 minNWs[40]
Mg3N2 (650 °C)SiN2 + O260 minNWs[41]
MgB4 (700 °C)SiAr2 hNWs[42]
Mg3N2 (650 °C, 800 °C)AlN2 + O22 hNanobelts[43]
Mg(thd)2 (150–400 °C)Si (100)Ar + O210 minFilms[44]
Zn (500 °C)SiAr + O260 minNWs[45]
MgB2 (900 °C)SiAr + O28 minNWs[46]
Table 3. Binding energy corresponds to Mg 1s and Zr 3d.
Mg 1s eVZr 3d eV
SamplesMgOZrO2
3d3/2
ZrO2
3d5/2
Binding energy1304.44 eV184.30 eV181.85 eV
From the literature1303.8 [47], 1303.9 [47,48], 1303.4 [49]183 [50], 184.9 [51]181.1 [52], 182 [53]
Table 4. Peak load Pmax (mN), maximum depth hmax (nm), contact stiffness S (mN/nm), contact depth hc (nm), hardness H (GPa), elasticity modulus E (GPa), and reduced modulus Er (GPa) of sample measured from load–depth, hardness–depth and modulus–depth curves for MgO.
Pmax (mN)hmax (nm)S (mN/nm)hc (nm)H (GPa)E (GPa)Er (GPa)
9.98581596.30.181554.61.40258.3759.17
24.9781293.90.231212.42.82673.4873.52
49.962134.80.141867.21.75854.1554.94
99.891281.10.661167.63.28490.1188.73
Table 5. Peak load Pmax (mN), maximum depth hmax (nm), contact stiffness S (mN/nm), contact depth hc (nm), hardness H (GPa), elasticity modulus E (GPa), and reduced modulus Er (GPa) of the sample measured from load–depth, hardness–depth and modulus–depth curves for MgO/ZrO2.
Pmax (mN)hmax (nm)S (mN/nm)hc (nm)H (GPa)E (GPa)Er (GPa)
9.9881650.50.221616.40.3844.9746.08
18.7571991.40.431958.61.0059.3259.9
49.961616.90.2314540.75960.2560.97
99.871944.60.771847.31.24168.3668.49
Disclaimer/Publisher’s Note: The statements, opinions and data contained in all publications are solely those of the individual author(s) and contributor(s) and not of MDPI and/or the editor(s). MDPI and/or the editor(s) disclaim responsibility for any injury to people or property resulting from any ideas, methods, instructions or products referred to in the content.

