Article

Structural, Mechanical, and Tribological Properties of Molybdenum-Doped Diamond-like Carbon Films

by
Hassan Zhairabany
1,*,
Hesam Khaksar
2,
Edgars Vanags
3,
Krisjanis Smits
3,
Anatolijs Sarakovskis
3 and
Liutauras Marcinauskas
1
1
Department of Physics, Kaunas University of Technology, Studentų Str. 50, 51368 Kaunas, Lithuania
2
Marian Smoluchowski Institute of Physics, Jagiellonian University, ul. Lojasiewicza 11, 30-348 Krakow, Poland
3
Microscopy Laboratory, Institute of Solid State Physics, University of Latvia, Kengaraga Str 8, LV-1063 Riga, Latvia
*
Author to whom correspondence should be addressed.
Crystals 2025, 15(5), 463; https://doi.org/10.3390/cryst15050463
Submission received: 7 April 2025 / Revised: 30 April 2025 / Accepted: 5 May 2025 / Published: 15 May 2025
(This article belongs to the Special Issue Advances in Diamond Crystals and Devices)

Abstract

:
Non-hydrogenated diamond-like carbon (DLC) films and molybdenum-doped diamond-like carbon (Mo-DLC) films were deposited by direct current magnetron sputtering. The formation was carried out on Si (100) wafers. The influence of molybdenum concentration and deposition temperature on the surface morphology, chemical composition, type of chemical bonds, friction force at nanoscale, and nanohardness of the DLC coatings were investigated by atomic force microscopy (AFM), energy dispersive X-ray spectroscopy (EDX), X-ray photoelectron spectroscopy (XPS), Raman spectroscopy, and nanoindenter, respectively. The concentration of molybdenum in the films varies from 1.2 at.% to 10.3 at.%. The increase in molybdenum content promotes the graphitization of DLC films, lowering the sp3 site fraction and increasing the oxygen content, which contributes to the reduction in nanohardness (by 21%) of the DLC films. The decrease in the synthesis temperature from 235 °C to 180 °C enhanced the oxygen amount up to 20.4 at.%. The sp3 site fraction and nanohardness of the Mo-DLC films were enhanced with the reduction in the deposition temperature. The film deposited at a substrate temperature of 235 °C exhibited the lowest friction coefficient (CoF) of 0.03, where its molybdenum concentration was 1.2 at.%. The decline in the synthesis temperature increased the CoF of the Mo-DLC films up to seven times.

1. Introduction

Currently, it has become much more familiar and typical to use various metal dopants and nonmetallic elements to adjust and modify the microstructure and properties of diamond-like carbon (DLC) films [1,2,3,4,5,6]. M. Evaristo et al. [1] demonstrated that the hardness of the DLC coating would decrease with the Si content lower than 10 at.%. At the same time, an increase is recorded for the Si at.%, and the rise in O content results in a decrease in the hardness and elastic modulus of the coatings. The significance of dopant use in DLC coatings was demonstrated by S. Khamseh et al. [3], indicating that extraordinary anti-corrosion properties can be achieved using Cu-DLC composite thin films.
The synthesis procedure and deposition temperature play an important role in the final properties of DLC and doped DLC films. Several researchers tried to understand and explain the temperature effect on these films [7,8,9,10]. B. Huang. et al. [7] indicated that the sp3/sp2 ratios and hardness of the Si-DLC films were enhanced between 60 °C and 120 °C, before they decreased when temperatures increased up to 180 °C. In addition, at a higher temperature range, H. Zeng et al. [8] were able to prepare Co-DLC films with 300 times better corrosion resistance by increasing the substrate temperature up to 400 °C, as the sp2 cluster density and the Co nanoparticle size increased. Also, H. Li et al. [10] indicated that increasing the temperature up to 400 °C led the amorphous carbon films to become nanocrystalline graphite, where a higher sp2 content and smaller sp2 size cluster were formed, resulting in a smoother film surface. M. Ebrahimi et al. [9] showed that the DLC film’s wear rate and CoF are affected by the deposition temperature as well as the hydrogen flow rate.
The addition of molybdenum (Mo) dopant in DLC films has revealed its importance, such as enhancing tribological and mechanical properties, reducing compressive stress and CoF, and enhancing hardness and biocompatibility, which has been proved by many works in the literature [11,12,13,14,15,16]. P. E. Hovsepian et al. [12] demonstrated that the combination of Mo and W-doped DLC coatings improves tribological properties during boundary lubricated sliding at ambient and elevated temperatures up to 200 °C. I.C. Müller et al. [13] found that coatings that have nanocrystallites of Mo and W embedded in an amorphous C matrix demonstrated high resistance against wear. F. O. Kolawole et al. [14] demonstrated that the thermal stability of MoO3-doped DLC coatings would be enhanced at high temperatures. The adhesion properties were superlative, and the friction coefficient was between 0.075 and 0.22. Y. Su et al. [17] demonstrated that the tribological properties of the Mo-doped DLC films depend on the medium and friction pair. Our previous research indicated that the microstructure, nanohardness, and CoF of the Mo-DLC films depend on the Mo concentration in the DLC films synthesized at ~220 °C. The friction coefficient was reduced from 0.97 to 0.89 with the increase in the Mo fraction from 1.1 to 6.2 at.% [18]. The formation temperature has a huge effect on the properties of Mo-DLC films. The CoF of Mo-DLC coatings was reduced compared to pure DLC films when the Mo content varied from 6.3 at.% to 11.9 at.%. The increase in the deposition temperature caused an enhancement of the sp2 bond fraction and a reduction in the oxygen amount within the coatings, and as a result, the nano-friction coefficient of the Mo-DLC film was reduced [19]. Several authors investigated the tribological properties of the Mo-DLC coatings. However, the researchers were focused on the macro-tribological properties and the influence of the Mo amount on the microstructure, mechanical, and tribological properties [11,12,13]. The synthesis temperature plays a crucial role as it determines the amount of sp2 or sp3 carbon bonds and the density of the DLC or metal-doped DLC coatings, since the ratio of sp2/sp3 bonds is directly related to the properties of the doped DLC films being formed [6,8,10]. L. Li et al. [20] observed that the friction force was reduced from 200 nN to 140 nN with the rise in the Si concentration in DLC films due to the increase in sp3 bond fraction and density of the films. L. Bai et al. [21] found that the nano-friction force was increased with the increase in the roughness of the surface and was reduced due to the formation of the sp2 carbon bonds on the surface of the DLC films. H.S. Zhang et al. [22] indicated that the low surface roughness resulted in a higher CoF of the DLC and silver-doped DLC films. Additionally, the enhancement of the applied loads from 10 to 80 µN reduced the friction coefficient values of undoped and Ag-DLC films. X. Li et al. [23] used a molecular dynamics simulation to investigate the nano-friction mechanisms at the interface of amorphous carbon films. The simulations demonstrated that the annealing (up to 3000 K) of the carbon films increased the sp2 C=C bond fraction and resulted in a huge reduction in the friction force from ~318 nN to ~1 nN. The investigations demonstrated that the chemical termination or rehybridization of dangling bonds of amorphous carbon surface decreased the nano-friction force due to the reduction in the contact area and shearing strength of the sliding interface. Other researchers have not previously performed studies on the effect of the formation temperature on the microstructure, mechanical, and nanotribological properties of Mo-doped DLC films. There is a lack of exploration regarding how the deposition temperature influences the coefficient of friction of the metal-doped DLC films at the nanoscale. At the nanoscale, the surface-to-volume ratio increases dramatically. This means that surface forces, including friction and adhesion, dominate over bulk material properties, making friction a critical factor to control. Even a minor increase in the friction coefficient at the nanoscale can lead to enhanced degradation of material, causing wear that compromises the functionality of micro- and nano-devices. It should be highlighted that the coefficient of friction at the nanoscale depends on van der Waals forces, adhesion, surface roughness, type of dopant used, and the ratio of sp2 to sp3 bonding in the diamond-like carbon films [20,21,22,23,24]. Thus, it is very important to investigate the surface interaction effects at the micro- or nanoscale and to determine the main factors affecting the nanomechanical properties and friction coefficient of films for the successful application of Mo-DLC films in micro-gearboxes or micro-turbines, where friction and wear at nanoscale surfaces remain significant challenges.
DLC and Mo-doped DLC films were deposited by a magnetron sputtering system. The main goal was to study the effects of the synthesis temperature as well as the Mo-embedded amount on the DLC film’s structure and properties. Also, the XPS measurements in this work aimed to reveal the presence of the elemental bonding state and its effect on the nanohardness and friction behavior of the coatings. This research addresses a critical gap in understanding the effects of substrate temperature and Mo concentration on the bonding state, nanomechanical, and nanotribological properties of molybdenum-doped diamond-like carbon films.

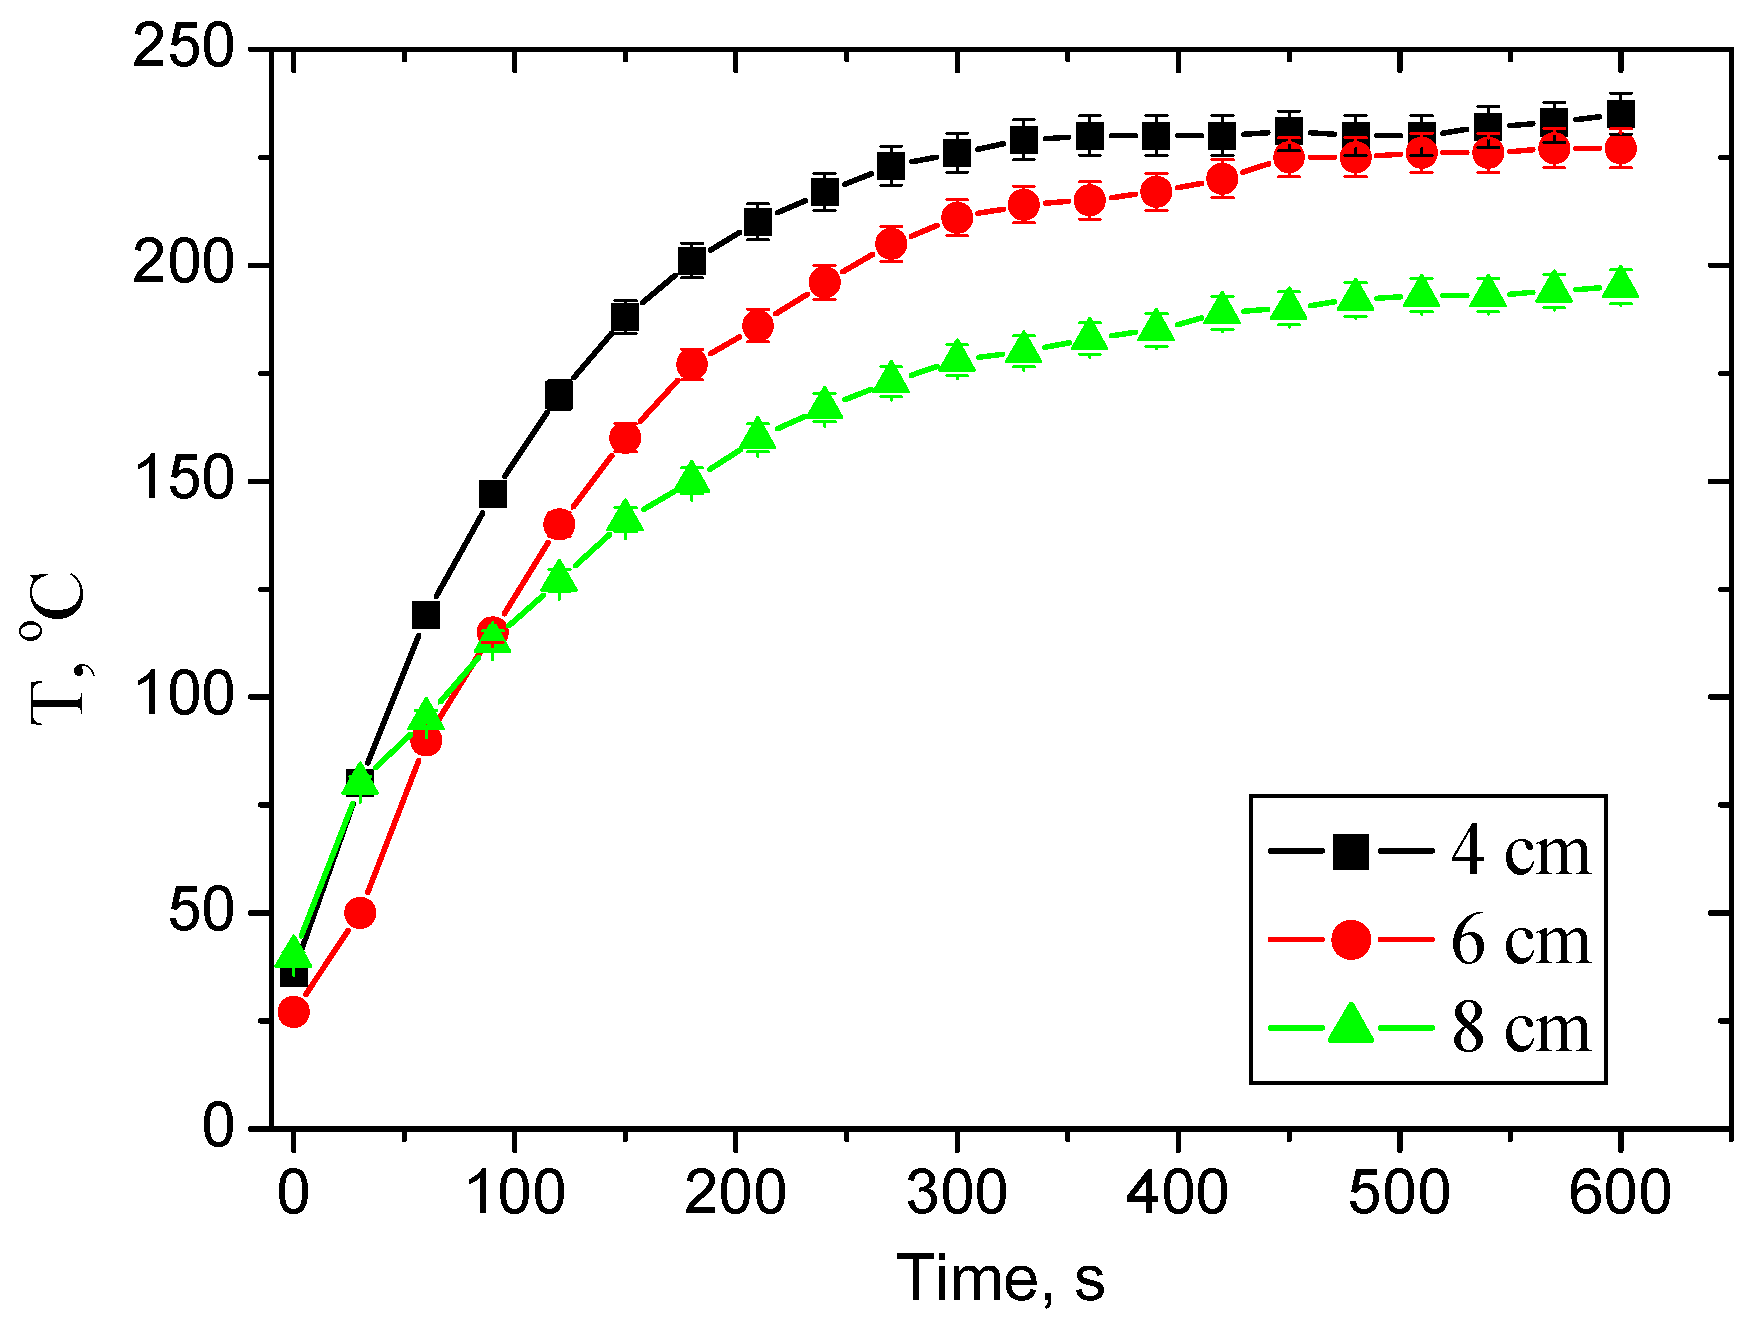
2. Materials and Methods

DC magnetron sputtering was utilized to synthesize the DLC and Mo-doped DLC (Mo-DLC) films, using two flat magnetron targets (graphite (Kurt J. Lesker Company, Saint Leonards, UK)) and molybdenum with 99.95% purity (Testbourne Ltd., Helmond, The Netherlands) of 3-inch diameter and 6 mm thickness; the films were formed on silicon (100) wafers. Before starting the deposition, the chamber was vacuumed until it reached a pressure of ~0.01 Pa. During the deposition, the chamber was filled with argon, and the pressure was ~3 Pa. The target currents were 1.5 A and 0.25 A for graphite and molybdenum targets, respectively. The pre-sputtering of magnetron targets was performed for 5 min in argon plasma to clean the surfaces (remove oxide layer or contaminants) of the material targets. Also, prior to the film’s deposition, the silicon substrates were cleaned with acetone to remove any oxide layers, dust, or contamination from the surface. A shield with a slit mount above the molybdenum target was utilized to control the flux of sputtered Mo atoms. The amount of Mo gradually increased by increasing the slit opening from 4 mm to 16 mm, when the deposition was carried out at a target–substrate distance of 4 cm. The literature provides specific conditions for synthesis [17]. The distance between the magnetron targets and the Si wafer varied from 4 cm to 8 cm to achieve different temperatures of deposition. The duration of synthesis of all films was 10 min. The temperature was recorded with a thermocouple attached to the sample holder. The evolution of the temperature versus deposition duration is given in Figure 1.
Energy dispersive X-ray spectroscopy (EDX) (Bruker Quad 5040 spectrometer, Germany, Hamburg) was chosen to determine the elemental composition of the coatings. The values were obtained as the average value of 3–5 different measured points using an accelerating voltage of 15 kV, and 100 for magnification. Standard deviation was used to calculate errors. Additionally, the EDX was used to establish the distribution of the chemical elements on the surface and cross-section of the Mo-DLC films. The bonding structure of the DLC and Mo-DLC films was determined by Raman spectroscopy (Renishaw, Wotton-under-Edge, UK) with a CCD camera equipped with a confocal microscope (50× objective), and a laser with a wavelength of 532 nm was used. The measurements were performed in 3 places for each coating. The exposure duration was 10 s, the accumulation count was 10, the laser power was set to 0.3 mW, the data were recorded from 100 to 2000 cm−1, with a spot size of ~10 μm, and the spectral resolution was about 0.8 cm−1. The chemical state in the films was investigated by X-ray photoelectron spectroscopy (Escalab 250XI, ThermoFisher). The base pressure, with the charge neutralizer switched on during spectra acquisition, was more than 10−5 Pa, achieved by rotary and turbomolecular pumps. The positions of Ag 3D5/2, Au 4f7/2, and Cu 2p3/2 were 368.21 eV, 83.93 eV, and 932.58 eV, respectively, and were measured to confirm the calibration and linearity of the binding energy scale. The full width at half maximum (FWHM) of the Au 4f7/2 peak was more than 0.58 eV. The films were sputter-cleaned by an Ar+ gun with an ion energy of 2.0 keV for 30 s before the measurements. The dimensions of the cleaned area were 2 × 2 mm; the angle of incidence of the ions was 30° with respect to the normal of the surface. The size of the measured film area was 650 × 100 μm. The excitation source was monochromatic Al Kα radiation (energy was 1486.60 eV), using a water-cooled anode at 150 W. The spectra of all films were referenced against the adventitious carbon peak, typically observed at 284.8 eV. We acknowledge that this method can introduce uncertainties, as reported in previous studies [25]. To mitigate this, after sputter cleaning, we measured the 2p3/2 peak of implanted Ar ions at 242.4 eV, which served as a reliable internal reference for all measured samples. The films’ thicknesses were determined by SEM cross-sectional images of the Mo-DLC samples with an accelerating voltage of 5 kV. Atomic force microscopy (AFM) experiments were carried out using DriveAFM (Nanosurf, Liestal, Switzerland) to identify the surface roughness and the friction coefficient of the coatings. The friction coefficient was measured using a PPP-LFMR-10 AFM probe (NanosensorsTM, Neuchatel, Switzerland), with a tip radius of less than 7 nm and a measured spring constant of ~30 N/m. The roughness investigations were performed on a 10 × 10 μm area, and three locations were measured. The numerical values of roughness were determined using Gwyddion software (version 2.59) [26]. Nanoindentation tests were carried out using an MTS Agilent G200 nanoindenter (MTS Systems, Eden Prairie, MN, USA), using the continuous stiffness measurement (CSM) technique. The calibration methodology using the Berkovich diamond tip, nanohardness measurement parameters, and Young’s modulus calculations of the deposited films is presented in [19].

3. Results

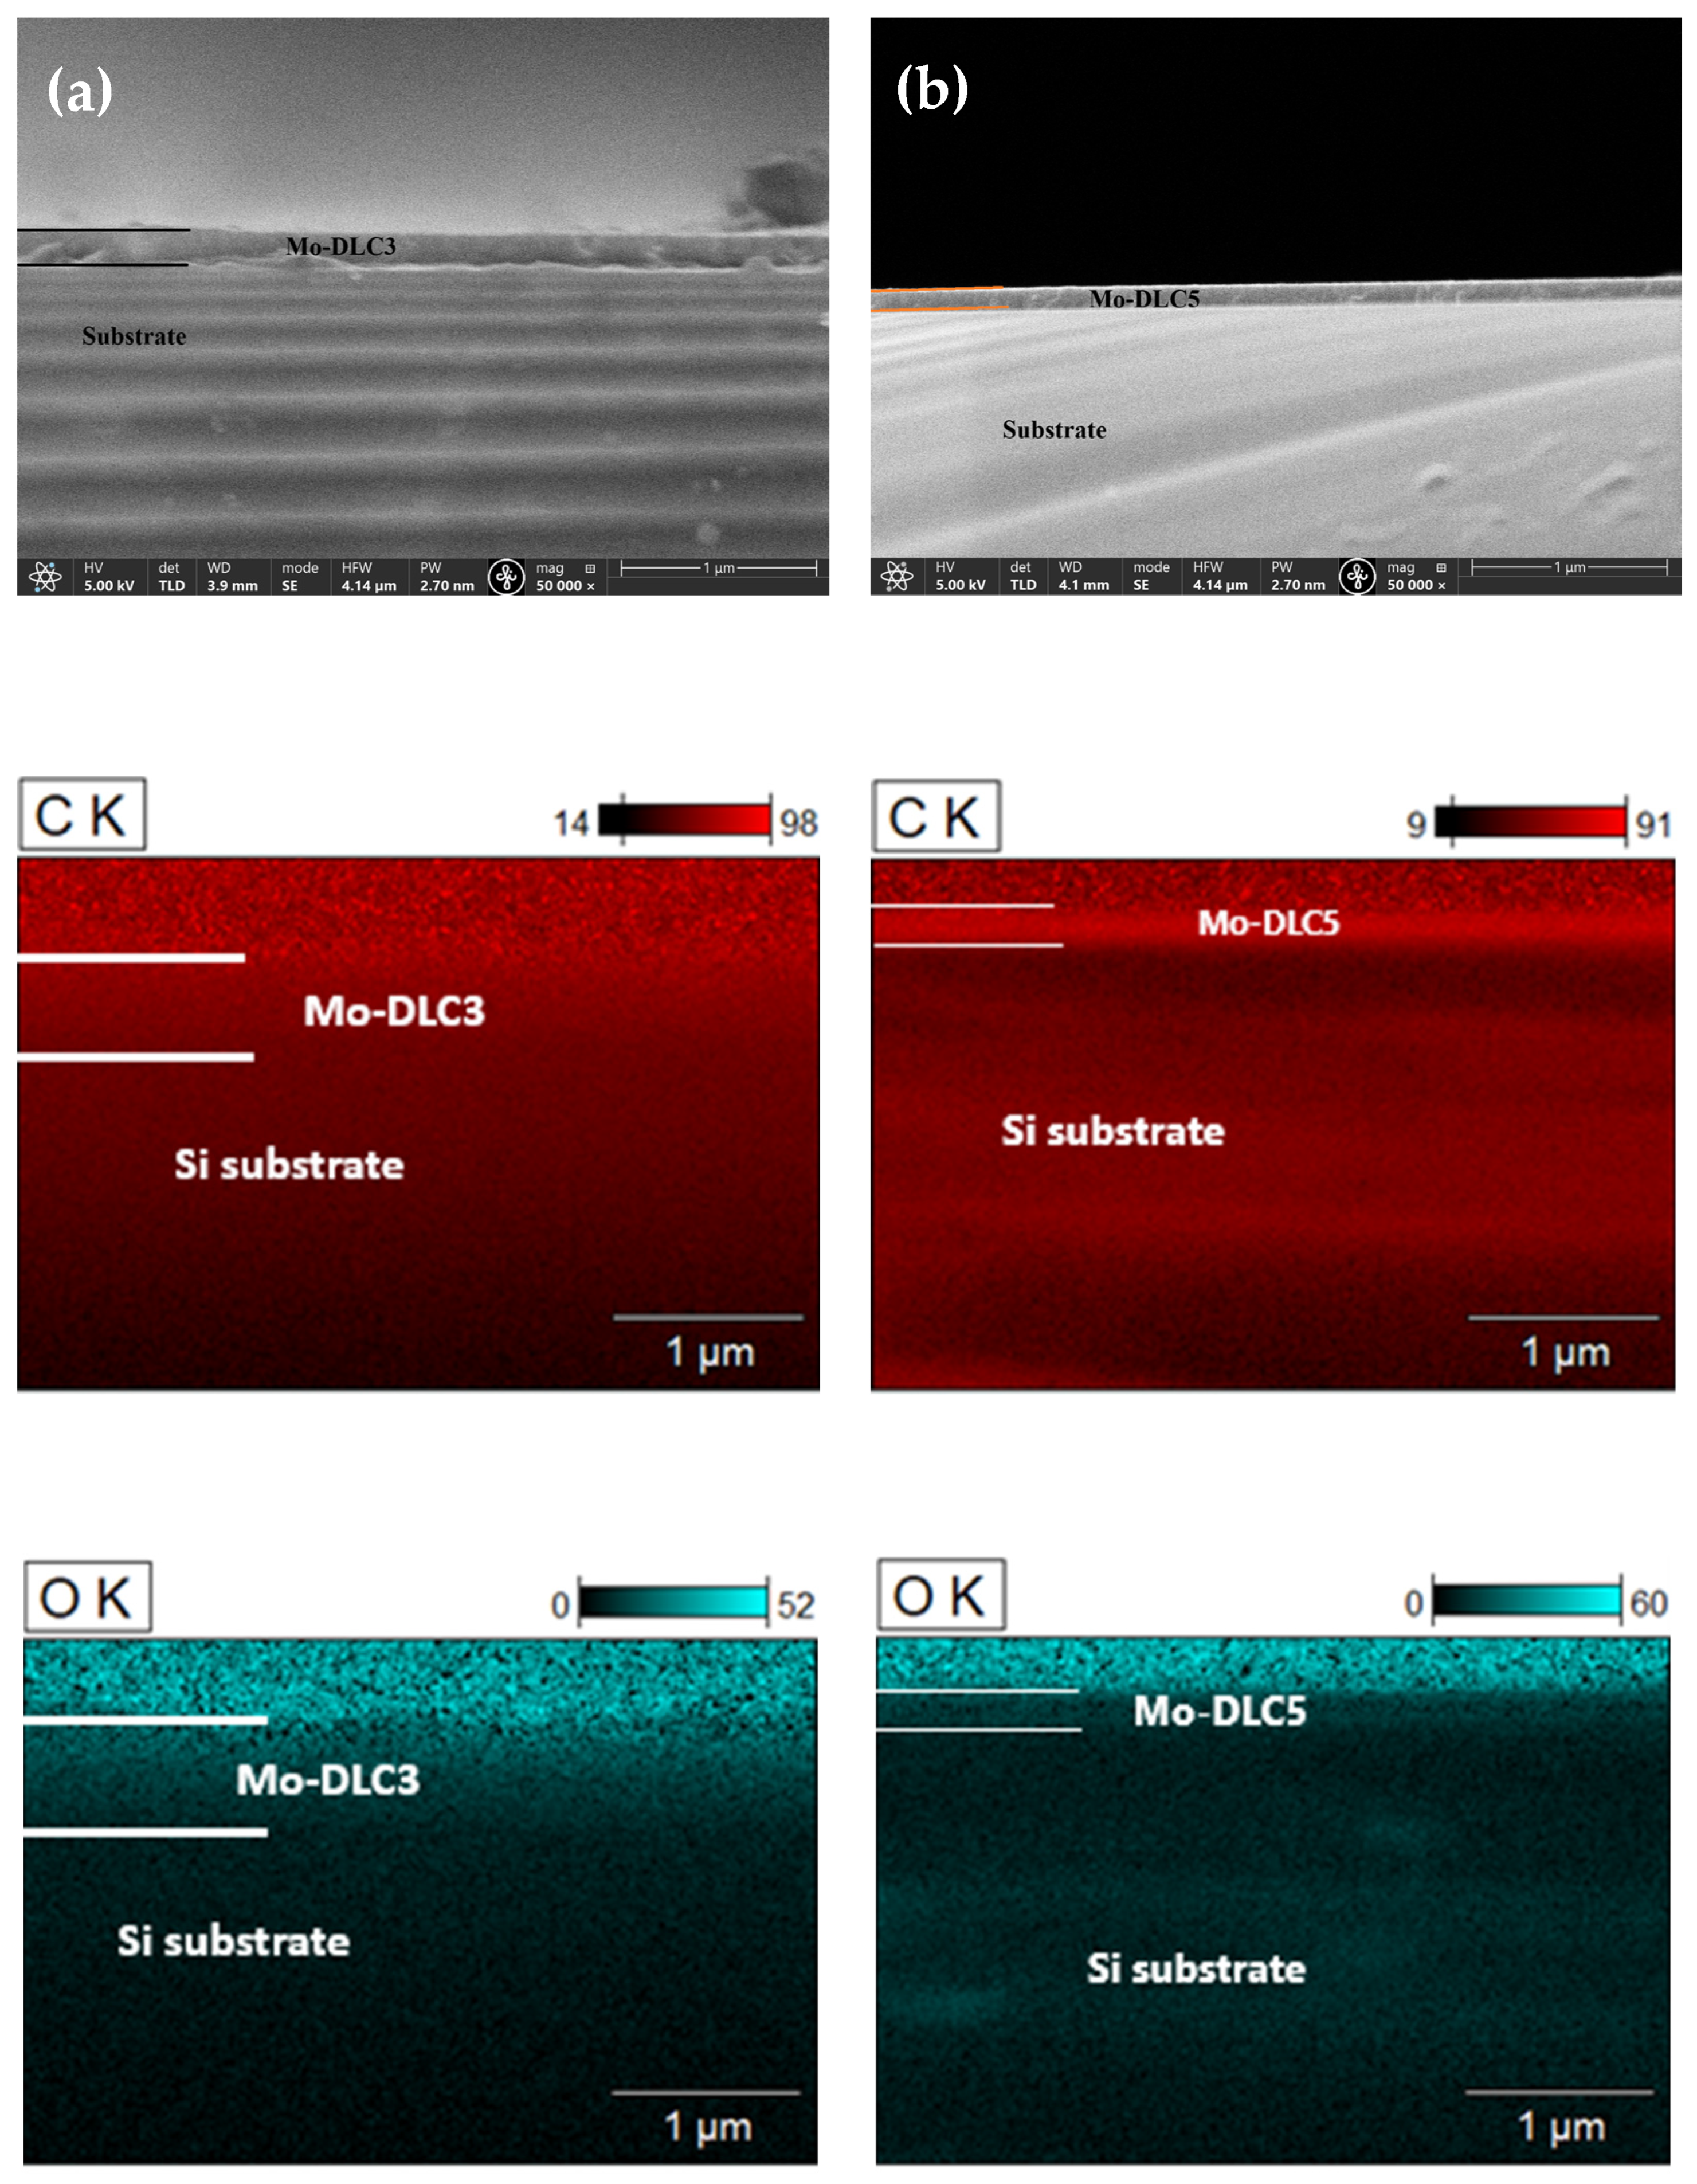
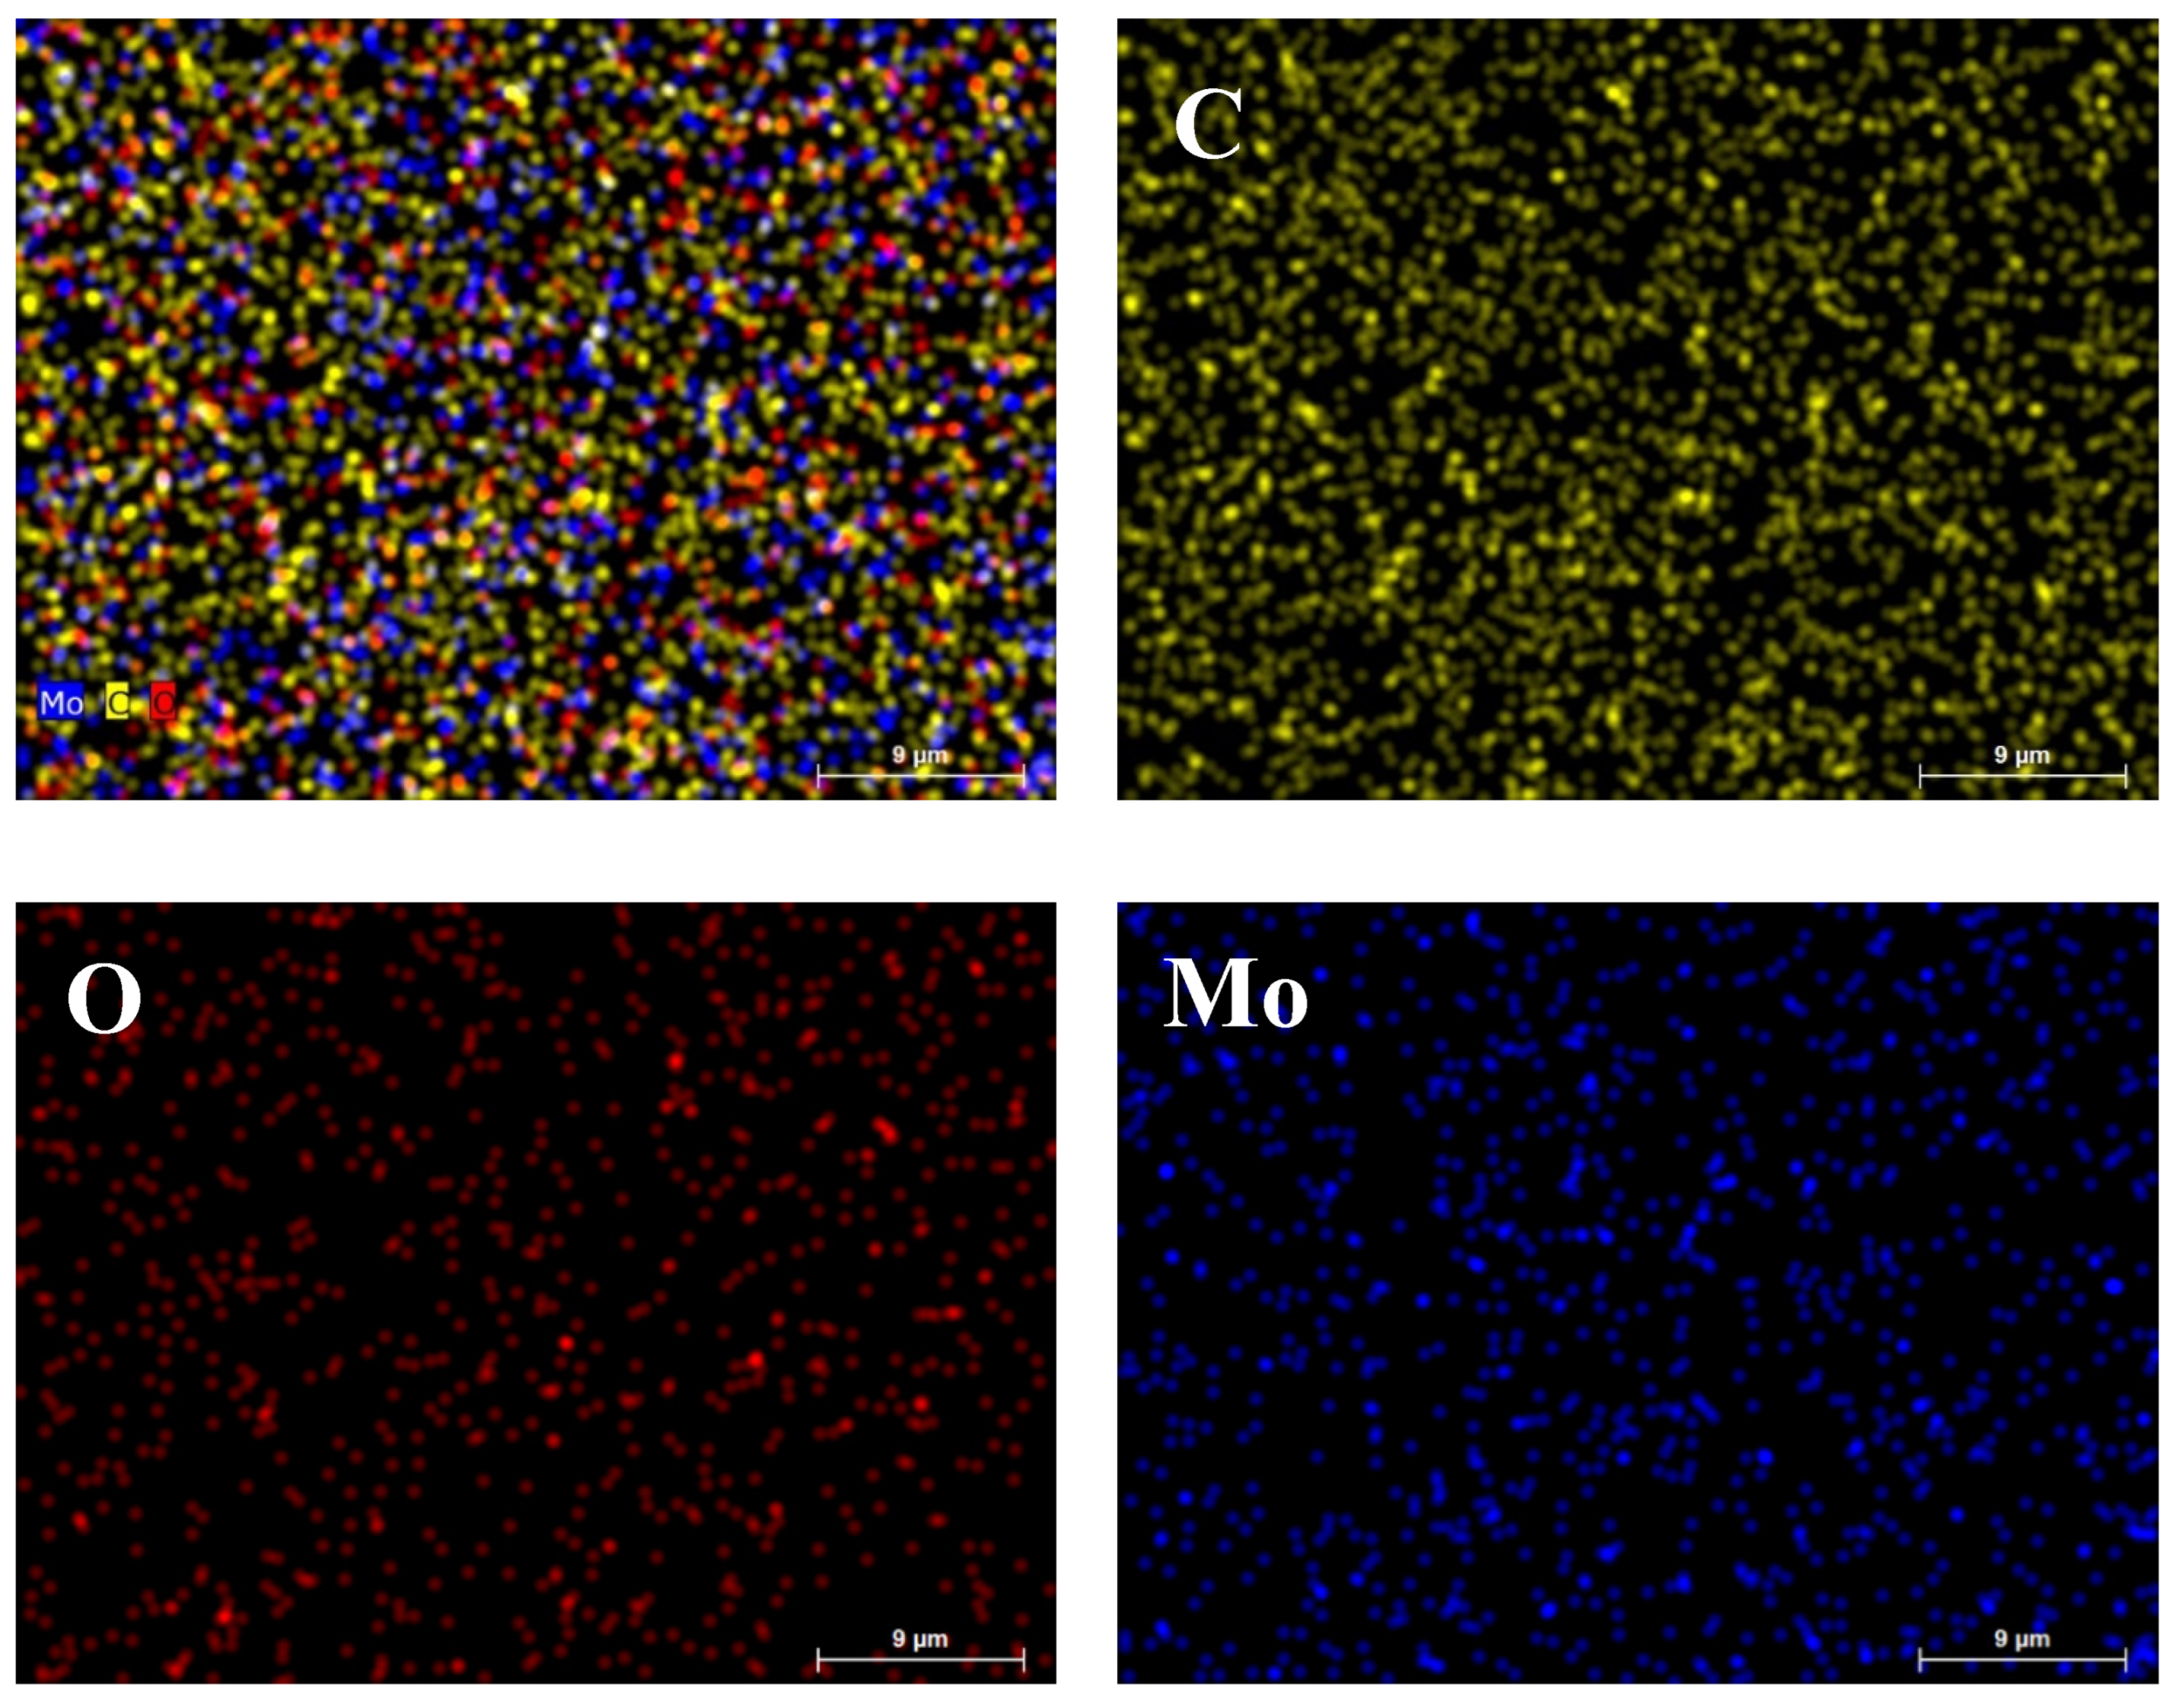
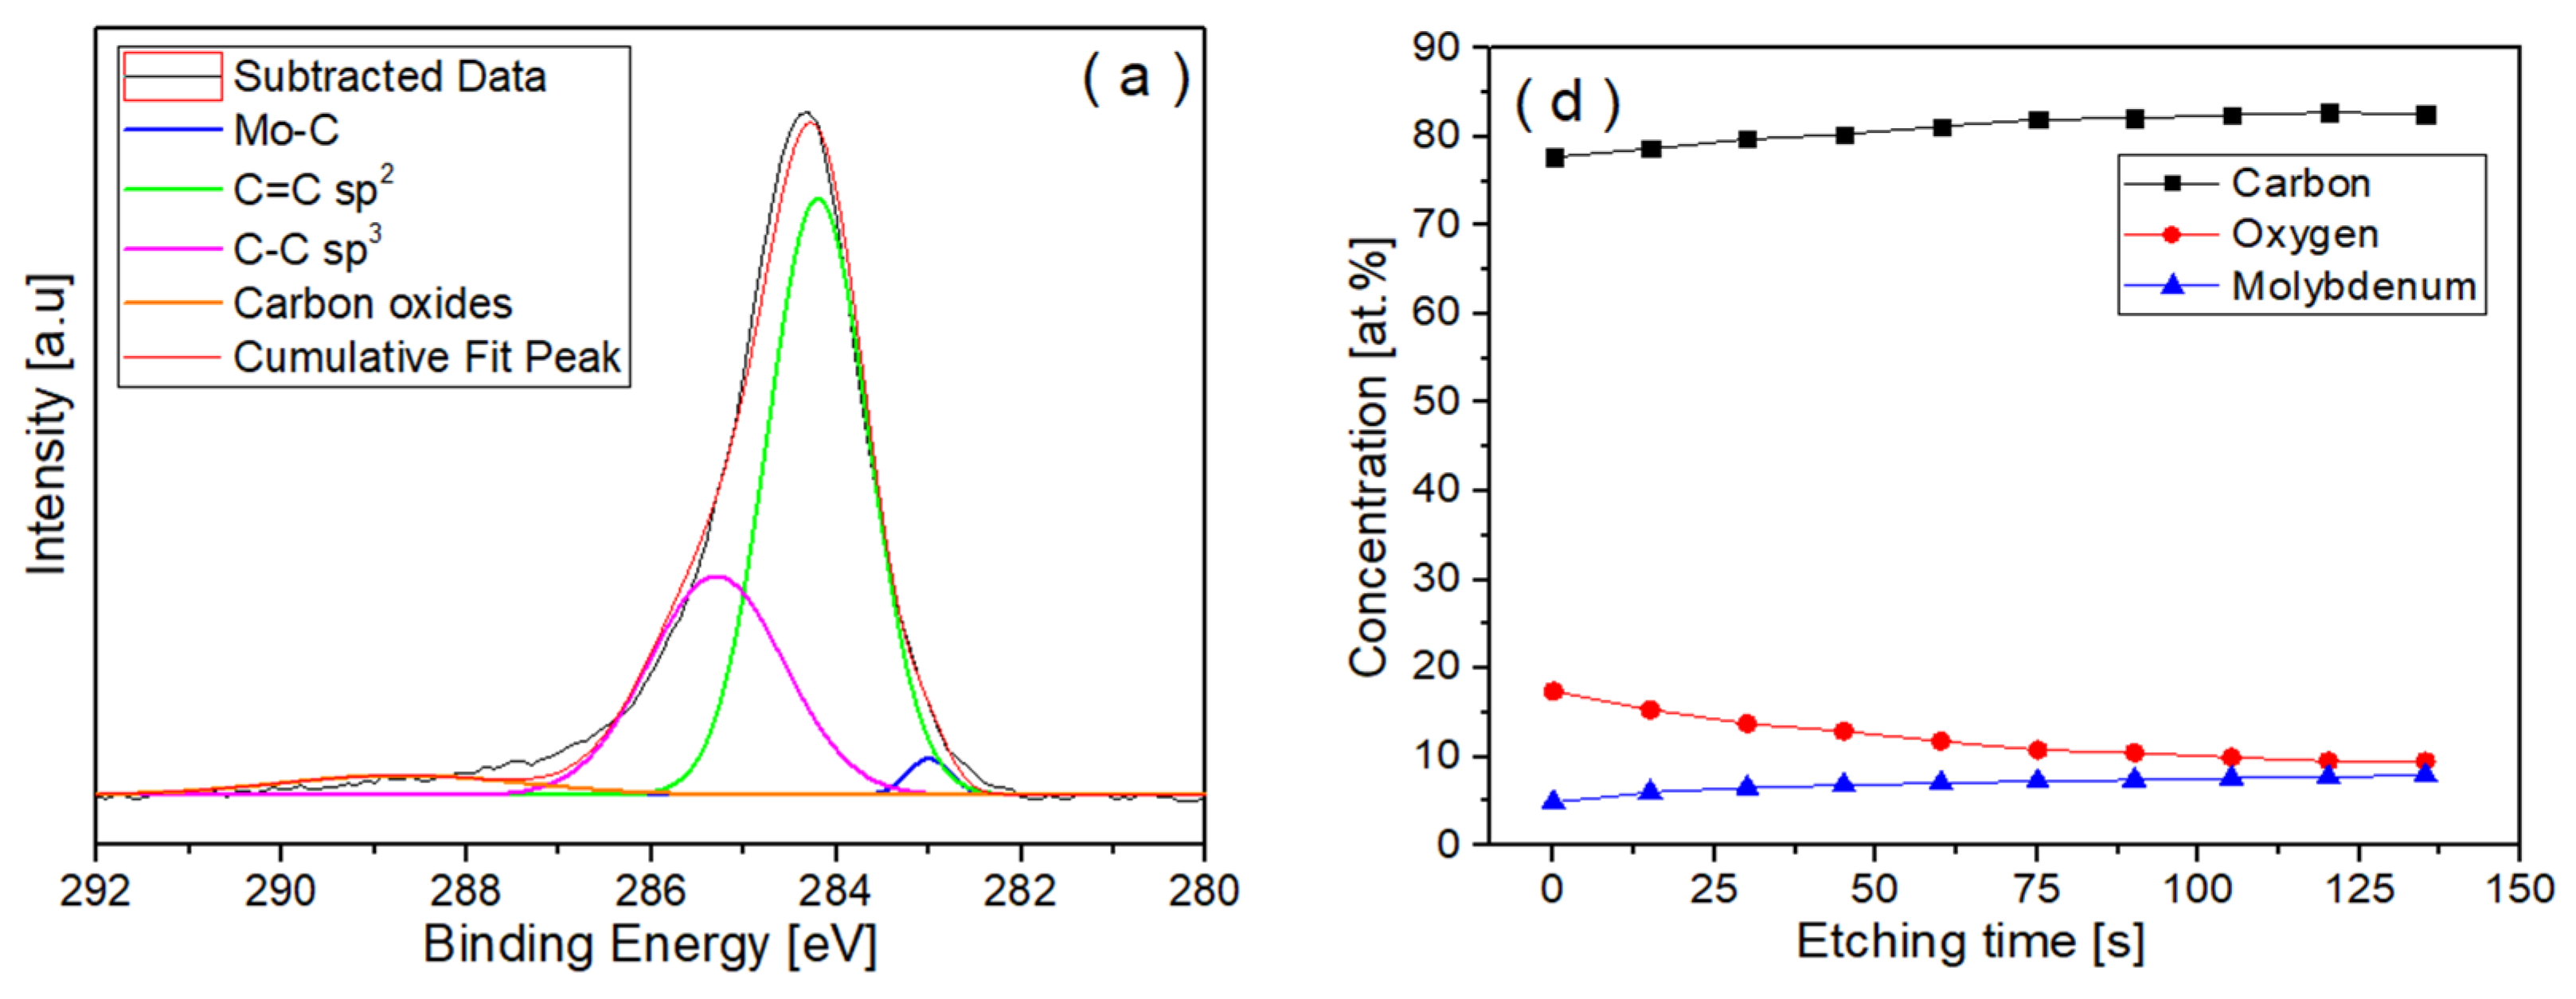
3.1. Elemental Composition Analysis

The compositions of the deposited films are presented in Table 1. EDX data were recalculated to exclude the Si concentration due to the DLC films’ thickness, which ranged from about 150 nm to 210 nm. The metal-free amorphous carbon film comprised 92.5 at.% carbon and 7.5 at.% oxygen with a concentration of 92.5 at.% and 7.5 at.%. In the first series of Mo-DLC films, the distance between the substrate and the targets was fixed at 4 cm, while the Mo concentration was controlled by expanding the width of the slit from 4 to 16 mm. The results indicated that the Mo content increased from 1.2 to 10.3 at.% with the increase in the split widening. The increase in the Mo concentration resulted in a slight enhancement of the oxygen content from 6.5 to 14.2 at.% (Table 1).
The second series of Mo-DLC films was deposited at 4, 6 and 8 cm distances, with the slit aperture maintained at 16 mm. The EDX data demonstrated that the Mo content decreased from 10.3 to 6.6 at.% with the enhancement of deposition distance (Table 1). It was observed that the amount of oxygen in the Mo-DLC films increased with increasing Mo amount or when the formation distance was enhanced. The variation in temperature of the substrates during the deposition of films is illustrated in Figure 1. The temperature gradually increases from room temperature up to ~225 °C after 300 s of deposition at a 4 cm distance. The further increase in the deposition duration results in only a slight increase in the temperature up to 235 °C. The increase in the deposition distance caused a reduction in the deposition temperature. A substrate temperature of 180 °C was reached when the deposition of the Mo-DLC film was performed at an 8 cm distance (Figure 1).
Cross-section images of the Mo-DLC3 and Mo-DLC5 films are presented in Figure 2. The increase in the deposition distance results in a slight reduction in the film thickness from ~210 nm to 150 nm. The elemental mapping cross-section images are shown in Figure 2, as well as in the column below for each Mo-DLC film. The images demonstrate that oxygen is more condensed on the coating at a higher deposition temperature of 235 °C than at a lower deposition temperature of 180 °C. Meanwhile, the Mo was distributed homogenously in the volume of the films, but a slightly higher Mo concentration in the coating was observed when the deposition temperature was 235 °C, compared to the film deposited at 180 °C. The elemental mapping cross-section images indicated that the molybdenum is evenly distributed throughout the whole volume of the Mo-doped DLC films. The oxygen was also evenly distributed throughout all volumes of the films (Figure 2). It was found that the oxygen concentration on the surface of the Mo-DLC films was higher compared to the volume data, as the color (intensity of the obtained signal) was more intense. There is no agglomeration or formation of larger-sized Mo clusters in the films. The thicknesses of the deposited films were determined using SEM images and compared to the EDX data. It was observed that the average thickness of the DLC film was ~180 nm. The addition of the molybdenum slightly enhanced the films’ thicknesses. The Mo-DLC1, Mo-DLC2, and Mo-DLC3 films’ thicknesses were ~210 nm, ~210 nm, and ~205 nm, respectively. Meanwhile, the increase in the deposition distance resulted in a reduction in thicknesses to ~180 nm and ~150 nm for the Mo-DLC4 and Mo-DC5 films, respectively.
Figure 3 illustrates the elemental mapping images of the Mo-DLC5 film. The mapping images show a smooth coating with a relatively even distribution of the oxygen and molybdenum on the measured area of the Mo-DLC5 film. It can be seen that there are no large molybdenum clusters or grains in the film with a size of 10 µm or larger dimensions (Figure 3). Although the synthesis temperature varied from 180 °C to 235 °C depending on the distance used, the Mo atoms are distributed quite evenly without segregation into larger clusters.

3.2. Surface Morphology

The Mo-DLC films’ surface morphology images are presented in Figure 4. The AFM images confirmed that the deposited Mo-DLC films are uniform and demonstrate a continuous morphology. Additionally, the AFM surface images indicated an absence of cracks and that the nanoaggregates are equally distributed over the whole surface area of the films (Figure 4).
The surface roughness data were plotted against the slit opening width and deposition distance (temperature) in Figure 5. The variation in the target–substrate distance, as well as the slit opening, has limited influence on the surface roughness values, as shown in Figure 5.
The average surface roughness (Ra) and root mean square roughness (RMS) values of the DLC film vary between ~1.4 and ~3.1 nm. The lowest RMS value of 1.9 nm was recorded for the Mo-DLC1 film when a low concentration (1.2 at.%) of molybdenum was added to the film and deposition was performed at 235 °C. The additional increase in the Mo concentration increased the coating’s surface roughness up to 3.1 nm. The RMS value was reduced to 2.4 nm for the Mo-DLC3 film as the thickness values of the films were similar. The increase in the roughness of the surface is due to the higher concentration of Mo in the DLC films. As the amount of Mo increased, the probability of agglomeration of Mo atoms into a larger-sized nanocluster during film growth would be higher. Formed Mo nanoaggregates or nanoparticles can protrude from the surface, resulting in increased surface roughness. Additionally, an increase in the metal concentration reduced the formation of the sp3 carbon bonds and stimulated the growth of sp2 sites [17]. This could reduce the density of the Mo-DLC film and result in a rougher surface. The RMS value of the Mo-DLC films increased from ~2.4 to ~4.1 nm when the substrate-to-target distance rose from 4 to 6 cm (Figure 5b). A further increase in the formation distance to 8 cm resulted in a lower deposition temperature of about 180 °C, which led to the formation of the Mo-DLC5 film with an RMS value of ~2.2 nm. The skewness and kurtosis values varied from 0.6 to 1.2 and from 0.3 to 2.3, respectively. The determined skewness and kurtosis values indicated that the surface of the films is uniform and shows only little variation in the surface height. According to Padmanaban et al. [11], the increase in Mo concentration will stimulate the growth of a higher fraction of the molybdenum carbide phase, increasing the metallicity of the film and the roughness of the surface. Another reason for the increase in the roughness of the surface mentioned by V. S. Yadav et al. [23] and J. Robertson [27,28] could be the graphitization of the DLC coatings due to the addition of Mo, in which the sp3 C–C sites were replaced by the p2 C=C bonds. According to the literature, within the range of 1–6 at.% of Mo concentration in the films, the molybdenum carbide (MoC) phase is formed when the deposition temperature is approximately ~200 °C. However, the fraction of the MoC phase in the Mo-DLC coatings was very low, only up to 3% of all carbon sites [11,29]. The substrate temperature at distances of 4 and 6 cm during the synthesis of Mo-DLC films reached 235 °C and 225 °C, respectively. Meanwhile, the temperature was about 180 °C when the deposition of the Mo-DCL films was performed at 8 cm. Thus, the MoC phase is expected to develop with a higher concentration of Mo in the films and/or at higher deposition temperatures (4 cm and 6 cm distances). This could explain the enhancement of the surface roughness in the film deposited at 6 cm distance compared to the Mo-DLC5 film (Figure 5).

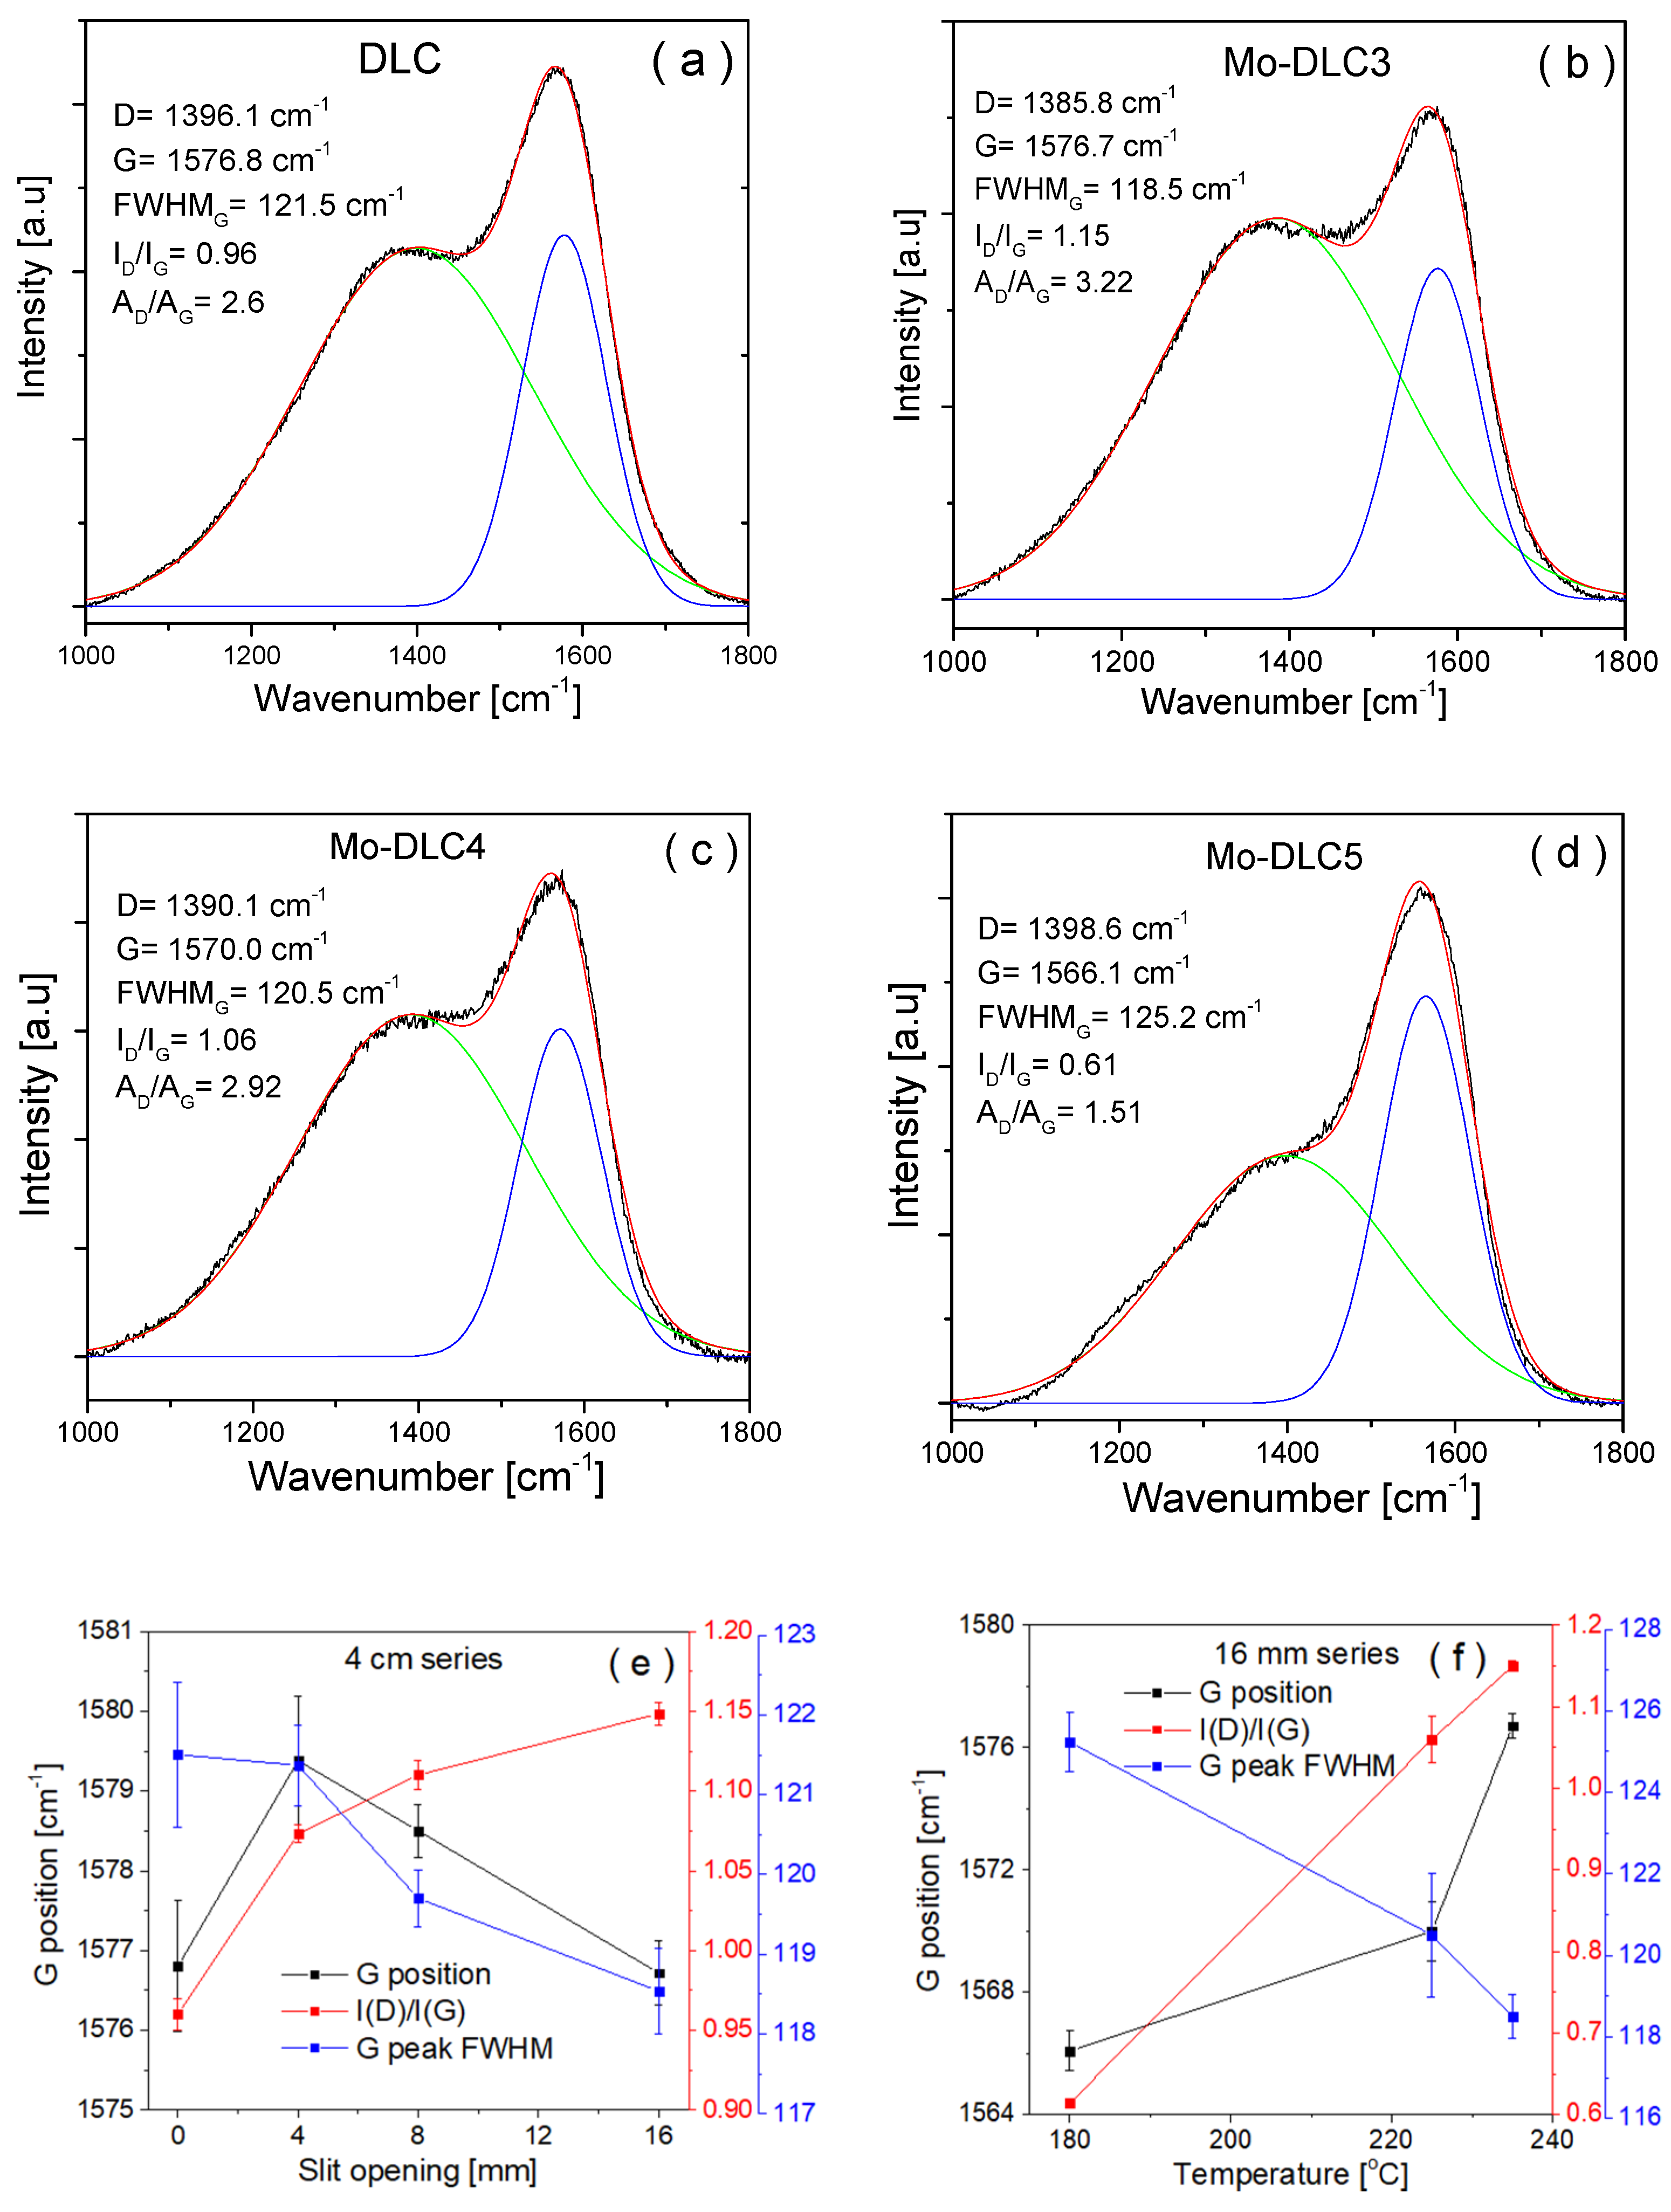
3.3. Raman Spectroscopy Results

The Raman spectra of DLC films primarly concentrate on the range of 1000 to 1800 cm−1, where the bands correspond to the A1g breathing mode (D-band) of disordered sp2 carbon atom sites resembling aromatic ring structures and the E2g stretching mode (G-band) of disordered sp2 bonds associated with aromatic and olefinic molecules [27]. Gaussian fitting was used to identify the D and G bands in the Raman spectra of the Mo-DLC films. The fitted Raman spectra in the 1000–1800 cm−1 range are presented in Figure 6. Figure 6e,f illustrates the variation in the G band locations, the intensity ratios of the D to G peaks (ID/IG), and the full width at half maximum of the G band (FWHMG) in relation to the Mo concentration in the films. Figure 6e displays the Raman parameter data for the coatings produced at the maximum (235 °C) temperature. The G peak position, ID/IG ratio, and FWHMG values of DLC films were obtained at 1576.8 cm−1, 0.96, and 121.5 cm−1, respectively. The ID/IG ratio increased to 1.08, and a slight reduction in FWHMG was observed with the doping of 1.2 at.% of Mo in the films. The enhancement of the Mo content to 6.3 at.% in the DLC film resulted in an ID/IG ratio of 1.12 and narrowed the FWHMG to 119.6 cm−1. The ID/IG ratio increased to 1.15, and the FWHMG narrowed down to 118.5 cm−1 when the amount of Mo in the film increased to 10.3 at.%. It is known that the enhancement of the ID/IG ratio and the narrowing of the FWHMG of the doped DLC coatings are related to a reduction in sp3 carbon amount, which demonstrates the growth of larger sp2 clusters in the coatings [30,31,32].
Additionally, these trends indicate an increase in the size of the sp2 C=C clusters in the carbon matrix [18]. Similar trends and an increase in the sp2 bond fraction, which indicated the transition of sp3 to sp2 sites in the doped DLC films, were obtained in several studies when a small amount of Mo was used [11,29,33]. The narrowing of the FWHMG and enhancement of the ID/IG ratio in the Mo-DLC films could also be related to an increase in the oxygen content [34]. The addition of the oxygen increased the sp2 cluster size, promoted the formation of more sp2 C=C bond sites, and reduced the disorder degree of sp2 bonds due to reductions in angle and bond length. The disordered degree in the DLC or doped DLC depends on the carbon bond length. The C–C bond length in the DLC films is between 0.133 and 0.175 nm. The sp2 bond length is 0.142 nm, while for the sp3 bond, it is 0.154 nm. Meanwhile, the Me-C bond length in the metal-doped DLC films is usually greater than 0.2 nm, depending on the type of carbide-forming metal [35]. The doping of DLC with metal stipulates the formation of weak Me-C covalent bonds between the metal atoms and the carbon atoms, instead of the growth of strong C–C covalent bonds, resulting in distortion of the sp3 bond length and angle. Figure 6f displays Raman data of the film’s spectra deposited with the slit opening set at 16 mm at various temperatures. The results indicated that the ID/IG ratio and FWHMG values of the Mo-DLC3 film were about 1.15 and 118.5 cm−1, respectively. The ID/IG ratio linearly decreased to 0.61 and the FWHMG broadened up to 125.2 cm−1, when the deposition temperature was reduced to 180 °C (amount of Mo decreased to 6.6 at.%). The G peak position of the Mo-DLC3 film was about 1576.7 cm−1 at 235 °C. A reduction in temperature to 180 °C shifts the G peak to a lower position at 1566.1 cm−1 for the Mo-DLC5 film. This variation indicates an increased production of sp3 C–C bonds and demonstrates a decrease in the size of the sp2 cluster inside the synthesized Mo-DLC films. The impact of temperature is noticeable by comparing the Mo-DLC3 film formed at the highest temperature and the Mo-DLC5 film synthesized at the lowest temperature. Raising the synthesis temperature from 180 to 235 °C diminishes the quantity of sp3 carbon bonds and facilitates the formation of sp2 clusters in the coating. H. Li et al. [10] observed that the rise in the synthesis temperature from 30 °C to 400 °C enhanced the sp2 content in the a-C films, and smaller-sized sp2 clusters were formed in the films. Also, the concentration of Mo was higher in the Mo-DLC3 film than in the Mo-DLC5 film. Therefore, a higher Mo content also inhibits the growth of sp3 bonds and stimulates the growth of the sp2 C=C bonds in the coatings [16,28,36].

3.4. XPS Results

An XPS investigation was conducted to determine the distribution of oxygen and molybdenum in the volume of the films and to obtain additional information about the sp2, sp3, and carbon–oxygen bonds (Figure 7).
The C1s spectra of the Mo-DLC films are illustrated in Figure 7a–c and Figure 8 presents an example of the Mo 3d core level spectra of the film Mo-DLC2. The fitting data of the peaks in the C1s and Mo 3d spectra of the Mo-DLC films are presented in Table 2. The fitted data of C1s and Mo 3d spectra are provided after 75 s of etching time. The C1s spectrum of the Mo-DLC2 film consisted of four peaks at 283.0 eV, 284.2 eV, 285.3 eV, and 288.7 eV, which are attributed to the Mo–C, sp2 C=C, sp3 C–C, and carbon–oxygen bonds, respectively, [8,29,37,38]. The curve-fitted C1s core level spectra of the Mo-DLC3 film exhibit bands at 284.2 and 285.3 eV, which are designated as sp2 carbon sites (C=C) and sp3 carbon sites (C–C), respectively, [37], while the band at 283 eV is ascribed to the Mo–C bond [38]. The broad peak located at 289.3 eV is related to the peaks attributed to the mixture of C–O (286.7 eV) and C=O (288.9 eV) bonds [37]. The C1s spectrum of the Mo-DLC5 film was analyzed, revealing peaks located at 284.4 eV, 285.3 eV, and 289.2 eV, corresponding to C=C, C–C, and C–O/C=O bonds, respectively, [37,38,39]. It should be noted that a molybdenum carbide peak was not observed in the spectrum of the Mo-DLC film.
The Mo 3d core level spectrum between 225 and 238 eV reveals the presence of many Mo sites within the film (Figure 8). The Mo 3d spectra exhibited two main peaks at ~228.8 eV and 232.0 eV, attributed to the 3d5/2 and 3d3/2 core levels [17,29]. The spectra of the Mo-DLC films were divided into four distinct peaks at 228.3 ± 0.1 eV, 228.7 ± 0.1 eV, 229.3 ± 0.3 eV, and 232.4 ± 0.1 eV (Table 2). The peak at 228.4 eV is ascribed to a molybdenum carbide (Mo–C) bond. The bonds of molybdenum oxides are generally observed at 227.8 eV for Mo2+, 228.7 eV, 229.4 eV, and 232.2 eV for Mo4+, and 232.6 eV and 235.4 eV for Mo6+ [8].
In addition, information about the bonding state of the Mo was investigated (Table 2). The distribution of molybdenum, carbon, and oxygen versus etching time in the Mo-DLC films is presented in Figure 7. The XPS data indicated that the oxygen content on the surface of the Mo-DLC films was higher compared to the bulk oxygen concentration (Figure 7d–f). These data indicated that oxygen could rise due to the exposure of coatings to the atmosphere after deposition and due to possible residual oxygen in the vacuum chamber during the coating deposition process. The concentration of oxygen on the surface of Mo-DLC3 was 24.4 at.%. The oxygen content decreased proportionally from 24.4 at.% at the sample’s surface to about 14 at.% after 100 s of etching. Meanwhile, the carbon and molybdenum concentrations increased and became stable after 75 s of etching (Figure 7e). It should be noted that the Mo concentration varied from 14 to 17 at.%, which was higher than the Mo concentration obtained by the EDX measurement. A reduction in the oxygen concentration from 11.4 at.% to 6.3 at.% was observed with an increase in the etching time up to 90 s for the Mo-DLC2 film. The further increase in the etching time up to 135 s led to a slight variation in oxygen content between 6.2 at.% and 6.0 at.% in the film (Figure 7).
Moreover, the Mo content determined by the XPS data and EDX measurement in the Mo-DLC2 film remained similar. The O and Mo concentrations on the surface layer of Mo-DLC5 were 17 at.% and 4.9 at.%, respectively. However, the oxygen concentration was reduced to 10.0 ± 0.5 at.% at a higher depth. Meanwhile, the molybdenum content was increased to ~7.4 at.%. The XPS results indicated that the oxygen concentration in the surface layer is higher compared to the bulk, as illustrated in Figure 7d–f. This is due to the interaction of the surface layer with the ambient air after the deposition. The EDX mapping images obtained on the surface of the Mo-DLC films demonstrated a uniform distribution of molybdenum and oxygen (Figure 2 and Figure 3). It should be noted that no cluster formation of oxygen or molybdenum was observed. As the films were deposited using layer-by-layer deposition, a uniform distribution of the Mo and O was observed throughout the bulk of the films. However, this deposition technique led to a slightly higher content of oxygen in the Mo-DLC films compared to the typical magnetron sputtering of metal-doped DLC films [11,14,17].
Table 2 illustrates the binding energies and relative peak areas of the carbon and molybdenum bonds in Mo-DLC2, Mo-DLC3, and Mo-DLC5 films after 75 s of etching time. The results demonstrated that the relative peak area of Mo–C bonds increased from 10 to 26% with an increase in the deposition temperature from 180 to 235 °C. Additionally, the sp2 C=C amount increased from 59% to 63%; meanwhile, the sp3 C–C content dropped from 35% to 29%, and the sp3/sp2 bond ratio lowered from 0.593 to 0.460 with the reduction in the synthesis temperature. Raman spectroscopy also indicated an enhancement of the sp3 carbon site quantity in the Mo-DLC5 film.
The results of the Mo 3d spectrum fitting are presented in Table 2. The results demonstrated that the proportion of Mo–C bonds increased from 20.9% to 26% with the increase in the molybdenum concentration in the films. The Mo-DLC2 film exhibited elevated levels of Mo2+ (41.3%) and Mo6+ (10.2%) bonds compared to the Mo-DLC3 film (Table 2). Meanwhile, the proportion of Mo4+ bonds significantly increased from 27.6% to 36% with the addition of molybdenum during film synthesis at 235 °C. The decrease in temperature from 235 °C to 180 °C resulted in the reduction in the Mo–C bonds from 26% to 10%, and significantly enhanced the fraction of the Mo6+ bonds in Mo-DLC films from 7% to 31%, respectively. The increase in Mo content from 6.3 at.% (Mo-DLC2) to 10.3 at.% (Mo-DLC3) enhanced the Mo–C bond content in the films by 29%. Also, the sp2 and sp3 bond areas were slightly reduced, leading to a reduction in the sp3/sp2 ratio from 0.473 to 0.460. Meanwhile, the carbon–oxygen bond area in the Mo-DLC2 and Mo-DLC3 films remained similar despite a rise in the oxygen concentration from 11.1 at.% to 14.2 at.%. It should be noted that the Mo-DLC films formed at 235 °C exhibited up to three times greater quantities of molybdenum carbide bonds compared to the Mo-DLC film produced at 180 °C. Thus, the reduction in the formation temperature prevented the formation of the molybdenum carbides in the film. Overall, the decrease in the sp3/sp2 bond ratio can be associated with the catalyst effect of Mo atoms due to the preferred generation of sp2 C=C sites. Since sp2 carbon exhibits lower binding energy in comparison to sp3 carbon sites, carbon tends to combine with Mo and create Mo–C bonds. It was found that the amount of molybdenum carbide phase increases with the increase in molybdenum content in the DLC films [11,29]. The Mo content increased from 6.0 at.% to 28.8 at.%, and the sp3/sp2 ratio was reduced from 0.95 to 0.77, respectively [29]. S. Rabadzhiyska et al. [40] studied the effect of formation temperature on the microstructure of DLC films deposited at 300 °C, 400 °C, and 500 °C. It was observed that the maximum quantity of sp3 C–C bonds was obtained at 300 °C, and with the increase in the substrate temperature, the quantity of sp3 carbon sites was reduced. L. Ji et al. [33] demonstrated that the molybdenum content increased from 19 at.% to 28 at.% with the increase in sputtering current. At the same time, Mo was transformed into molybdenum carbide due to the increased mobility of carbon and molybdenum atoms, leading to higher substrate temperatures.
The EDX and XPS results Indicated that the oxygen content was enhanced when the distance between the substrate and the sputtering targets increased. Additionally, it was observed that the oxygen concentration depends on the Mo content in the films. The ion energy and atomic flux densities were the highest when the Mo-DLC film was deposited at a 4 cm distance. Also, the kinetic energy of the arriving carbon and molybdenum atoms is the highest. This will result in higher diffusion rates of atoms on the surface and an increase in the substrate temperature. However, an increase in the substrate temperature during the formation of the diamond-like carbon film stipulates the conversion of sp3 carbon bonds to sp2 bonds. An increase in the distance will result in lower kinetic energy of atoms due to the increased path length of atoms and the number of collisions before reaching the substrate. Extended distances will increase the probability of carbon and molybdenum atoms interacting with the residual gas (air), resulting in an increased production of carbon–oxygen and molybdenum–oxygen bonds inside the films. Enhanced oxidation is typically noted for metal atoms that have lower kinetic energy. Reduced surface mobility of the molybdenum adatoms will inhibit the diffusion of Mo atoms and promote oxidation much faster compared to the Mo-DLC films deposited at 4 cm or 6 cm target–substrate distances. As a result, the oxygen content in the films increased from 14.2 to 20.4 at.%. As the oxygen tends to preferentially bond with sp2 carbon sites, the fraction of sp3 C–C bonds will be greater in films deposited at increased distances compared to films formed at a 4 cm target-to-substrate distance. Also, as the concentration of Mo increased from 1.2 at.% to 10.3 at.%, the amount of oxygen increased from 6.5 at.% to 14.2 at.%. An increase in oxygen concentration from 5.7 to 20.5 at.% was observed in the Ti-W co-doped DLC films when the W content increased from 2.6 to 34.5 at.% [36]. The authors indicated that the main reasons for the occurrence of oxygen in the doped DLC films may be related to the level of oxygen in the vacuum chamber, the insufficient purity of argon and methane gases, and the desorption of oxygen from the deposition chamber walls during the synthesis of DLC films. The presence of higher concentrations of oxygen in the surface layer of the Mo-DLC films, identified by XPS (Figure 7), clearly indicates that some oxygen was absorbed post-deposition. Meanwhile, the oxygen content at higher depths measured by XPS was similar to the average concentrations of oxygen determined by the EDX measurements.

3.5. Determination of Mechanical Properties

The variation in nanohardness and Young’s modulus versus indentation depth for the DLC and Mo-doped DLC films is presented in Figure 9. Meanwhile, the average nanohardness and Young’s modulus of the films are presented in Table 3. The average values of nanohardness and Young’s modulus were ascertained to be up to 100 nm in depth, as the influence of the Si wafer (substrate) could take place when the identification depth is higher than half the thickness of the films (Table 3). For the films formed at 235 °C, the DLC film exhibited a hardness of ~8.0 Gpa and a Young’s modulus of 60.5 Gpa. As a low amount (1.2 at.%) of molybdenum was introduced, a slight decrease in the average hardness value from ~8.03 to 7.84 Gpa was observed (Table 3). The nanohardness of the Mo-DLC1 film reached 8.5 Gpa at depths up to 50 nm and marginally diminished to 7.5 Gpa with increased identification depth (Figure 9a).
The Young’s modulus slightly increased from 60.5 up to 65 GPa as the Mo concentration further increased. The nanohardness and Young’s modulus values of the Mo-DLC2 film are 6.3 GPa and 49 GPa, respectively. The hardness value slightly increased to 6.5 GPa when the Mo content in the film was enhanced to 10.3 at.%. Additionally, the Young’s modulus of the Mo-DLC3 film was ~65 GPa (Figure 9c). The slight increase in the nanohardness of the Mo-DLC3 films could be related to the formation of a higher content of the Mo–C phase. The reduction in the synthesis temperature to 225 °C improved the nanohardness to 7.41 GPa. The increase in the deposition distance to 8 cm reduced the deposition temperature to 180 °C, and led to the growth of the Mo-doped DLC film with hardness and Young’s modulus values of 8.2 and 83.7 GPa, respectively (Figure 9d). Compared with the Raman results, for the first four films (deposited at 235 °C), the increase in Mo doping from 0 to 10.3 at.% (Table 1) led to an increase in ID/IG ratio from 0.96 to 1.15 (Figure 6e). The change is assigned to a lower sp3 C–C content and formation of a higher fraction of sp2 C=C sites, which is consistent with the nanohardness results, indicating the decrease in hardness from ~8.0 to 6.5 GPa (Table 3). This consistency applies to the second series of films deposited at 16 mm slit opening width, where the ID/IG ratio distinctly decreased from 1.15 to 0.61 (Figure 6f). This change in the microstructure was reflected in an augmentation in nanohardness from 6.49 GPa to 8.24 GPa, respectively (Table 3). The enhancement of the synthesis temperature causes the rearrangement of sp3 bonds to sp2 bonds, which leads to an increase in the ID/IG ratio and the growth of Mo-DLC films with lower nanohardness.
In the literature, the typical hydrogen-free a-C coatings have significantly higher values of hardness [28]. The values of hardness we obtained in this work indicate the formation of a high fraction of sp2 carbon sites in the films. Principally, the hardness and elastic modulus of the DLC or metal-doped DLC coatings are enhanced as the fraction of sp2 sites transforms into sp3 bonds [17,40,41]. Guo et al. [42] tested the mechanical properties of Al-doped DLC films and obtained an increase in hardness with the growing quantity of sp3 sites. S. Rabadzhiyska et al. [40] revealed that the highest average hardness of 4.5 GPa was measured for a DLC film formed at 300 °C with an elastic modulus of 146 GPa. Zou et al. [41] obtained a similar trend for Cr-doped DLC films, where the main reason is the presence of C–Cr sites or the formation of a metal phase, which disrupts the consistency of the carbon network within the coatings.
Moreover, the enhancement of oxygen content leads to a reduction in hardness as a higher quantity of C–O and C=O bonds are formed [43,44]. Tang et al. [16] and Zhao et al. [29] demonstrated that the addition of Mo atoms creates clusters of Mo nanoparticles and disrupts the continuity of the carbon network, resulting in a reduction in hardness (from 6.8 GPa to 5.5 GPa) and elastic modulus of the Mo-DLC films with the enhancement of the molybdenum amount. Y. Su et al. [17] observed that the formation of the MoC hard phase (~26 GPa) in the carbon matrix of the Mo-DLC films increased the hardness values, despite the reduction in the sp3 carbon site fraction. In Table 3, the mean hardness, Young’s modulus values, and the hardness/elastic (H/E, H2/E, and H3/E2) ratios of the DLC and Mo-DLC coatings are presented. Tripathi et al. [45] observed that the H/E ratio is attributed to wear resistance and elastic strain failure, and varies between 0 (plastic behavior) and 0.1 (elastic behavior) for DLC coatings [45]. The H3/E2 ratio is a metric that determines the ability of films to assimilate the load energy resulting from plastic deformations [24,45].
It was observed that the addition of 10.3 at.% of molybdenum in the DLC film led to a decrease in the H/E ratio from 0.133 to 0.100 GPa, while the H3/E2 ratio decreased more than twice from 0.141 GPa down to 0.064 GPa. The slight reduction in the deposition temperature had a huge effect on the H/E ratio and H3/E2 ratio values. The H/E ratio was increased from 0.100 to 0.138, while the H3/E2 ratio was enhanced ~2.5 times when the temperature was reduced from 235 to 225 °C. The H/E ratio was lowered from 0.138 to 0.098 with the decrease in the synthesis temperature to 180 °C (Table 3). However, the H3/E2 ratio of the Mo-DLC5 film was reduced from 0.158 GPa to 0.080 GPa. Usually, the higher the H/E and H3/E2 ratios, the greater the toughness of the DLC film, wear resistance, and lower wear volume of the doped DLC films [7,46,47]. Additionally, it was observed that the H3/E2 ratio is related to the densities of the amorphous carbon films. The density of the DLC films is enhanced with the increase in the H3/E2 ratio [20]. Therefore, this result indicates that the toughness of the Mo-doped DLC films was reduced with an increase in Mo concentration at 235 °C, showing the highest H/E and H3/E2 ratios for the undoped DLC coating with 0.141 and 1.064 GPa, respectively. The decrease in the H3/E2 ratio from 0.114 to 0.064 with the increase in Mo content in the DLC films indicated a reduction in film density. The density of the metal-doped DLC decreases due to a reduction in the fraction of sp3 sites and an increase in oxygen incorporation, which leads to the formation of C=O and C−O bonds [20]. The XPS and EDX data demonstrated that the amount of oxygen was enhanced with the rise in Mo content. Additionally, the higher Mo concentrations in the DLC film reduced the sp3 site fraction and increased the sp2 bond content. Meanwhile, the reduction in temperature led to the formation of the Mo-DLC5 film with higher elastic values and plastic deformation resistance compared to the Mo-DLC3 film. However, the highest values of the H/E and H3/E2 ratios were demonstrated by the Mo-DLC4 film. Such values for the Mo-DLC4 film may be due to the lower deposition temperature compared to the Mo-DLC3 film, since the sp2/sp3 ratio decreases with the reduction in the deposition temperature, as confirmed by Raman data. Additionally, the oxygen concentration was also quite low compared to the film formed at 180 °C or the Mo-DLC2 film with a similar concentration of molybdenum. Such data led to suggestions that the reduction in oxygen concentration could significantly affect nanohardness and elasticity values, due to the emergence of a lower number of C−O and C=O bonds in the films. In summary, it can be stated that the hardness decreased not only with the increase in the amount of sp2 bonds due to an elevation in the deposition temperature or Mo concentration, but also with the enhancement of the concentration of oxygen in the Mo-DLC films.

3.6. Determination of Friction Coefficient

The friction force on the Mo-DLC film surfaces was assessed based on the applied loads, ranging from 10 nN up to 45 nN, and is presented in Figure 10. The friction force for all coatings was observed to increase proportionally with the applied load. For the films deposited at 235 °C, as the applied normal force increased, the friction force slightly rose from 2.4 to 3.3 nN for the Mo-DLC1 film (Figure 10a). An analogous tendency was obtained for the films with higher Mo content (Mo-DLC2 and Mo-DLC3).
The friction force started from slightly higher values of 2.9 nN and increased up to 3.8 nN with the increase in the load from 10 nN to 45 nN. The slope of these curves can represent the friction coefficient of each film [48]. It was determined that the friction coefficient of the Mo-DLC1 film was 0.029. The Mo-DLC2 and Mo-DLC3 films exhibited almost identical friction coefficients of 0.038. Figure 10b illustrates the relationship between friction force and applied load for Mo-DLC films deposited at varying temperatures. The friction force sharply increased from 4.4 to 11.6 nN with the increase in the normal force from 10 to 45 nN when the deposition was performed at 180 °C. The friction coefficient of the Mo-DLC5 film was 0.21. The results indicated that the Mo-DLC5 film demonstrated a friction coefficient value 5.5 times higher compared to the friction coefficient of the Mo-DLC3 films deposited at 235 °C. This sharp increase in the friction coefficient could be attributed to various factors. The reduction in the deposition temperature increased the sp3 bond fraction but also enhanced the oxygen concentration in the film. The EDX results indicated that the oxygen content in the Mo-DLC5 coating was higher compared to the oxygen values observed in the Mo-DLC3 film. The XPS results indicated that the Mo-DLC5 has a higher amount of molybdenum oxide bonds and a reduced presence of molybdenum carbide phase compared to the Mo-DLC3 film. B. Huang et al. [7] obtained the deposition temperature effect on Si-DLC coatings ranking from 60 to 180 °C, which were grown on stainless steel (316L). The friction coefficient was reduced from 0.18 to 0.03 when the formation temperature was enhanced from 60 to 120 °C, as the results indicated. Meanwhile, a further increase in the deposition temperature to 180 °C resulted in an increase in the friction coefficient of up to 0.08. The authors assigned this trend to the observation that the fraction of graphite is higher when the synthesis temperature is raised from 120 to 180 °C. This may clarify the reason why the Mo-DLC3 film deposited at 235 °C has a lower CoF compared to the Mo-DLC5 film deposited at 180 °C. In addition, Tomala et al. [49] found that the coefficient of friction decreases with the enhancement of the DLC film’s graphitization, which agreed with the Raman and XPS results, where the sp2/sp3 ratio increases with the increase in the synthesis temperature of Mo-DLC films. The surface energy of the doped DLC films depends on the sp2 C=C fraction, metal oxide content, and topography of the surface [29,50,51]. T. Nakamura et al. [52] demonstrated that the origination of the C−OH, C=O, and CO2 functional groups on the surface of the DLC films reduced the friction coefficient. It was demonstrated that the water contact angle was reduced from 83° to 6° with the increase in the oxygen content on the surface of the DLC films. The incorporation of oxygen increased the surface energy and reduced the water contact angle for the DLC films [34]. D. Zhao et al. [29] observed that the water contact angle increased and the surface energy of Mo-DLC films was reduced due to the increase in the sp2 carbon sites and surface roughness at higher Mo concentrations. L. Li et al. [53] obtained that the friction force was diminished with the increase in the sp3 fraction in DLC films. Meanwhile, the molecular dynamics simulation performed by X. Li et al. [23] showed that the annealing of the amorphous carbon films enhanced the sp2 C=C site fraction and resulted in a significant reduction in the nano-friction force. However, it was noted that the type of dopant and the surface passivation of dangling bonds of carbon atoms in the DLC films could drastically alter the friction force at the nanoscale level. It should be noted that the surface energy consists of polar and dispersion components. Compared to σ bond electrons of sp3 carbon sites, the π bond electrons of sp2 carbon sites and dangling bond electrons have a greater potential for polarization [34]. Typically, the adhesion force correlates with the surface energy of the two interacting surfaces, which is influenced by the number of dangling sites present on the surface and the extent of surface reconstruction [22]. As a result, increasing the amount of oxygen incorporated into the Mo-DLC films raises the polar component of film surface energy. This could lead to a higher contact area during the friction tests and enhance the friction force for Mo-DCL films with a large amount of Mo. It was stated that the friction force at the nanoscale level is directly dependent on the real contact area (by the well-known Bowden–Tabor model). The increase in the applied load resulted in higher friction force of Mo-DLC films (Figure 10). As the applied load increased, the number of bonds at the contact interface between the Mo-DLC film surface and AFM tip also increased. It was demonstrated that the enhancement of the load from 2.9 to 290 nN resulted in contact pressures from 1 to 50 GPa in the DLC films. The friction force increases with the rise in the roughness of the surface of DLC films. The roughness of the surface can affect the adhesion strength at the contact interface by altering the actual contact area. The greater roughness enhances the friction force due to the existence of surface asperities and induces a transition from the adhesive wear to abrasive wear. However, the wear rate of DLC or doped DLC is directly related to the properties of the films. DLC films with a higher Young’s modulus values usually have higher friction force values [21]. The Mo-DLC5 film demonstrated the highest Young’s modulus of ~84 GPa and a relatively large surface roughness of ~2.2 nm. As a result, the friction coefficient of film was significantly higher (0.21), compared to the Mo-DLC films synthesized at 235 °C. Meanwhile, it was demonstrated that the enhancement of the Si content in DLC coatings stimulated the growth of sp3 C–C bonds and resulted in a reduction in friction force [20]. Thus, the Mo-DLC3 film with a higher sp2 content and MoC phase demonstrated a friction coefficient of 0.038. Since the surface roughness of the Mo-DLC3 and Mo-DLC5 films was identical (see Figure 5b), the sp2 content and oxygen concentration had the dominant effect on the friction coefficient of the films. The performed investigations demonstrated that the synthesis temperature has an impact on the Mo content, sp3/sp2 ratio, oxygen concentration, nanohardness, and friction coefficient of Mo-DLC films. Meanwhile, the increase in the Mo concentration reduced the sp3 site fraction, stipulated the formation of molybdenum carbides and oxides, and reduced the nanohardness of the films. It is likely that one of the most important factors is surface roughness, as higher surface roughness leads to higher friction coefficients in Mo-DLC films deposited at 235 °C. The performed research provides a deeper understanding of the correlation between synthesis conditions and the properties of the Mo-DLC films, offering a pathway for tailoring film performance for further applications in MEMS production.

4. Conclusions

The DLC and Mo-DLC films were successfully deposited on silicon (100) substrates at various substrate temperatures using magnetron sputtering. An increase in Mo concentration from 1.2 at.% to 10.3 at.%, enhanced oxygen content from 6.5 at.% to 14.3 at.% and surface roughness of the films. The amount of molybdenum decreased from 10.3 to 6.6 at.% with the reduction in the deposition temperature. The highest oxygen content of 20.4 at.% was observed in the Mo-DLC film deposited at the lowest temperature. Raman spectroscopy results indicated that the sp3/sp2 ratio was reduced, and the incorporation of molybdenum into the DLC films enhanced the graphitization process. In addition, the increase in the synthesis temperature stimulated the growth of the sp2 carbon clusters and the emergence of Mo–C bonds in the coatings. The increase in the molybdenum concentration induced the growth of the sp2 C=C bond and the breakage of C–C bonds through the formation of Mo–C bonds, which led to a reduction in the nanohardness and Young’s modulus when films were deposited at 235 °C. The decrease in the synthesis temperature enhanced the hardness of the Mo-DLC films due to an increase in the sp3 bond fraction, and the film deposited at the lowest temperature demonstrated the highest nanohardness (~8.4 GPa) and elastic modulus (~83 GPa) values. The Mo-DLC films deposited at the highest substrate temperature demonstrated a very low friction coefficient ranging from 0.029 to 0.038. The diminishing of the formation temperature increased the friction coefficient of the Mo-DLC film up to seven times. The oxygen content, sp3/sp2 ratio, Mo–C bond fraction, and surface roughness of films can be changed by controlling the amount of Mo addition and substrate temperature. This provides for control of the nanohardness and nano-friction coefficient of the films and creates a new perspective for the application of Mo-DLC films in the development of nano-devices.

Author Contributions

Conceptualization: L.M. and H.Z.; methodology: H.Z. and L.M.; software: H.Z., H.K., K.S., A.S. and E.V.; validation: L.M., H.Z. and H.K.; formal analysis: H.Z., A.S. and E.V.; investigation: H.Z., K.S., A.S., E.V. and H.K.; resources: H.Z. and L.M.; data curation: H.Z.; writing—original draft preparation: H.Z. and L.M.; writing—review and editing: H.Z. and L.M.; visualization: H.Z.; supervision: H.Z. and L.M. All authors have read and agreed to the published version of the manuscript.

Funding

We are thankful to the Institute of Solid State Physics, University of Latvia, as the Centre of Excellence has received funding from the European Union’s Horizon 2020 Framework Programme H2020-WIDESPREAD-01-2016-2017-TeamingPhase2 under grant agreement No. 739508, project CAMART2. The support of the Strategic Program Excellence Initiative at the Jagiellonian University SciMat (Grant No. U1U/P05/NO/01.05) is gratefully acknowledged by H. Khaksar. This article is partly based on work from COST Action CA23155, supported by COST (European Cooperation in Science and Technology).

Data Availability Statement

Data are contained within this article.

Acknowledgments

The authors would like to thank Enrico Gnecco from the M. Smoluchowski Institute of Physics, Jagiellonian University, for the AFM measurements.

Conflicts of Interest

The authors declare no conflicts of interest.

References

  1. Evaristo, M.; Azevedo, R.; Palacio, C.; Cavaleiro, A. Influence of the silicon and oxygen content on the properties of non-hydrogenated amorphous carbon coatings. Diam. Relat. Mater. 2016, 70, 201–210. [Google Scholar] [CrossRef]
  2. Khrushchov, M.; Levin, I.; Marchenko, E.; Avdyukhina, V.; Petrzhik, M. Effect of structure and deposition technology on tribological properties of DLC coatings alloyed with VIA group metals. J. Phys. Conf. Ser. 2016, 729, 012016. [Google Scholar] [CrossRef]
  3. Khamseh, S.; Alibakhshi, E.; Mahdavian, M.; Saeb, M.R.; Vahabi, H.; Kokanyan, N.; Laheurte, P. Magnetron-sputtered copper/diamond-like carbon composite thin films with super anti-corrosion properties. Surf. Coatings Technol. 2018, 333, 148–157. [Google Scholar] [CrossRef]
  4. Jing, P.; Gong, Y.; Deng, Q.; Zhang, Y.; Huang, N.; Leng, Y. The formation of the “rod-like wear debris” and tribological properties of Ag-doped diamond-like carbon films fabricated by a high-power pulsed plasma vapor deposition technique. Vacuum 2020, 173, 109125. [Google Scholar] [CrossRef]
  5. Ray, S.C.; Pong, W.; Papakonstantinou, P. Iron, nitrogen and silicon doped diamond like carbon (DLC) thin films: A comparative study. Thin Solid Films 2016, 610, 42–47. [Google Scholar] [CrossRef]
  6. Love, C.; Cook, R.; Harvey, T.; Dearnley, P.; Wood, R. Diamond like carbon coatings for potential application in biological implants—A review. Tribol. Int. 2013, 63, 141–150. [Google Scholar] [CrossRef]
  7. Huang, B.; Liu, L.-T.; Han, S.; Du, H.-M.; Zhou, Q.; Zhang, E.-G. Effect of deposition temperature on the microstructure and tribological properties of Si-DLC coatings prepared by PECVD. Diam. Relat. Mater. 2022, 129, 109345. [Google Scholar] [CrossRef]
  8. Zeng, H.; Zhang, Y.; Wu, Z.; Qin, Z.; Ji, H.; Liu, X.; Li, B.; Hu, W. Microstructure, magnetic properties and corrosion resistance of Co-DLC nanocomposite film controlled by substrate temperature. Diam. Relat. Mater. 2023, 133, 109673. [Google Scholar] [CrossRef]
  9. Ebrahimi, M.; Mahboubi, F.; Naimi-Jamal, M.R. RSM base study of the effect of deposition temperature and hydrogen flow on the wear behavior of DLC films. Tribol. Int. 2015, 91, 23–31. [Google Scholar] [CrossRef]
  10. Li, H.; Guo, P.; Zhang, D.; Chen, R.; Zuo, X.; Ke, P.; Saito, H.; Wang, A. Influence of deposition temperature on the structure, optical and electrical properties of a-C films by DCMS. Appl. Surf. Sci. 2020, 503, 144310. [Google Scholar] [CrossRef]
  11. Padmanaban, D.B.; Mohan, L.; Giri, P.; Bera, P.; Anandan, C.; Barshilia, H.C. Effect of Molybdenum Content on Mechanical and Tribological Properties of Diamond-Like Carbon Coatings over Titanium β-21S Alloy. C 2020, 7, 1. [Google Scholar] [CrossRef]
  12. Hovsepian, P.E.; Mandal, P.; Ehiasarian, A.P.; Sáfrán, G.; Tietema, R.; Doerwald, D. Friction and wear behaviour of Mo–W doped carbon-based coating during boundary lubricated sliding. Appl. Surf. Sci. 2016, 366, 260–274. [Google Scholar] [CrossRef]
  13. Müller, I.C.; Sharp, J.; Rainforth, W.M.; Hovsepian, P.; Ehiasarian, A. Tribological response and characterization of Mo–W doped DLC coating. Wear 2017, 376–377, 1622–1629. [Google Scholar] [CrossRef]
  14. Kolawole, F.O.; Ramirez, M.A.; Kolawole, S.K.; Varela, L.B.; Tschiptschin, A.P. Deposition and characterization of molybdenum oxide (MoO3) nanoparticles incorporated diamond-like carbon coatings using pulsed-DC PECVD. Mater. Lett. 2020, 278, 128420. [Google Scholar] [CrossRef]
  15. Ji, L.; Li, H.; Zhao, F.; Quan, W.; Chen, J.; Zhou, H. Atomic oxygen resistant behaviors of Mo/diamond-like carbon nanocomposite lubricating films. Appl. Surf. Sci. 2008, 255, 4180–4184. [Google Scholar] [CrossRef]
  16. Tang, X.; Wang, H.; Feng, L.; Shao, L.; Zou, C. Mo doped DLC nanocomposite coatings with improved mechanical and blood compatibility properties. Appl. Surf. Sci. 2014, 311, 758–762. [Google Scholar] [CrossRef]
  17. Su, Y.; Gong, X.; Huang, W.; Zhang, T.; Hu, R.; Zhang, P.; Ruan, H.; Ma, Y. Enhancing the tribological property of Mo-doped DLC films in methanol using appropriate bias voltage. Diam. Relat. Mater. 2023, 135, 109795. [Google Scholar] [CrossRef]
  18. Zhairabany, H.; Dovydaitis, V.; Khaksar, H.; Vanags, E.; Gnecco, E.; Marcinauskas, L. Influence of molybdenum concentration on the microstructure and nanotribological properties of diamond-like carbon films. J. Mater. Sci. 2023, 58, 13437–13448. [Google Scholar] [CrossRef]
  19. Zhairabany, H.; Khaksar, H.; Vanags, E.; Marcinauskas, L. Effect of Molybdenum Concentration and Deposition Temperature on the Structure and Tribological Properties of the Diamond-like Carbon Films. Crystals 2024, 14, 962. [Google Scholar] [CrossRef]
  20. Li, L.; Song, W.; Liu, J.; Liu, Q.; Wang, S.; Zhang, G. Nanomechanical and nanotribological behavior of ultra-thin silicon-doped diamond-like carbon films. Tribol. Int. 2016, 94, 616–623. [Google Scholar] [CrossRef]
  21. Bai, L.; Srikanth, N.; Korznikova, E.A.; Baimova, J.A.; Dmitriev, S.V.; Zhou, K. Wear and friction between smooth or rough diamond-like carbon films and diamond tips. Wear 2017, 372–373, 12–20. [Google Scholar] [CrossRef]
  22. Zhang, H.-S.; Endrino, J.; Anders, A. Comparative surface and nanotribological characteristics of nanocomposite diamond-like carbon thin films doped by silver. Appl. Surf. Sci. 2008, 255, 2551–2556. [Google Scholar] [CrossRef]
  23. Li, X.; Wang, A.; Lee, K.-R. Fundamental understanding on low-friction mechanisms at amorphous carbon interface from reactive molecular dynamics simulation. Carbon 2020, 170, 621–629. [Google Scholar] [CrossRef]
  24. Charitidis, C.A. Nanomechanical and nanotribological properties of carbon-based thin films: A review. Int. J. Refract. Met. Hard Mater. 2010, 28, 51–70. [Google Scholar] [CrossRef]
  25. Baer, D.R.; Artyushkova, K.; Cohen, H.; Easton, C.D.; Engelhard, M.; Gengenbach, T.R.; Greczynski, G.; Mack, P.; Morgan, D.J.; Roberts, A. XPS guide: Charge neutralization and binding energy referencing for insulating samples. J. Vac. Sci. Technol. A 2020, 38, 031204. [Google Scholar] [CrossRef]
  26. Nečas, D.; Klapetek, P. Gwyddion: An open-source software for SPM data analysis. Open Phys. 2012, 10, 181–188. [Google Scholar] [CrossRef]
  27. Yadav, V.S.; Sahu, D.K.; Singh, M.R.; Kumar, K. Study of Raman Spectra of Nanocrystalline Diamond Like Carbon (DLC) Films Composition (Sp2:Sp3) with Substrate Temperature. In Proceedings of the WCECS, San Francisco, CA, USA, 20–22 October 2009; Available online: https://www.iaeng.org/publication/WCECS2009/WCECS2009_pp78-81.pdf (accessed on 15 March 2025).
  28. Robertson, J. Diamond-like amorphous carbon. Mater. Sci. Eng. R Rep. 2002, 37, 129–281. [Google Scholar] [CrossRef]
  29. Zhao, D.; Mei, H.; Ding, J.C.; Cheng, Y.; Zhang, L.; Zhang, T.F.; Kwang, H.K.; Zheng, J. Microstructure and properties of Mo doped DLC nanocomposite films deposited by a hybrid sputtering system. Vacuum 2022, 208, 111732. [Google Scholar] [CrossRef]
  30. Robertson, J. Properties and prospects for non-crystalline carbons. J. Non-Cryst. Solids 2001, 299–302, 798–804. [Google Scholar] [CrossRef]
  31. Bouabibsa, I.; Lamri, S.; Alhussein, A.; Minea, T.; Sanchette, F. Plasma investigations and deposition of Me-DLC (Me = Al, Ti or Nb) obtained by a magnetron sputtering-RFPECVD hybrid process. Surf. Coatings Technol. 2018, 354, 351–359. [Google Scholar] [CrossRef]
  32. Marcinauskas, L.; Grigonis, A.; Valatkevicius, P.; Medvid, A. Irradiation of the graphite-like carbon films by ns-laser pulse. Appl. Surf. Sci. 2012, 261, 488–492. [Google Scholar] [CrossRef]
  33. Ji, L.; Li, H.; Zhao, F.; Chen, J.; Zhou, H. Microstructure and mechanical properties of Mo/DLC nanocomposite films. Diam. Relat. Mater. 2008, 17, 1949–1954. [Google Scholar] [CrossRef]
  34. Moghadam, R.Z.; Ehsani, M.H.; Dizaji, H.R.; Kameli, P.; Jannesari, M. Oxygen doping effect on wettability of diamond-like carbon films. Mater. Res. Express 2021, 8, 035601. [Google Scholar] [CrossRef]
  35. Shao, W.; Zhou, Y.; Shi, Z.; Rao, L.; Hu, T.; Xing, X.; Yang, Q. Effects of carbide forming elements Me on residual stress and mechanical properties of DLC films by molecular dynamics simulation. Mater. Today Commun. 2020, 23, 100946. [Google Scholar] [CrossRef]
  36. Qiang, L.; Gao, K.; Zhang, L.; Wang, J.; Zhang, B.; Zhang, J. Further improving the mechanical and tribological properties of low content Ti-doped DLC film by W incorporating. Appl. Surf. Sci. 2015, 353, 522–529. [Google Scholar] [CrossRef]
  37. Biesinger, M.C. Accessing the robustness of adventitious carbon for charge referencing (correction) purposes in XPS analysis: Insights from a multi-user facility data review. Appl. Surf. Sci. 2022, 597, 153681. [Google Scholar] [CrossRef]
  38. Rusli, H.; Yoon, S.; Huang, Q.; Ahn, J.; Zhang, Q.; Yang, H.; Wu, Y.; Teo, E.; Osipowicz, T.; Watt, F. Metal-containing amorphous carbon film development using electron cyclotron resonance CVD. Diam. Relat. Mater. 2001, 10, 132–138. [Google Scholar] [CrossRef]
  39. Su, Y.; Ma, Y.; Huang, W.; Zhang, T.; Yu, W.; Hu, R.; Ruan, H. The effects of medium and friction pair on the tribological behavior of Mo-doped DLC films. Diam. Relat. Mater. 2024, 148, 111464. [Google Scholar] [CrossRef]
  40. Rabadzhiyska, S.; Kotlarski, G.; Valkov, S.; Ormanova, M.; Shipochka, M.; Rafailov, P.; Petrov, P. Characterization of Diamond-like carbon films produced by electron- beam physical vapor deposition. Mater. Today Proc. 2022, 67, 995–1000. [Google Scholar] [CrossRef]
  41. Zou, C.; Wang, H.; Feng, L.; Xue, S. Effects of Cr concentrations on the microstructure, hardness, and temperature-dependent tribological properties of Cr-DLC coatings. Appl. Surf. Sci. 2013, 286, 137–141. [Google Scholar] [CrossRef]
  42. Guo, C.-Q.; Li, H.-Q.; Peng, Y.-L.; Dai, M.-J.; Lin, S.-S.; Shi, Q.; Wei, C.-B. Residual stress and tribological behavior of hydrogen-free Al-DLC films prepared by HiPIMS under different bias voltages. Surf. Coatings Technol. 2022, 445, 128713. [Google Scholar] [CrossRef]
  43. Zhang, S.; Bui, X.L.; Jiang, J.; Li, X. Microstructure and tribological properties of magnetron sputtered nc-TiC/a-C nanocomposite. Surf. Coatings Technol. 2005, 198, 206–211. [Google Scholar] [CrossRef]
  44. Pei, Y.; Chen, C.; Shaha, K.; De Hosson, J.; Bradley, J.; Voronin, S.; Čada, M. Microstructural control of TiC/a-C nanocomposite coatings with pulsed magnetron sputtering. Acta Mater. 2008, 56, 696–709. [Google Scholar] [CrossRef]
  45. Tripathi, R.K.; Panwar, O.S.; Chockalingam, S. Nanoindentation study on nitrogenated tetrahedral amorphous carbon thin films with ultra low load. Indian J. Pure Appl. Phys. 2016, 54, 543–550. [Google Scholar] [CrossRef]
  46. McMaster, S.J.; Kosarieh, S.; Liskiewicz, T.W.; Neville, A.; Beake, B.D. Utilising H/E to predict fretting wear performance of DLC coating systems. Tribol. Int. 2023, 185, 108524. [Google Scholar] [CrossRef]
  47. Hagarová, M.; Baranová, G.; Heželová, M.; Truchlý, M.; Vojtko, M.; Petruš, O.; Csík, D. High-Temperature Mechanical and Tribological Performance of W-DLC Coating with Cr interlayer on X40CrMoV5-1 Hot Work Tool Steel. Coatings 2024, 14, 971. [Google Scholar] [CrossRef]
  48. Yoon, E.-S.; Singh, R.A.; Oh, H.-J.; Kong, H. The effect of contact area on nano/micro-scale friction. Wear 2005, 259, 1424–1431. [Google Scholar] [CrossRef]
  49. Tomala, A.; Pauschitz, A.; Roy, M. Nanotribology of pulsed direct current magnetron sputtered diamond like carbon films. Surf. Sci. 2013, 616, 60–70. [Google Scholar] [CrossRef]
  50. Sun, L.; Guo, P.; Ke, P.; Li, X.; Wang, A. Synergistic effect of Cu/Cr co-doping on the wettability and mechanical properties of diamond-like carbon films. Diam. Relat. Mater. 2016, 68, 1–9. [Google Scholar] [CrossRef]
  51. Guo, P.; Sun, L.; Li, X.; Xu, S.; Ke, P.; Wang, A. Structural properties and surface wettability of Cu-containing diamond-like carbon films prepared by a hybrid linear ion beam deposition technique. Thin Solid Films 2015, 584, 289–293. [Google Scholar] [CrossRef]
  52. Nakamura, T.; Ohana, T. Photochemical modification of DLC films with oxygen functionalities and their chemical structure control. Diam. Relat. Mater. 2013, 33, 16–19. [Google Scholar] [CrossRef]
  53. Li, L.; Song, W.; Ovcharenko, A.; Xu, M.; Zhang, G. Effects of atomic structure on the frictional properties of amorphous carbon coatings. Surf. Coatings Technol. 2015, 263, 8–14. [Google Scholar] [CrossRef]
Figure 1. Temperature evolution of the substrate versus deposition duration during the deposition of the films.
Crystals 15 00463 g001
Figure 2. SEM cross-section views of the Mo-DLC3 (a) and Mo-DLC5 (b) films with the cross-section mapping images for carbon, oxygen, and molybdenum in both films.
Crystals 15 00463 g002aCrystals 15 00463 g002b
Figure 3. EDX mapping images of the Mo-DLC5 film.
Crystals 15 00463 g003
Figure 4. AFM images of the deposited films: (a) Mo-DLC1; (b) Mo-DLC2; (c) Mo-DLC3; and (d) Mo-DLC5.
Crystals 15 00463 g004
Figure 5. Surface roughness of the films versus slit opening (a) and target–substrate distance (b).
Crystals 15 00463 g005
Figure 6. Raman spectra (ad) and characteristic parameters (e,f) of films.
Crystals 15 00463 g006
Figure 7. XPS data showing the peaks of C1s spectra acquired from (a) Mo-DLC2, (b) Mo-DLC3, and (c) Mo-DLC5 films and the variation in the concentration of elements versus the etching time: (d) Mo-DLC2, (e) Mo-DLC3, and (f) Mo-DLC5 films.
Crystals 15 00463 g007aCrystals 15 00463 g007b
Figure 8. Mo 3d core level spectra fitted to the sample Mo-DLC2.
Crystals 15 00463 g008
Figure 9. (ad) Variation in the nanohardness and Young’s modulus of the films.
Crystals 15 00463 g009
Figure 10. Dependence of nano-friction force on the applied load (a) for the films deposited at 235 °C and (b) for films synthesized at various temperatures.
Crystals 15 00463 g010
Table 1. Synthesis conditions and atomic composition of the deposited films.
SamplesTarget–Substrate Distance [cm]Slit Opening [mm]Temperature [°C]Carbon [at.%]Oxygen [at.%]Molybdenum [at.%]
DLC4------92.5 ± 1.07.5 ± 0.3---
Mo-DLC14423592.3 ± 1.26.5 ± 0.31.2 ± 0.1
Mo-DLC24823582.6 ± 2.811.1 ± 1.16.3 ± 0.3
Mo-DLC341623575.5 ± 0.114.2 ± 1.410.3 ± 0.4
Mo-DLC461622587.0 ± 3.26.8 ± 1.16.2 ± 0.3
Mo-DLC581618073.0 ± 2.820.4 ± 2.46.6 ± 0.1
Table 2. Binding energies and relative peak areas of carbon and molybdenum bonds in Mo-DLC2, Mo-DLC3, and Mo-DLC5 films.
SamplesC BondsBinding Energy of C 1s, (eV)Relative Peak
Area, (%)
Mo BondsBinding Energy
of Mo 3d, (eV)
Relative Peak
Area (%)
Mo-DLC2Mo–C283.01.6%Mo–C228.320.9%
C=C (sp2)284.263.4%Mo2+228.741.3%
C–C (sp3)285.330%Mo4+229.927.6%
Carbon Oxides288.75%Mo6+232.510.2%
Mo-DLC3Mo–C283.03%Mo–C228.226%
C=C (sp2)284.263%Mo2+228.730%
C–C (sp3)285.329%Mo4+229.936%
Carbon Oxides289.65%Mo6+232.47%
Mo-DLC5Mo–C------Mo–C228.210%
C=C (sp2)284.459%Mo2+228.627%
C–C (sp3)285.335%Mo4+229.331%
Carbon Oxides289.26%Mo6+231.431%
Table 3. Nanohardness, Young’s modulus, and the ratios of H/E, H3/E2, and H2/E of films.
SamplesHardness (H) [GPa]Young’s Modulus (E) [GPa]H/EH3/E2 [GPa]H2/E [GPa]
DLC8.03 ± 0.6560.56 ± 3.130.133 ± 0.0040.141 ± 0.0201.064 ± 0.119
Mo-DLC17.84 ± 0.4865.07 ± 0.910.121 ± 0.0060.114 ± 0.0180.945 ± 0.105
Mo-DLC26.32 ± 0.1549.22 ± 0.910.128 ± 0.0030.104 ± 0.0060.812 ± 0.031
Mo-DLC36.49 ± 0.4565.21 ± 3.060.100 ± 0.0100.064 ± 0.0160.646 ± 0.103
Mo-DLC47.41 ± 0.4055.46 ± 2.010.134 ± 0.0020.132 ± 0.0090.990 ± 0.056
Mo-DLC58.24 ± 0.3583.66 ± 7.880.098 ± 0.0060.080 ± 0.0060.811 ± 0.020
Disclaimer/Publisher’s Note: The statements, opinions and data contained in all publications are solely those of the individual author(s) and contributor(s) and not of MDPI and/or the editor(s). MDPI and/or the editor(s) disclaim responsibility for any injury to people or property resulting from any ideas, methods, instructions or products referred to in the content.

