
Theoretical Investigation of Chromium Separation from Chromates Through Photon–Phonon Resonant Absorption


Abstract
1. Introduction
2. Methods
3. Results
4. Conclusions
Supplementary Materials
Author Contributions
Funding
Data Availability Statement
Acknowledgments
Conflicts of Interest
References
- Patterson, R.A. Crystal structure of titanium and chromium. Phys. Rev. 1925, 26, 56–59. [Google Scholar] [CrossRef]
- Chou, S.Y.; Xia, Q.F. Improved nanofabrication through guided transient liquefaction. Nat. Nanotechnol. 2008, 3, 295–300. [Google Scholar] [CrossRef] [PubMed]
- Mena-Gutiérrez, S.; Maiza-Razkin, E.; Pascual-Colino, J.; Araúzo-Bravo, M.J.; Beobide, G.; Castillo, O.; Castellanos-Rubio, A.; Gerovska, D.; Luque, A.; Pérez-Yáñez, S. Drug-delivery and biological activity in colorectal cancer of a supramolecular porous material assembled from heptameric chromium-copper-adenine entities. J. Mat. Chem. B 2024, 12, 11156–11164. [Google Scholar] [CrossRef] [PubMed]
- Karimi, M.; Homayoonfal, M.; Zahedifar, M.; Ostadian, A.; Adibi, R.; Mohammadzadeh, B.; Raisi, A.; Ravaei, F.; Rashki, S.; Khakbraghi, M.; et al. Development of a novel nanoformulation based on aloe vera-derived carbon quantum dot and chromium-doped alumina nanoparticle (Al2O3:Cr@Cdot NPs): Evaluating the anticancer and antimicrobial activities of nanoparticles in photodynamic therapy. Cancer Nanotechnol. 2024, 15, 19. [Google Scholar] [CrossRef]
- Roberts, B.K.; Pakhomov, A.B.; Shutthanandan, V.S.; Krishnan, K.M. Ferromagnetic Cr-doped ZnO for spin electronics via magnetron sputtering. J. Appl. Phys. 2005, 97, 3. [Google Scholar] [CrossRef]
- Dang, P.P.; Wei, Y.; Liu, D.J.; Li, G.G.; Lin, J. Recent Advances in Chromium-Doped Near-Infrared Luminescent Materials: Fundamentals, Optimization Strategies, and Applications. Adv. Opt. Mater. 2023, 11, 27. [Google Scholar] [CrossRef]
- Song, L.Y.; Zhao, Y.; Xu, B.Q.; Du, R.F.; Li, H.; Feng, W.; Yang, J.B.; Li, X.H.; Liu, Z.J.; Wen, X.; et al. Robust multiferroic in interfacial modulation synthesized wafer-scale one-unit-cell of chromium sulfide. Nat. Commun. 2024, 15, 11. [Google Scholar] [CrossRef]
- Yin, Z.B.; Wang, G.X.; Yan, X.C.; Wei, J.N.; Xi, Z.F. Construction of N-E bonds via Lewis acid-promoted functionalization of chromium-dinitrogen complexes. Nat. Commun. 2025, 16, 8. [Google Scholar] [CrossRef]
- Noor, A.; Glatz, G.; Müller, R.; Kaupp, M.; Demeshko, S.; Kempe, R. Carboalumination of a chromium-chromium quintuple bond. Nat. Chem. 2009, 1, 322–325. [Google Scholar] [CrossRef]
- Hild, R.; David, C.; Muller, H.U.; Volkel, B.; Kayser, D.R.; Grunze, M. Formation and characterization of self-assembled monolayers of octadecyltrimethoxysilane on chromium: Application in low-energy electron lithography. Langmuir 1998, 14, 342–346. [Google Scholar] [CrossRef]
- Menzies, I.A.; Davies, G.A.; Ponter, A.B. Nature and Mechanism of Formation of Oxide Films in the Chromium–Iron–Carbon System. Nature 1966, 212, 915–916. [Google Scholar] [CrossRef]
- Chi, H.; Ou, Y.B.; Eldred, T.B.; Gao, W.P.; Kwon, S.; Murray, J.; Dreyer, M.; Butera, R.E.; Foucher, A.C.; Ambaye, H.; et al. Strain-tunable Berry curvature in quasi-two-dimensional chromium telluride. Nat. Commun. 2023, 14, 8. [Google Scholar] [CrossRef] [PubMed]
- Liu, Y.; Liu, Z.Y.; Bao, J.K.; Yang, P.T.; Ji, L.W.; Wu, S.Q.; Shen, Q.X.; Luo, J.; Yang, J.; Liu, J.Y.; et al. Superconductivity under pressure in a chromium-based kagome metal. Nature 2024, 632, 18. [Google Scholar] [CrossRef]
- Chen, G.Z.; Gordo, E.; Fray, D.J. Direct electrolytic preparation of chromium powder. Metall. Mater. Trans. B-Proc. Metall. Mater. Proc. Sci. 2004, 35, 223–233. [Google Scholar] [CrossRef]
- Lei, K.P.V.; Sullivan, T.A.; Hiegel, J.M. Electrolytic preparation of high-purity chromium. J. Less-Common Met. 1972, 27, 353–365. [Google Scholar] [CrossRef]
- Suri, A.K.; Gupta, C.K. Production of chromium by molten salt electrolysis. Surf. Technol. 1977, 5, 271–276. [Google Scholar] [CrossRef]
- Chu, W.F.; Rahmel, A. The kinetics of the reduction of chromium oxide by hydrogen. Metall. Trans. B 1979, 10, 401–407. [Google Scholar] [CrossRef]
- Sun, Z.; Zhang, Y.; Zheng, S.L.; Zhang, Y. A New Method of Potassium Chromate Production from Chromite and KOH-KNO3-H2O Binary Submolten Salt System. AIChE J. 2009, 55, 2646–2656. [Google Scholar] [CrossRef]
- Li, P.; Xu, H.B.; Zheng, S.L.; Zhang, Y.; Li, Z.H.; Bai, Y.L. A green process to prepare chromic oxide green pigment. Environ. Sci. Technol. 2008, 42, 7231–7235. [Google Scholar] [CrossRef]
- Xu, H.B.; Zhang, Y.; Li, Z.H.; Zheng, S.L.; Wang, Z.K.; Tao, Q.; Li, H.Q. Development of a new cleaner production process for producing chromic oxide from chromite ore. J. Clean. Prod. 2006, 14, 211–219. [Google Scholar] [CrossRef]
- Feng, B.Y.; Jia, Y.Z.; An, J.L.; Jia, Y.D.; Wang, M.G. Clean preparation of Cr2O3 by direct molten salt electrolysis of sodium chromate. J. Clean. Prod. 2024, 467, 10. [Google Scholar] [CrossRef]
- Fernández-Rodríguez, J.; Lovesey, S.W.; Blanco, J.A. Polarization analysis in resonant x-ray Bragg diffraction by K2CrO4 at the Cr K-edge. Phys. Rev. B 2008, 77, 9. [Google Scholar] [CrossRef]
- Etxebarria, I.; Perezmato, J.M.; Madariaga, G. Lattice dynamics, structural stability, and phase transitions in incommensurate and commensurate A2BX4 materials. Phys. Rev. B 1992, 46, 2764–2774. [Google Scholar] [CrossRef] [PubMed]
- Venkateswaran, C.S. The raman spectra of some inorganic compounds. Proc. Indian Acad. Sci. (Math. Sci.) 1938, 7, 144–155. [Google Scholar] [CrossRef]
- Carter, R.L. Vibrational selection rules in solids. J. Chem. Educ. 1971, 48, 297. [Google Scholar] [CrossRef]
- Engert, C.; Kiefer, W. Raman spectra of the permanganate ion in the solid state with excitation in the near infrared. J. Raman Spectrosc. 2010, 22, 715–719. [Google Scholar] [CrossRef]
- Adams, D.M.; Hooper, M.A.; Lloyd, M.H. Single-crystal vibrational spectrum of potassium chromate. J. Chem. Soc. A 1971, 946–947. [Google Scholar] [CrossRef]
- Davies, J.E.D.; Long, D.A. Solid-state vibrational spectroscopy. Part II. The vibrational spectra of some chromates and dichromates. J. Chem. Soc. A 1971, 1275–1280. [Google Scholar] [CrossRef]
- Serghiou, G.; Guillaume, C. Stability of K2CrO4 to 50 GPa using Raman spectroscopy measurements. J. Solid State Chem. 2004, 177, 4672–4679. [Google Scholar] [CrossRef]
- Huang, Y.; Butler, I.S. High-Pressure Micro-Raman Spectra of Potassium Chromate(VI) and Potassium Tungstate(VI). Appl. Spectrosc. 1990, 44, 1326–1328. [Google Scholar] [CrossRef]
- Hizhnyi, Y.; Nedilko, S.; Borysiuk, V.; Zhydachevskyy, Y. Interaction of K2CrO4 Oxide Nanoparticles with Carbon Nanostructures. In Proceedings of the 2020 IEEE 40th International Conference on Electronics and Nanotechnology (ELNANO), Kyiv, Ukraine, 22–24 April 2020; pp. 263–267. [Google Scholar]
- Li, Y.; Wang, D.; Ping, X.; Zhang, Y.; Zhang, T.; Wang, L.; Jin, L.; Zhao, W.; Guo, M.; Shen, F.; et al. Local hyperthermia therapy induces of white fat and treats. Cell 2022, 185, 949–966. [Google Scholar] [CrossRef] [PubMed]
- Ren, H.X.; Li, Y.N.; Yin, Y.; Liu, S.C.; Zhang, J.Q.; Zhang, J.Y.; Li, P.L.; Wang, Z.; Zhang, P. Theoretical Study of Molybdenum Separation from Molybdate Assisted by a Terahertz Laser. Molecules 2024, 29, 3348. [Google Scholar] [CrossRef]
- Yin, Y.; Li, Y.N.; Liu, S.C.; Jiang, Y.; Liu, X.Y.; Zhang, P. Theoretical Study of Efficient Photon-Phonon Resonance Absorption in the Tungsten-Related Vibrational Mode of Scheelite. ACS Omega 2024, 9, 10517–10521. [Google Scholar] [CrossRef]
- Li, Y.N.; Guo, Q.; Liu, S.C.; Liu, X.Y.; Jiang, Y.; Yin, Y.; Zhang, P. Computational Assignment of Tantalum-related Strong Absorption Peaks in the Infrared Spectrum of Potassium Heptafluorotantalate. ACS Omega 2023, 9, 988–993. [Google Scholar] [CrossRef] [PubMed]
- Clark, S.J.; Segall, M.D.; Pickard, C.J.; Hasnip, P.J.; Probert, M.J.; Refson, K.; Payne, M.C. First principles methods using CASTEP. Z. Kristall. 2005, 220, 567–570. [Google Scholar] [CrossRef]
- Hammer, B.; Hansen, L.B.; Norskov, J.K. Improved adsorption energetics within density-functional theory using revised Perdew-Burke-Ernzerhof functionals. Phys. Rev. B 1999, 59, 7413–7421. [Google Scholar] [CrossRef]
- Perdew, J.P.; Burke, K.; Ernzerhof, M. Generalized gradient approximation made simple. Phys. Rev. Lett. 1996, 77, 3865–3868. [Google Scholar] [CrossRef]
- Cococcioni, M.; de Gironcoli, S. Linear response approach to the calculation of the effective interaction parameters in the LDA+U method. Phys. Rev. B 2005, 71, 16. [Google Scholar] [CrossRef]
- Schluter, M.; Hamann, D.R.; Chiang, C. Norm-Conserving Pseudopotentials. Phys. Rev. Lett. 1980, 25, 394. [Google Scholar]
- Zhu, X.L.; Cao, J.W.; Qin, X.L.; Jiang, L.; Gu, Y.; Wang, H.C.; Liu, Y.; Kolesnikov, A.I.; Zhang, P. Origin of Two Distinct Peaks of Ice in the THz Region and Its Application for Natural Gas Hydrate Dissociation. J. Phys. Chem. C 2020, 124, 1165–1170. [Google Scholar] [CrossRef]

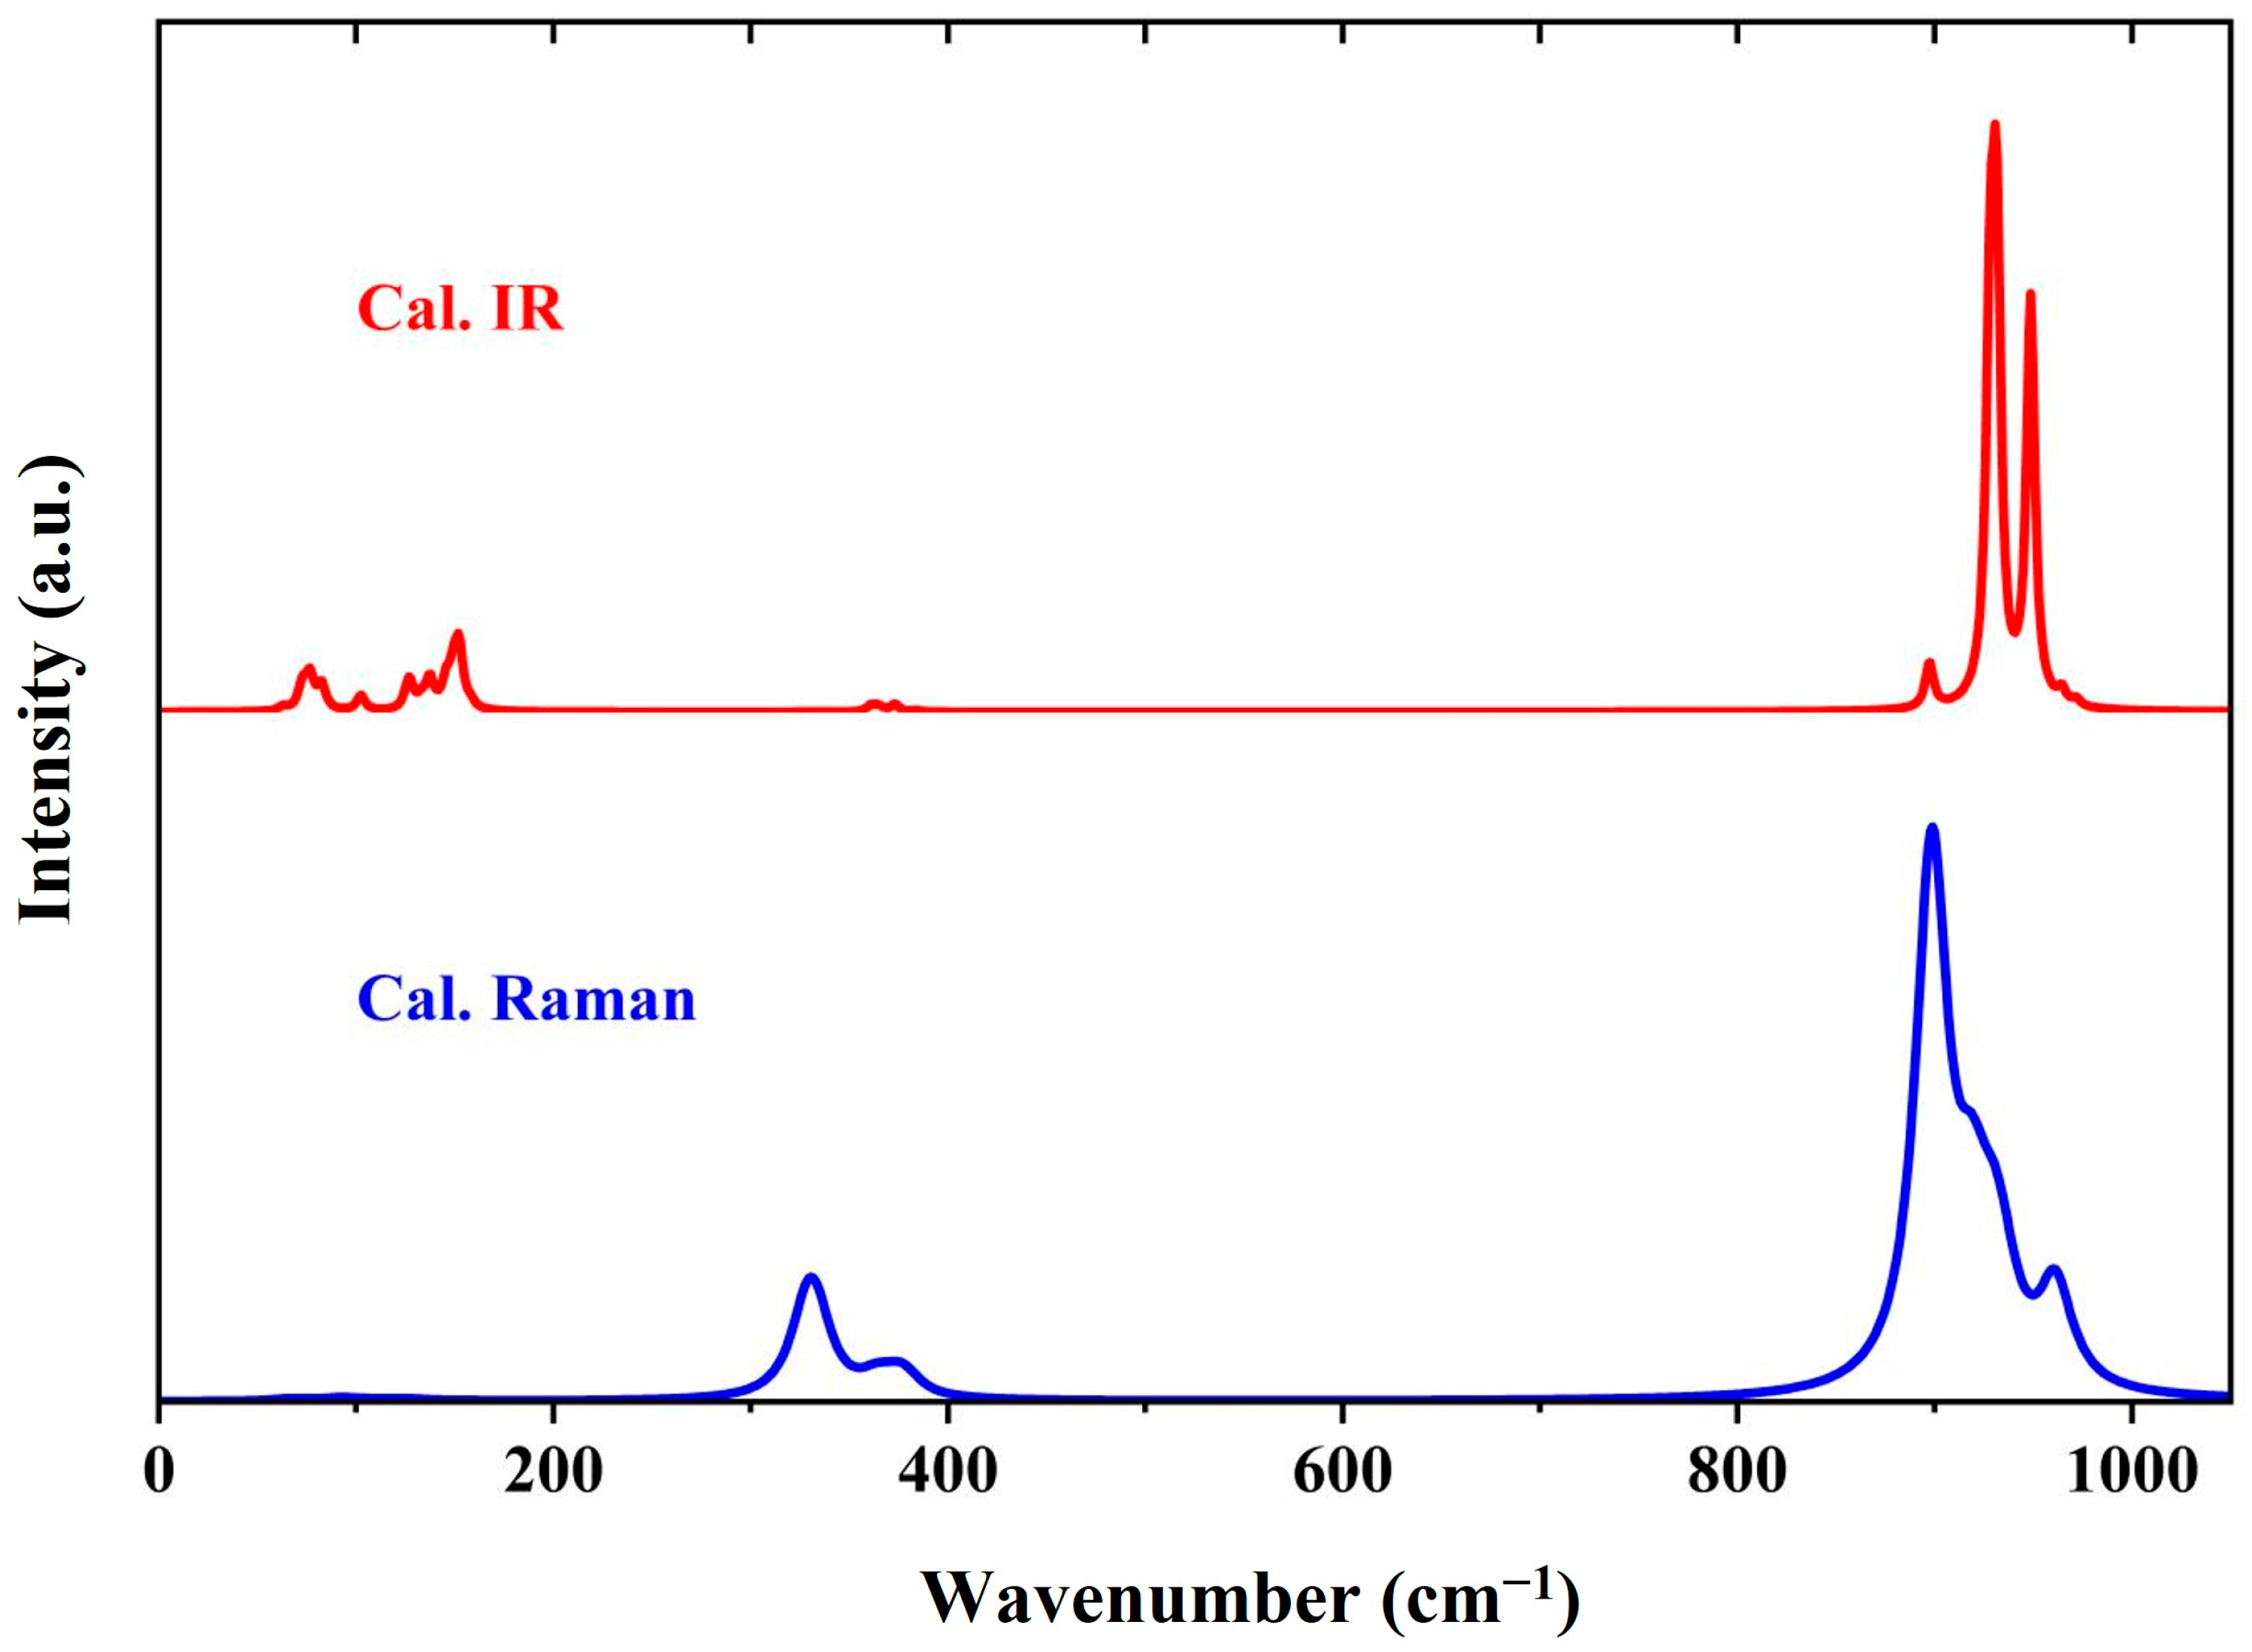
| Wavenumber | Activity | IR exp. | Raman exp. | Assignment |
|---|---|---|---|---|
| 23 | Raman | Relative motion | ||
| 39 | Raman | 37 b | Relative motion | |
| 62 | Raman | 54 b | Relative motion | |
| 64 | IR | Relative motion | ||
| 67 | Raman | 67 b | Relative motion | |
| 72 | Raman | Relative motion | ||
| 72 | IR | Relative motion | ||
| 74 | Raman | Relative motion | ||
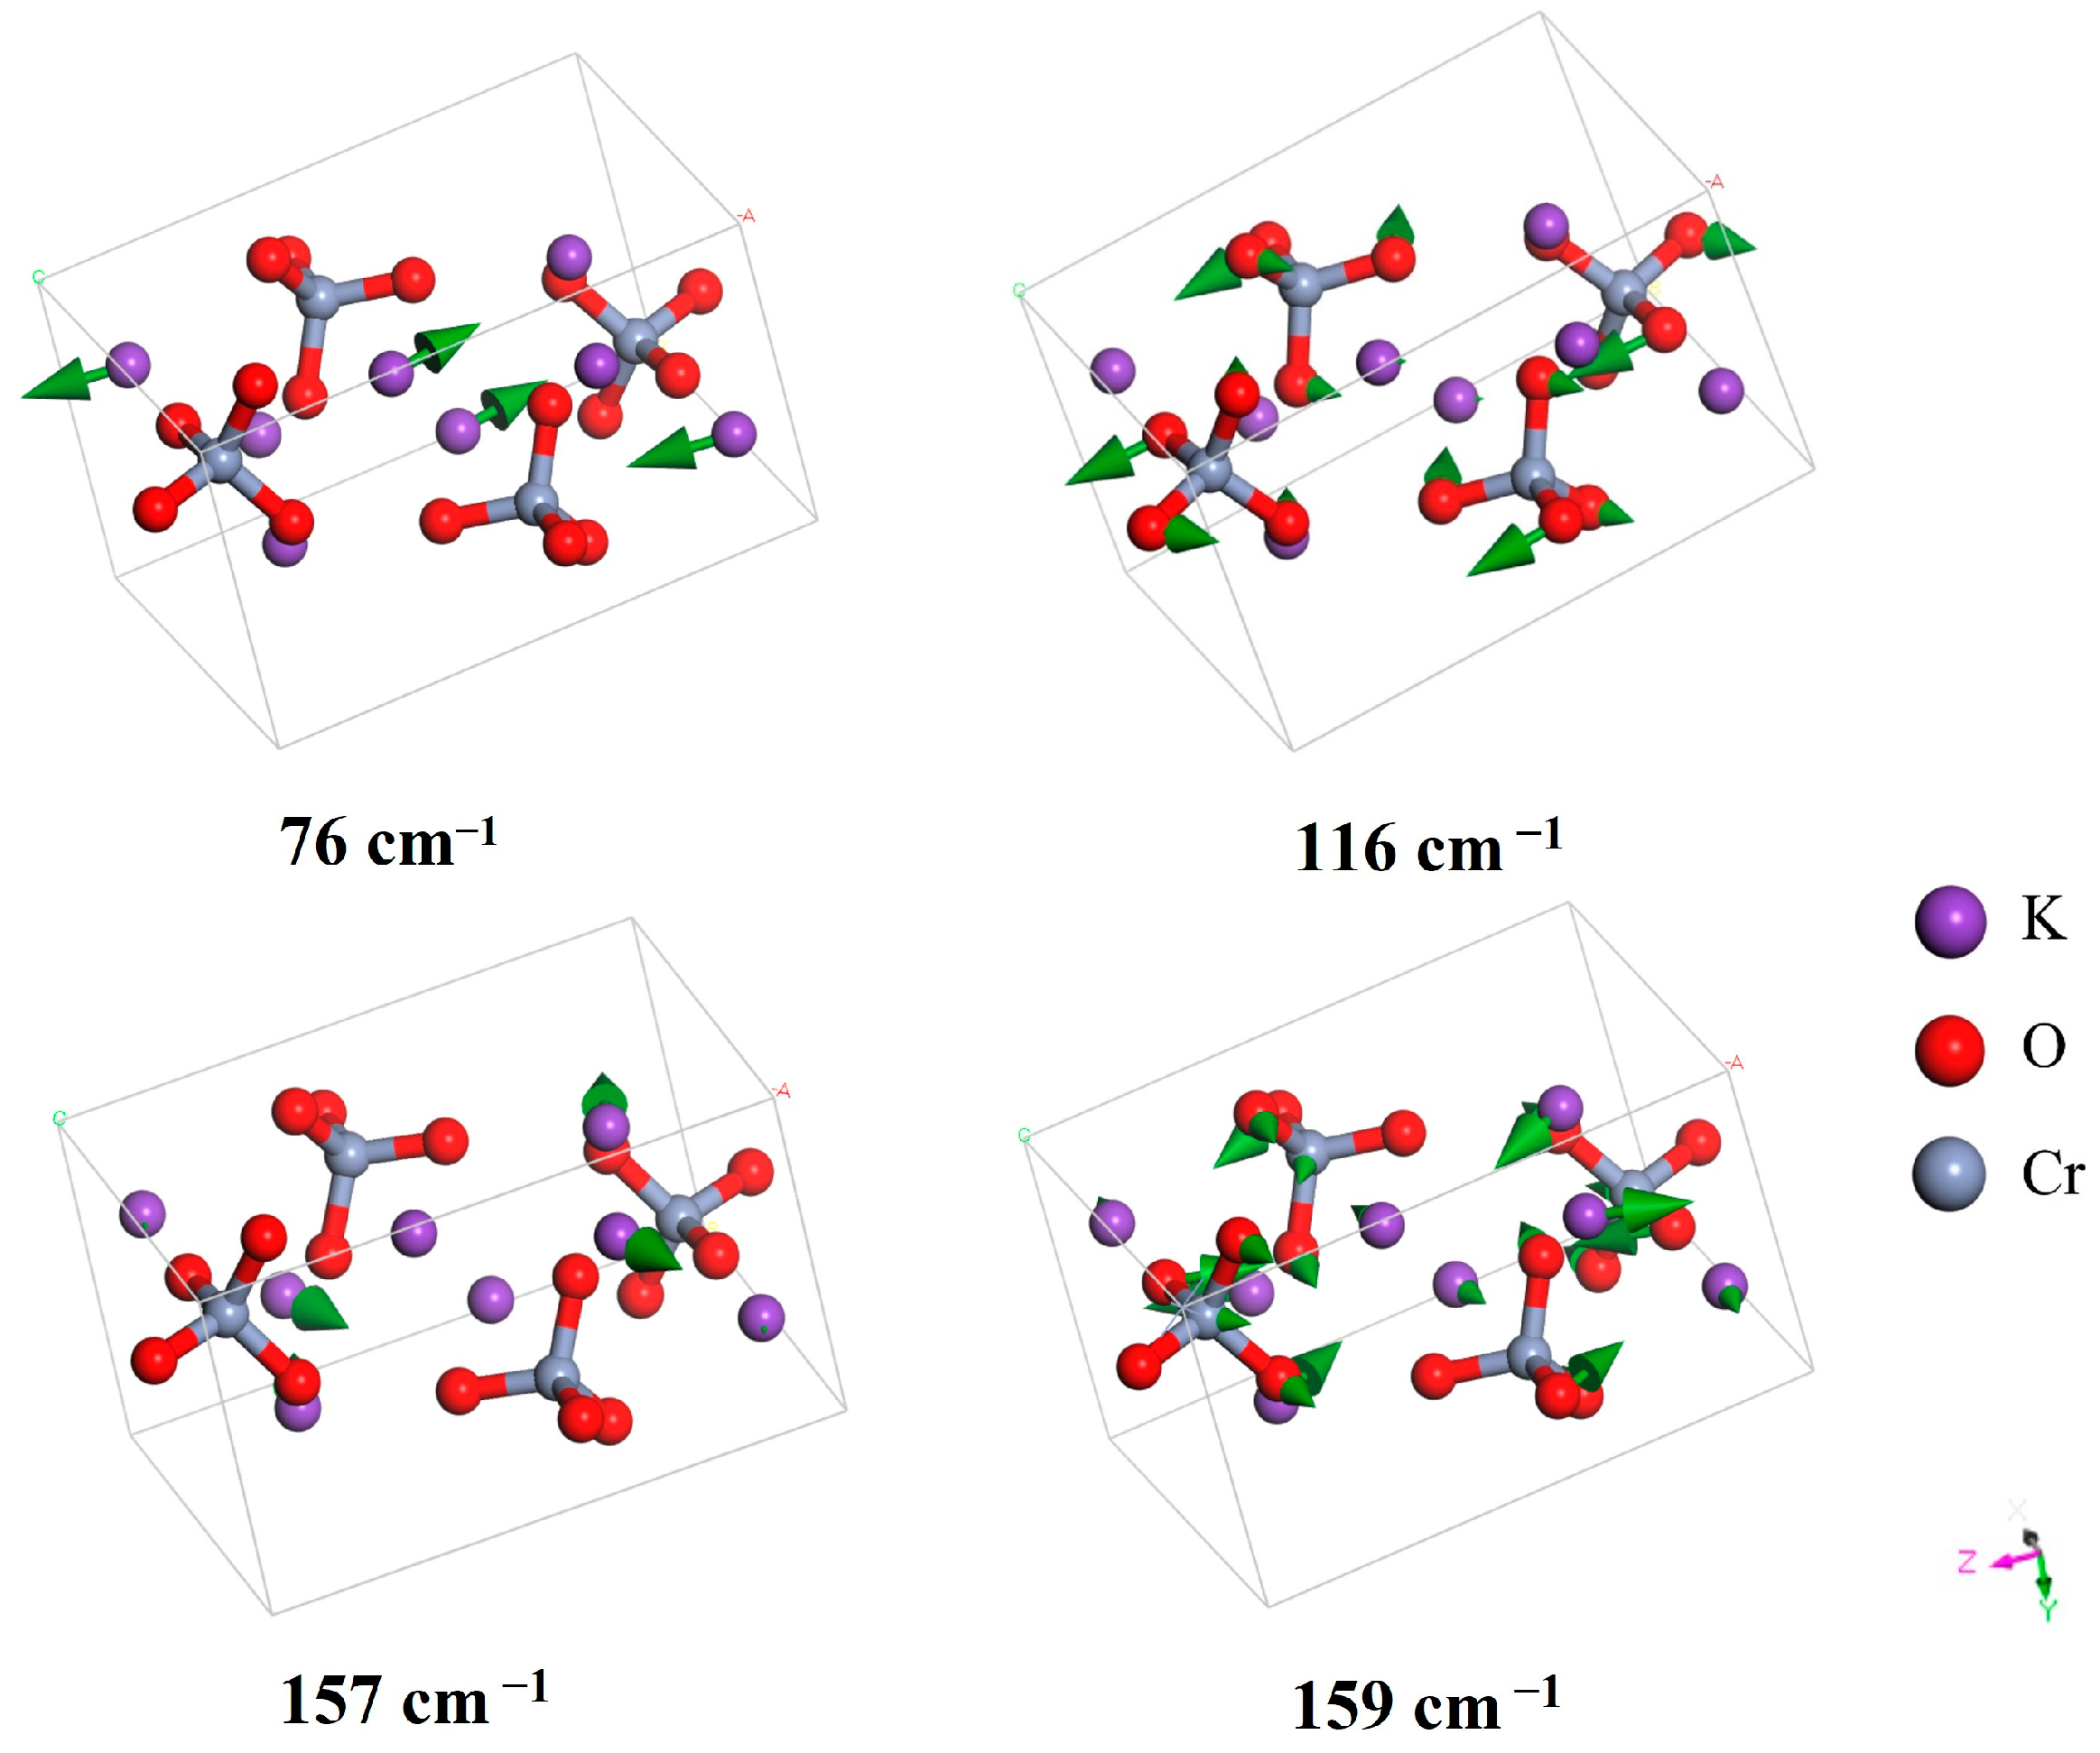
| 76 | IR | K+ translation | ||
| 76 | IR | Relative motion | ||
| 80 | Raman | Relative motion | ||
| 81 | Raman | Relative motion | ||
| 84 | IR | Relative motion | ||
| 92 | Raman | 85 b | Relative motion | |
| 95 | Raman | 91 b | Relative motion | |
| 100 | Raman | 93 b | Relative motion | |
| 102 | IR | Relative motion | ||
| 103 (2) | Raman | 99 b | Relative motion | |
| 105 | IR | Relative motion | ||
| 114 | Raman | 114 b | Relative motion | |
| 115 | Raman | Relative motion | ||
| 116 | IR | 106 d | Relative motion | |
| 119 | Raman | 119 b | Relative motion | |
| 125 (2) | IR | Relative motion | ||
| 126 | Raman | Relative motion | ||
| 127 | IR | Relative motion | ||
| 131 | Raman | Relative motion | ||
| 133 | IR | Relative motion | ||
| 137 | IR | Relative motion | ||
| 138 (2) | Raman | 138 b | Relative motion | |
| 141 | Raman | Relative motion | ||
| 145 | IR | Relative motion | ||
| 146 | Raman | Relative motion | ||
| 149 | IR | Relative motion | ||
| 152 | IR | 141 d | Relative motion | |
| 157 | IR | K+ translation | ||
| 159 | Raman | 157 b | Relative motion | |
| 165 | Raman | Relative motion | ||
| 324 | IR | CrO42− bending | ||
| 326 | Raman | CrO42− bending | ||
| 326 | IR | CrO42− bending | ||
| 329 | Raman | CrO42− bending | ||
| 332 | Raman | CrO42− bending | ||
| 334 | Raman | CrO42− bending | ||
| 336 | IR | CrO42− bending | ||
| 360 | Raman | CrO42− bending | ||
| 360 | IR | CrO42− bending | ||
| 363 | Raman | CrO42− bending | ||
| 364 | IR | CrO42− bending | ||
| 367 | IR | CrO42− bending | ||
| 369 | Raman | CrO42− bending | ||
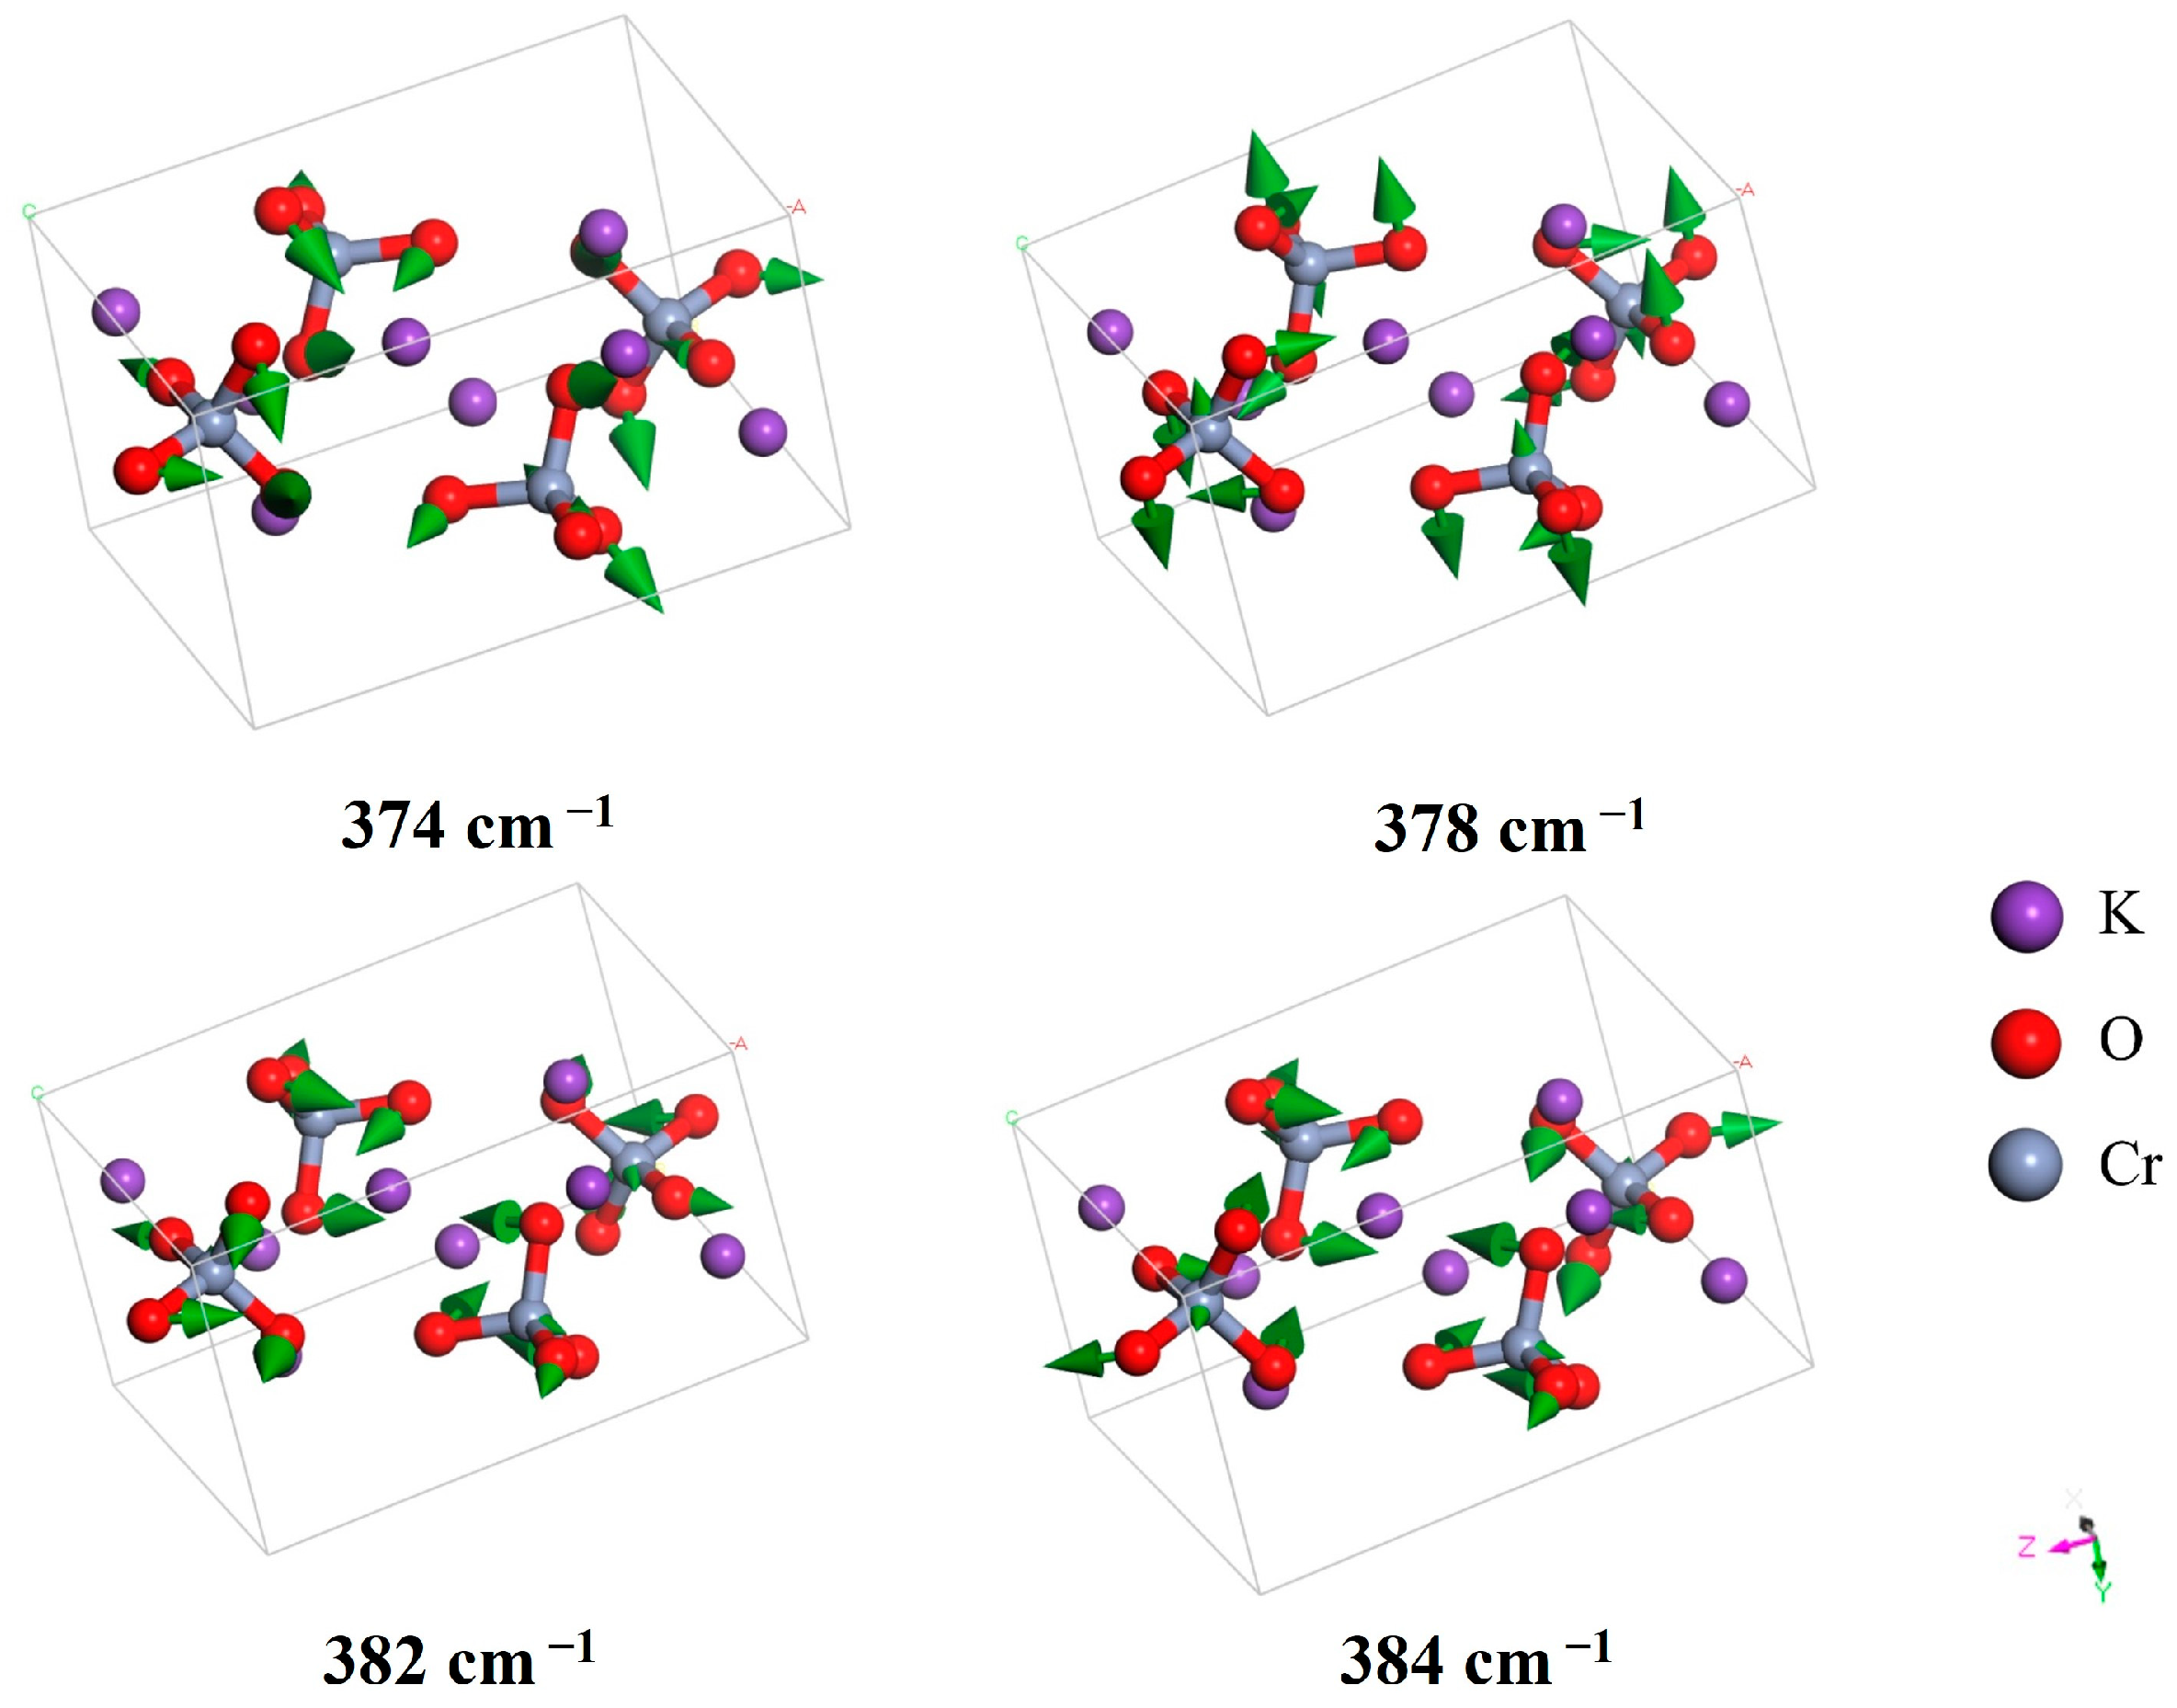
| 373 | IR | 342 b, 343 c,d | CrO42− bending | |
| 374 | Raman | 345 b, 348 c | CrO42− bending | |
| 378 | Raman | 346 b, 351 c, 347 d | CrO42− bending | |
| 382 | Raman | 350 b, 352 c, 351 d | CrO42− bending | |
| 384 | IR | 382 b | CrO42− bending | |
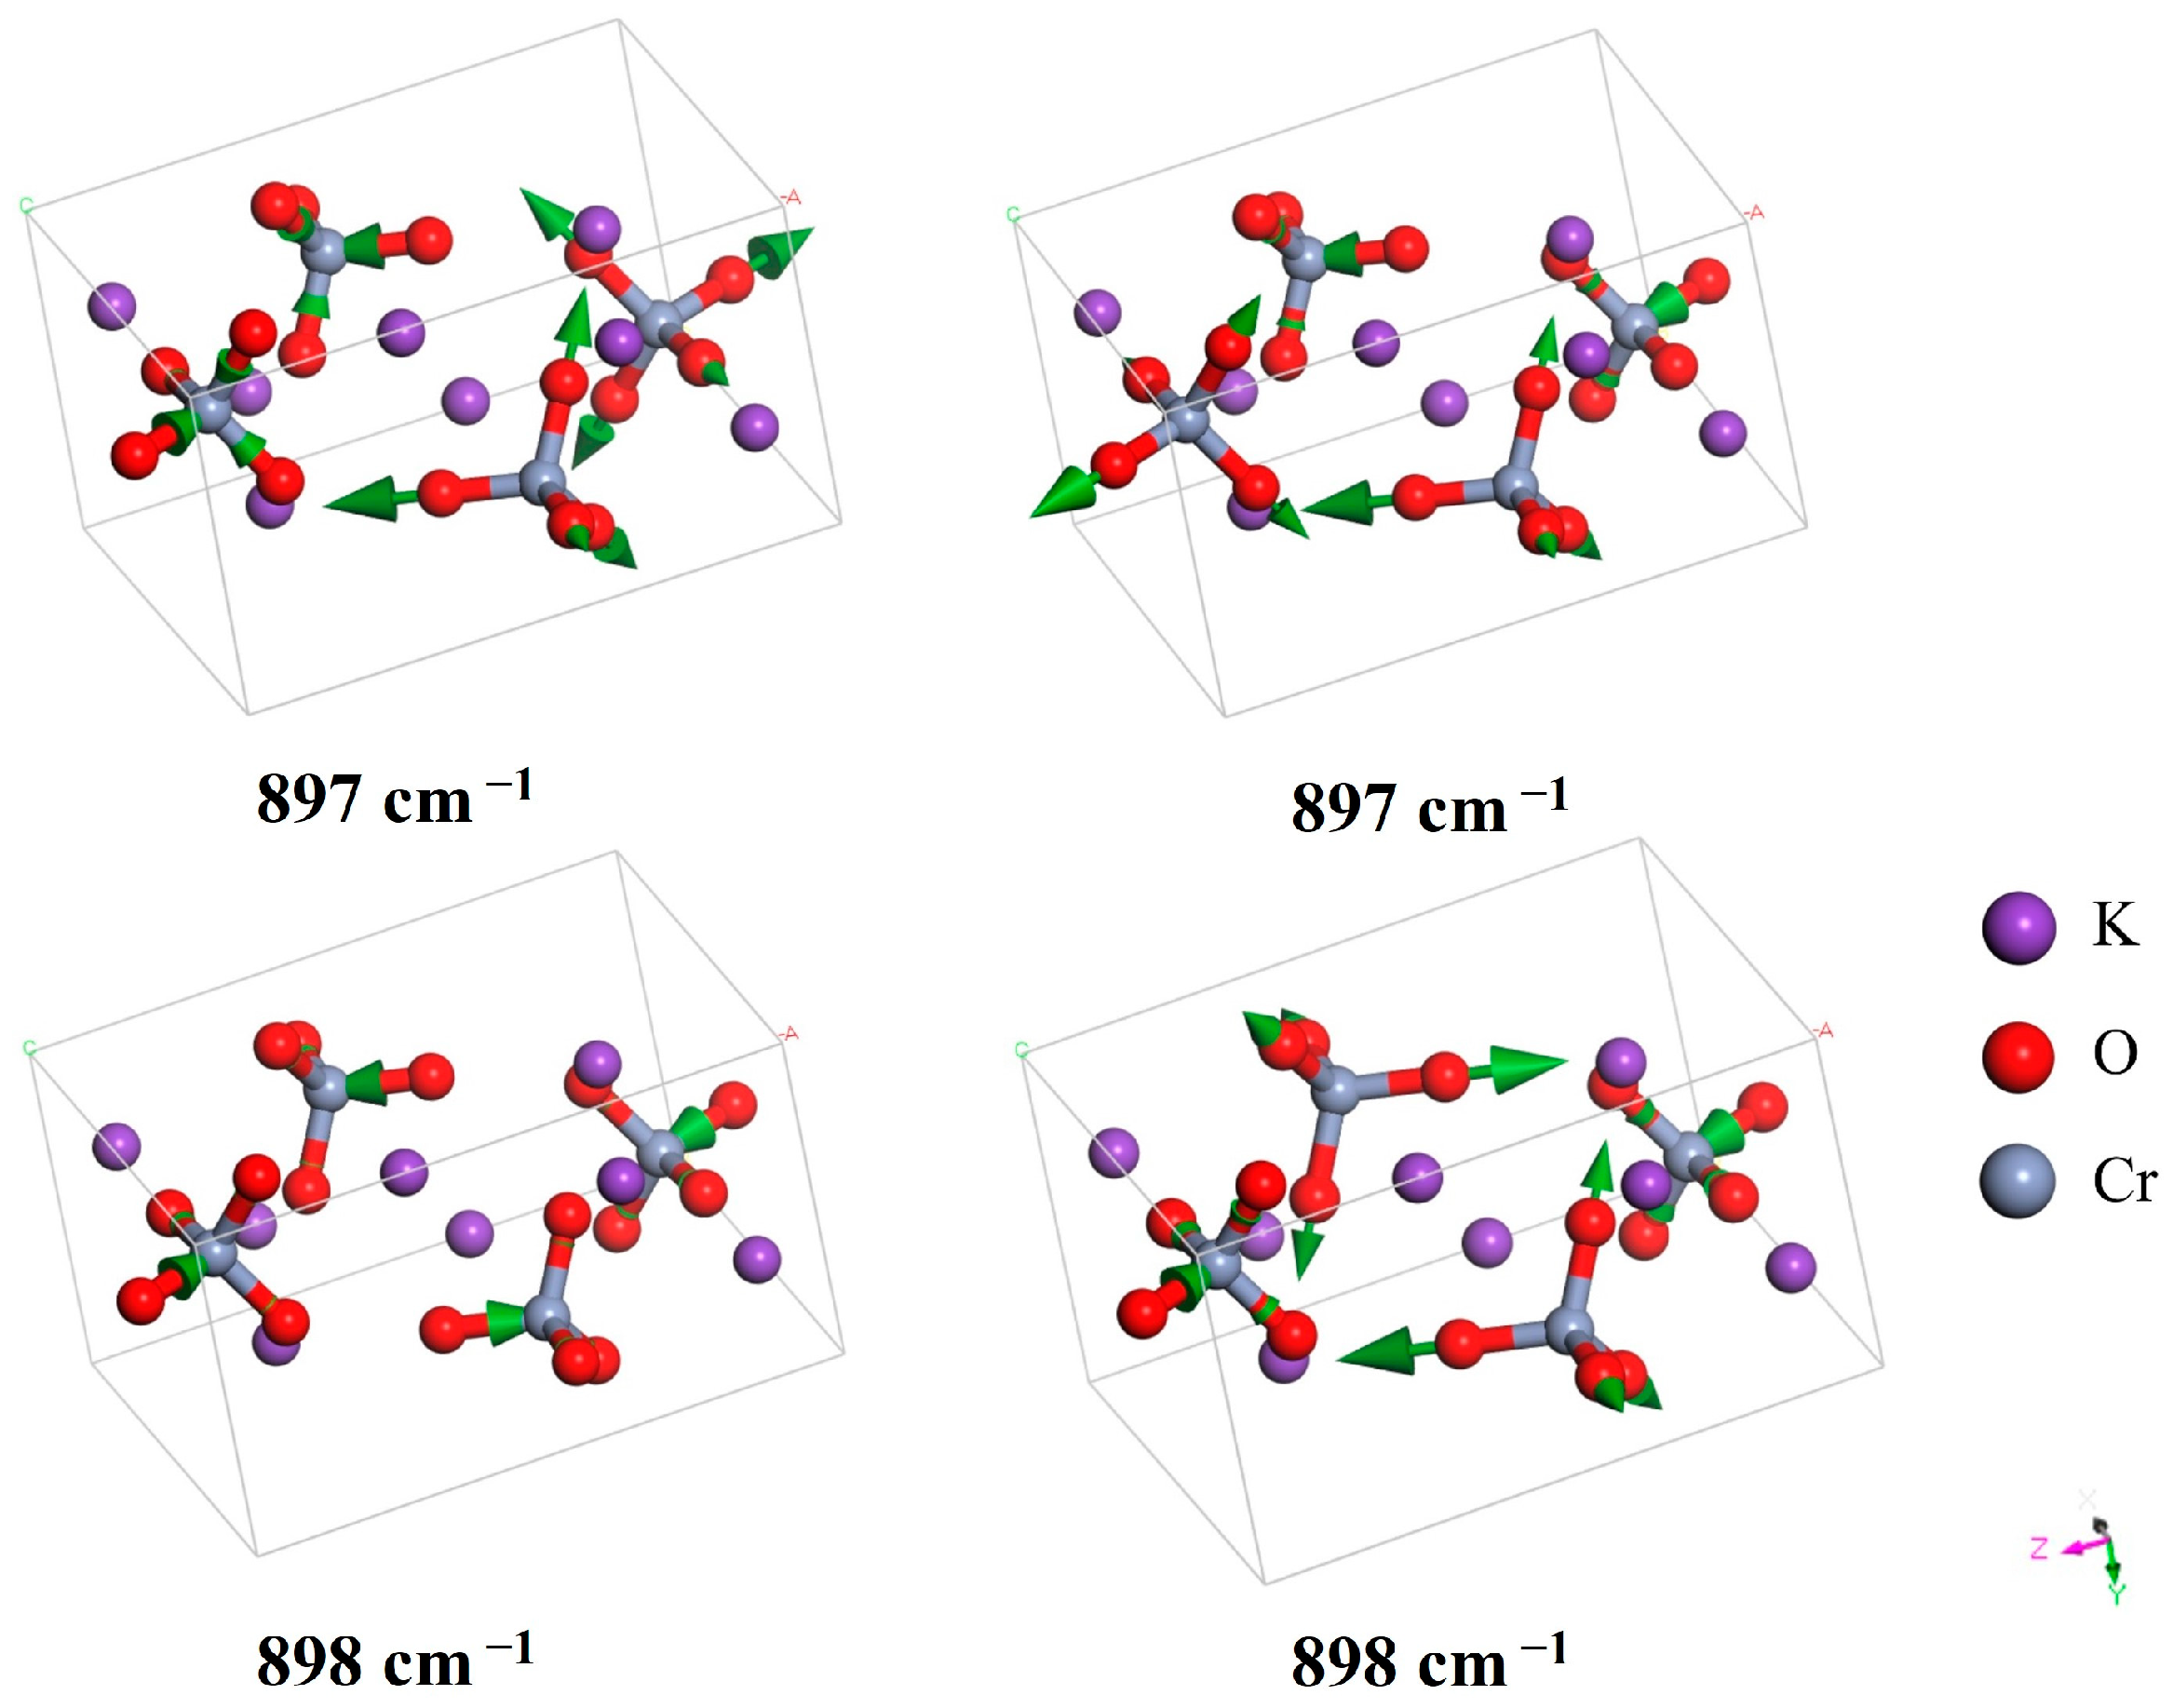
| 897 (2) | IR | 883 b, 876 c, 850 d | CrO42− stretching | |
| 898 (2) | Raman | 859 a, 881 b, 884 c, 885 d | CrO42− stretching | |
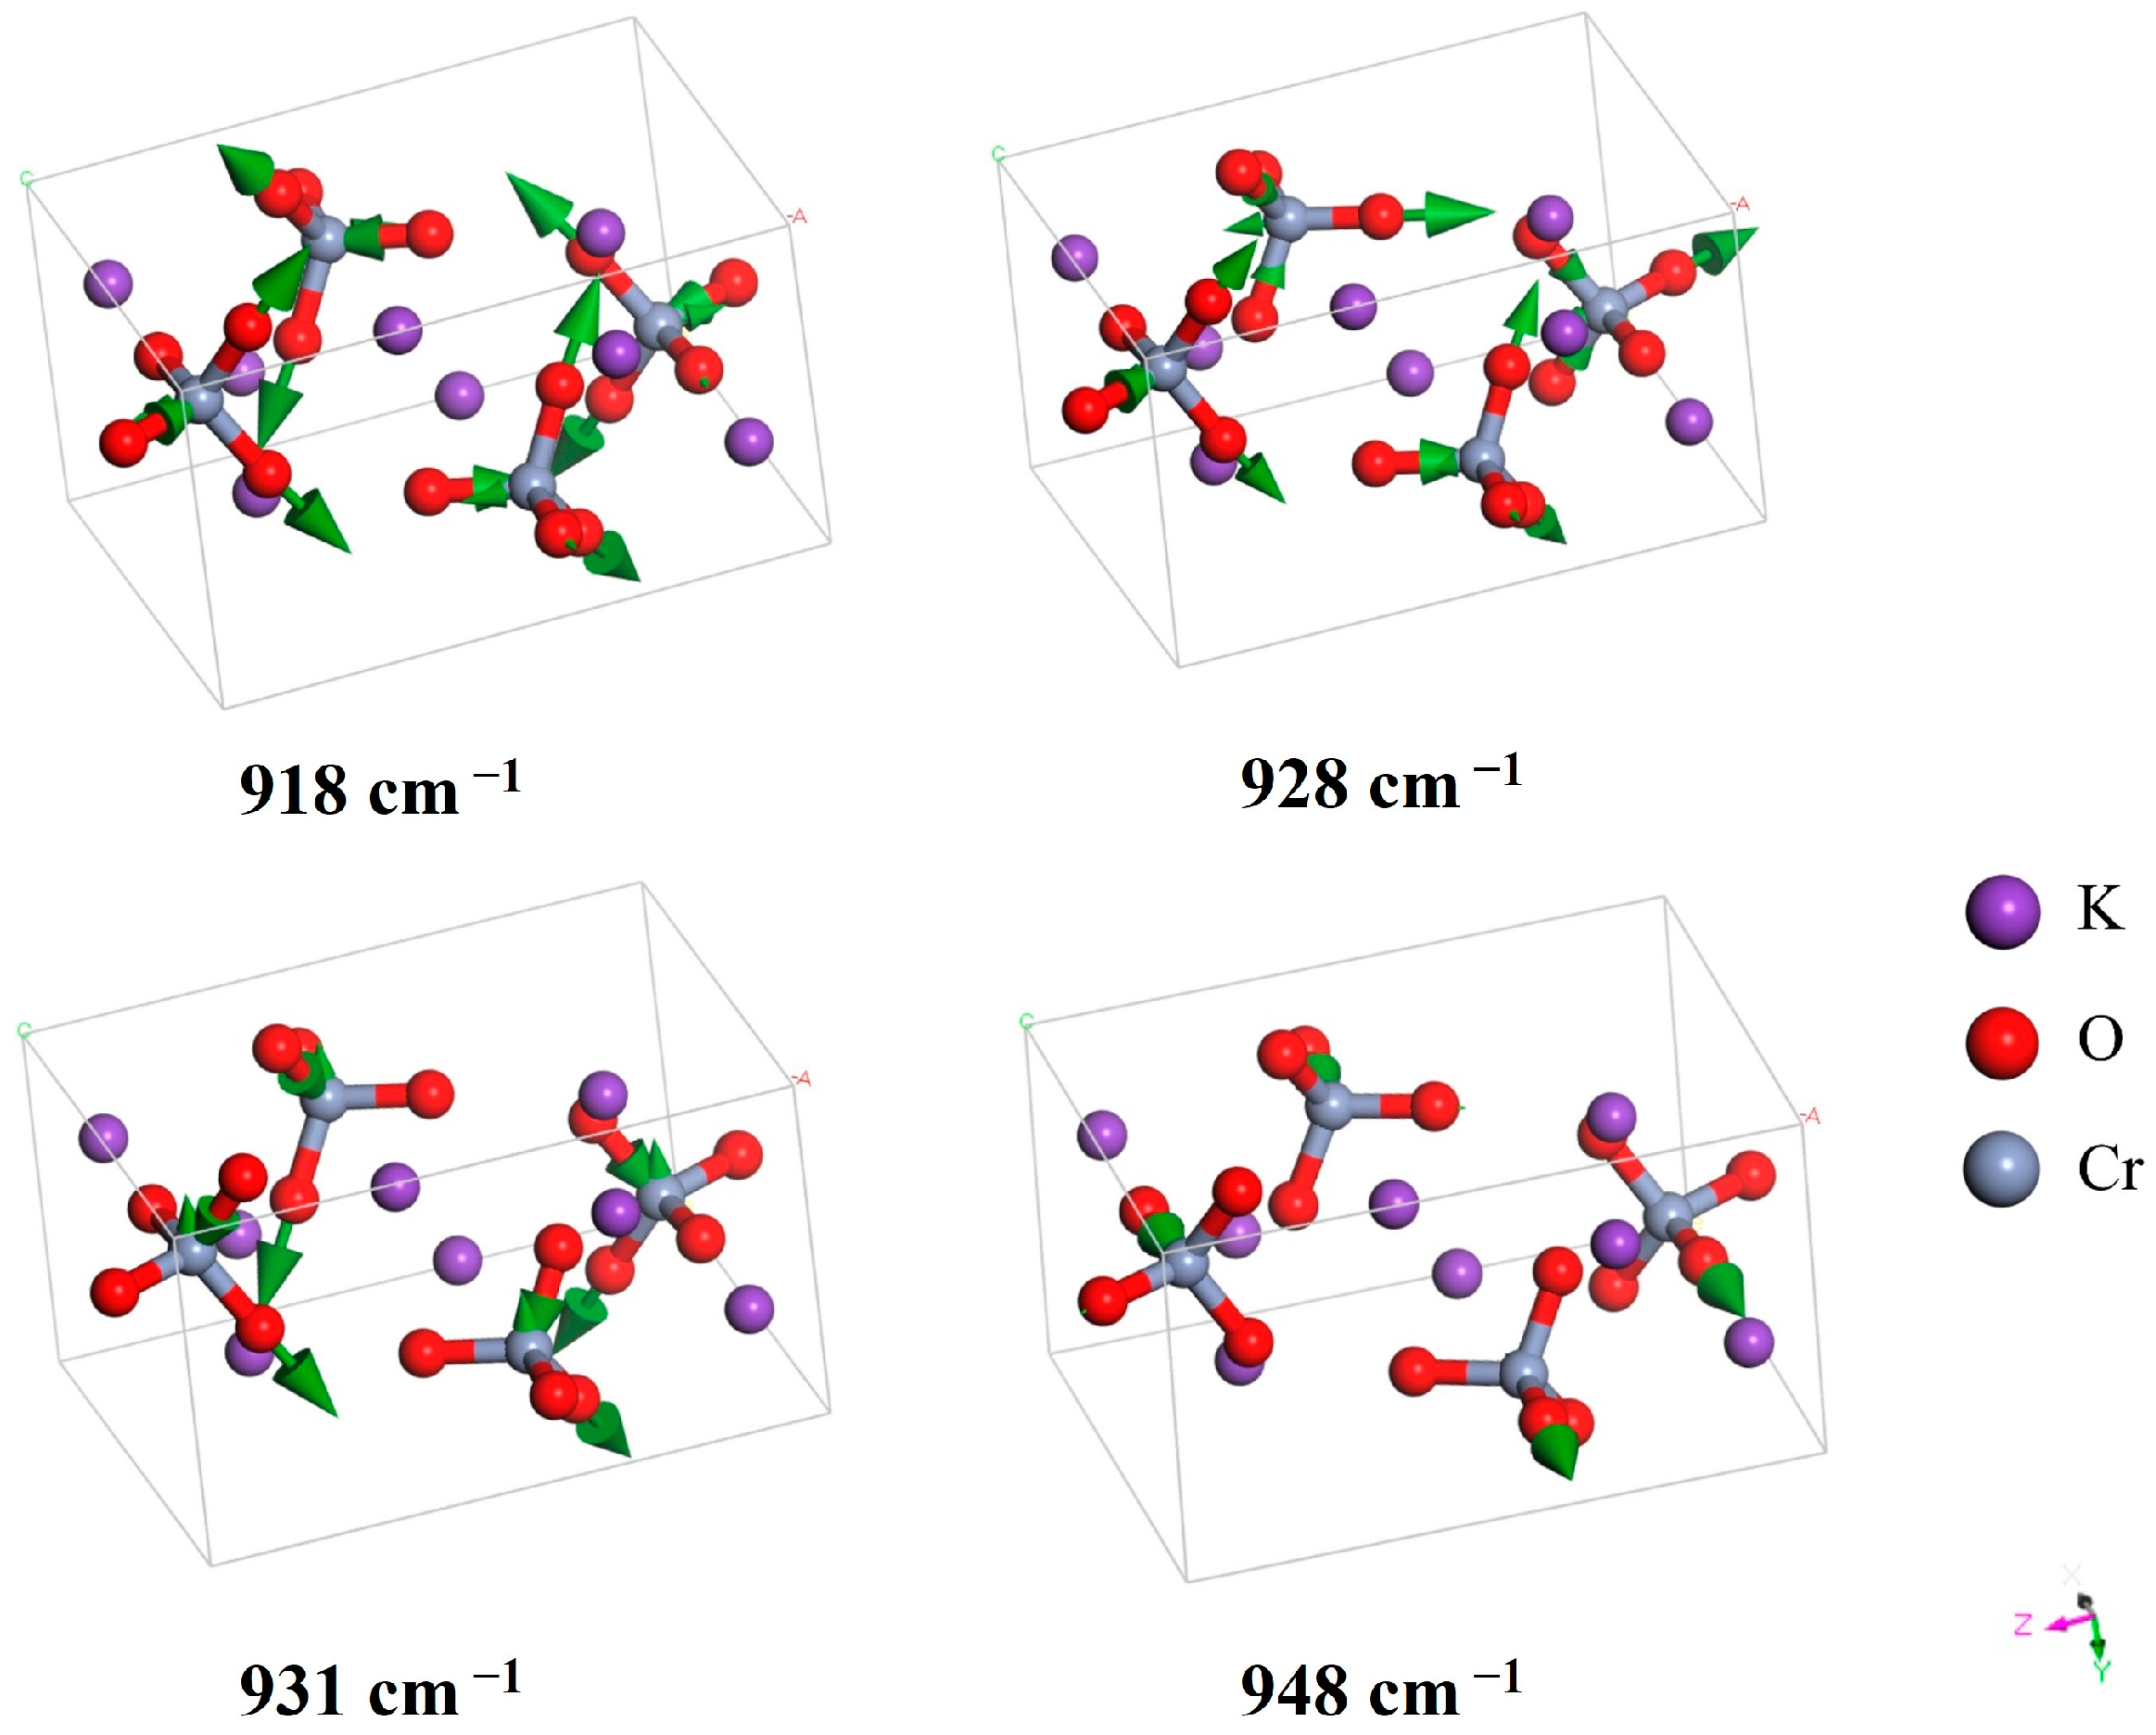
| 918 | Raman | 877 a, 918 b, 905 c, 905 d | CrO42− stretching | |
| 928 | IR | CrO42− stretching | ||
| 929 | Raman | CrO42− stretching | ||
| 931 | IR | 910 b, 890 c, 880 d | CrO42− stretching | |
| 932 | Raman | CrO42− stretching | ||
| 935 | Raman | CrO42− stretching | ||
| 948 | IR | 936 b, 920 c, 918 d | CrO42− stretching | |
| 961 | Raman | CrO42− stretching | ||
| 964 | IR | CrO42− stretching | ||
| 971 | IR | CrO42− stretching | ||
| 972 | Raman | CrO42− stretching |
Disclaimer/Publisher’s Note: The statements, opinions and data contained in all publications are solely those of the individual author(s) and contributor(s) and not of MDPI and/or the editor(s). MDPI and/or the editor(s) disclaim responsibility for any injury to people or property resulting from any ideas, methods, instructions or products referred to in the content. |
© 2025 by the authors. Licensee MDPI, Basel, Switzerland. This article is an open access article distributed under the terms and conditions of the Creative Commons Attribution (CC BY) license (https://creativecommons.org/licenses/by/4.0/).
Share and Cite
Xie, M.; Ren, H.; Huang, Y.; Li, P.; Li, Y.; Li, Y.; Xia, Y.; Zhang, P. Theoretical Investigation of Chromium Separation from Chromates Through Photon–Phonon Resonant Absorption. Crystals 2025, 15, 437. https://doi.org/10.3390/cryst15050437
Xie M, Ren H, Huang Y, Li P, Li Y, Li Y, Xia Y, Zhang P. Theoretical Investigation of Chromium Separation from Chromates Through Photon–Phonon Resonant Absorption. Crystals. 2025; 15(5):437. https://doi.org/10.3390/cryst15050437
Chicago/Turabian StyleXie, Mingyan, Haoxin Ren, Yuanda Huang, Peilin Li, Yining Li, Yawen Li, Yuqi Xia, and Peng Zhang. 2025. "Theoretical Investigation of Chromium Separation from Chromates Through Photon–Phonon Resonant Absorption" Crystals 15, no. 5: 437. https://doi.org/10.3390/cryst15050437
APA StyleXie, M., Ren, H., Huang, Y., Li, P., Li, Y., Li, Y., Xia, Y., & Zhang, P. (2025). Theoretical Investigation of Chromium Separation from Chromates Through Photon–Phonon Resonant Absorption. Crystals, 15(5), 437. https://doi.org/10.3390/cryst15050437