
Role of Oxygen Concentration in Reactive Sputtering of RuO2 Thin Films: Tuning Surface Chemistry for Enhanced Electrocatalytic Performance

 ,
,  ,
,  ,
,  and
and 
Abstract
1. Introduction
2. Experimental Details
2.1. Deposition of the RuO2 Films
2.2. Characterization of the Films
3. Results and Discussion
4. Conclusions
Author Contributions
Funding
Data Availability Statement
Conflicts of Interest
References
- Wei, C.; Xu, Z.J. The Comprehensive Understanding of 10 mA cm−2 geo as an Evaluation Parameter for Electrochemical Water Splitting. Small Methods 2018, 2, 3–5. [Google Scholar] [CrossRef]
- Wang, Z.; Li, C.; Domen, K. Recent developments in heterogeneous photocatalysts for solar-driven overall water splitting. Chem. Soc. Rev. 2019, 48, 2109–2125. [Google Scholar] [CrossRef] [PubMed]
- Over, H. Surface chemistry of ruthenium dioxide in heterogeneous catalysis and electrocatalysis: From fundamental to applied research. Chem. Rev. 2012, 112, 3356–3426. [Google Scholar] [CrossRef]
- Li, X.; Xiong, J.; Luo, Y.; Luo, Y. Electrochemical Properties of RuO2 Electrodes as a Function of Thin Film Thickness. J. Electron. Mater. 2018, 47, 347–352. [Google Scholar] [CrossRef]
- Over, H. Fundamental Studies of Planar Single-Crystalline Oxide Model Electrodes (RuO2, IrO2) for Acidic Water Splitting. ACS Catal. 2021, 11, 8848–8871. [Google Scholar] [CrossRef]
- Qin, Y.; Yu, T.; Deng, S.; Zhou, X.-Y.; Lin, D.; Zhang, Q.; Jin, Z.; Zhang, D.; He, Y.-B.; Qiu, H.-J.; et al. RuO2 electronic structure and lattice strain dual engineering for enhanced acidic oxygen evolution reaction performance. Nat. Commun. 2022, 13, 3784. [Google Scholar] [CrossRef]
- Dai, Y.; Li, H.; Wang, C.; Xue, W.; Zhang, M.; Zhao, D.; Xue, J.; Li, J.; Luo, L.; Liu, C.; et al. Manipulating local coordination of copper single atom catalyst enables efficient CO2-to-CH4 conversion. Nat. Commun. 2023, 14, 3382. [Google Scholar] [CrossRef]
- Yao, X.; Vepsäläinen, M.; Isa, F.; Martin, P.; Munroe, P.; Bendavid, A. Advanced RuO2 thin films for ph sensing application. Sensors 2020, 20, 6432. [Google Scholar] [CrossRef] [PubMed]
- Mahmood, J.; Li, F.; Jung, S.-M.; Okyay, M.S.; Ahmad, I.; Kim, S.-J.; Park, N.; Jeong, H.Y.; Baek, J.-B. An efficient and pH-universal ruthenium-based catalyst for the hydrogen evolution reaction. Nat. Nanotechnol. 2017, 12, 441–446. [Google Scholar] [CrossRef]
- Mao, G.; Yu, W.; Zhou, Q.; Li, L.; Huang, Y.; Yao, Y.; Chu, D.; Tong, H.; Guo, X. Improved electrochemical performance of high-nickel cathode material with electronic conductor RuO2 as the protecting layer for lithium-ion batteries. Appl. Surf. Sci. 2020, 531, 147245. [Google Scholar] [CrossRef]
- Roy, C.; Rao, R.R.; Stoerzinger, K.A.; Hwang, J.; Rossmeisl, J.; Chorkendorff, I.; Shao-Horn, Y.; Stephens, I.E.L. Trends in Activity and Dissolution on RuO2 versus Well-Defined Extended Surfaces. ACS Energy Lett. 2018, 3, 2045–2051. [Google Scholar] [CrossRef]
- Lee, Y.; Suntivich, J.; May, K.J.; Perry, E.E.; Shao-Horn, Y. Synthesis and Activities of Rutile IrO2 and RuO2 Nanoparticles for Oxygen Evolution in Acid and Alkaline Solutions. J. Phys. Chem. Lett. 2012, 3, 399–404. [Google Scholar] [CrossRef]
- Goryachev, A.; Pascuzzi, M.E.C.; Carlà, F.; Weber, T.; Over, H.; Hensen, E.J.; Hofmann, J.P. Electrochemical stability of RuO2(110)/Ru(0001) model electrodes in the oxygen and chlorine evolution reactions. Electrochim. Acta 2020, 336, 135713. [Google Scholar] [CrossRef]
- Dória, A.R.; Silva, R.S.; Júnior, P.H.O.; dos Santos, E.A.; Mattedi, S.; Hammer, P.; Salazar-Banda, G.R.; Eguiluz, K.I. Electrochimica Acta Influence of the RuO2 layer thickness on the physical and electrochemical properties of anodes synthesized by the ionic liquid method. Electrochim. Acta 2020, 354, 136625. [Google Scholar] [CrossRef]
- Liu, Y.; Duan, T.; Xu, L.; Gao, X.; Xue, L.; Xin, Y.; Ma, L.; Huang, G.; Liu, T. Electrocatalyst of RuO2 decorating TiO2 nanowire arrays for acidic oxygen evolution. Int. J. Hydrogen Energy 2023, 48, 10737–10754. [Google Scholar] [CrossRef]
- Jiang, J.; Zhou, X.L.; Lv, H.G.; Yu, H.Q.; Yu, Y. Bimetallic-Based Electrocatalysts for Oxygen Evolution Reaction. Adv. Funct. Mater. 2023, 33, 2212160. [Google Scholar] [CrossRef]
- Chen, S.; Huang, H.; Jiang, P.; Yang, K.; Diao, J.; Gong, S.; Liu, S.; Huang, M.; Wang, H.; Chen, Q. Mn-Doped RuO2 Nanocrystals as Highly Active Electrocatalysts for Enhanced Oxygen Evolution in Acidic Media. ACS Catal. 2020, 10, 1152–1160. [Google Scholar] [CrossRef]
- Cheng, W.; Liu, Y.; Wu, L.; Chen, R.; Wang, J.; Chang, S.; Ma, F.; Li, Y.; Ni, H. RuO2/IrO2 nanoparticles decorated TiO2 nanotube arrays for improved activity towards chlorine evolution reaction. Catal. Today 2022, 400–401, 26–34. [Google Scholar] [CrossRef]
- Tsuji, E.; Imanishi, A.; Fukui, K.I.; Nakato, Y. Electrocatalytic activity of amorphous RuO2 electrode for oxygen evolution in an aqueous solution. Electrochim. Acta 2011, 56, 2009–2016. [Google Scholar] [CrossRef]
- Tee, S.Y.; Jing, C.; Lee, J.; Dinachali, S.S. Amorphous ruthenium nanoparticles for enhanced electrochemical water splitting. Nanotechnology 2015, 26, 415401. [Google Scholar] [CrossRef]
- Wang, Q.; Gladfelter, W.L.; Fennell Evans, D.; Fan, Y.; Franciosi, A. Reactive-sputter deposition and structure of RuO2 films on sapphire and strontium titanate. J. Vac. Sci. Technol A Vac. Surf. Film. 1996, 14, 747–752. [Google Scholar] [CrossRef]
- Battaglin, G.; Rigato, V.; Zandolin, S.; Benedetti, A.; Ferro, S.; Nanni, L.; De Battisti, A. Microstructural Characterization and Electrochemical Properties of RuO2 Thin Film Electrodes Prepared by Reactive Radio-Frequency Magnetron Sputtering. Chem. Mater. 2004, 16, 946–952. [Google Scholar] [CrossRef]
- Zhao, W.; Wang, K.; Li, H.; Yang, Z.; Liu, Z.; Sun, J.; Wang, D.; Liu, S. Stoichiometry control of sputtered zinc oxide films by adjusting Ar/O2 gas ratios as electron transport layers for efficient planar perovskite solar cells. Sol. Energy Mater. Sol. Cells 2018, 178, 200–207. [Google Scholar] [CrossRef]
- Allhusen, J.S.; Conboy, J.C. Preparation and characterization of conductive and transparent ruthenium dioxide sol-gel films. ACS Appl. Mater. Interfaces 2013, 5, 11683–11691. [Google Scholar] [CrossRef]
- Cherevko, S.; Geiger, S.; Kasian, O.; Kulyk, N.; Grote, J.P.; Savan, A.; Shrestha, B.R.; Merzlikin, S.; Breitbach, B.; Ludwig, A.; et al. Oxygen and hydrogen evolution reactions on Ru, RuO2, Ir, and IrO2 thin film electrodes in acidic and alkaline electrolytes: A comparative study on activity and stability. Catal. Today 2016, 262, 170–180. [Google Scholar] [CrossRef]
- Eichler, B.; Zude, F.; Fan, W.; Trautmann, N.; Herrmann, G. Volatilization and Deposition of Ruthenium Oxides in a Temperature Gradient Tube. Radiochim. Acta 1992, 56, 133–140. [Google Scholar] [CrossRef]
- Mun, C.; Ehrhardt, J.J.; Lambert, J.; Madic, C. XPS investigations of ruthenium deposited onto representative inner surfaces of nuclear reactor containment buildings. Appl. Surf. Sci. 2007, 253, 7613–7621. [Google Scholar] [CrossRef]
- Kim, K.S.; Winograd, N. X-ray photoelectron spectroscopic studies of ruthenium-oxygen surfaces. J. Catal. 1974, 35, 66–72. [Google Scholar] [CrossRef]
- Zimmerman, G.L.; Riviello, S.J.; Glauser, T.A.; Kay, J.G. Photochemical decomposition of RuO4. J. Phys. Chem. 1990, 94, 2399–2404. [Google Scholar] [CrossRef]
- Jeon, W.; Lee, W.; Yoo, Y.W.; An, C.H.; Han, J.H.; Kim, S.K.; Hwang, C.S. Chemistry of active oxygen in RuOxand its influence on the atomic layer deposition of TiO2 films. J. Mater. Chem. C 2014, 2, 9993–10001. [Google Scholar] [CrossRef]
- Angermann, M.; Jakopic, G.; Prietl, C.; Griesser, T.; Reichmann, K.; Deluca, M. Highly conductive RuO2 thin films from novel facile aqueous chemical solution deposition. J. Sol-Gel Sci. Technol. 2023, 108, 575–587. [Google Scholar] [CrossRef]
- Owrutsky, J.C.; Long, J.P.; Chervin, C.N.; Bussmann, K.; Rolison, D.R. The effect of disorder on the optical constants of nanoscale RuO2. Thin Solid Film. 2015, 589, 344–350. [Google Scholar] [CrossRef]
- Jellison, G.E.; Modine, F.A. Parameterization of the optical functions of amorphous materials in the interband region. Appl. Phys. Lett. 1996, 69, 371–373. [Google Scholar] [CrossRef]
- Chason, E.; Mayer, T.M.; Mayer, M. Thin film and surface characterization by specular X-ray reflectivity. Crit. Rev. Solid State Mater. Sci. 1997, 22, 1–67. [Google Scholar] [CrossRef]
- Ferrari, S.; Modreanu, M.; Scarel, G.; Fanciulli, M. X-ray reflectivity and spectroscopic ellipsometry as metrology tools for the characterization of interfacial layers in high-k materials. Thin Solid Film. 2004, 450, 124–127. [Google Scholar] [CrossRef]
- Roeder, G.; Manke, C.; Baumann, P.K.; Petersen, S.; Yanev, V.; Gschwandtner, A.; Ruhl, G.; Petrik, P.; Schellenberger, M.; Pfitzner, L.; et al. Characterization of Ru and RuO2 thin films prepared by pulsed metal organic chemical vapor deposition. Phys. Status Solidi Curr. Top. Solid. State Phys. 2008, 5, 1231–1234. [Google Scholar] [CrossRef]
- Biswas, S.; Prabakar, K.; Takahashi, T.; Nakashima, T.; Kubota, Y.; Fujishima, A. Study of photocatalytic activity of TiO2 thin films prepared in various Ar/O2 ratio and sputtering gas pressure. J. Vac. Sci. Technol A Vac. Surf. Film. 2007, 25, 912–916. [Google Scholar] [CrossRef]
- Ali, Z.; Afzal, N.; Rafique, M. Effect of Ar:O2 ratio on reactively magnetron sputtered ZnO film’s properties. Mater. Res. Express 2019, 6, 116419. [Google Scholar] [CrossRef]
- Kozodaev, M.G.; Lebedinskii, Y.Y.; Chernikova, A.G.; Korostylev, E.V.; Chouprik, A.A.; Khakimov, R.R.; Markeev, A.M.; Hwang, C.S. Temperature controlled Ru and RuO2 growth via O* radical-enhanced atomic layer deposition with Ru(EtCp)2. J. Chem. Phys. 2009, 151, 204701. [Google Scholar] [CrossRef]
- Mei, B.A.; Munteshari, O.; Lau, J.; Dunn, B.; Pilon, L. Physical Interpretations of Nyquist Plots for EDLC Electrodes and Devices. J. Phys. Chem. C 2018, 122, 194–206. [Google Scholar] [CrossRef]
- Deka, N.; Jones, T.E.; Falling, L.J.; Sandoval-Diaz, L.-E.; Lunkenbein, T.; Velasco-Velez, J.-J.; Chan, T.-S.; Chuang, C.-H.; Knop-Gericke, A.; Mom, R.V. On the Operando Structure of Ruthenium Oxides during the Oxygen Evolution Reaction in Acidic Media. ACS Catal. 2023, 13, 7488–7498. [Google Scholar] [CrossRef]
- Rao, R.R.; Kolb, M.J.; Hwang, J.; Pedersen, A.F.; Mehta, A.; You, H.; Stoerzinger, K.A.; Feng, Z.; Zhou, H.; Bluhm, H.; et al. Surface Orientation Dependent Water Dissociation on Rutile Ruthenium Dioxide Surface Orientation Dependent Water Dissociation on Rutile Ruthenium Dioxide. J. Phys. Chem. C 2018, 122, 17802–17811. [Google Scholar] [CrossRef]
- Over, H.; Kim, Y.D.; Seitsonen, A.P.; Wendt, S.; Lundgren, E.; Schmid, M.; Varga, P.; Morgante, A.; Ertl, G. Atomic-scale structure and catalytic reactivity of the RuO2 (110) surface. Science 2000, 287, 1474–1477. [Google Scholar] [CrossRef]
- Chen, M.; Tan, S.X.; Cheng, S.; Chen, Y.-Y.; Hsu, Y.-H.; Hung, S.-F.; Zhang, L.; Gao, J. Revisiting the ruthenium oxide-based water oxidation catalysts in acidic media: From amorphous to crystalline. Nano Energy 2025, 137, 110800. [Google Scholar] [CrossRef]
- Zhang, L.; Kloppenburg, J.; Lin, C.Y.; Mitrovic, L.; Gelin, S.; Dabo, I.; Schlom, D.G.; Suntivich, J.; Hautier, G. Atomistic Understanding of Hydrogen Coverage on RuO2(110) Surface under Electrochemical Conditions from Ab Initio Statistical Thermodynamics. J. Phys. Chem. C 2025, 129, 4043–4051. [Google Scholar] [CrossRef]
- Song, Z.; Wang, K.; Sun, Q.; Zhang, L.; Li, J.; Li, D.; Sze, P.; Liang, Y.; Sun, X.; Fu, X.; et al. High-Performance Ammonium Cobalt Phosphate Nanosheet Electrocatalyst for Alkaline Saline Water Oxidation. Adv. Sci. 2021, 8, 2100498. [Google Scholar] [CrossRef] [PubMed]
- Reiser, C.; Keßler, P.; Kamp, M.; Jovic, V.; Moser, S. Specific Capacitance of RuO2(110) Depends Sensitively on Surface Order. J. Phys. Chem. C 2022, 127, 3682–3688. [Google Scholar] [CrossRef]
- Wang, Y.; Gu, D.; Guo, J.; Xu, M.; Sun, H.; Li, J.; Wang, L.; Shen, L. Maximized Energy Density of RuO2//RuO2 Supercapacitors Through Potential Dependence of Specific Capacitance. ChemElectroChem 2020, 7, 928–936. [Google Scholar] [CrossRef]
- Zhai, Y.; Ren, X.; Yan, J.; Liu, S. High Density and Unit Activity Integrated in Amorphous Catalysts for Electrochemical Water Splitting. Small Struct. 2021, 2, 2000096. [Google Scholar] [CrossRef]
- Zhang, D.; Soo, J.Z.; Tan, H.H.; Jagadish, C.; Catchpole, K.; Karuturi, S.K. Earth-Abundant Amorphous Electrocatalysts for Electrochemical Hydrogen Production: A Review. Adv. Energy Sustain. Res. 2021, 2, 2000071. [Google Scholar] [CrossRef]
- Yu, T.; Xu, Q.; Qian, G.; Chen, J.; Zhang, H.; Luo, L.; Yin, S. Amorphous CoOx-Decorated Crystalline RuO2 Nanosheets as Bifunctional Catalysts for Boosting Overall Water Splitting at Large Current Density. ACS Sustain. Chem. Eng. 2020, 8, 17520–17526. [Google Scholar] [CrossRef]
- Park, J.; Lee, S.; Kim, S. Recent advances in amorphous electrocatalysts for oxygen evolution reaction. Front. Chem. 2022, 10, 1030803. [Google Scholar] [CrossRef] [PubMed]


| Sample Name | Ar:O2 Ratio | Sample Description |
|---|---|---|
| S50 | 1:1 | RuO2 deposited with 50% oxygen concentration |
| S33 | 2:1 | RuO2 deposited with 33% oxygen concentration |
| S25 | 3:1 | RuO2 deposited with 33% oxygen concentration |
| S20 | 4:1 | RuO2 deposited with 33% oxygen concentration |
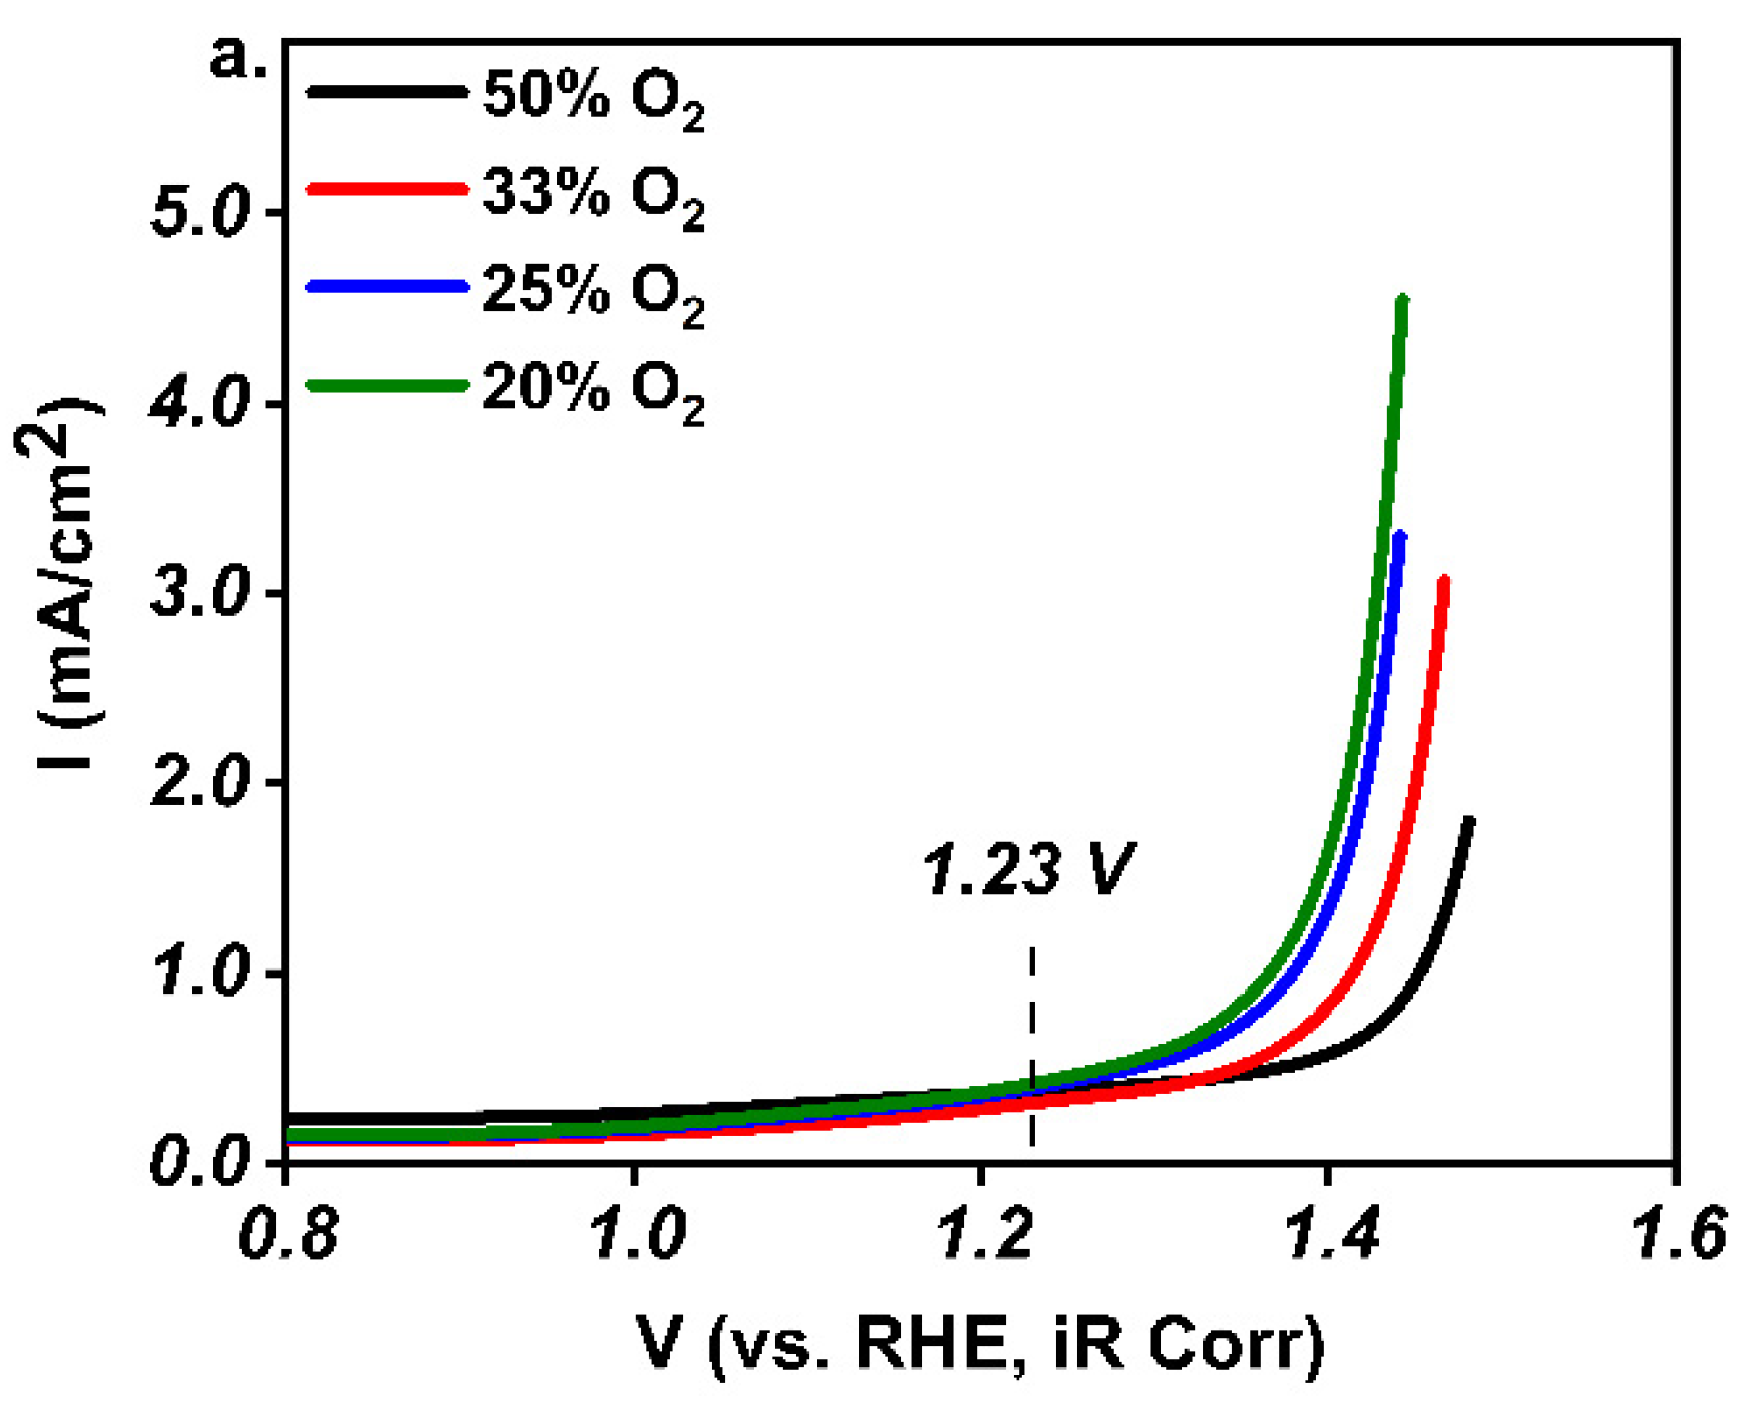
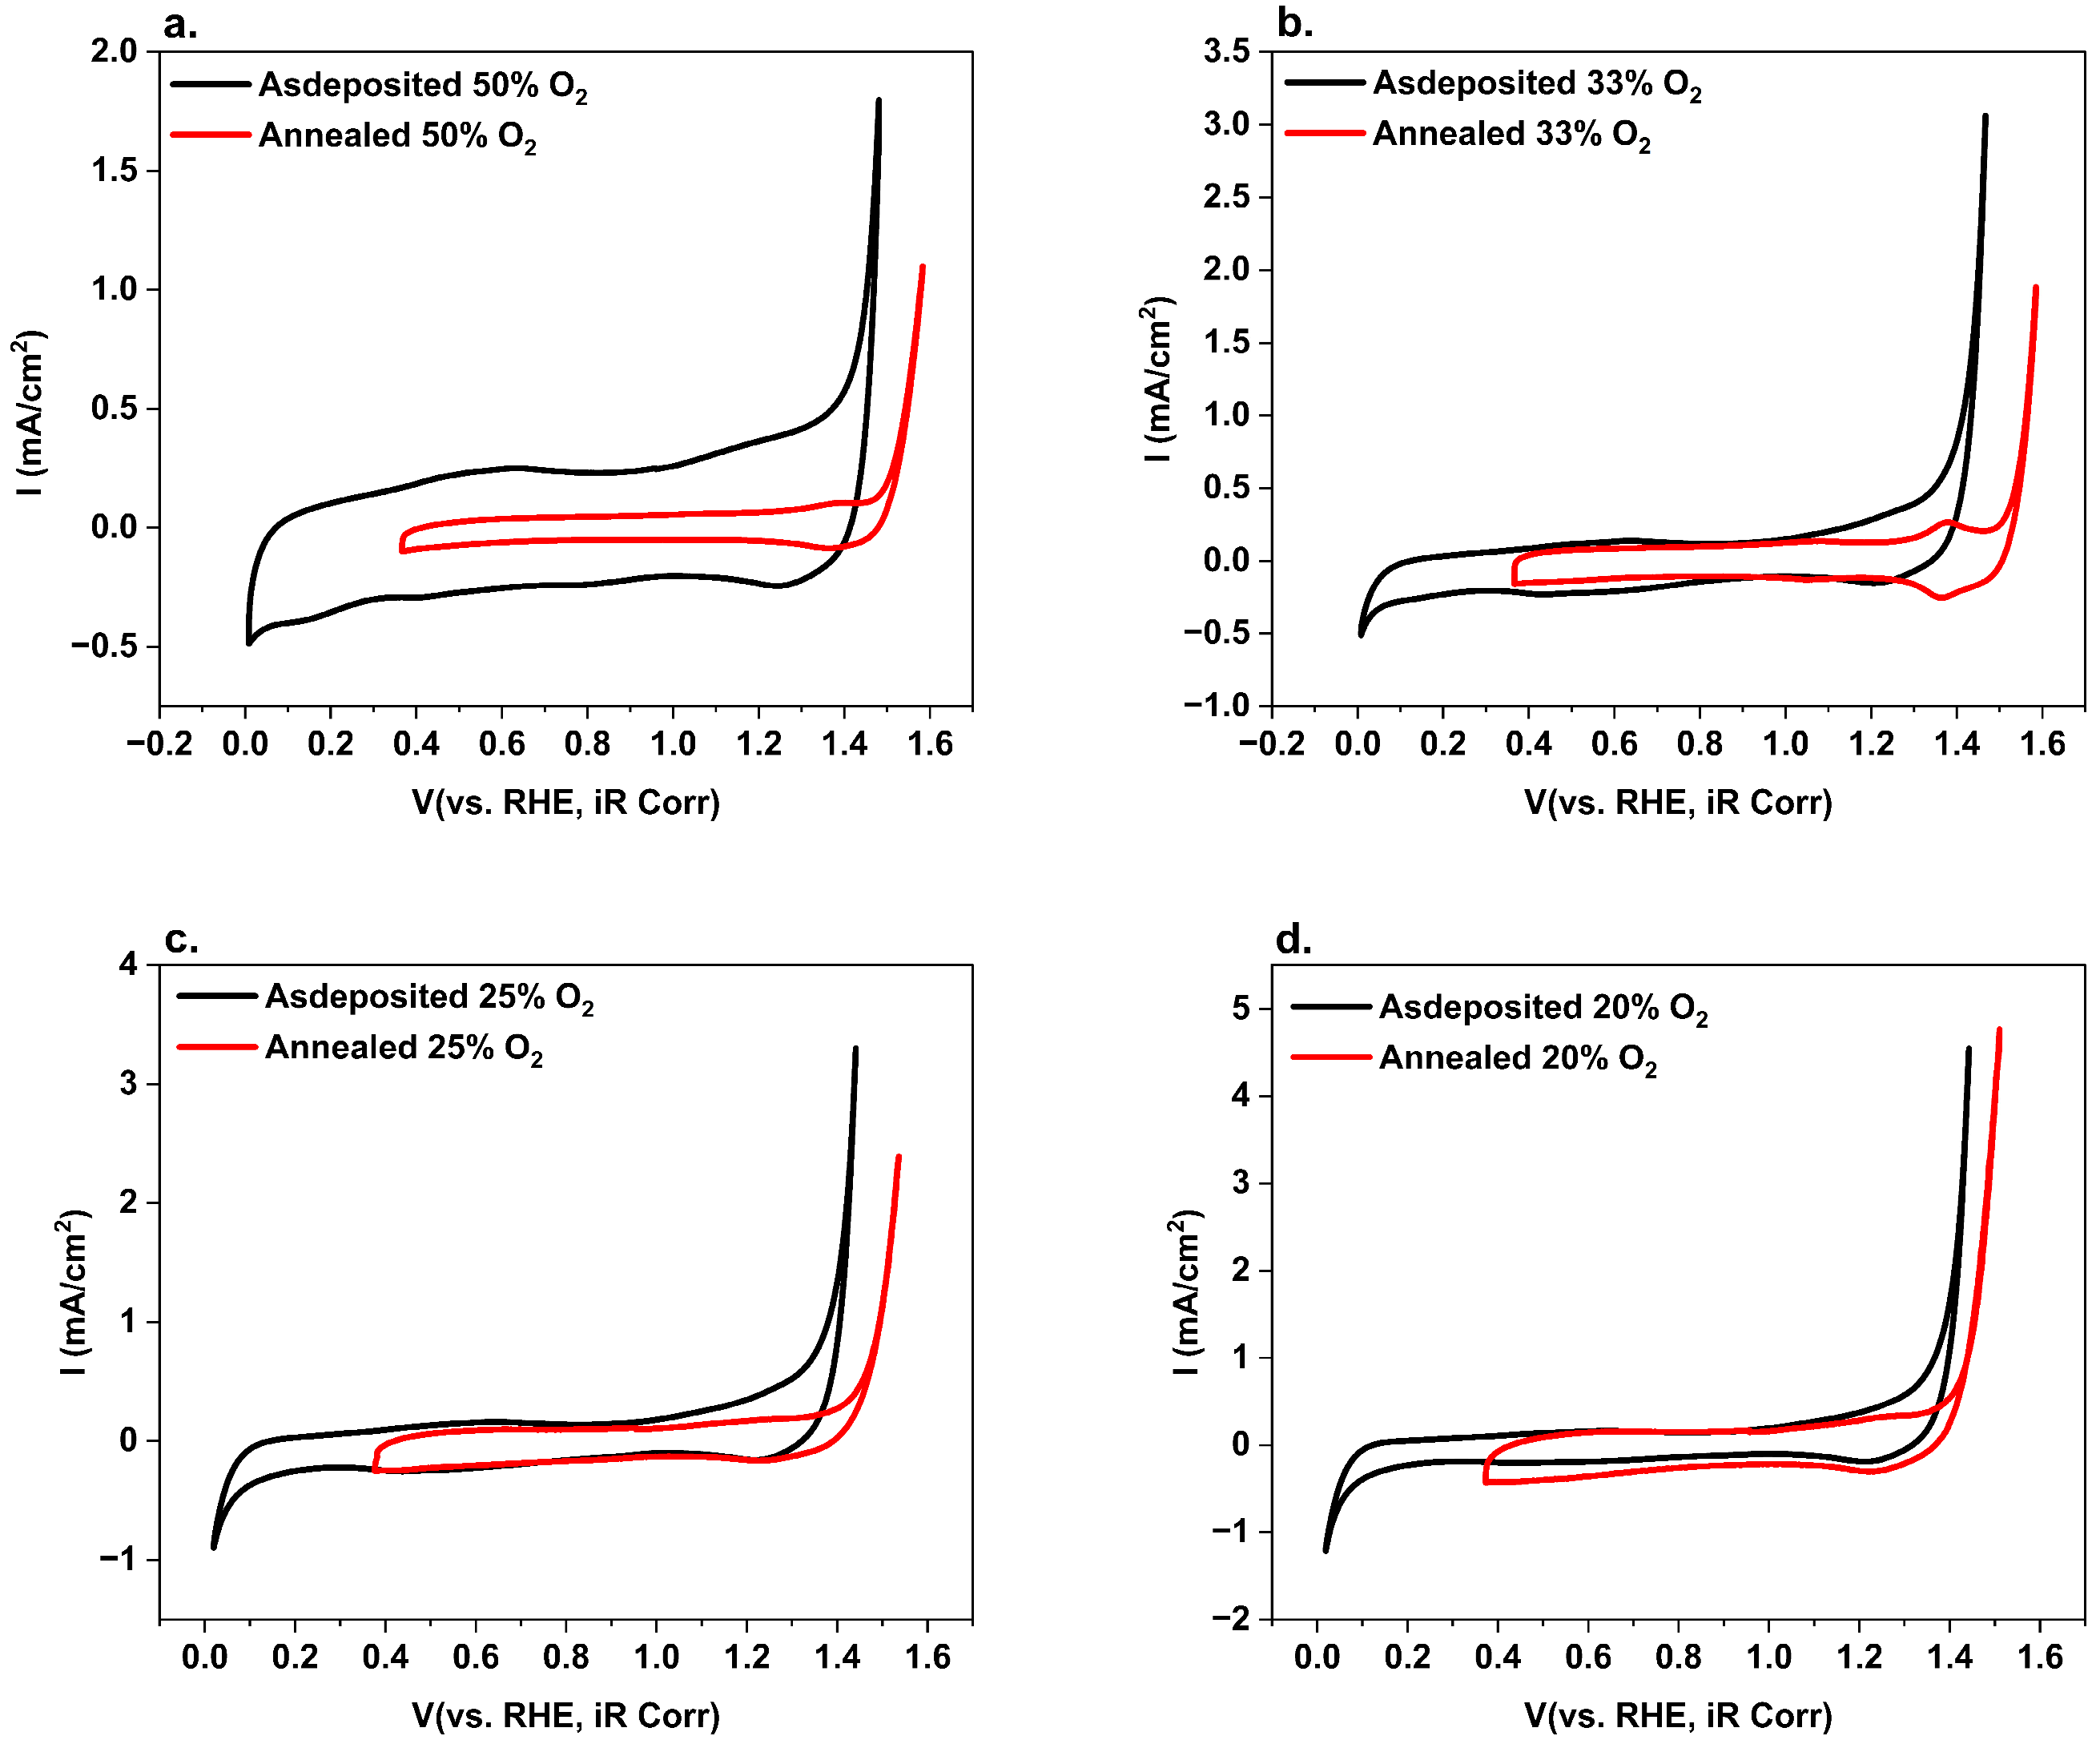
| Samples (Ar:O2) | Onset Potential at Current Density of 0.5 mA/cm2 | |
|---|---|---|
| As-Deposited RuO2 (V vs. RHE) | Annealed RuO2 400 °C (V vs. RHE) | |
| S50 (1:1) | 1.37 | 1.54 |
| S33 (2:1) | 1.33 | 1.53 |
| S25 (3:1) | 1.28 | 1.45 |
| S20 (4:1) | 1.25 | 1.39 |
Disclaimer/Publisher’s Note: The statements, opinions and data contained in all publications are solely those of the individual author(s) and contributor(s) and not of MDPI and/or the editor(s). MDPI and/or the editor(s) disclaim responsibility for any injury to people or property resulting from any ideas, methods, instructions or products referred to in the content. |
© 2025 by the authors. Licensee MDPI, Basel, Switzerland. This article is an open access article distributed under the terms and conditions of the Creative Commons Attribution (CC BY) license (https://creativecommons.org/licenses/by/4.0/).
Share and Cite
Nalawade, S.; Vondee, E.; Liu, M.; Chris-Okoro, I.; Cherono, S.; Kumar, D.; Aravamudhan, S. Role of Oxygen Concentration in Reactive Sputtering of RuO2 Thin Films: Tuning Surface Chemistry for Enhanced Electrocatalytic Performance. Crystals 2025, 15, 417. https://doi.org/10.3390/cryst15050417
Nalawade S, Vondee E, Liu M, Chris-Okoro I, Cherono S, Kumar D, Aravamudhan S. Role of Oxygen Concentration in Reactive Sputtering of RuO2 Thin Films: Tuning Surface Chemistry for Enhanced Electrocatalytic Performance. Crystals. 2025; 15(5):417. https://doi.org/10.3390/cryst15050417
Chicago/Turabian StyleNalawade, Swapnil, Ebenezer Vondee, Mengxin Liu, Ikenna Chris-Okoro, Sheilah Cherono, Dhananjay Kumar, and Shyam Aravamudhan. 2025. "Role of Oxygen Concentration in Reactive Sputtering of RuO2 Thin Films: Tuning Surface Chemistry for Enhanced Electrocatalytic Performance" Crystals 15, no. 5: 417. https://doi.org/10.3390/cryst15050417
APA StyleNalawade, S., Vondee, E., Liu, M., Chris-Okoro, I., Cherono, S., Kumar, D., & Aravamudhan, S. (2025). Role of Oxygen Concentration in Reactive Sputtering of RuO2 Thin Films: Tuning Surface Chemistry for Enhanced Electrocatalytic Performance. Crystals, 15(5), 417. https://doi.org/10.3390/cryst15050417