Article

Thermocapillary Flow in Fluid Smectic Bubbles in Microgravity

Department of Physics and Soft Materials Research Center, University of Colorado, Boulder, CO 80309, USA
*
Author to whom correspondence should be addressed.
Crystals 2025, 15(5), 416; https://doi.org/10.3390/cryst15050416
Submission received: 10 March 2025 / Revised: 21 April 2025 / Accepted: 24 April 2025 / Published: 29 April 2025
(This article belongs to the Section Liquid Crystals)

Abstract

:
Interfaces between two fluids exhibit an excess free-energy cost per unit area that is manifested as surface tension. This equilibrium property generally depends on temperature, which enables the phenomenon of thermocapillary flow, wherein application of a temperature gradient having a component parallel to the surface generates a net in-plane effective body force on the fluid and thereby causes flow. Here, we study the thermocapillary flow in fluid smectic liquid crystal films freely suspended in air and stabilized in thickness by the smectic layering. If such films are a single layer (~3 nm) or a few layers thick, they have the largest surface to volume ratio of any fluid preparation, making them particularly interesting in the context of thermocapillary flow, which is two-dimensional (2D) in the film plane. Five-layer thick films in the form of spherical bubbles were subjected to a north–south temperature gradient field along a polar axis, with flow fields mapped using inclusions on the film surface as tracers, where the inclusions were “islands”, small circular stacks of extra layers. These experiments were carried out on the International Space Station to avoid interference from thermal convention of the air. The flow field as a function of latitude on the bubble can be successfully modeled using Navier–Stokes hydrodynamics, modified to include permeative flow out of the background fluid into the islands.

1. Introduction

Smectic liquid crystal (LC) films drawn across small, planar openings or in the form of gas-filled bubbles are the thinnest free-standing fluid preparations known [1]. These films provide a convenient experimental platform for exploring the fundamental physics of two-dimensional (2D) fluids [2], enabling studies of the effects of reduced dimensionality on phase behavior, orientational and positional ordering, interfacial phenomena, and hydrodynamics [3,4,5,6,7,8,9,10,11]. Smectic films are quantized in thickness, with some as thin as one or two smectic layers (the thickness of a smectic layer is approximately the molecular length, typically around 3 nm), and are usually many square mm in area, so that their surface-to-volume ratio is very high. In the case of tethered bubbles, discussed here, the length of the perimeter is much less than that of flat films [12,13], greatly reducing the effects of the film boundaries.
Marangoni effects in fluids, first reported by Thomson [14] and described theoretically by Marangoni [15], have been widely investigated (see, for example, [16,17]) and there have been a few studies of thermocapillarity in liquid crystals [18,19,20]. Thermocapillary effects are generally challenging to characterize on Earth but are easier to measure and interpret in the absence of gravitational effects such as sedimentation and convection driven by density gradients. The microgravity environment is particularly conducive to studies of freely-suspended LC films, since these films are extremely sensitive to the effects of such convection either in the film or in the surrounding air [21,22,23].

2. Results

All images and videos reported here were obtained in experiments on smectic bubbles in microgravity performed on the International Space Station in the framework of the NASA OASIS project [24,25]. Bubbles tethered to a thin, hollow needle were inflated with air to a nominal diameter of 15 mm in a uniformly thermostated bubble chamber and their response to changes in pressure, temperature, electric field, and mechanical shearing were studied using reflected video microscopy [25]. The Marangoni experiments were carried out using heating elements and temperature sensors attached (1) to the needle used for inflating and then tethering the bubble (at the “bottom”) and (2) to air injection needles located near the opposite (“top”) surface of the bubble, enabling longitudinal temperature gradients along the bubble surface to be imposed, as described previously in [23]. In this paper, we discuss in detail these experimental observations and their interpretation when the tethering needle on the bottom was heated. The LC material used in these experiments was a smectic A mixture (8CB + Displaytech MX 12160 [26]) with phase sequence Isotropic 56 °C Nematic 54 °C SmA 5 °C Crystal.
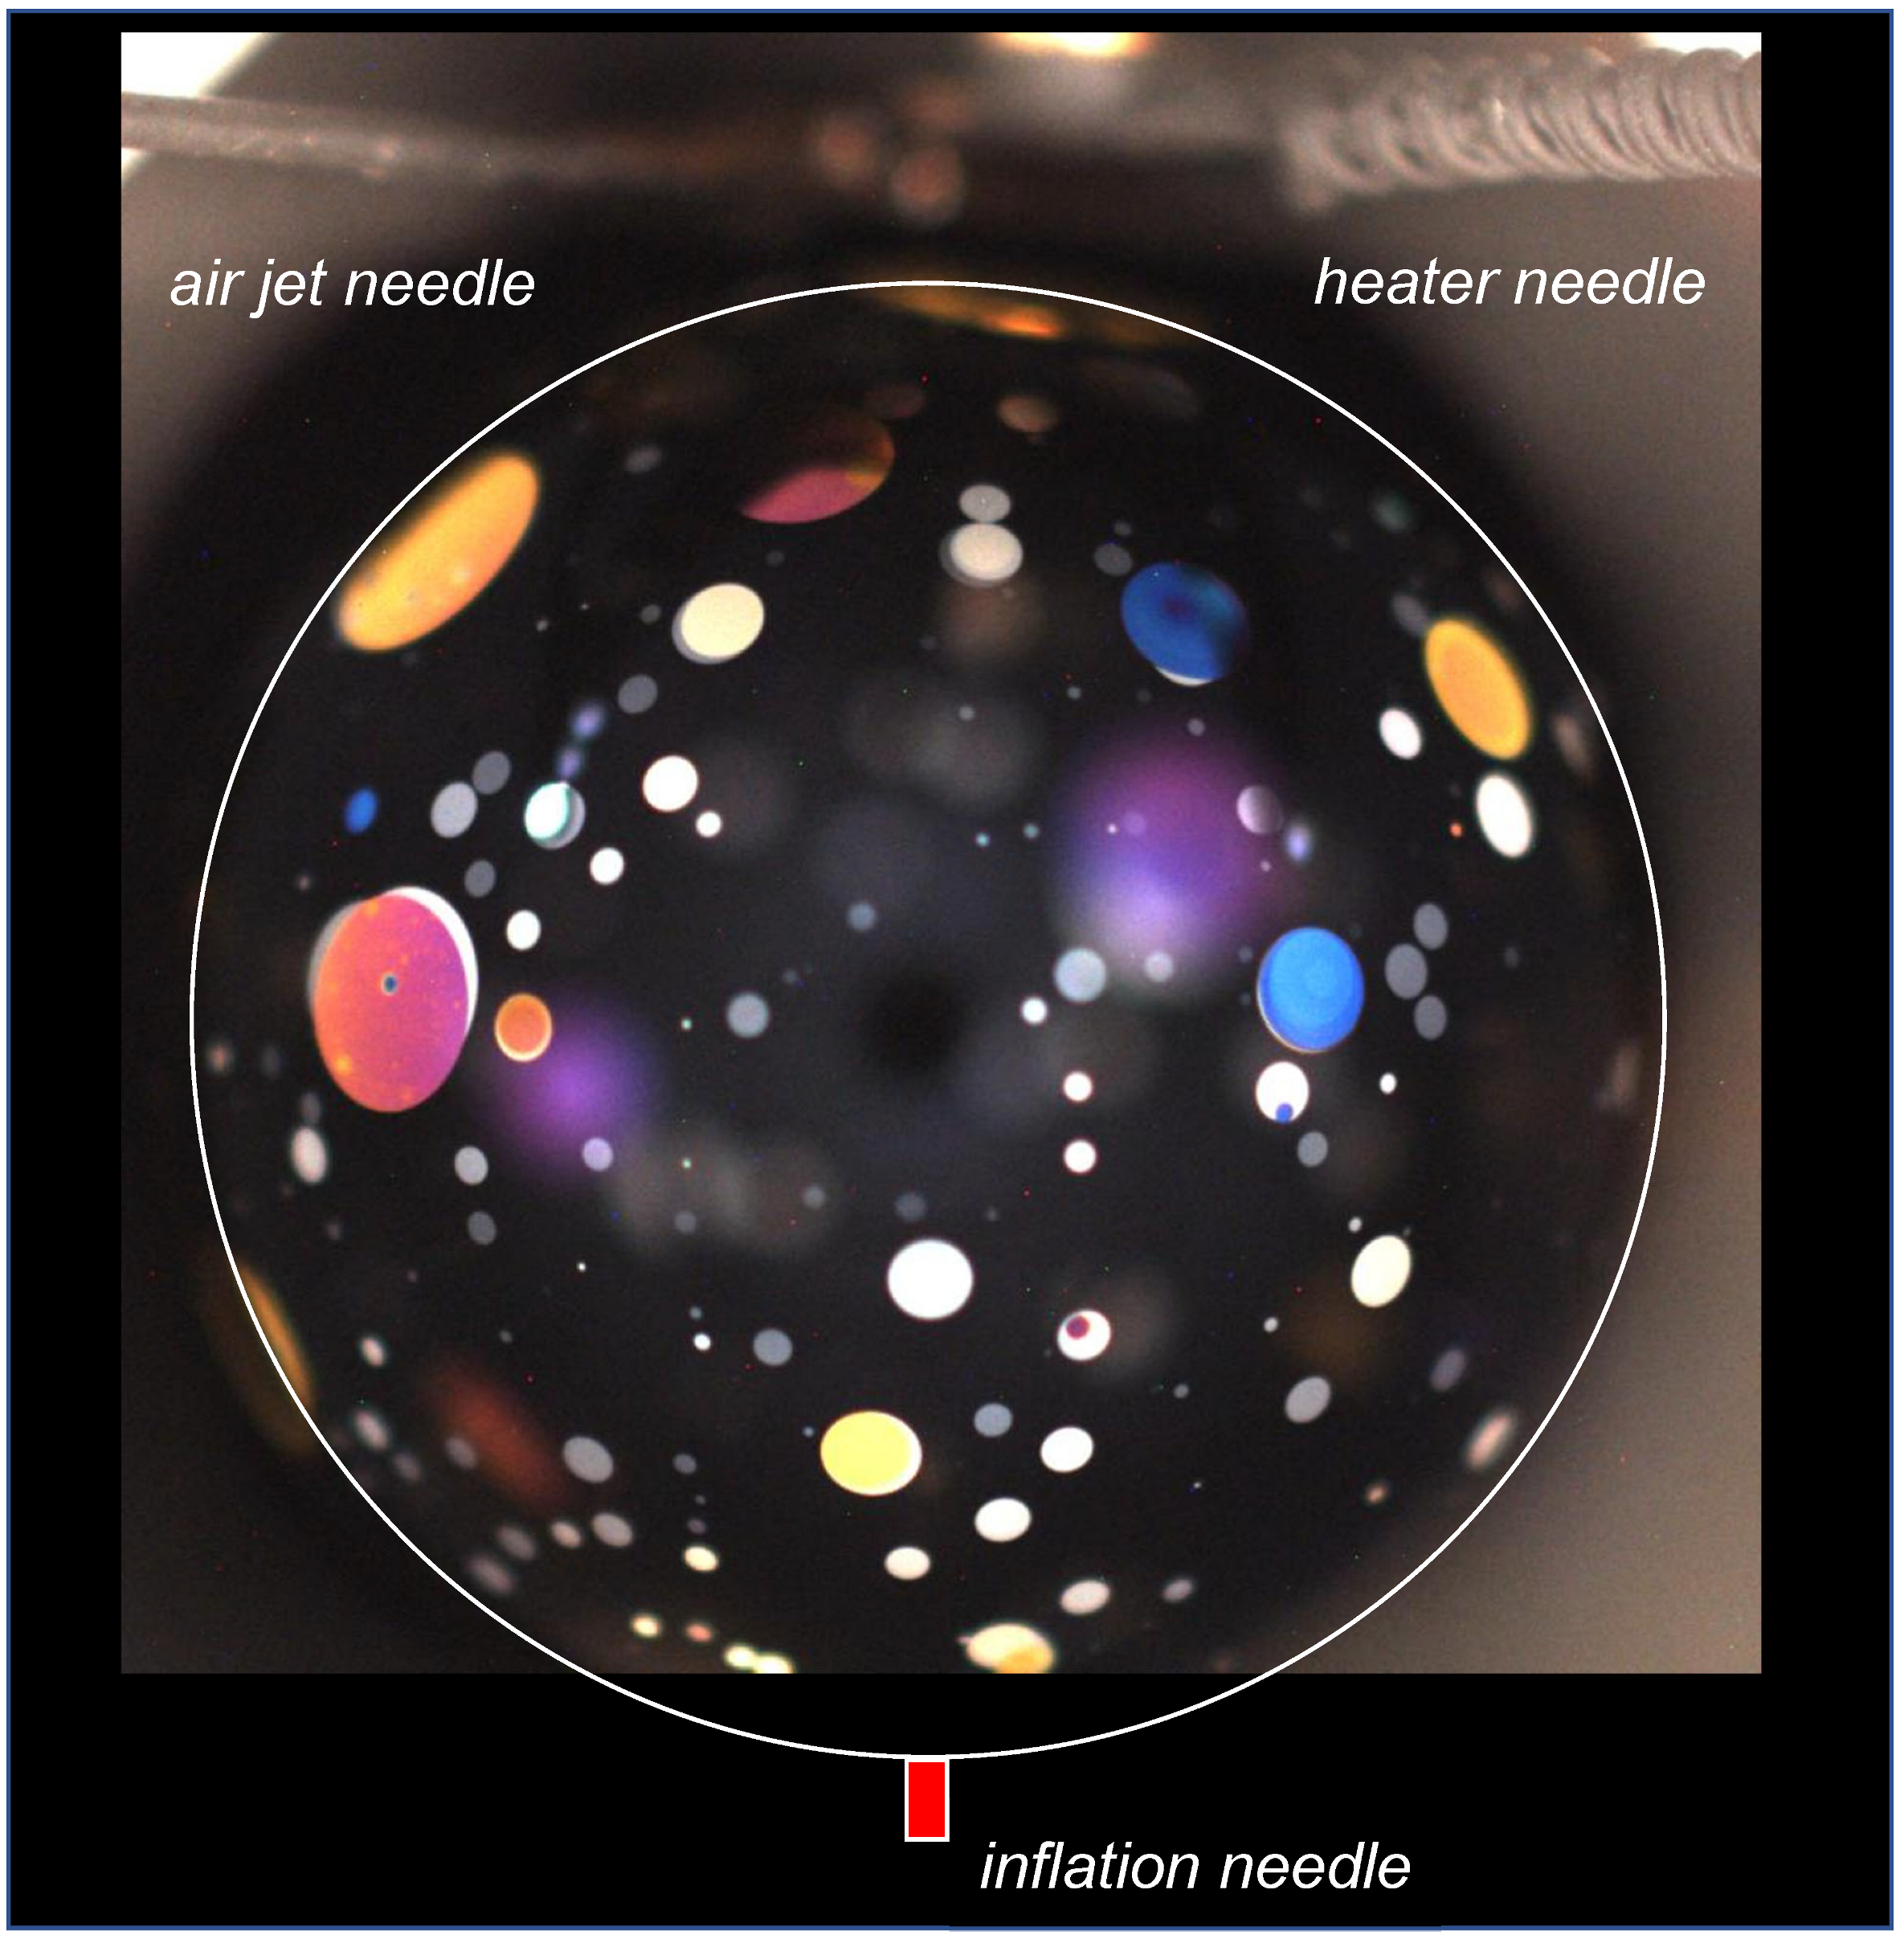
In the Marangoni experiments described here, a bubble of uniform thickness h ≈ 14 nm, corresponding to five smectic layers, was inflated to a radius of R = 7.8 mm and then decorated with thicker islands with a range of radii r on the order of 100 µm, created by inducing rapid circulation of the bubble film using air jets tangent to the top of the bubble to cause shear in the film [27]. An example of the creation of an island emulsion is shown in Supplementary Video S1. The islands have different thicknesses, ranging from 5 to 20 smectic layers, and adopt circular shapes in order to minimize the surface energy (σ~2 × 10⁻³ J/m2) of their edges [28,29,30]. The internal in-plane pressure in an island layer is the ambient pressure (PA~1 atm) plus the Laplace pressure (σ/r~10−3 atm) due to the curvature of the island edge, which is typically much smaller than ambient pressure. A typical image of a bubble with islands in the OASIS bubble chamber on the ISS is shown in Figure 1. Experimental images using light reflected from the illuminated front hemisphere of the bubble were recorded using a video camera. The islands exhibit reflection colors arising from thin film interference, while the ultrathin background film looks black. The ghostly blobs of light seen in the images are out-of-focus islands on the back of the bubble.
The smectic bubble itself is an excellent detector of airflow in the chamber and the bubble film is continually in motion in a 1 g environment. In microgravity, there is no buoyancy-driven thermal convection either of the air in the chamber or of the LC forming the bubble. Apart from thermal Brownian motion, when equilibrated at a given chamber temperature, the bubble surfaces are stationary, even in the presence of small, unavoidable temperature gradients in the bubble chamber arising, for example, from the illumination LEDs. The absence of observable flow patterns confirms that in microgravity, the bubble film, except for being surrounded by stationary air, is an ideal medium for studying the thermocapillarity of ultrathin fluid films.
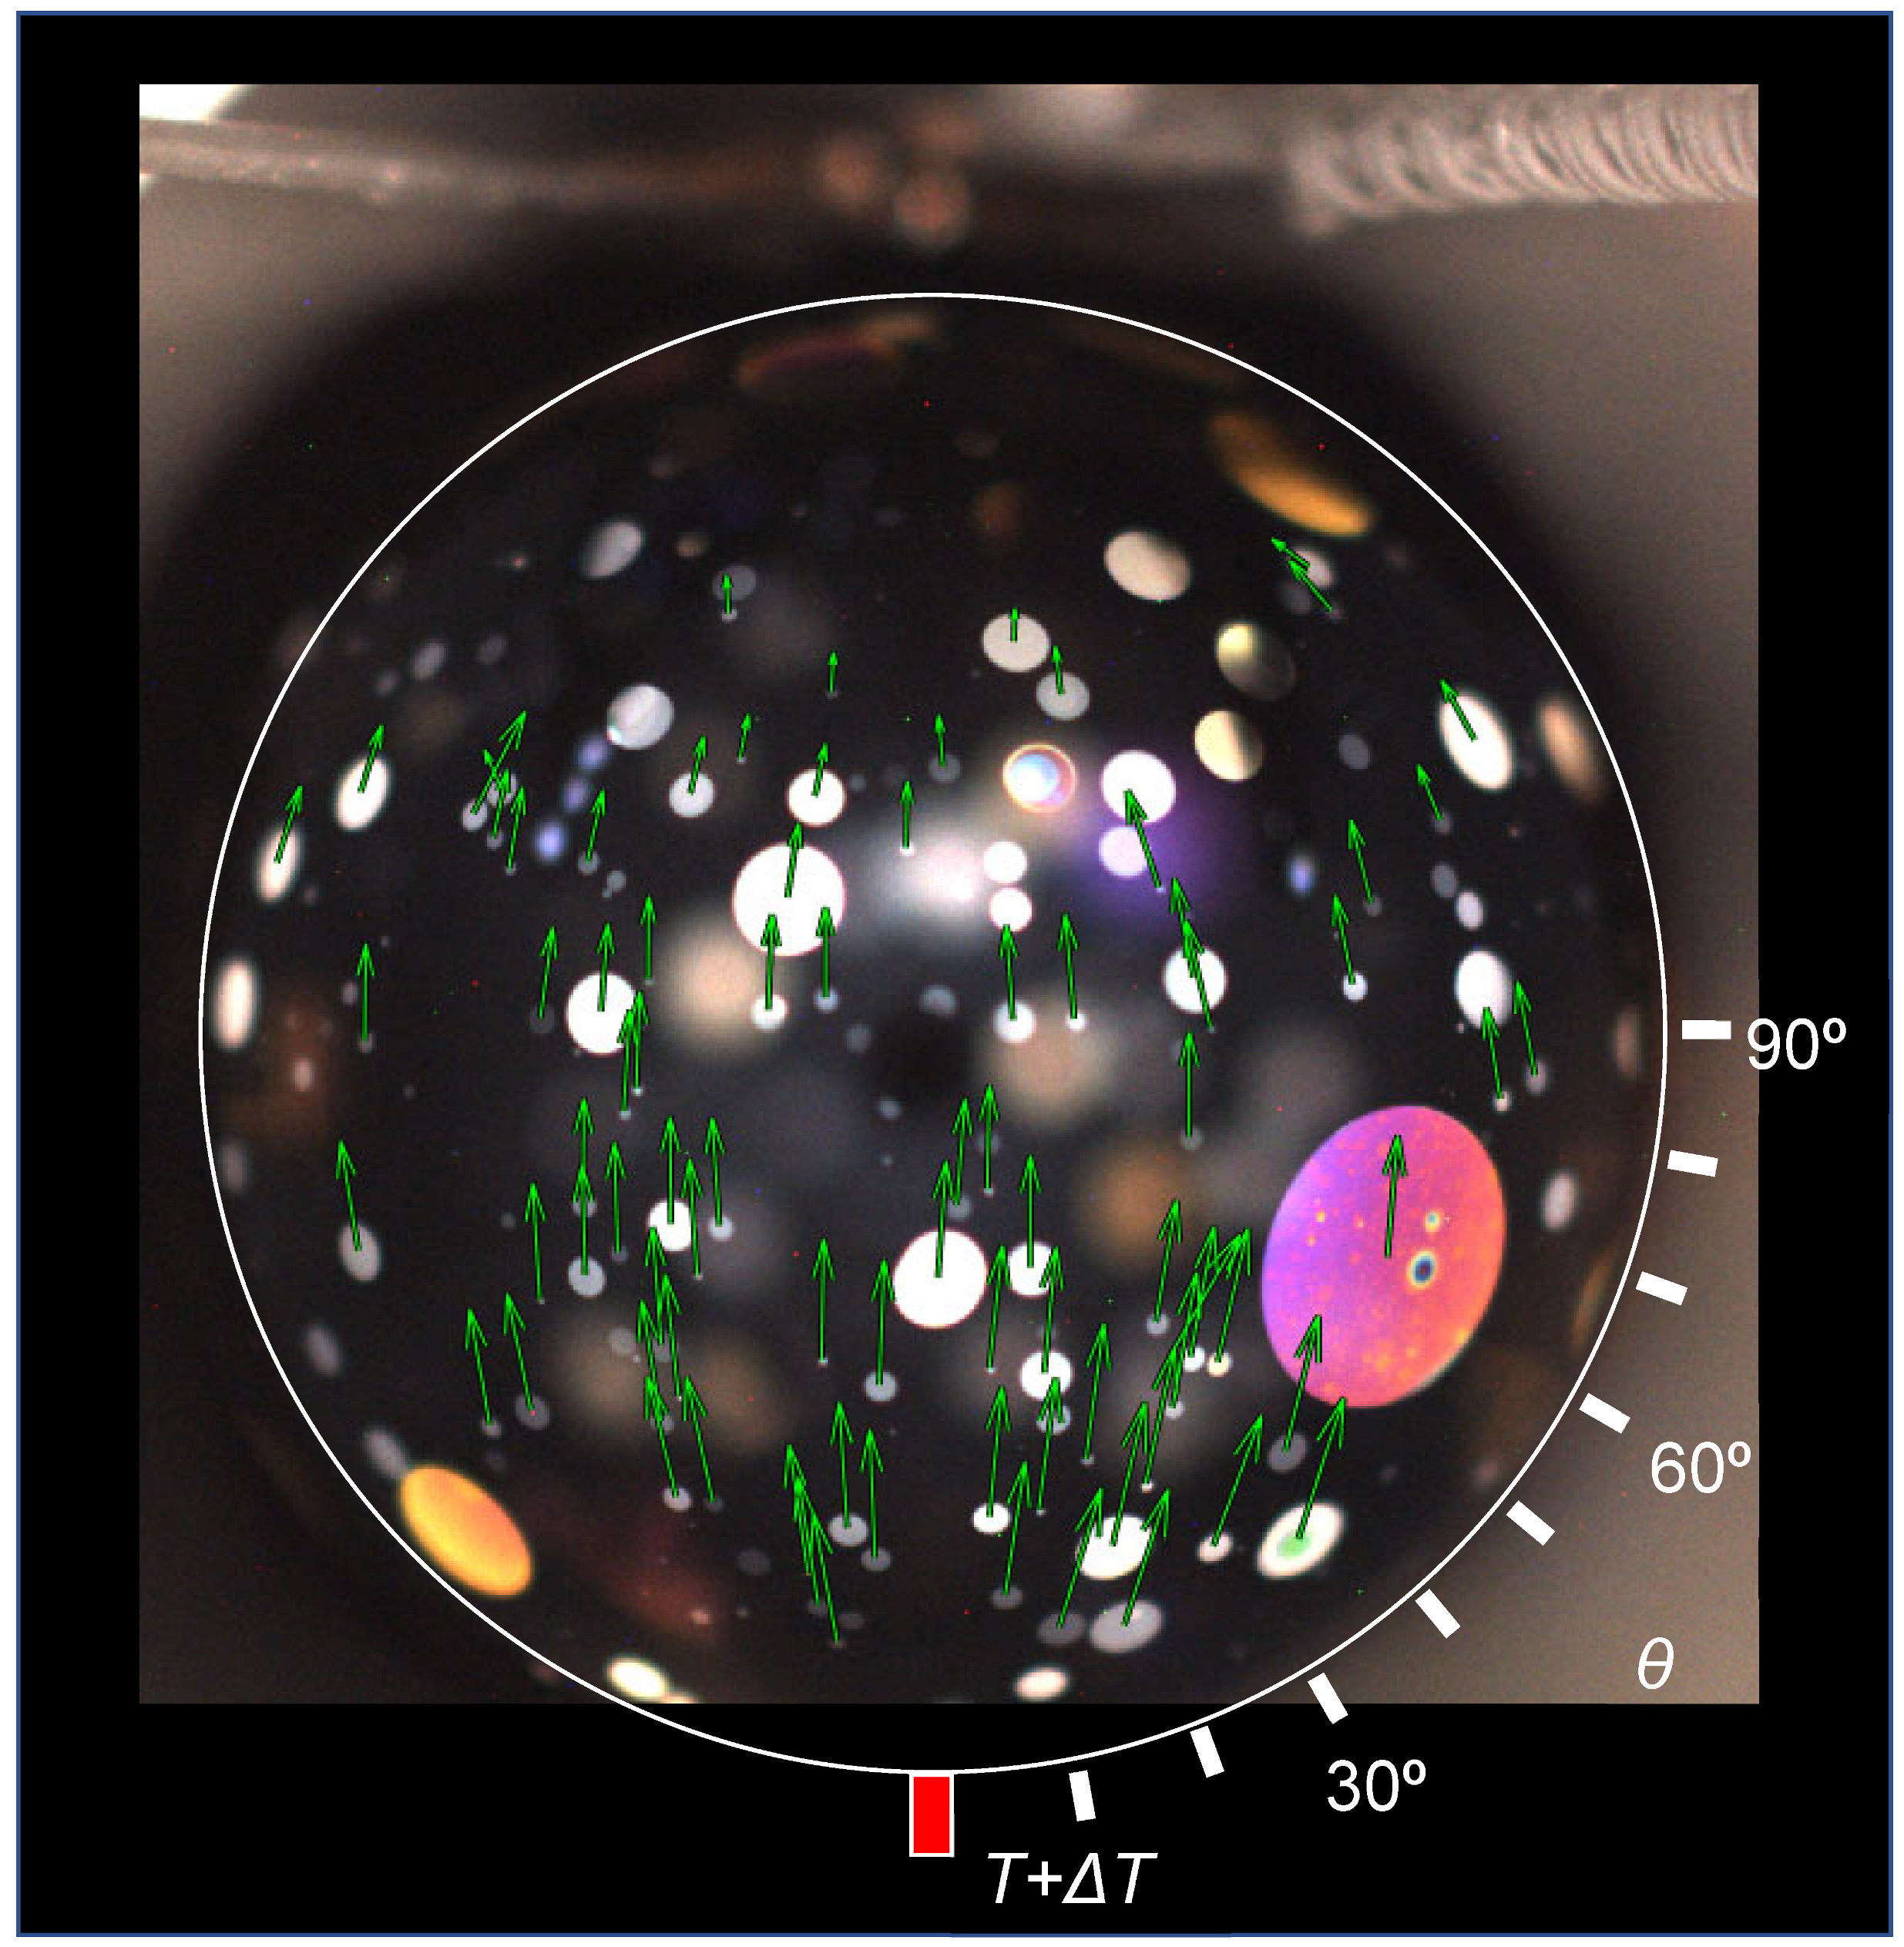
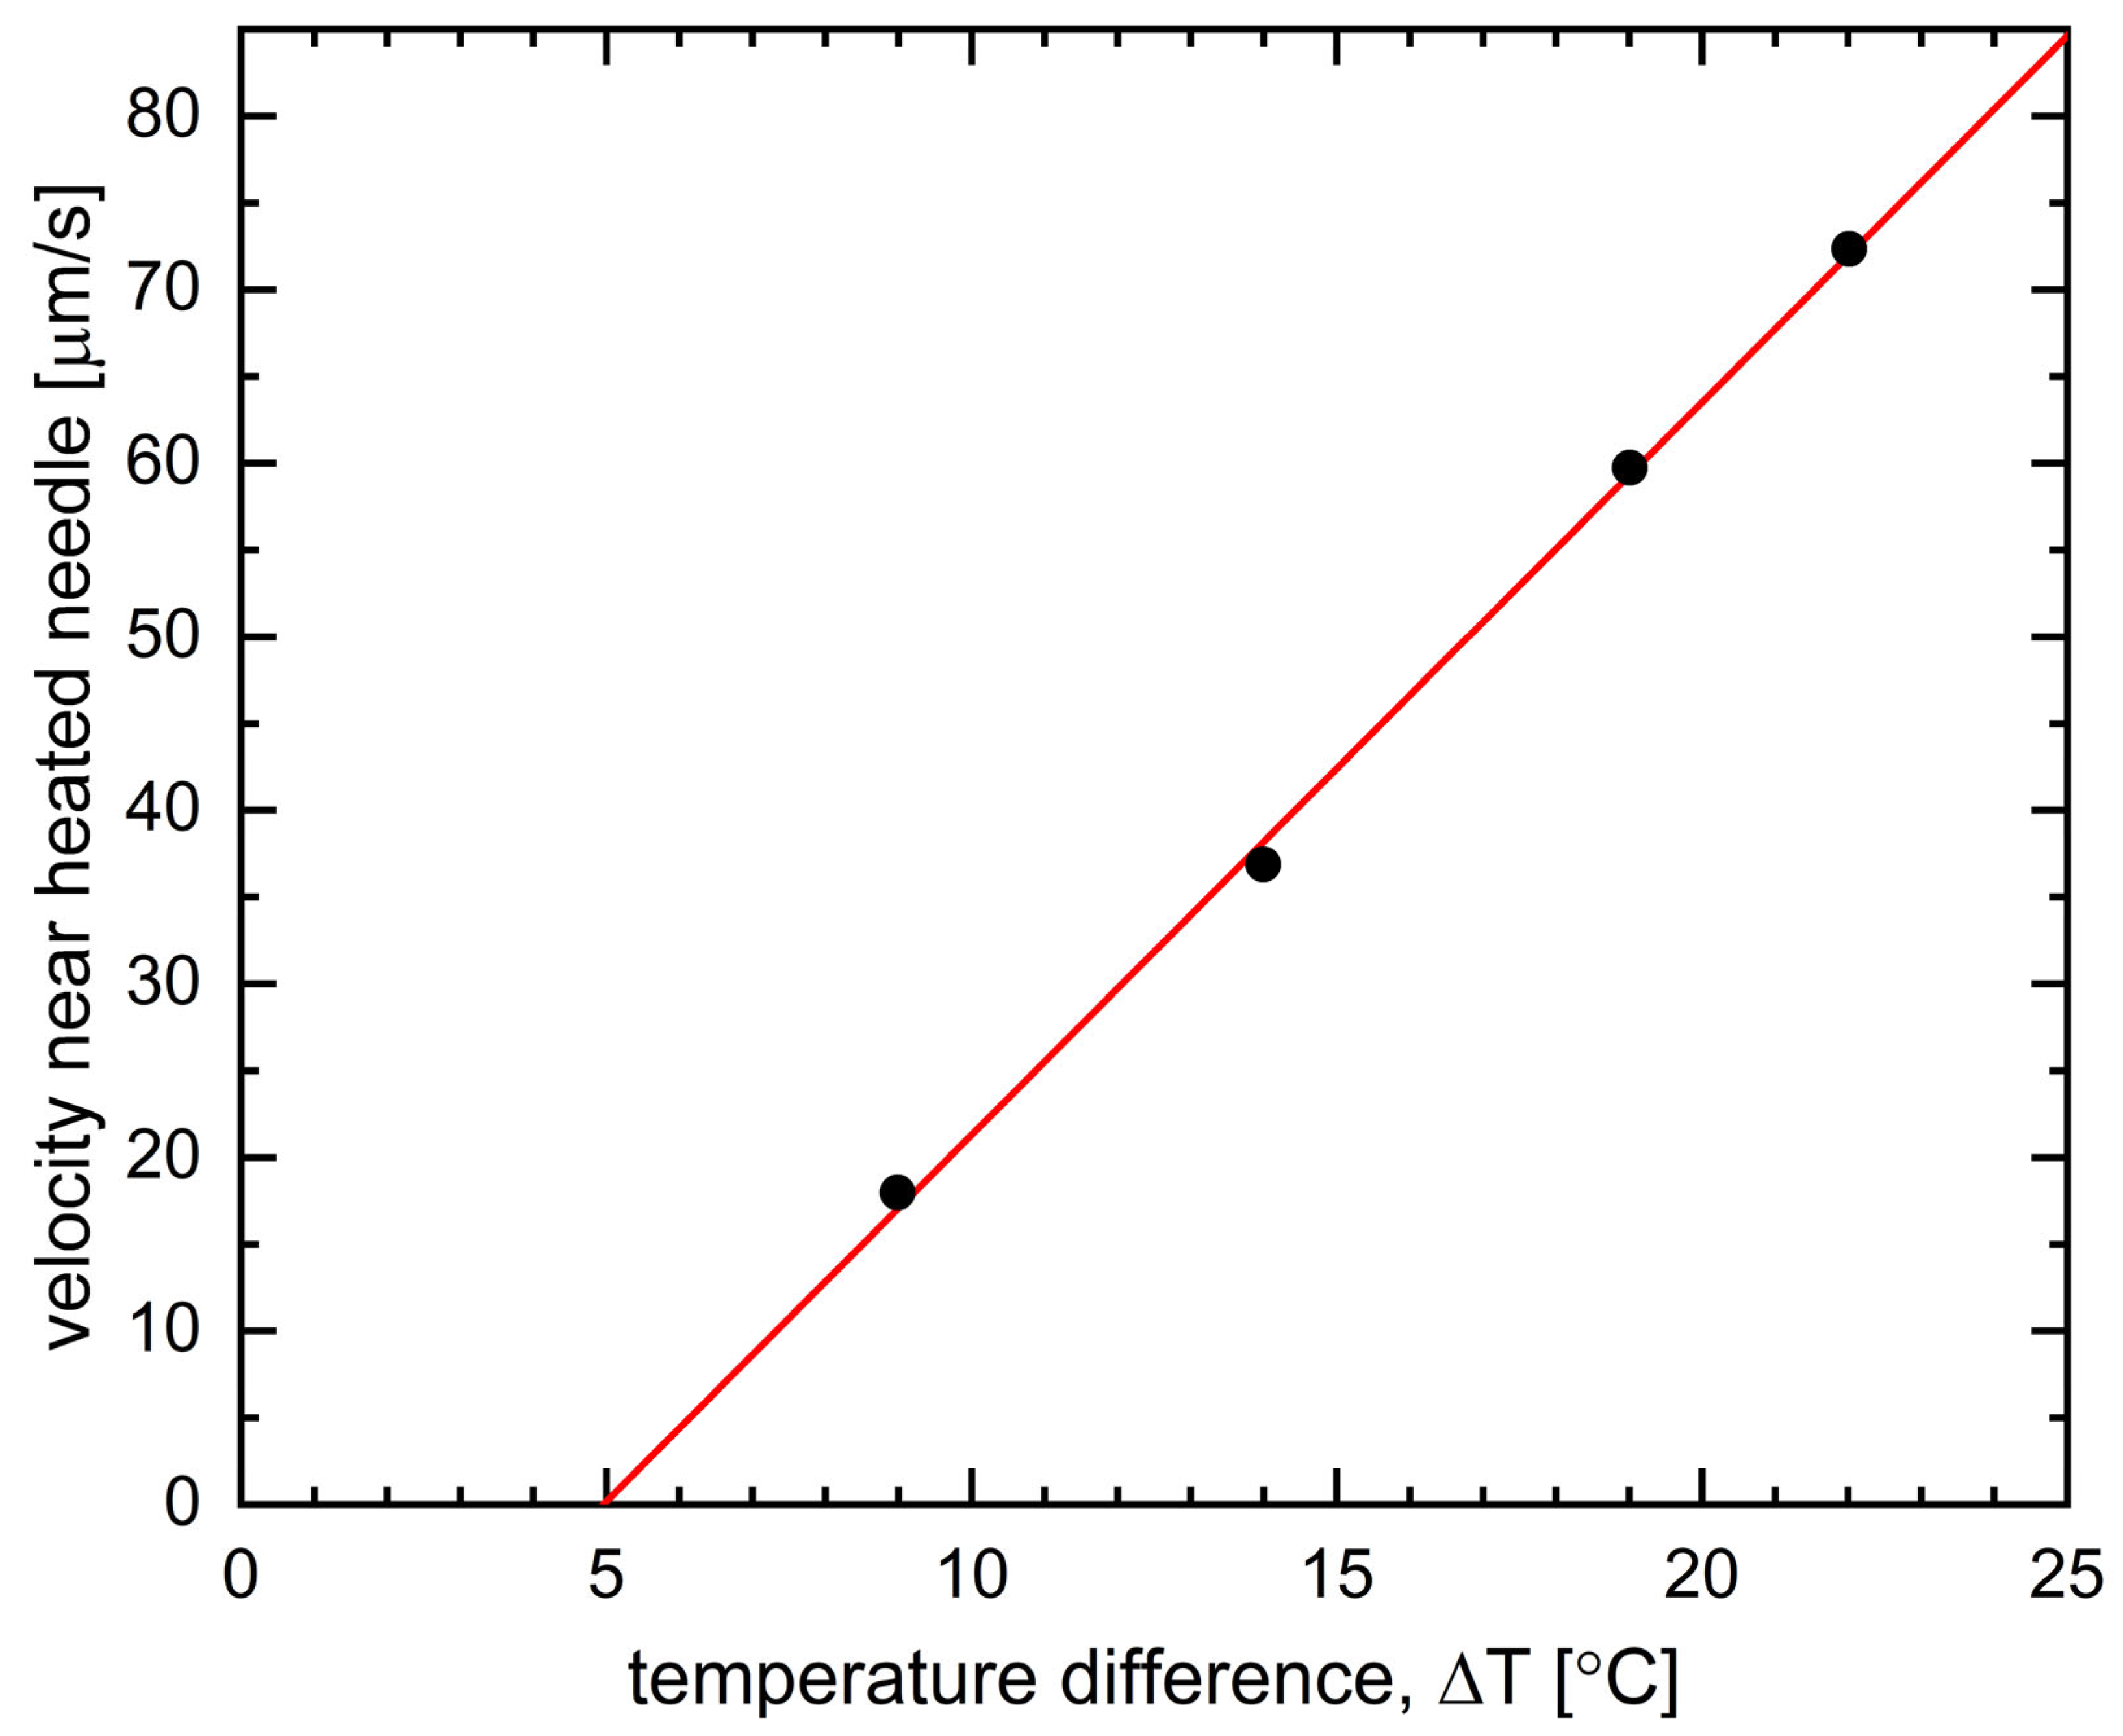
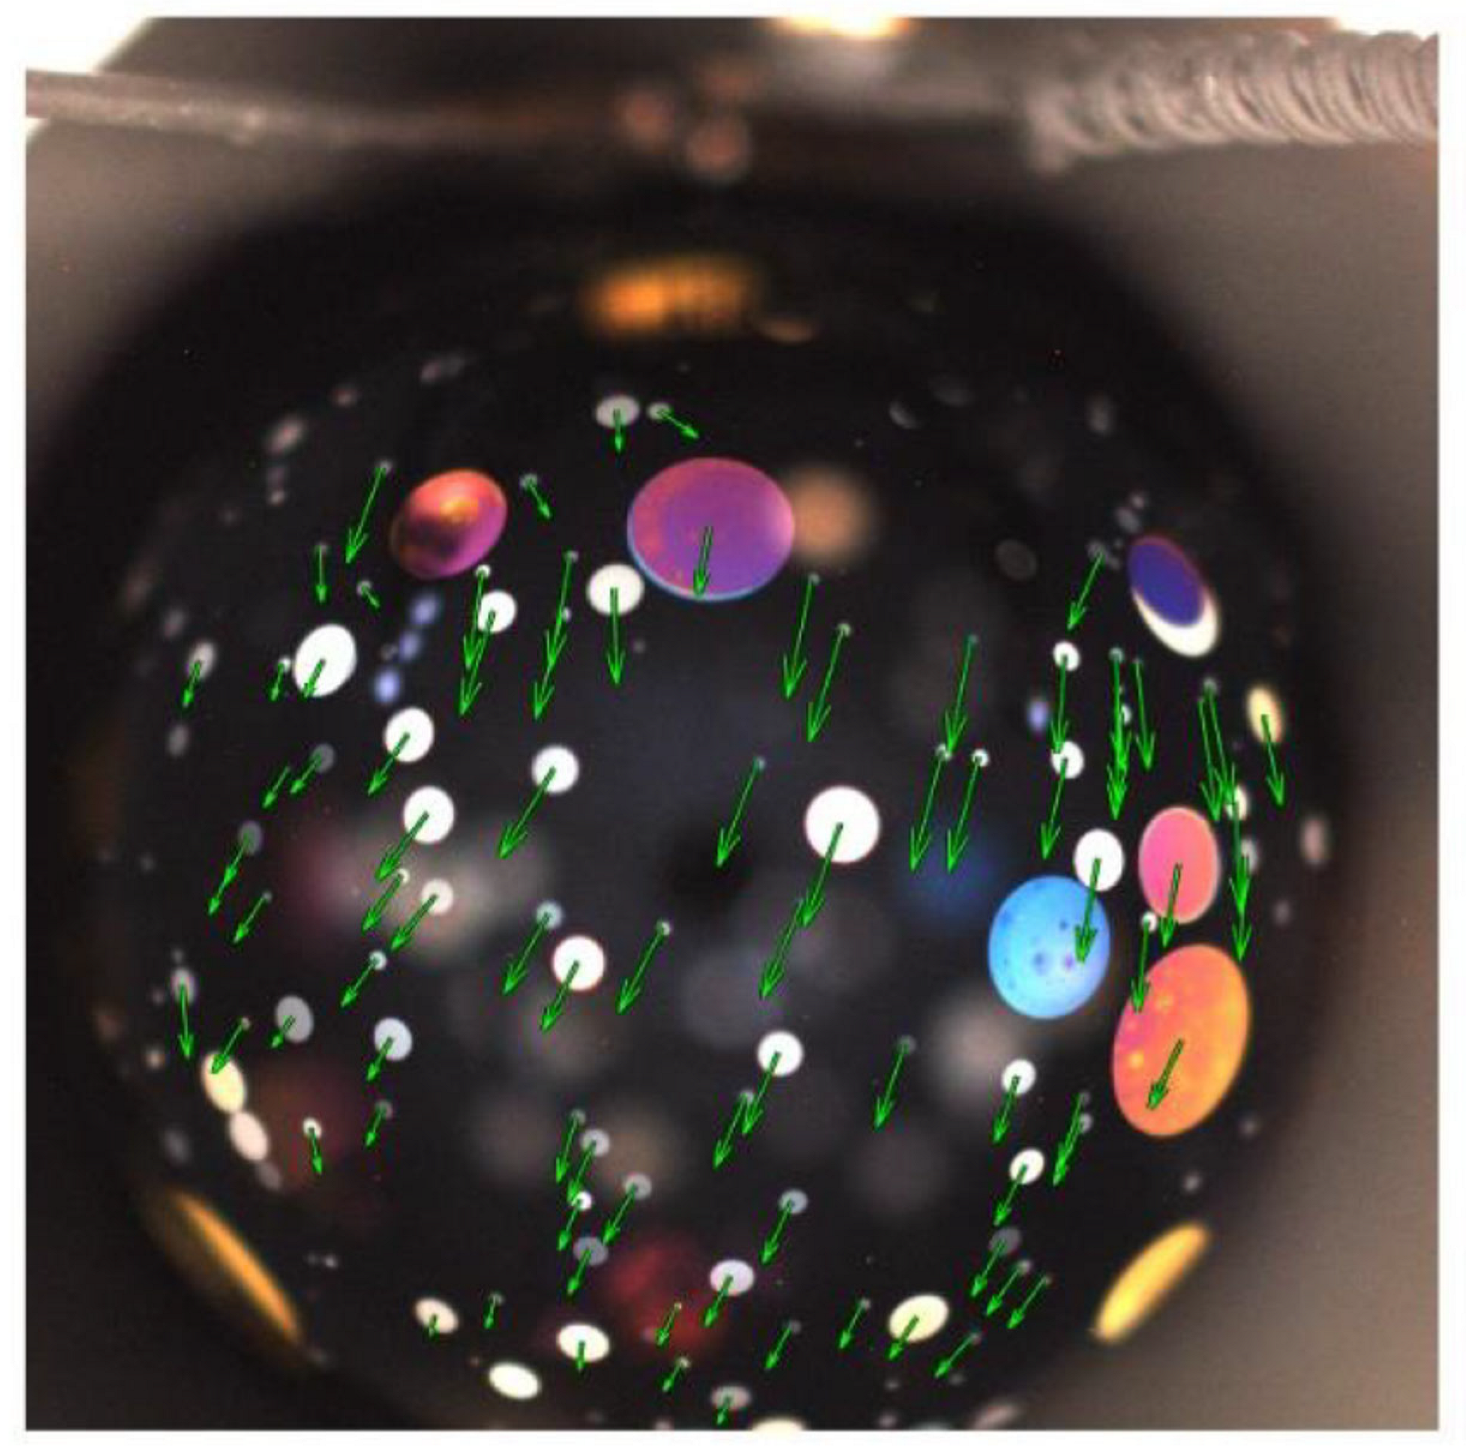
When the tethering needle at the bottom of the bubble is heated above ambient, as shown in Figure 2, this induces a temperature gradient along the bubble and results in upward motion of the LC material in the film, away from the heated needle, as observed by the motion of the embedded islands. A typical flow event induced by needle heating is shown in Supplementary Video S2. The island motion can be determined using tracking software, as illustrated in Figure 2. The islands, which are coupled to the background film by Stokes drag, exhibit Brownian motion over long time intervals [3] and in 1 g would sediment to the bottom of the film over the course of a few minutes, as seen in Supplementary Video S1. In microgravity, however, the islands essentially just move with the film and its surrounding air and thus can serve as displacement tracers when the film starts moving. The Brownian motion is negligible. After the heat is first switched on, there is a ten to twenty second interval in which the film remains motionless. Once the LC starts to flow, a steady-state island velocity is achieved within a few seconds. This velocity is approximately constant in the beginning, then decreases gradually as the air heats up in the chamber, reducing the temperature gradient between the bottom and top of the bubble. After some time, the upward motion of the islands causes them to jam in the upper part of the bubble. The initial island velocity as a function of temperature difference ΔT is plotted in Figure 3, showing an apparent threshold temperature difference ΔT = 5 °C required to induce motion, followed by a regime in which the initial velocity increases linearly with increasing ΔT.
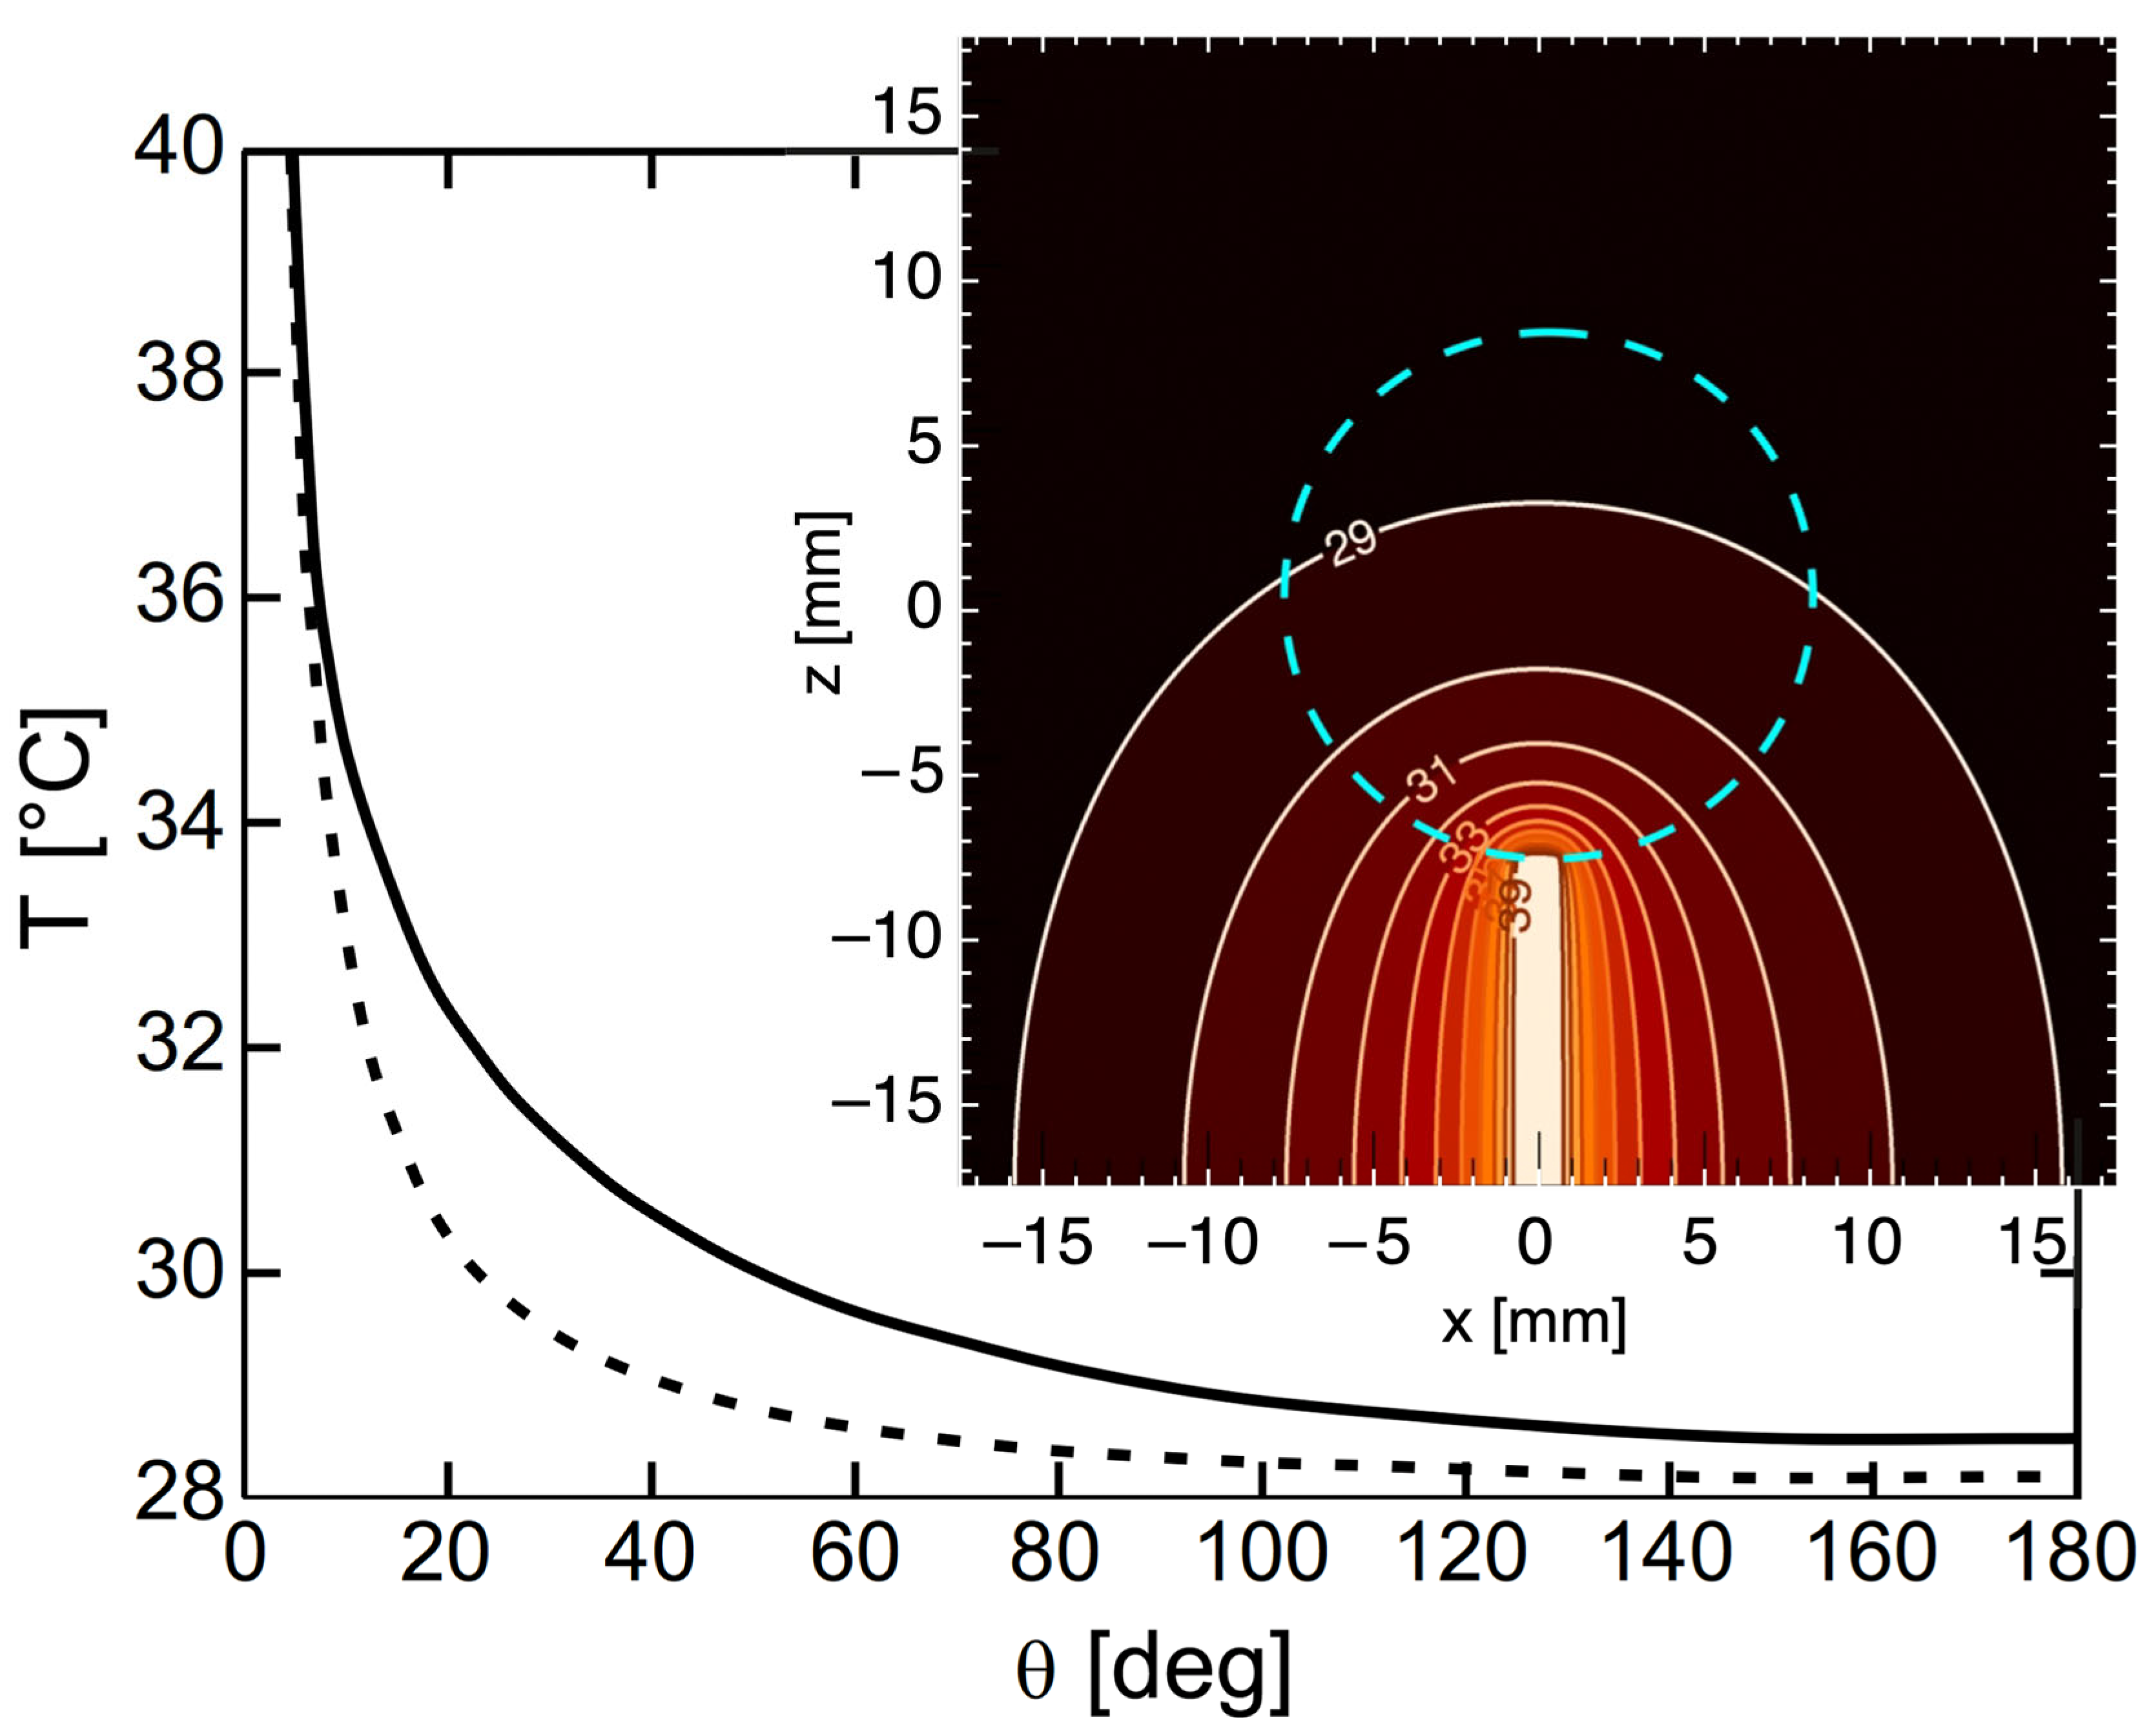
In these experiments, flow on the bubble induced motion of the adjacent air but there was no significant heat transport by air flow or in the few nanometer-thick smectic bubble membrane. The temperature gradient profile experienced by the bubble was established primarily by the heated needle and molecular diffusion-based thermal conduction in the air, as shown in Figure 4. Our operating hypothesis is that the observed motion on the bubble is driven by a gradient in the surface tension of the bubble σ(T) resulting from the temperature gradient, with the outward flow of LC from the tethering needle indicating that the surface tension gradient, Σ ≡ dσ/dT, is negative.
We focus here on the velocity field V(r) describing flow of the film, an example of which is shown in Figure 2 for ΔT = 12 °C and t = 2 s after flow begins. Once established, the flow is essentially radial out of the meniscus around the needle, with a velocity that decreases with increasing distance from the needle along the bubble surface. In order to analyze the temperature and flow fields, we define a polar coordinate system (z, θ, φ) with the z-axis colinear with the needle axis and the polar angle θ = 0 at the bottom of the bubble, as indicated in Figure 2. The principal induced flow appears to be along lines of constant longitude φ, so we measure the dependence of the longitudinal velocity component Vθ on latitude θ. In the ensuing analysis we take Vr = Vφ = 0 and assume that Vθ depends only on θ.
A key feature of this experiment is that the film thickness everywhere on the bubble is quantized, an integral multiple of the smectic layer thickness. The background (black) film thickness of inflated bubbles of this mixture was not measured on the ISS but was found consistently to be two layers thick in extensive ground-based experiments. This layer structure makes low-Reynolds number flow of the background film effectively incompressible in 2D, comparable in this regard to 3D flow in room temperature water, for example. Compressive stress in the background film can change the average film thickness, but only by the nucleation of and/or change in area of the islands. Changing the number of molecules in an island requires that LC molecules be transported out of the background film into adjacent layers in the island through the mechanism of Helfrich permeation [31], in which the increase of in-plane pressure in a given layer results in molecules hopping into adjacent layers, a process that is limited by the energetic barrier that confines the molecules to layers in the smectic phase. If the stresses inducing in-plane flow are sufficiently small, then the flow should be incompressible and, therefore, divergence free, with ∇∙V(θ) = ∂[Vθ(θ)sinθ]/∂θ = 0, a condition that is maintained on the bottom half of the bubble in Figure 2. The flow can then be expressed as:
Vθ(θ) = Vθ(90°)/sinθ,
where Vθ(90°) is the flow velocity at the bubble equator. The velocity field is thus parallel to lines of constant longitude, with a magnitude varying as 1/sin θ.
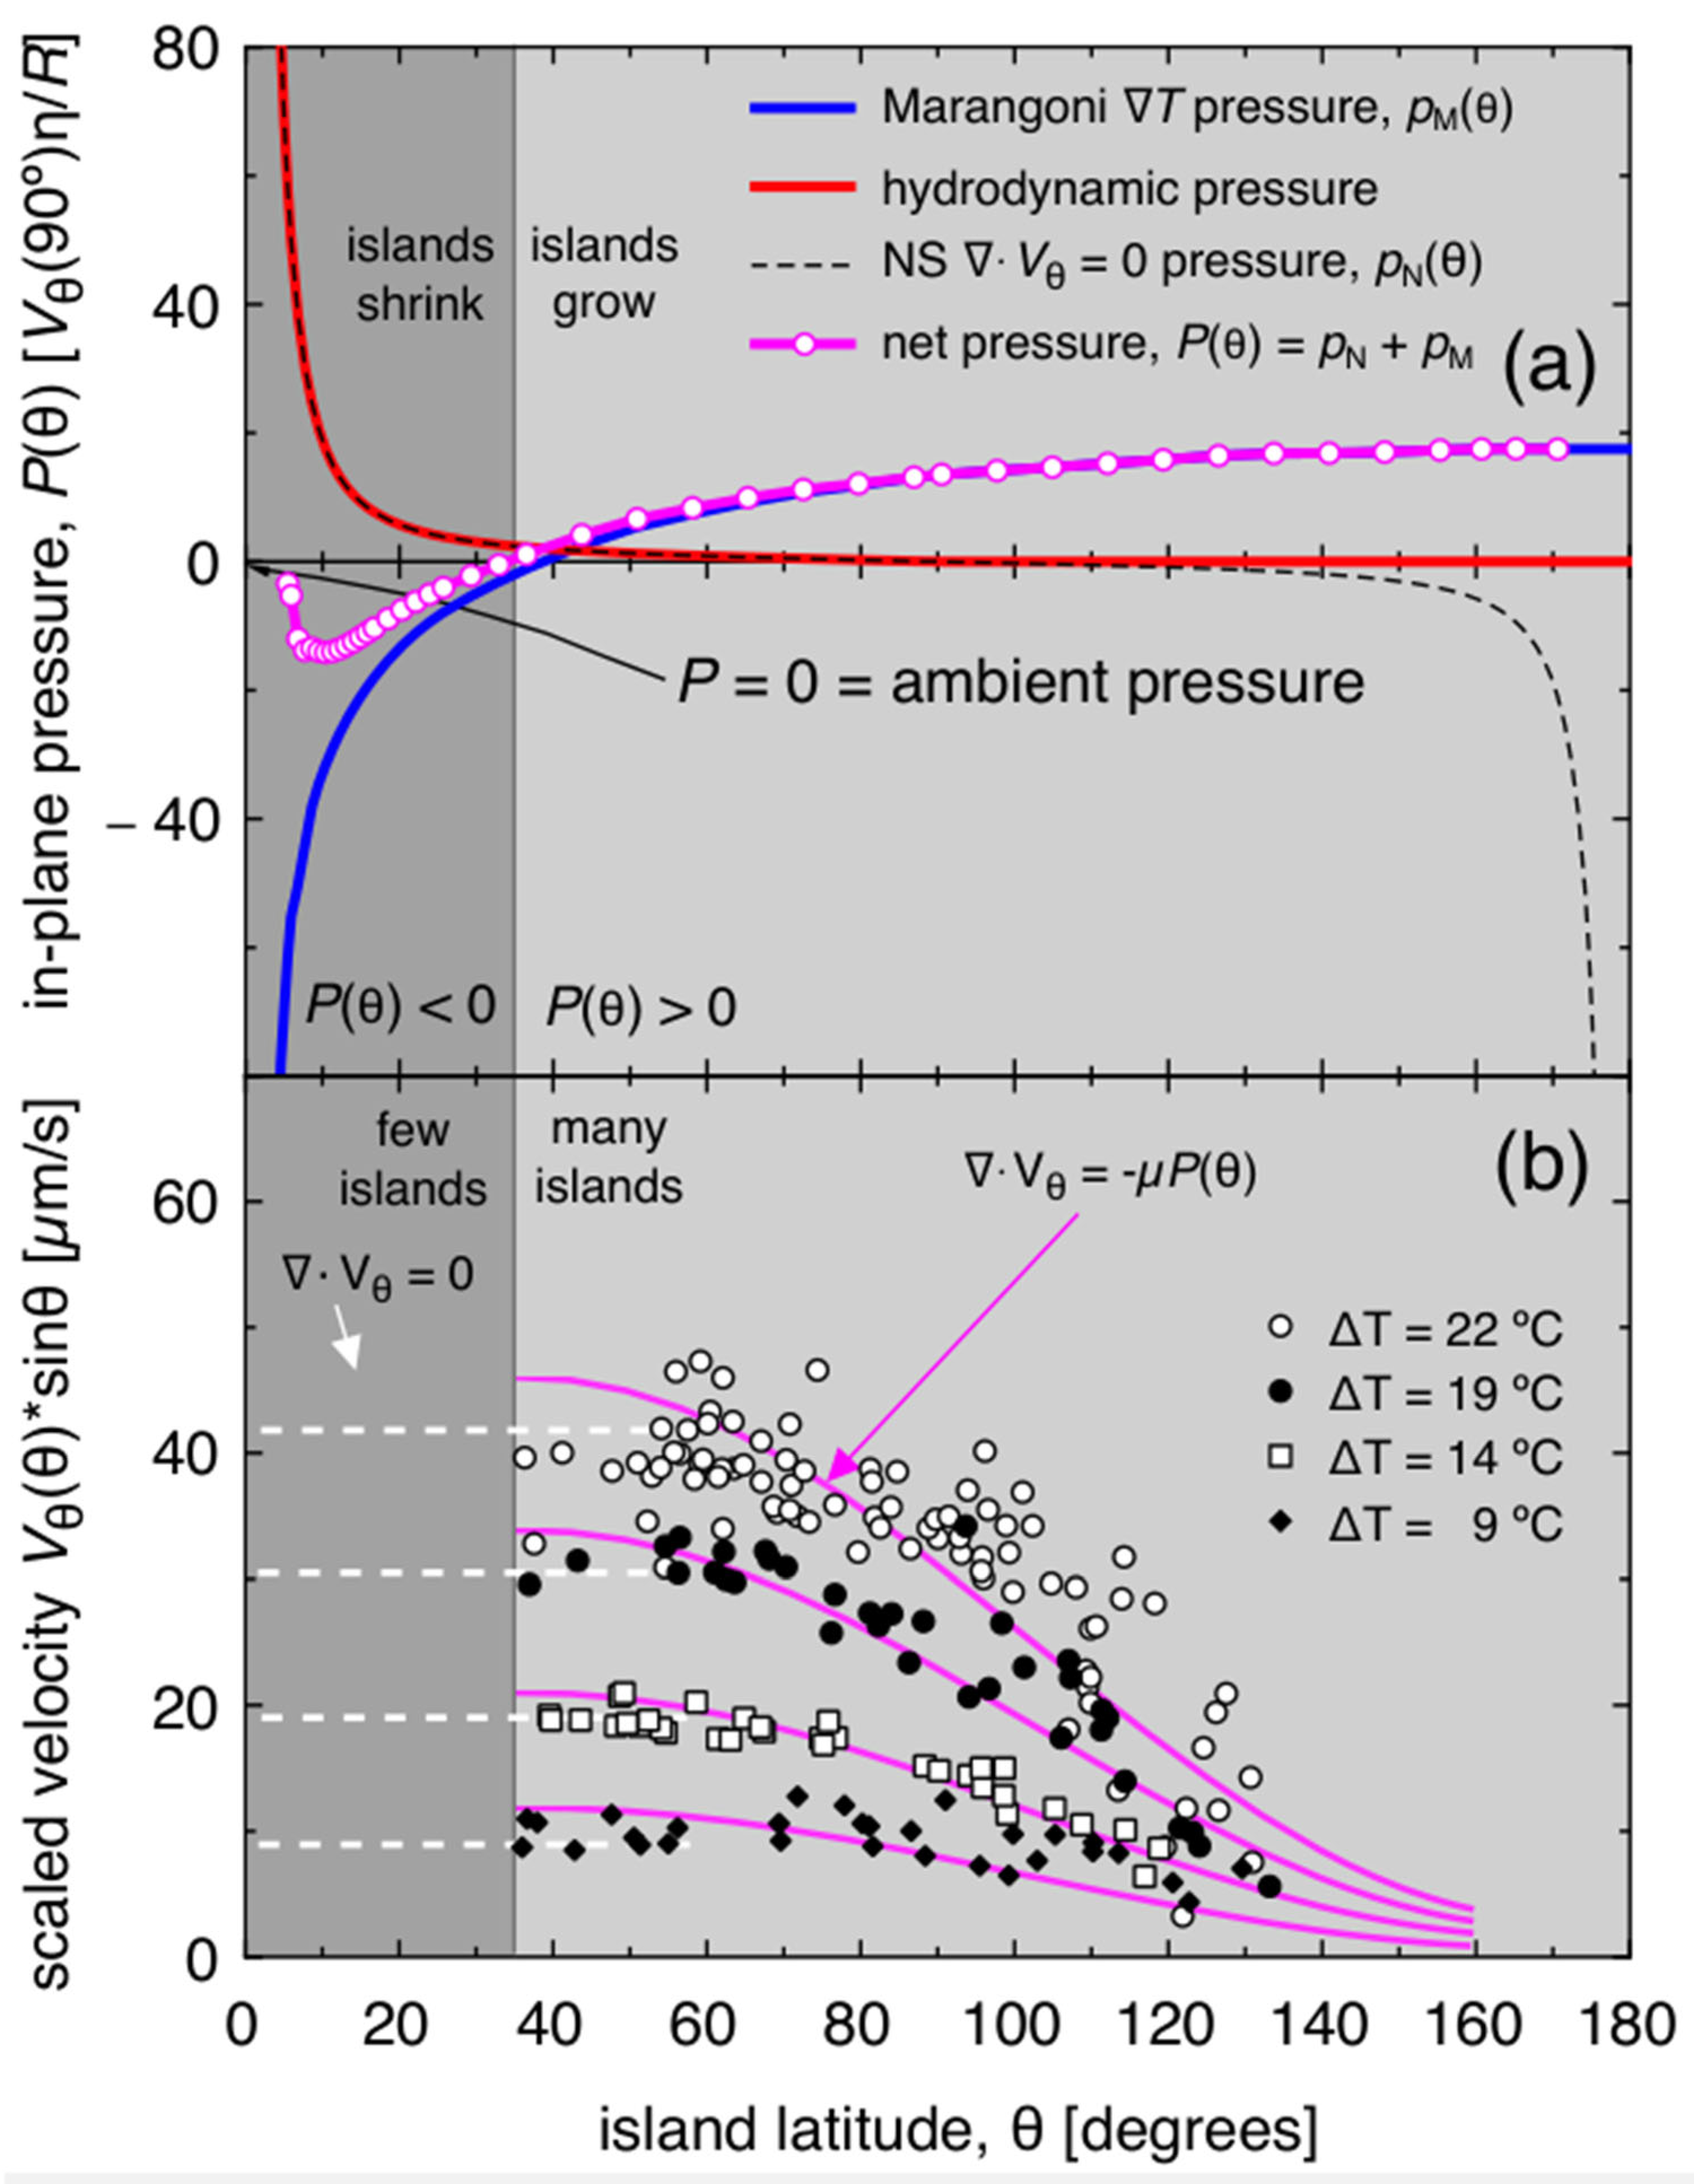
Measurements of Vθ(θ) of islands in a series of heating experiments with different ΔT, plotted as Vθ(θ)sinθ vs. θ, are shown in Figure 5b. In each case, the heat is applied and kept on through the measurement of the initial constant velocity phase and then switched off, with the chamber allowed to return to a uniform temperature before the next heating event. The scaled velocity is seen to be approximately constant for small θ but decreasing substantially with increasing θ. The measurements start at θ~30° because the curvature of the bubble makes it difficult to measure the island velocity accurately for small θ (close to the needle), and since the flow pushes the islands up from away from the tethering needle, this region is rapidly depleted of islands anyway. In the absence of islands, the background film may then be taken to flow without divergence, at constant Vθ(θ)sinθ, in this region (dashed white lines, Figure 5b).
This longitudinal, upward flow must be accompanied by a decrease in the net in-plane hydrodynamic pressure pH(θ) of the background film. If the flow is divergence-free, the film pressure, which we then denote pN(θ), can be calculated from the Navier-Stokes equation, assuming conditions of low Reynolds-number flow:
pN = (1/R)∂pN/∂θ = η∇2V(θ)= (η/R2){(1/sinθ)[∂/∂θ(sinθVθ(θ)/∂θ] − Vθ sin2θ},
where η is the smectic viscosity for in-plane flow and R the radius of the bubble. Then
pN/∂θ = −(η Vθ(90°)/R)(cos2θ/sin3θ) = −(η/R)Vθ(θ)cot2θ,
which can be integrated to obtain
p N ( 𝜃 ) = ( η V 𝜃 ( 90 ° ) / R )   s i n θ o s i n θ 1 x 2 / x 3 d x .
For small s i n θ , this can be approximated as:
pN(θ) ≈ −(η Vθ(90°)/2R)[(1/sin2θ) − (1/sin2θo)].
Near the equator, pN(90°) ≈ −cηVθ(90°)/2R)/θo2. For the heating cycle with ΔT = 22 °C, we see from Figure 3 that Vθ(90°) = 82 µm/s, which gives ηVθ(90°)/2R = 260 N/m2 = 2.6 × 10⁻³ atm. Here θo is the smallest latitude θ at which the radial laminar flow profile is established on the film. If we assume that Rθo is comparable to the outer radius of the meniscus around the needle, we obtain θo~0.09 rad and pN(θo) − pN(90°)~0.21 atm. The Navier–Stokes pressure, pN(θ), is plotted as the black, dashed curve in Figure 5a, showing that, under divergence-free conditions, the dissipation due to the flow occurs principally in the vicinity of the needle, where the flow-induced shear rate is large. Once the flow reaches the equatorial region of the bubble, there is little shear or further pressure drop along the flow in this region. We take the hydrodynamic pressure pH(θ) as that obtained from the velocity divergence-free Navier-Stokes equation at small θ: pH(θ) ≈ pN(θ) for θ < 60° (solid red line in Figure 5a).
For divergence-free flow, Figure 5a shows that there would be an identical large pressure drop as θ approaches 180°, where, in the presence of another needle or equivalent fluid sink, the fluid would exit the film from the upper pole (black, dashed curve in Figure 5a). Such behavior is not observed, however, because for larger θ-values, Vθ(θ) is not divergence-free, but, as Figure 5b shows, falls increasingly below the small-θ value of sinθVθ(θ) with increasing θ. This is because there is no way for the fluid to escape the film at the top of the bubble, and after the initial upward displacement and growth of velocity, the upper half of the bubble becomes packed with islands and the dynamics are dominated by their growth and coalescence. This decrease of Vθ(θ) must be accompanied by a corresponding decrease in the component of pH(θ) due to steady upward flow, to values below the already small pN(θ) in the equatorial region. We therefore assume that pH(θ) = 0 for θ > 90°, as indicated for large θ by the solid red line in Figure 5a.
Before discussing Vθ(θ) further, let us consider the thermocapillary (Marangoni) driving pressure in the film, pM(θ), which may be obtained from
pM(θ) = (1/R) ∂pM(θ)/∂θ = (2/h)(dσ/dT) ∇T = (1/R) (dσ/dT)(2/h)∂T(θ)/∂θ.
This equation may be integrated, yielding
pM(θ) − pM(0) = (2/h)(dσ/dT)[T(θ) − TN] = (2Σ/h)[T(θ) − TN],
where we take the temperature coefficient of surface tension Σ = dσ/dT = −5.0 × 10⁻⁵ N/(mK), as found in several other room temperature smectic A LCs with similar structures [32]. The temperature distribution on the bubble, T(θ), is established by the heated needle, raised to temperature TN. T(θ) can be estimated by solving the Laplace equation with appropriate boundary conditions at the needle and the chamber walls. The temperature profile was calculated assuming an axially symmetric geometry (a 1.25 mm diameter needle inside a cylindrical chamber with 25 mm radius) and the chamber wall maintained at ambient temperature TA = 28 °C. The results are plotted in Figure 4, with the solid curve showing the numerically computed temperature profile of the smectic film as a function of the polar angle θ. The inset shows the stationary, axially symmetric solution of the heat diffusion equation, with the dashed circle indicating the location of the smectic bubble on the heated needle. The temperature TN of the bubble at the meniscus (where the LC film contacts the needle) is measured by a thermistor attached to the needle. In this example, TN = 40 °C, while the temperature of the bubble at its equator is TE(90°) = TA + 0.08(TNTA), only slightly higher than the ambient chamber temperature. Following Equation (5), ΔPM, the net pressure difference in the film from the tethering needle pM(0°) to the equator pM(90°) driving upward Marangoni flow in the background film, is proportional to ΔT = TNTA:
Δ P M = P M ( 90 ° ) P M ( 0 ° )   = ( 2 Σ / h ) ( T N T A )   = ( 2 Σ / h ) [ 0.92 ( Δ T ]   = 1   atm × [ Δ T / 150 ]
The resulting functional form of pM(θ) for ΔT = 22 °C is shown as the solid blue curve in Figure 5a, along with the net in-plane pressure from the hydrodynamic and Marangoni contributions, P(θ) = pM(θ) + pH(θ) (magenta curve). Both pM(θ) and pH(θ) describe the relative pressure in the background film but are not fixed absolutely relative to the ambient pressure, PA~1 atm, which, apart from the small Laplace pressure, is the magnitude of the pressure inside the meniscus and in the extra layers of the islands. We can thus write P(θ) − PA = [pM(θ) + CM] + [pH(θ) + CH]. Here CH is a constant dependent on the relative difficulty for LC to enter the background film from the meniscus and leave it by passage to an island, and CM is a constant dependent on the amount of thermocapillary driving in the meniscus. For example, if the flow onto the film from the meniscus is permeative [33], then as the permeation coefficient is decreased, the pressure drop across the permeable block is larger, and the pressure in the background film decreases relative to PA for a given flux.
It is immediately noticeable in the experiments that all of the individual islands in the equatorial regions of the bubble (50° < θ < 150°) grow monotonically in radius as they move upward. This is the case in every such sequence recorded for the different ΔT values. It is also evident, from Figure 5b, that as the flow enters the equatorial region of the bubble, the velocity falls below the dashed white lines corresponding to divergence-free flow at small θ. In the equatorial regions, we may equate this flow divergence with an effective reduction of the area of the background film, so that ∇∙V(θ) = −J(θ), where J(θ) gives the rate of fractional area change of the background film at angle θ. Given the invariance of the (quantized) background film thickness, this loss can come only from an average flux of LC material into the islands. In this picture, in the equatorial region of the bubble, the in-plane pressure of the background film has become larger than the ambient pressure in the extra island layers, driving additional molecules into the islands by the mechanism of Helfrich permeation, wherein there is plug-flow velocity, vs, from layer to layer along the layer normal s in response to a pressure gradient (dP/ds) along the layer normal given by vs = λp(dP/ds), where λp is the fluid smectic dissipative permeation coefficient [32,34,35].
Since there is no provision for net flow out of the film at the upper pole, the upward flux of material there is taken up completely by the islands, leaving low pressure in the background film (red curve Figure 5a). For an island of area Ai, the gain of island volume is (d𝒱i/dt) = hi(dAi/dt), equaling the loss of background film volume (d𝒱b/dt) = Aih∇∙V(θ) is equivalent to the gain of island film volume, Aih∇∙V(θ) = hi(dAi/dt), or J(θ) = −∇∙V(θ) = −(hi/Aih)(dAi/dt), where hi is the excess thickness of the island.
If we attribute this flux from the background film to the islands to permeation, then on average J(θ) = −µ[P(θ) − Pi(θ)], where P(θ) is the net in-plane pressure in the film (magenta curve Figure 5b) and Pi(θ) = γ/Ri is the in-plane (Laplace) pressure in an island of radius Ri. Assuming a surface tension typical of organic fluids γ~0.02 J/m2 and taking Ri > 500 µm since the larger islands are the ones primarily accepting material from the background film, we have γ/Ri < 10−4PM(θ), so we can take Pi(θ) ≈ 0 and J(θ) = −µP(θ). The coefficient µ is related to λp by µ = αλp/h2, where α is the fraction of the bubble area covered by islands. We assume a permeation coefficient λp~2 × 10⁻¹⁶ m2/Pa s similar to that of 8CB [35]. Theoretically, a scaling relationship λp~h2/η can be expected, where η is the SmA in-plane hydrodynamic shear viscosity used in Equation (2) above. Substituting this λp into µ anticipates the relationship µ = α/η in the present case.
If P(θ) is known, then the deviation of the measured velocity field from being divergence-free can be obtained from J(θ) = −µP(θ) = −∇∙V(θ) = −(1/Rsinθ)[d/dθ(sinθ Vθ(θ))], giving an additional permeative contribution to ∇∙V(θ) of
sinθVθ(θ)p = −µR∫dθsinθP(θ).
Calculating this contribution using the net pressure P(θ) from Figure 5a and scaling it at small θ to the measured value of sinθVθ(θ) gives the set of magenta curves in Figure 5b that describe rather well the reduction in the in-plane velocity due to leakage into the islands. Interestingly, Equation (7) enables µ to be related to viscosity η. Figure 5b shows that experimentally (i) the flow stops in the upper hemisphere of the bubble, so that sinθVθ(θ)pVθ(90°); and (ii) µR∫dθsinθP(θ) ≈ µRP(90°) ≈ µR [10ηVθ(90°)/R], using P(90°)~10ηVθ(90°)/R from Figure 5b. Equation (7) then becomes Vθ(90°) ≈ 10µηVθ(90°), giving µ ≈ 0.1/η, the scaling expectation if α~0.1. From the images, this is a reasonable filling ratio of the islands in the upper hemisphere.
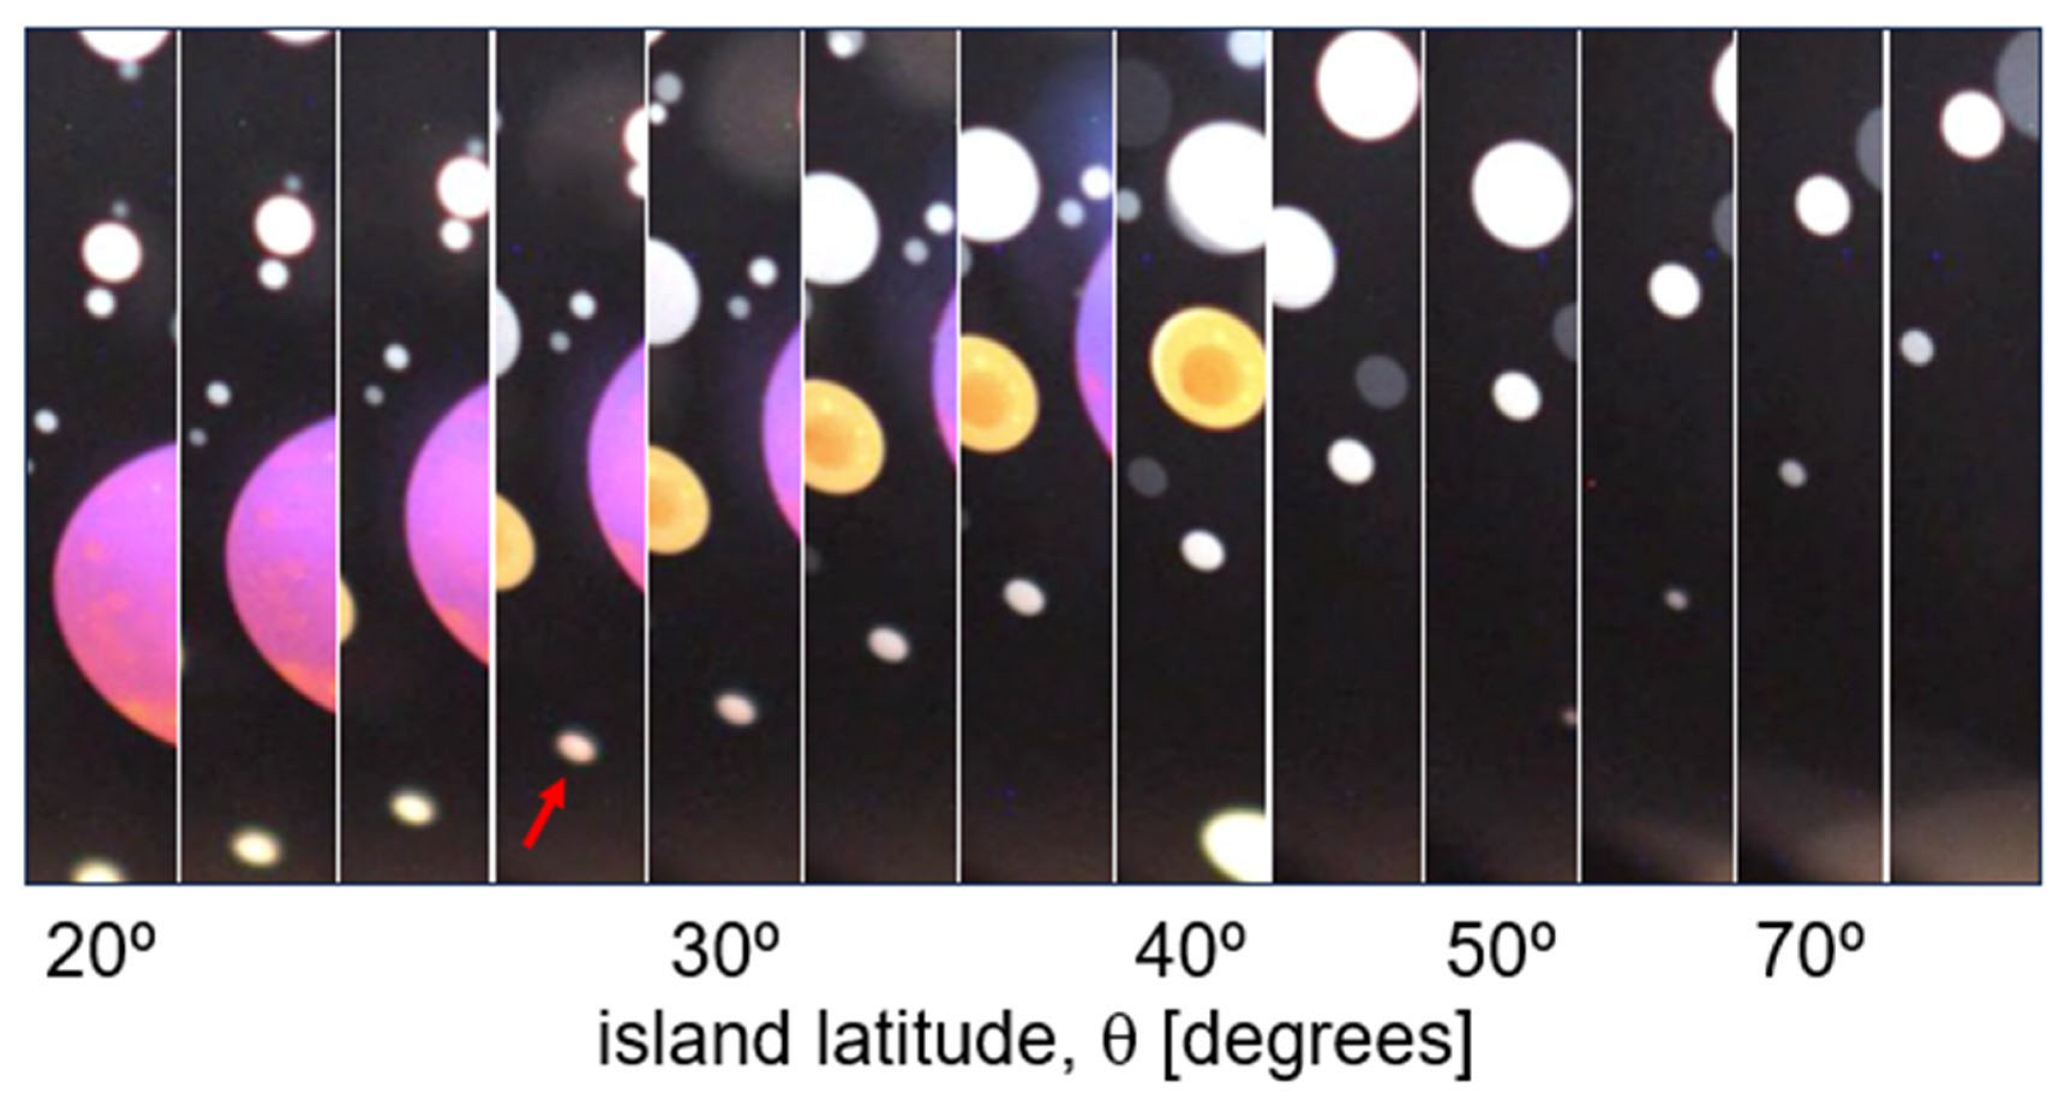
Another universal feature is that near the bottom of the bubble, the islands initially shrink in radius as they move upward, as is shown in Figure 6 and Figure 7. Following the preceding discussion, we interpret this to mean that P(θ) − PA changes sign at a certain latitude in the flowing film, a reversal occurring in the 40° < θ < 50° range for all ΔT values. The islands can thus act as barometric indicators of the local pressure in the background film relative to the ambient, showing that P(θ) < 0 for the smallest θ-values, changing sign to become positive in the upper part of the bubble.
The constraint that P(θ) − PA = 0 at θ~45°, combined with the calculations of pM(θ) and pH(θ), enables us to plot the net in-plane pressure in the background film, P(θ) − PA = [pM(θ) + CM] + [pH(θ) + CH], as shown in Figure 5a. Here pM(θ) and pH(θ) are for the ΔT = 22 °C case, but the behavior should be qualitatively the same for all ΔT, because pM(θ) and pH(θ) both scale linearly with ΔT. The sum CM + CH is set to make P(θ) − PA = 0 at θ = 45° but, independently, the hydrodynamic and Marangoni pressures can be shifted vertically in opposite directions without changing P(θ) by adjusting CMCH, so that the pressure where the fluid enters the film is nearly ambient. The plots show that for small θ, the hydrodynamic and Marangoni body forces on the film are both large but nearly canceling, and that the distributed body force from the temperature gradient on the film continually increases the pressure with increasing θ, becoming much larger than the hydrodynamic drag in the equatorial region, and ultimately pushing the net pressure above ambient (P = 0). The weak influence of hydrodynamic drag in the equatorial region makes possible the simple calculation of the material flux into the islands given above, since the reduction of velocity in the equatorial region has little effect on the net pressure there, so that the magenta curve for P(θ) in Figure 5a can be used in Equation (7) to estimate sinθVθ(θ)p.
The constraint that P(θ) = 0 at θ = 45°, and that ∇∙V(θ)~0 in the uniform flow region near the equator, constrains P(θ) to behave qualitatively like the magenta curve in Figure 5a, i.e., to pass through zero at θ = 45° and be nearly constant for 50° < θ < 150°.
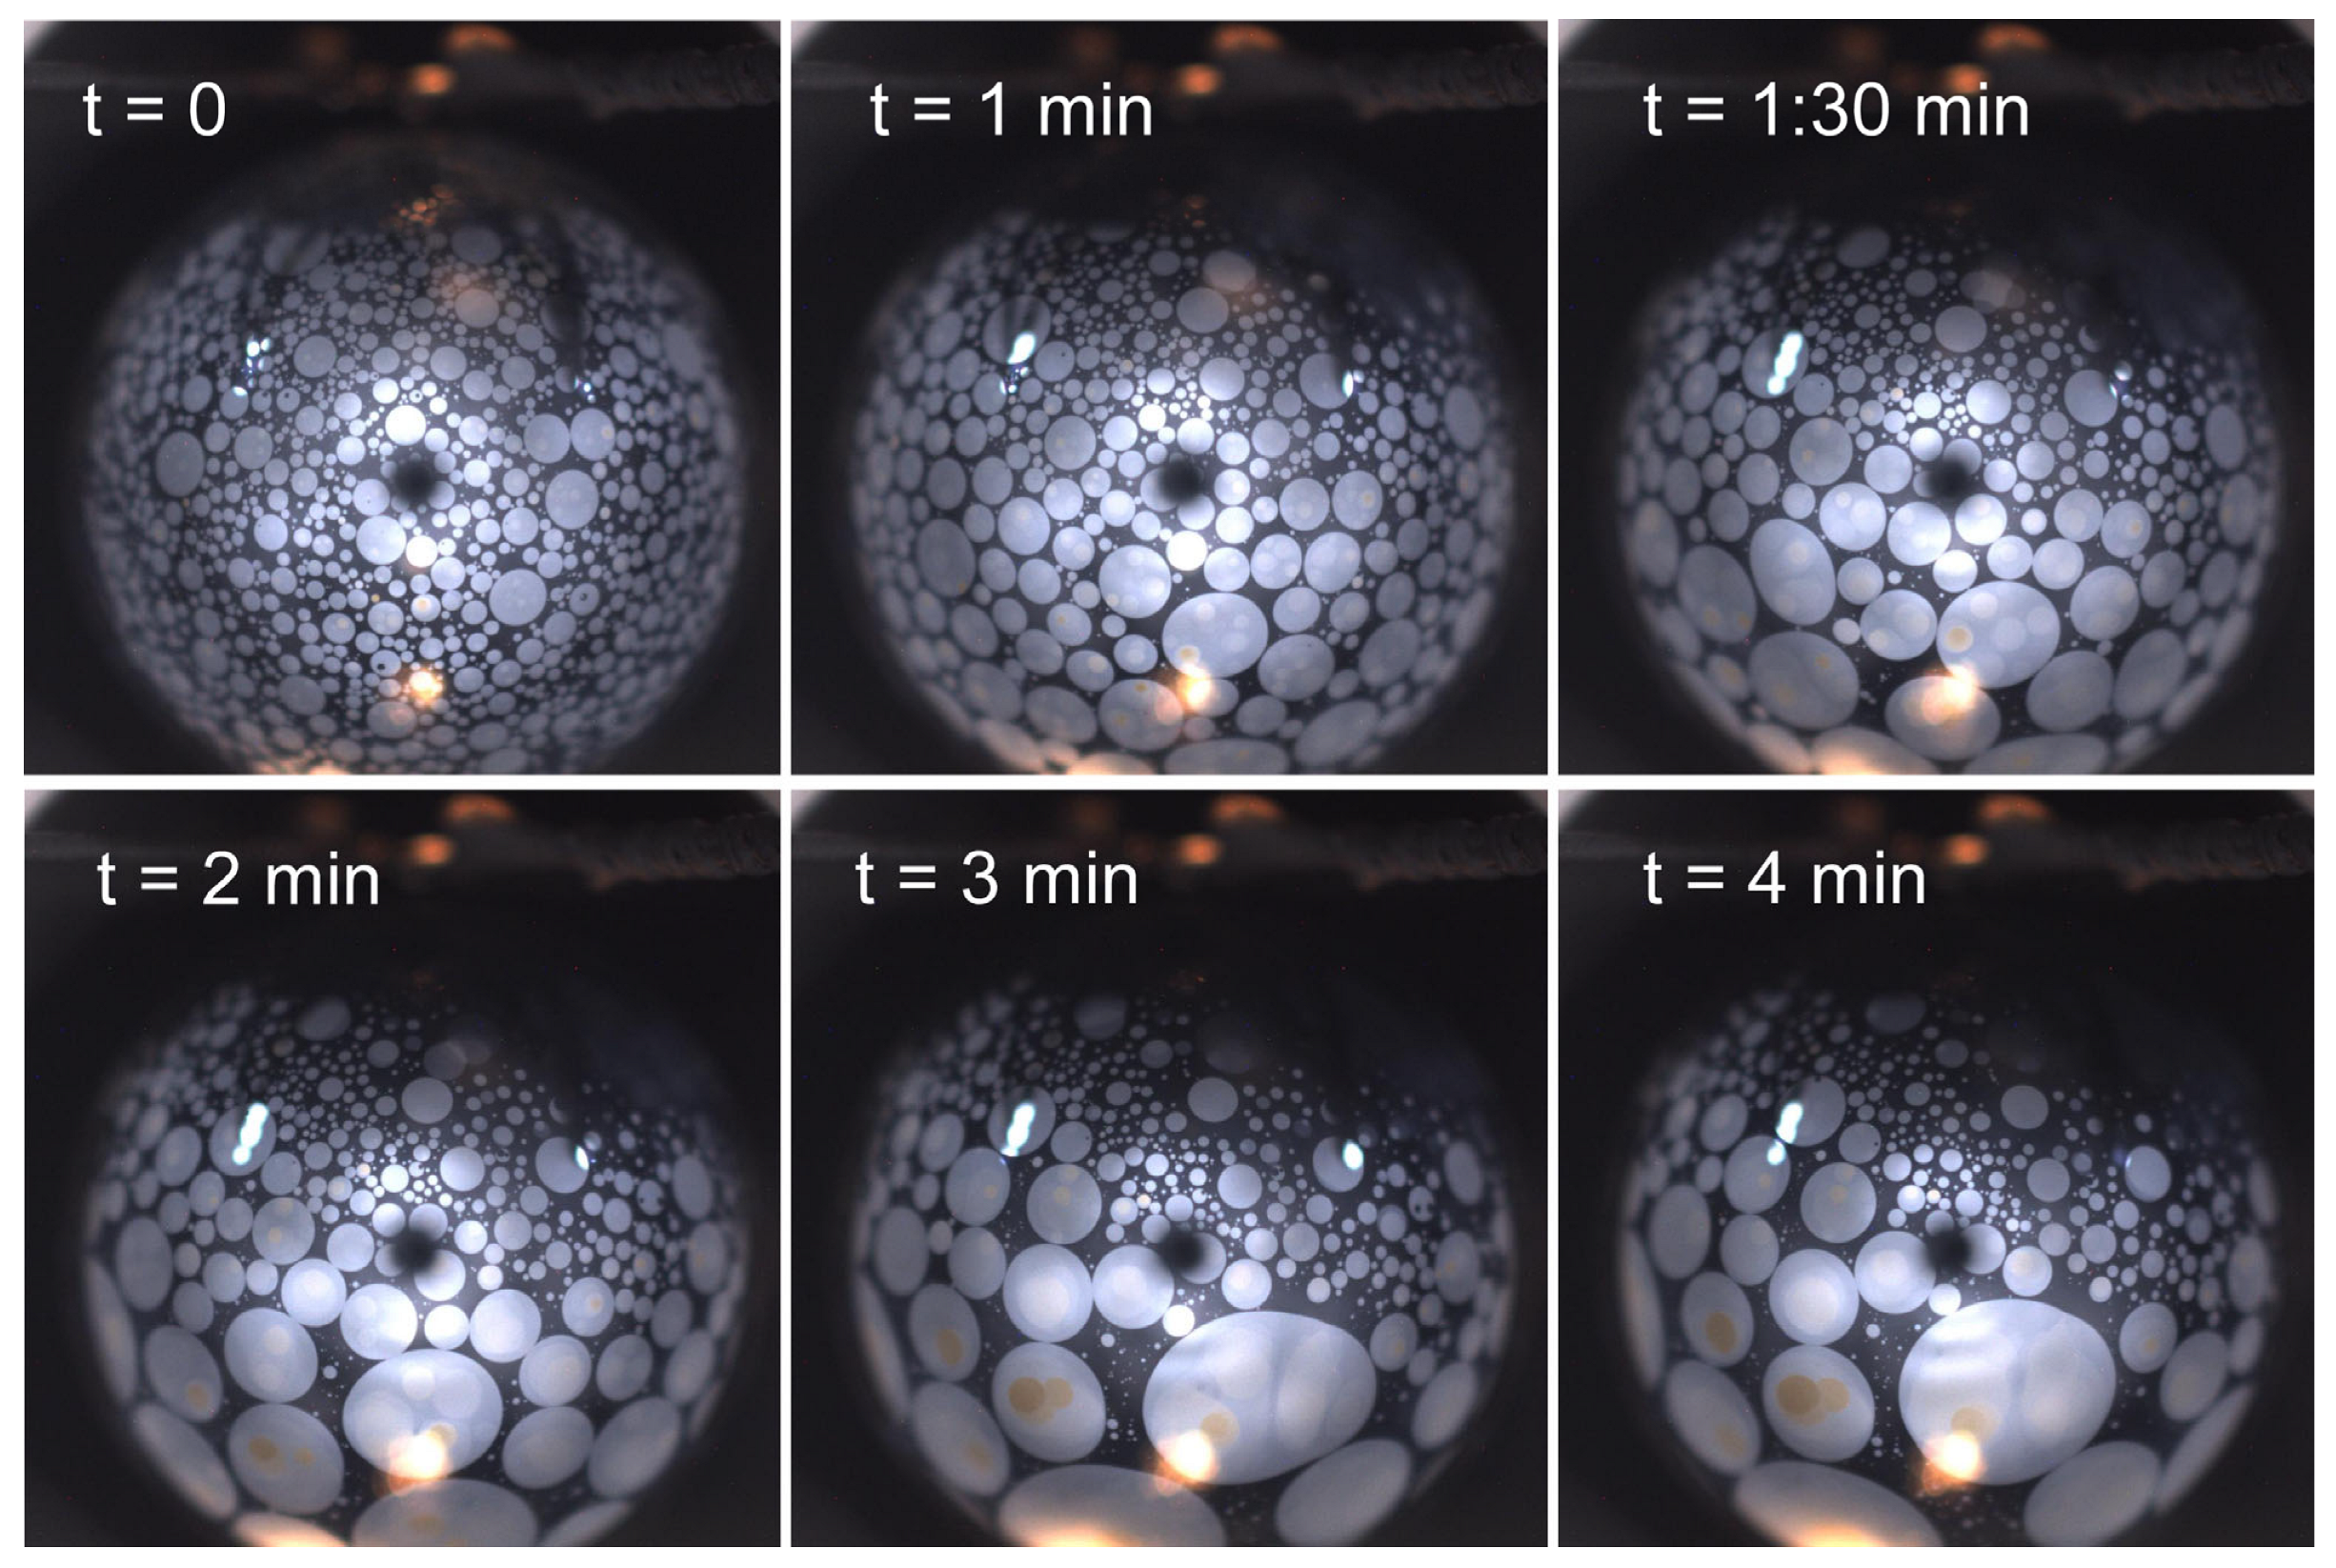
Marangoni flow in the opposite direction, towards the supporting needle, was achieved by setting that needle to the chamber temperature and abruptly raising the temperature of the two heatable air jet needles adjacent to the top surface of the bubble [26]. The film material is again observed to flow from the hot polar region toward the cold one, with an initial apparent velocity of about 25 μm/s estimated from the displacement of the islands and of dark “holes” (regions of lower film thickness) that form at the top of the bubble. A typical image illustrating the island motion is shown in Figure 8. This experiment is essentially different from heating the tethering needle since in this case the heaters are not in direct contact with the bubble film, so there is no meniscus to draw fluid from to supply the downward flow of the film. Without a reservoir that can deliver liquid crystalline material, the film compensates for the divergent 2D flow by thinning the upper part of the bubble, as seen in the images of Figure 9 [16,36]. The negative pressure in the upper part of the bubble film draws material out of the islands by permeative flow, causing them to shrink in radius and disappear, leaving the top of the bubble largely island-free. The background film may also undergo thinning at the top, as mentioned above [3,37,38]. The remaining islands move downward by Marangoni flow, which increases the pressure in the lower part of the bubble and leads to an increase in island area and to crowding. The latter has been shown recently to enhance the rate of island coalescence [37].

3. Conclusions

Five-layer thick spherical smectic bubbles studied in microgravity to eliminate convective effects were subjected to a cylindrically symmetric, nonuniform temperature field centered on the sphere with opposite ends of the bubbles at different temperatures. The resulting surface tension gradient generated transient, incompressible, two-dimensional fluid flow of the bubble film, which was observed using islands of extra thickness as Stokes-like flow tracers. We find that pressure-driven Helfrich permeative flux out of the background smectic layers into the islands must be invoked to develop a quantitative hydrodynamic model of the flow.

Supplementary Materials

The following supporting information can be downloaded at: https://www.mdpi.com/article/10.3390/cryst15050416/s1, Video S1: Island creation on a smectic A liquid crystal bubble on Earth; Video S2: Thermomigration of islands on a smectic A liquid crystal bubble in microgravity.

Author Contributions

Conceptualization, C.S.P., J.E.M. and N.A.C.; Formal analysis, E.M., R.C. and N.A.C.; Funding acquisition, J.E.M. and N.A.C.; Investigation, C.S.P. and J.E.M.; Methodology, C.S.P., J.E.M. and N.A.C.; Project administration, C.S.P. and N.A.C.; Software, E.M., R.C. and J.E.M.; Supervision, C.S.P., J.E.M. and N.A.C.; Writing—original draft, C.S.P. and N.A.C.; Writing—review and editing, J.E.M. and N.A.C. All authors have read and agreed to the published version of the manuscript.

Funding

This work was supported by NASA Grants NAGNNX07AE48G and NNX-13AQ81G, and by the Soft Materials Research Center under NSF MRSEC Grants DMR-0820579 and DMR-1420736.

Data Availability Statement

The OASIS data are available on the NASA PSI archive at https://psi.nasa.gov/physci/repo/data/investigations/PSI-86 or https://doi.org/10.60555/hq75-xv78 (accessed on 24 April 2025).

Acknowledgments

The authors wish to acknowledge many helpful discussions with their collaborators in these experiments, Ralf Stannarius, Torsten Trittel, Kirsten Harth, Christoph Klopp, and the rest of the OASIS team at the University of Magdeburg in Germany.

Conflicts of Interest

The authors declare no conflict of interest.

References

  1. Young, C.Y.; Pindak, R.; Clark, N.A.; Meyer, R.B. Light-scattering study of two-dimensional molecular-orientation fluctuations in a freely suspended ferroelectric liquid-crystal film. Phys. Rev. Lett. 1978, 40, 773. [Google Scholar] [CrossRef]
  2. Pieranski, P.; Beliard, L.; Tournellec, J.-P.; Leoncini, X.; Furtlehner, C.; Dumoulin, H.; Riou, E.; Jouvin, B.; Fénerol, J.-P.; Palaric, P.; et al. Physics of Smectic Membranes. Phys. A Stat. Mech. Its Appl. 1993, 194, 364–389. [Google Scholar] [CrossRef]
  3. Rosenblatt, C.; Pindak, R.; Clark, N.A.; Meyer, R.B. Freely Suspended Liquid-Crystal Films: Absolute Measurements of Polarization, Elastic Constants, and Viscosities. Phys. Rev. Lett. 1979, 42, 1220. [Google Scholar] [CrossRef]
  4. Géminard, J.-C.; Hołyst, R.; Oswald, P. Meniscus and Dislocations in Free-Standing Films of Smectic—A Liquid Crystals. Phys. Rev. Lett. 1997, 78, 1924–1927. [Google Scholar] [CrossRef]
  5. Schneider, F. Measurement of the Viscosity Coefficient η3 in Free-Standing Smectic Films. Phys. Rev. E 2006, 74, 021709. [Google Scholar] [CrossRef]
  6. Nguyen, Z.H.; Atkinson, M.; Park, C.S.; Maclennan, J.; Glaser, M.; Clark, N. Crossover between 2D and 3D Fluid Dynamics in the Diffusion of Islands in Ultrathin Freely Suspended Smectic Films. Phys. Rev. Lett. 2010, 105, 268304. [Google Scholar] [CrossRef]
  7. Eremin, A.; Baumgarten, S.; Harth, K.; Stannarius, R.; Nguyen, Z.H.; Goldfain, A.; Park, C.S.; Maclennan, J.E.; Glaser, M.A.; Clark, N.A. Two-Dimensional Microrheology of Freely Suspended Liquid Crystal Films. Phys. Rev. Lett. 2011, 107, 268301. [Google Scholar] [CrossRef] [PubMed]
  8. Qi, Z.; Nguyen, Z.H.; Park, C.; Glaser, M.A.; Maclennan, J.E.; Clark, N.A.; Kuriabova, T.; Powers, T.R. Mutual Diffusion of Inclusions in Freely Suspended Smectic Liquid Crystal Films. Phys. Rev. Lett. 2014, 113, 128304. [Google Scholar] [CrossRef]
  9. Qi, Z.; Park, C.S.; Glaser, M.A.; Maclennan, J.E.; Clark, N.A. Experimental Realization of an Incompressible Newtonian Fluid in Two Dimensions. Phys. Rev. E 2016, 93, 012706. [Google Scholar] [CrossRef]
  10. Kuriabova, T.; Powers, T.R.; Qi, Z.; Goldfain, A.; Park, C.S.; Glaser, M.A.; Maclennan, J.E.; Clark, N.A. Hydrodynamic Interactions in Freely Suspended Liquid Crystal Films. Phys. Rev. E 2016, 94, 052701. [Google Scholar] [CrossRef]
  11. Qi, Z.; Ferguson, K.; Sechrest, Y.; Munsat, T.; Park, C.S.; Glaser, M.A.; Maclennan, J.E.; Clark, N.A.; Kuriabova, T.; Powers, T.R. Active Microrheology of Smectic Membranes. Phys. Rev. E 2017, 95, 022702. [Google Scholar] [CrossRef] [PubMed]
  12. Clark, N.A. Structure, hydrodynamics, and phase transitions of freely suspended liquid crystals. In Proceedings of the Oral presentation at the Third NASA Microgravity Fluid Physics Conference; Cleveland, OH, USA, 13–15 July 1996. Available online: https://ntrs.nasa.gov/citations/19970000362 (accessed on 24 April 2025).
  13. Stannarius, R.; Cramer, C. Self-Supporting Bubbles of Thermotropic Smectic Liquid Crystals. Europhys. Lett. 1998, 42, 43–48. [Google Scholar] [CrossRef]
  14. Thomson, J., XLII. On certain curious motions observable at the surfaces of wine and other alcoholic liquors. Lond. Edinb. Dublin Philos. Mag. J. Sci. 1855, 10, 330–333. [Google Scholar] [CrossRef]
  15. Marangoni, C. Über die Ausbreitung der Tropfen einer Flüssigkeit auf der Oberfläche einer anderen. Ann. Phys. 1871, 219, 337–354. [Google Scholar] [CrossRef]
  16. Schatz, M.F.; Neitzel, G.P. Experiments on Thermocapillary Instabilities. Annu. Rev. Fluid Mech. 2001, 33, 93–127. [Google Scholar] [CrossRef]
  17. Davis, S.H. Thermocapillary instabilities. Annu. Rev. Fluid Mech. 1987, 19, 403–435. [Google Scholar] [CrossRef]
  18. Urbach, W.; Rondelez, F.; Pieranski, P.; Rothen, F. Marangoni Effect in Nematic Liquid Crystals. J. Phys. Fr. 1977, 38, 1275–1284. [Google Scholar] [CrossRef]
  19. Godfrey, M.I.; Van Winkle, D.H. Surface-Tension-Gradient-Induced Flow in Freely Suspended Liquid Crystalline Films. Phys. Rev. E 1996, 54, 3752–3764. [Google Scholar] [CrossRef]
  20. Choi, H.; Takezoe, H. Circular Flow Formation Triggered by Marangoni Convection in Nematic Liquid Crystal Films with a Free Surface. Soft Matter 2016, 12, 481–485. [Google Scholar] [CrossRef]
  21. Birnstock, J.; Stannarius, R. Vertically Suspended Smectic Films with In-Plane Temperature Gradients. Mol. Cryst. Liq. Cryst. Sci. Technol. Sect. A. Mol. Cryst. Liq. Cryst. 2001, 366, 815–824. [Google Scholar] [CrossRef]
  22. Trittel, T.; Harth, K.; Klopp, C.; Stannarius, R. Marangoni Flow in Freely Suspended Liquid Films. Phys. Rev. Lett. 2019, 122, 234501. [Google Scholar] [CrossRef] [PubMed]
  23. Stannarius, R.; Trittel, T.; Klopp, C.; Eremin, A.; Harth, K.; Clark, N.A.; Park, C.S.; Maclennan, J.E. Freely Suspended Smectic Films with In-Plane Temperature Gradients. New J. Phys. 2019, 21, 063033. [Google Scholar] [CrossRef]
  24. The Observation and Analysis of Smectic Islands in Space (OASIS) Project Flew on the International Space Station from June 2015 to March 2016. Available online: https://www1.grc.nasa.gov/space/iss-research/msg/oasis/ (accessed on 24 April 2025).
  25. Clark, N.A.; Eremin, A.; Glaser, M.A.; Hall, N.; Harth, K.; Klopp, C.; Maclennan, J.E.; Park, C.S.; Stannarius, R.; Tin, P.; et al. Realization of Hydrodynamic Experiments on Quasi-2D Liquid Crystal Films in Microgravity. Adv. Space Res. 2017, 60, 737–751. [Google Scholar] [CrossRef]
  26. The Liquid Crystal Material for the OASIS Experiments Was Provided by the Miyota Development Center of America, Longmont, Colorado, USA. Available online: https://www.miyotadca.com/ (accessed on 24 April 2025).
  27. Radzihovsky, S.P.; Cranfill, C.; Nguyen, Z.; Park, C.S.; Maclennan, J.E.; Glaser, M.A.; Clark, N.A. Two-Dimensional Island Emulsions in Ultrathin, Freely-Suspended Smectic Liquid Crystal Films. Soft Matter 2017, 13, 6314–6321. [Google Scholar] [CrossRef]
  28. Stoebe, T.; Mach, P.; Huang, C.C. Surface Tension of Free-Standing Liquid-Crystal Films. Phys. Rev. E 1994, 49, R3587–R3590. [Google Scholar] [CrossRef] [PubMed]
  29. Schneider, F. A Novel Method for Measuring the Surface Tension of Free Standing Smectic Films. Rev. Sci. Instrum. 2002, 73, 114–118. [Google Scholar] [CrossRef]
  30. Jaquet, R.; Schneider, F. Dependence of Film Tension on the Thickness of Smectic Films. Phys. Rev. E 2003, 67, 021707. [Google Scholar] [CrossRef]
  31. Helfrich, W. Capillary Flow of Cholesteric and Smectic Liquid Crystals. Phys. Rev. Lett. 1969, 23, 372. [Google Scholar] [CrossRef]
  32. Schüring, H.; Thieme, C.; Stannarius, R. Surface Tensions of Smectic Liquid Crystals. Liq. Cryst. 2001, 28, 241–252. [Google Scholar] [CrossRef]
  33. Oswald, P.; Picano, F.; Caillier, F. Dislocation Loop Dynamics in Freestanding Smectic Films: The Role of the Disjoining Pressure and of the Finite Permeability of the Meniscus. Phys. Rev. E 2003, 68, 061701. [Google Scholar] [CrossRef]
  34. de Gennes, P.-G.; Prost, J. The Physics of Liquid Crystals, 2nd ed.; International Series of Monographs on Physics No. 83; Clarendon Press: Oxford, UK, 2013; p. 420. [Google Scholar]
  35. Oswald, P.; Pieranski, P. Smectic and Columnar Liquid Crystals: Concepts and Physical Properties Illustrated by Experiments; Taylor & Francis: Abingdon, UK, 2006; ISBN 9780429125553. [Google Scholar] [CrossRef]
  36. Klopp, C.; Trittel, T.; Stannarius, R. Coarsening of Quasi Two-Dimensional Emulsions Formed by Islands in Free-Standing Smectic Films. ChemPhysChem 2024, 25, e202400166. [Google Scholar] [CrossRef] [PubMed]
  37. Stoebe, T.; Mach, P.; Huang, C.C. Unusual Layer-Thinning Transition Observed near the Smectic- A -Isotropic Transition in Free-Standing Liquid-Crystal Films. Phys. Rev. Lett. 1994, 73, 1384–1387. [Google Scholar] [CrossRef] [PubMed]
  38. Pankratz, S.; Johnson, P.M.; Paulson, A.; Huang, C.C. Kinetics of Layer-Thinning Transitions in Overheated Smectic Films. Phys. Rev. E 2000, 61, 6689–6695. [Google Scholar] [CrossRef] [PubMed]
Figure 1. Emulsion of islands on a smectic bubble in microgravity viewed in reflection. The islands were generated using the air jets seen at the top of the bubble. The bubble is tethered to the inflation needle at the bottom. The bubble diameter is about 15 mm.
Crystals 15 00416 g001
Figure 2. Thermomigration of islands on a smectic bubble in microgravity heated from below. The bubble diameter is 15 mm, with some variation depending on inflation. The experimental parameters are chosen such that: (i) the needle heats the air as in Figure 4; (ii) the film rapidly equilibrates to the to the air temperature, with the resulting gradient shown in Figure 4; (iii) this produces a gradient in the film surface tension to give Marangoni flow of the background film; (iv) Marangoni flow is opposed only by fluid viscous stresses in the film, not by any stresses from the air; (v) the islands experience Stokes-like fluid viscous drag on the background film and so are effectively at rest relative to it, and can be used as tracers to monitor the flow of the background film. In this experiment, the bubble blowing needle (red) was rapidly heated to ΔT = +14 °C above the ambient bubble chamber temperature of T = 26 °C. The green vectors show the average island velocities measured once a steady state was achieved after the temperature gradient was imposed. The location of the heated tethering needle at the bottom of the bubble and the polar angle θ are indicated. The average island velocity near θ = 30°, the smallest angle where reliable velocity measurements could be made is ~20 μm/s, dropping to ~15 μm/s near the equator. One of a pair of heater needles is visible above the top of the bubble. The liquid crystal material used here is MX 12805.
Crystals 15 00416 g002
Figure 3. Average island velocity at θ = 30°, the smallest angle where reliable velocity measurements could be made, as a function of the temperature difference ΔT between the needle and the bubble chamber.
Crystals 15 00416 g003
Figure 4. Computed isotherms around a smectic bubble locally heated above ambient by increasing the temperature of the tethering needle. In this example, the ambient temperature is T = 28 °C and the needle is at 40 °C. The solid curve represents the numerically computed profile. For comparison, the dashed curve shows the analytical result for a spherical heat source of radius rc (the radius of the tethering needle) located at the needle tip. The inset shows the stationary, axially symmetric solution of the heat diffusion equation, with contour lines shown in 1 °C steps. The bubble location is indicated by the dashed circle. Adapted from Ref. [23]. Used under CC BY 3.0.
Crystals 15 00416 g004
Figure 5. Theoretical calculation of pressure in the smectic film and scaled island velocity measured as a function of polar angle. (a) Hydrostatic pressure in the film vs. latitude in units of ηVθ(90°)/R. At ΔT = 22 °C, for example, we have Vθ(90°) = 82 µm/s from Figure 3, making the vertical axis units ηVθ(90°)/R = 520 N/m2 = 5.2 × 10⁻³ atm. (b) Velocity vs. polar angle of islands on a smectic bubble in a temperature gradient. In this experiment, the bubble chamber was first equilibrated at T = 28 °C and then the bubble inflation needle was suddenly heated to 50 °C. The inflation needle (the “bottom” of the bubble) is at θ = 0. The velocities were determined by tracking the motion of all islands in the field of view once steady-state motion was achieved and computing their average speeds.
Crystals 15 00416 g005
Figure 6. Island size as a function of polar angle on the bubble. The images illustrate the evolution of a particular thermomigrating island (indicated by the red arrow) at different latitudes on the bubble. As the island moves upward, away from the tethering needle, it first shrinks and then expands again, first losing and then gaining LC material in response to changes in the local film pressure.
Crystals 15 00416 g006
Figure 7. Island size as a function of polar angle on the bubble. As they move upward, away from the tethering needle, the islands first shrink and then expand again, first losing and then gaining LC material in response to changes in the local film pressure. The crossover is at around θ = 45°.
Crystals 15 00416 g007
Figure 8. Thermomigration of islands on a smectic bubble in microgravity heated from above. In this experiment, the temperature of two heatable air jet needles, one of which is visible at right, just above the bubble (the other is not visible, hidden behind a non-heatable air jet needle at left), was rapidly raised to ΔT = 10 °C above the ambient bubble chamber temperature of T = 26 °C. The green vectors show the average island velocities measured during the first two seconds after the temperature gradient was imposed. The average velocity near the equator was found to be 5 mm/s. Because this particular bubble was not centered below the heater needles, the islands moved down and to the left, towards the coolest part of the bubble. The liquid crystal material used here is MX 12805. The bubble diameter is approximately 15 mm.
Crystals 15 00416 g008
Figure 9. Thermocapillary flow from the heated upper pole of a bubble. A temperature gradient is imposed across the bubble by heating two needles located a short distance above the top of the bubble to ΔT = 20 °C above the ambient bubble chamber temperature of T = 25 °C. Downward flow of the liquid crystal results in a depletion of islands near the top of the bubble and accelerated island coalescence in the lower part of the bubble.
Crystals 15 00416 g009
Disclaimer/Publisher’s Note: The statements, opinions and data contained in all publications are solely those of the individual author(s) and contributor(s) and not of MDPI and/or the editor(s). MDPI and/or the editor(s) disclaim responsibility for any injury to people or property resulting from any ideas, methods, instructions or products referred to in the content.