Article

Effect of Accumulative High-Pressure Torsion on Structure and Electrochemical Behavior of Biodegradable Fe-30Mn-5Si (wt.%) Alloy

1
Metal Forming Department, National University of Science and Technology MISIS, 119049 Moscow, Russia
2
Institute of Molecule and Crystal Physics of Ufa Federal Research Centre RAS, 450075 Ufa, Russia
3
A.V. Shubnikov Institute of Crystallography, Kurchatov Complex “Ctystallography and Photonics” National Research Centre Kurchatov Institute, 123098 Moscow, Russia
4
Scientific Center of Laser Materials and Technologies, A.M. Prokhorov General Physics Institute of the Russian Academia of Science, 119333 Moscow, Russia
*
Author to whom correspondence should be addressed.
Crystals 2025, 15(4), 351; https://doi.org/10.3390/cryst15040351
Submission received: 13 March 2025 / Revised: 28 March 2025 / Accepted: 6 April 2025 / Published: 9 April 2025
(This article belongs to the Special Issue Shape Memory Alloys: Recent Advances and Future Perspectives)

Abstract

:
A high-pressure torsion (HPT) with a number of revolutions (n) of up to 10 and an advanced method of accumulative HPT (AccHPT), n = 10 with subsequent post-deformation annealing (PDA) at 500 and 600 °C, were applied to a biodegradable Fe-30Mn-5Si (wt.%) alloy. The effect of HPT, AccHPT and AccHPT with PDA on the microstructure, phase composition, microhardness and electrochemical behavior in Hanks’ solution was studied. HPT with n = 1 and 5 resulted in forming a mixed submicrocrystalline (SMCS) and nanocrystalline (NCS)structure, while HPT, n = 10 and AccHPT, n = 10 resulted in a predominant NCS with grain/subgrain sizes of 15–100 nm and 5–40 nm, respectively. PDA after AccHPT resulted in a mixture of SMCS and NCS. HPT, n = 5, n = 10 and AccHPT, n = 10 led to a transition from a two-phase (γ-austenite and ε-martensite) state after reference quenching, and HPT, n = 1 to a single-phase state (stress-induced and deformed ε-martensite), while the AccHPT, n = 10 with PDA results in a two-phase state of γ-austenite and cooling-induced ε-martensite, similarly to reference heat treatment (RHT). The increase in n resulted in the microhardness increasing up to its maximum after AccHPT, followed by a slight decrease after PDA. HPT and AccHPT led the biodegradation rate to decrease as compared to the initial state. PDA after AccHPT at 500 and 600 °C resulted in a two-phase state corresponding to an elevated biodegradation rate without significant material softening. The observed electrochemical behavior features are explained by changes in a combination of the phase state and the overall level of crystal lattice distortion.

1. Introduction

Biodegradable iron-based alloys, and Fe-Mn-Si shape memory alloys (SMA) in particular, are more promising materials for temporary bone implants compared to other popular biodegradable metals such as Mg- and Zn-alloys [1,2,3] due to their superior mechanical properties, good biocompatibility, absence of hydrogen evolution during corrosion and appropriate biodegradation rate [4,5]. It has been shown that the best combination of functional properties can be achieved with 23–30 wt.% Mn and 4–6 wt.% Si [5,6,7]. In particular, Fe-30Mn-5Si wt.% SMA was shown to exhibit the best set of functional properties among all studied Fe-Mn-Si alloys, specifically, the highest mechanical properties, the lowest Young’s modulus and the highest biodegradation rate [7]. However, the as-cast Fe-30Mn-5Si SMA typically features a coarse-grained structure with average grain size of 200–300 µm [7,8]. It is well known that the formation of a fine-grained (1–10 µm) structure, submicrocrystalline structure (SMCS) (100 nm−1 µm) and nanocrystalline structure (NCS) including nanograined and nanosubgrained structures (the grain/subgrain size below 100 nm), can significantly improve the functional properties of the alloys [4,9,10,11]. These structures and the corresponding enhancement of mechanical and functional properties can be achieved using severe plastic deformation modes in thermomechanical treatment methods [9,12].
The severe plastic deformation methods generally include high-pressure torsion (HPT), twist extrusion, multi-directional forging, equal-channel angular pressing, accumulative roll-bonding, cyclic extrusion and compression. HPT is one of the most effective methods to obtain NC structure with a true deformation strain of about e = 10 [13] and higher, which involves torsional deformation under high hydrostatic pressure [13,14]. The HPT sample is a thin disk, typically 10 or 20 mm in diameter and 1–3 mm thick, placed in an anvil made of hard material. Study [15] revealed the evolution of microstructure and mechanical properties of an Fe-Mn-Al-C alloy subjected to HPT with a total number of revolutions up to n = 10. It was found that HPT with n = 10 results in a uniform NCS, with a final grain size of 20–50 nm. The ultimate tensile strength and microhardness values increased to the maximum values of 2500 MPa and 561 HV, respectively, for n = 5, and less to n = 10, which is attributed to the inverse Hall-Petch effect [16,17]. The authors of [18] carried out the HPT on a Fe-10Ni-7Mn alloy with the total number of revolutions up to n = 20. It was found that during HPT the grain size decreased from 5.5 μm to a NC structure of about 30 nm. The HPT, n = 20 results in significantly increased mechanical properties, including a microhardness value from 300 to 690 HV, the ultimate tensile strength and the apparent yield stress changing from 815 to 2230 MPa, and from 790 to 2040 MPa, respectively.
However, some studies [19,20] argue that the theoretical accumulated shear strain γ calculated using formula γ = 2πRn/h (where R is the sample radius, n is the number of revolutions, h is the sample thickness), as follows from [19,20], is not adequate to the actual achieved strain, with the difference being caused by the “slippage effect”. The slippage effect has previously been observed in other HPT-related studies [11,15], and was caused by the significantly lower value of the friction force between the anvil and the sample compared to the apparent yield stress of the studied metals and alloys [21]. Study [21] highlighted the slippage effect on pure metals (aluminum, copper, iron). It was found that the slippage effect was observed in all cases, but to a lesser extent for pure aluminum and pure copper, and to a much greater extent for pure iron. The slippage effect is greater with the higher apparent yield stress of the material, and it increases with the rise in the HPT revolution number due to the material hardening. Moreover, the slippage effect was experimentally demonstrated using an advanced method of the HPT of joint disk halves in our previous work [12]. In this study, 10 mm diam. Fe-30Mn-5Si alloy samples for HPT were cut into two equal parts. These parts were placed into an anvil where a quarter and one full revolutions of HPT were applied. For comparison, the results of the HPT of joint disk halves made of Cu are also presented in this study. It was shown that the Cu sample after joint HPT by a quarter revolution, demonstrated a displacement of the upper surface relative to the lowersurface, consistent with HPT by a quarter revolution. It should be noted that torsion occurs due to the rotation of the lower anvil, indicating the absence of the slippage effect. However, the HPT of the joint disk halves of the Fe-30Mn-5Si alloy, whether by a quarter or full revolution, results in a small displacement of the upper surface of each half relative to the lower one, indicating the presence of the slippage effect compared to the Cu sample. This slippage effect arises due to the friction force between the surfaces of the samples, and the anvil surface becomes less than the apparent yield stress of the studied alloy due to significant straining at the initial stages. Therefore, in order to decrease the slippage effect, the new accumulative HPT method (AccHPT) was developed [11].
Our previous study [11] showed that AccHPT treatment with a total revolution number of n = 10 results in the formation of predominant NGS (15–40 nm), while the conventional HPT produces a mixture of NSS and NGS with a grain/subgrain size in the 15–100 nm range. However, the conventional HPT and AccHPT result in the transformation of the Fe-30Mn-5Si alloy from a two-phase state (γ + ε) to a single-phase state of the stress-induced ε-martensite, which, despite a significant improvement of mechanical properties, leads to a significant lowering of the biodegradation rate as compared to the two-phase state [10,22,23]. The single-phase state formed by cooling-induced ε-martensite, obtained by cooling to 196 °C, also results in slower biodegradation [10]. Additionally, it was shown that the subsequent transformation of the Fe-30Mn-5Si alloy from a single-phase to a two-phase state lead to an increase in the biodegradation rate. In the present study, to introduce the two-phase state to the Fe-30Mn-5Si alloy due to reverse martensitic transformation (εγ), a post-deformation annealing (PDA) was effectively implemented, with the accelerated biodegradation rate and appropriate level of mechanical properties preserved as a result. The improved electrochemical behavior of the alloy was achieved by optimally combining its phase state and the level of crystal lattice distortion by microstress fields.
Thus, the present work aims at a comparative study of the electrochemical behavior after conventional HPT and AccHPT of the Fe-30Mn-5Si alloy in a single-phase state, as well as the behavior in a two-phase state formed after PDA to increase the biodegradation rate without significant softening.

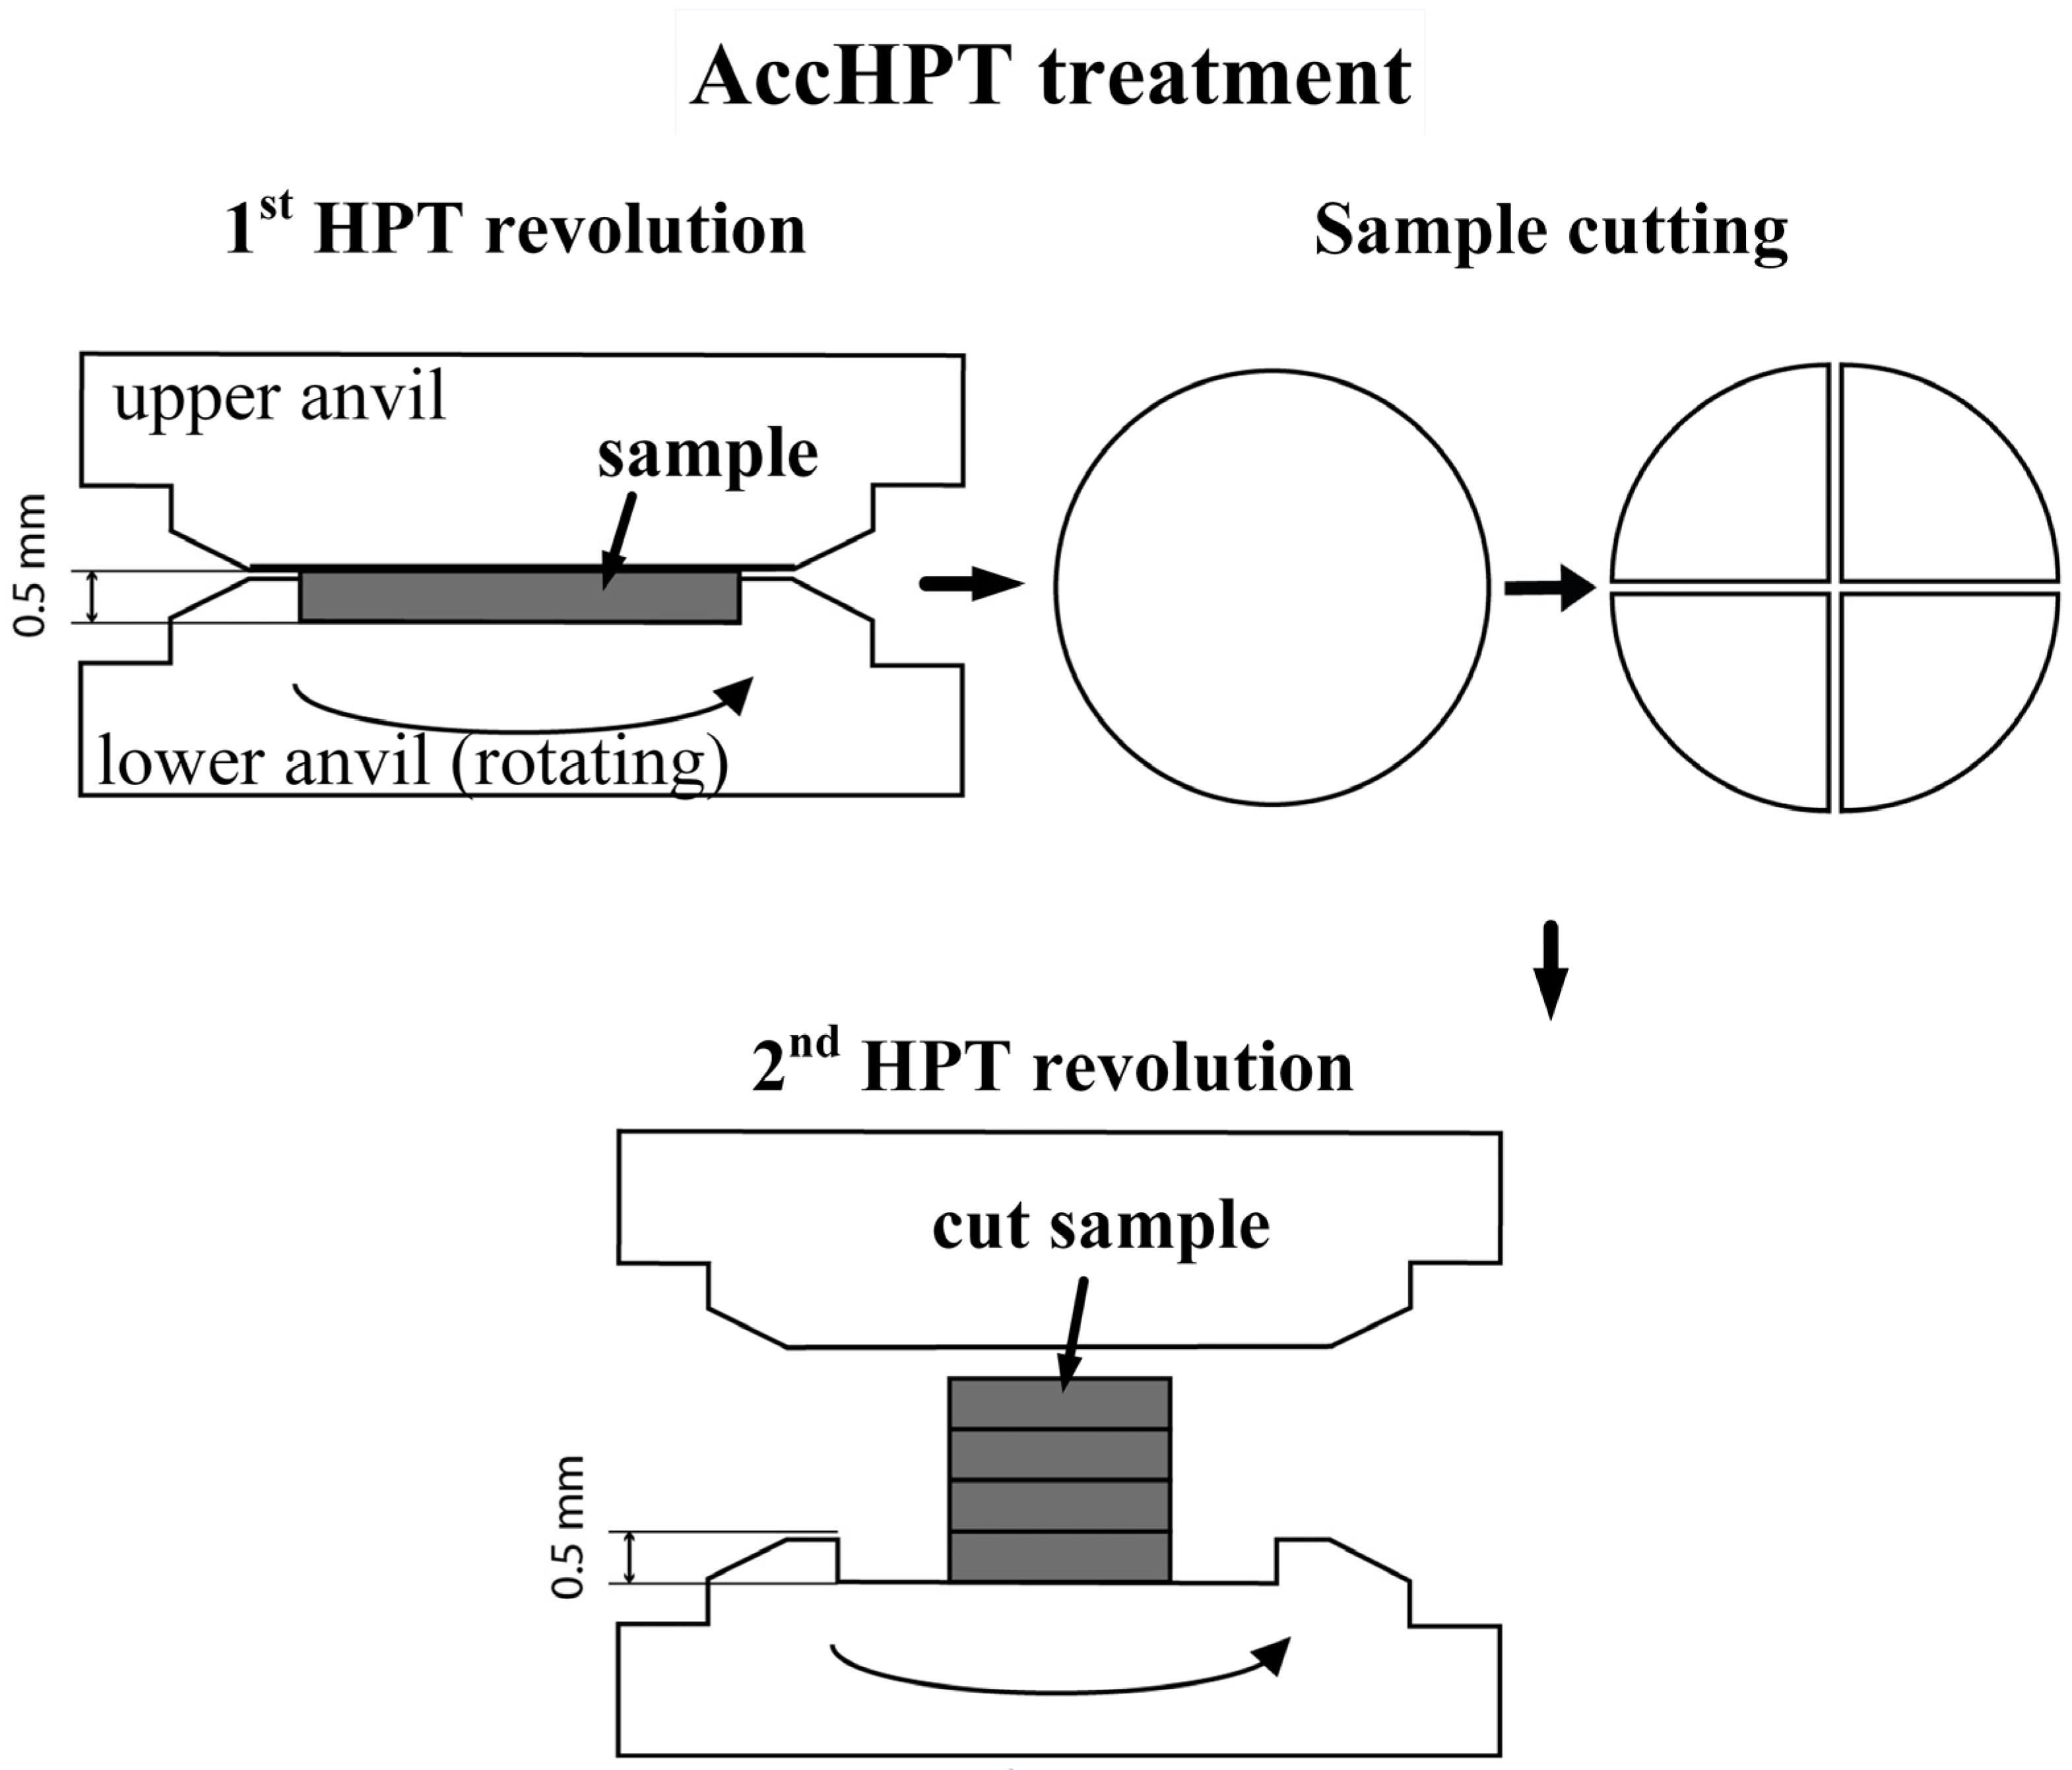
2. Materials and Methods

The 12 kg ingot of the Fe-30Mn-5Si (wt.%) alloy (approximately 70 mm in diam and 250 mm in length) was produced from high-purity raw materials by vacuum induction melting in an alumina crucible under the protective argon atmosphere, and was then subjected to homogenization annealing at 900 °C for 1 h, hereafter referred to as reference heat treatment (RHT), resulting in the average γ-phase grain size of 200–300 µm [8,24]. The chemical composition and homogeneity of the studied ingot were examined by energy-dispersive X-ray spectroscopy using a JEOL JSM-6480 LV (JEOL Ltd., Akishima, Tokyo, Japan) scanning electron microscope with an EDX analysis module from different parts of the ingot at more than 30 points. The experimentally measured chemical composition was as follows: 64.9 ± 0.4 wt.% Fe, 30.0 ± 0.3 wt.% Mn, 5.2 ± 0.2 wt.% Si. The level of impurities was assessed using the LECO TC-600 analyzer for oxygen and nitrogen, the LECO CS-600 analyzer for carbon and sulfur, and the LECO RHEN-602 (Leco, Lakeview Ave, St. Joseph, MI, USA) analyzer for hydrogen. The measured contents were as follows: oxygen 0.0004 wt.%, nitrogen 0.043 wt.%, hydrogen 0.0006 wt.%, carbon 0.059 wt.% and sulfur 0.004 wt.%.
The samples for the conventional HPT (hereinafter HPT) and accumulative HPT (hereafter AccHPT) (10 mm in diam. and approximately 1.5 mm thick) were cut using the electrical discharge machining. The HPT and AccHPT were carried out on a 10 mm diam. anvil with a 0.5 mm deep groove at room temperature and 6 GPa pressure. The detailed methodology of AccHPT was described in [11] and schematic representation is presented in Figure 1. The total revolution number for HPT was n = 1, n = 5, and n = 10; for AccHPT n = 10, but after n = 1, n = 2 and n = 3, the samples were cut into 4 equal segments, which were subsequently stacked on top of each other in the anvil, and then the HPT-treated with n = 7 revolutions obtained a monolithic disk. Thus, the AccHPT sample was also subjected to large compressive strain, and the total accumulated strain in AccHPT was significantly higher than after HPT. The samples after AccHPT were subjected to PDA at 500 or 600 °C for 15 min. The choice of these regimes was aimed at creating a two-phase state due to the reverse martensitic transformation (εγ) followed by partial martensitic γε transformation upon cooling without strong softening.
The DRON-3 (Burevestnik Innovation Centre, St. Petersburg, Russia) diffractometer was used for the X-ray diffraction (XRD) analysis with CuKα radiation (λ = 0.154178 nm) at room temperature. The studied 2θ diffraction angle range of 35 to 95 2θ degrees was scanned with a 0.1 step and an exposure time of 5 s. The width at the half-height of the XRD line profiles was measured to compare the overall lattice distortion levels of the samples. The transmission electron microscopy (TEM) analysis of the HPT and AccHPT sample’s microstructure was carried out with a JEM 2100 transmission electron microscope (JEOL Ltd., Akishima, Tokyo, Japan). The TEM samples sized 10 mm × 10 mm × 0.5 mm were mechanically thinned to 0.2 mm, and then further thinned by electrolytic polishing. Electrolytic polishing was carried out using a TenuPol-5 Struers (Champigny sur Marne cedex, France) setup. The electrolytic polishing electrolyte consisted of perchloric acid (78 mL), ethanol (370 mL), butoxyethanol (100 mL) and distilled water (90 mL). Prior to electrochemical etching, the electrolyte was cooled to −20 °C. The process was carried out at 20 V for several minutes until a hole was formed.
The Vickers microhardness was measured along the diameter in the central, half-radius and peripheral zones at least 10 times using Metkon Metallography Hardness Meter (METKON Instruments Inc., Bursa, Turkey) with a 500 g load and 10 s exposure time.
Electrochemical characterization was performed with a IPC-Pro MF potentiostat (Volta, Saint-Petersburg, Russia) with a three-electrode glass cell with a working electrode, with saturated silver chloride electrode as the reference, and platinum electrode as an auxiliary, which was temperature-controlled by a TW-2 Elmi thermostat at 37 °C in Hanks’ solution. Polarization diagrams were obtained starting from the potential 200 mV below the steady-state open circuit potential (OCP) with a 0.2 mV/s sweep rate. For the biodegradation rate estimation, the corrosion current density (icorr) was extracted from the polarization curves to determine the corrosion rate (Cr) of the alloys, as follows [8,23]:
C r = i c o r r 10 4 A M e n F d M e   · 8.76 ,
where icorr is the corrosion current density extracted from the polarization curve, A/cm2; n is an ionic charge (n = 2 for Fe2+); F = 26.8 A·h/gram-equivalent is the Faraday constant; AMe is the atomic weight of the metal, g; dMe is the metal density, g/cm3.

3. Results and Discussion

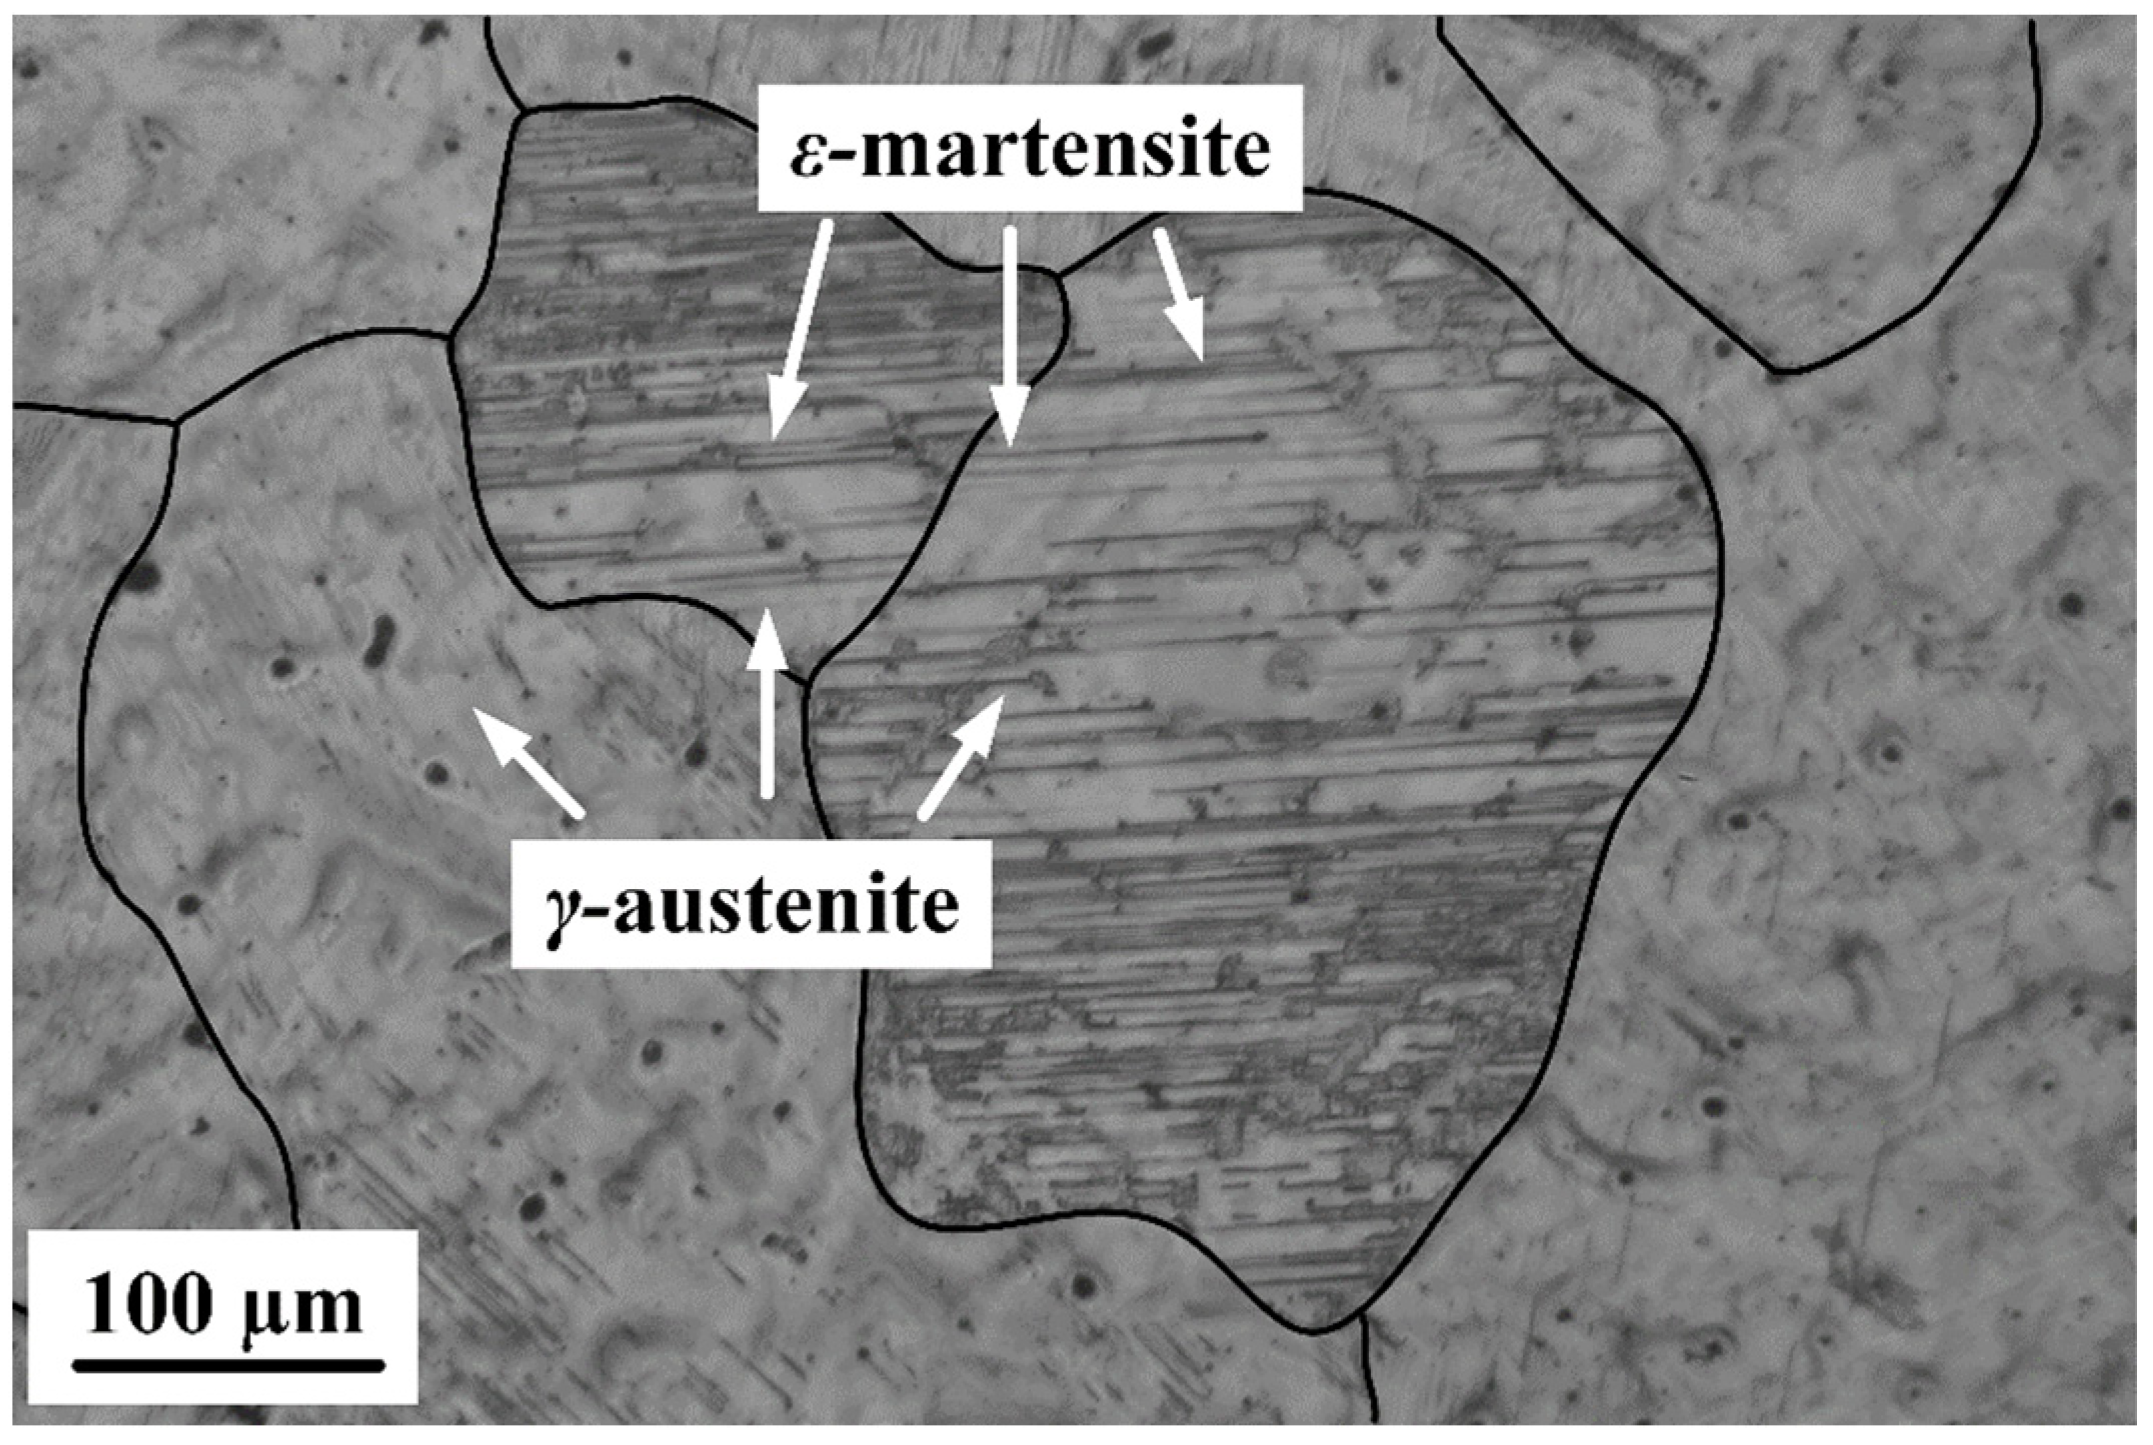
3.1. Microstructure Features

Figure 2 shows the typical grain structure of the Fe-30Mn-5Si alloy after the RHT; the grain boundaries are additionally marked with black lines. The structure consists of γ-austenite grains with an average size of 200–300 μm and ε-martensite plates within the γ-matrix. The optical images taken from various parts of the ingot showed a high degree of grain structure homogeneity, which correspond well with our previous results [10,22,24].
Figure 3 shows the TEM images of the Fe-30Mn-5Si alloy after HPT with total revolution numbers n = 1, 5 and 10, and AccHPT, n = 10. It can be clearly seen from the bright field (BF) and dark field (DF) images (Figure 3a,b) that the HPT, n = 1 results in a predominant submicrocrystalline structure (SMCS) formation with a grain/subgrain size of 150–300 nm, accompanied with a nanocrystalline structure (NCS). The formation of these structures is associated with dynamic polygonization and recrystallization during severe plastic deformation [25,26]. The SAED pattern (Figure 3c) shows the presence of spotted rings and arcs formed by reflexes of SMC and NC structures, and the presence of a two-phase state of parent FCC γ-austenite and cooling- and stress-induced (formed during the HPT) HCP ε-martensites.
Figure 3d–f shows the TEM images and SAED pattern of samples after HPT, n = 5. This treatment also exhibits SMCS with a visually smaller grain/subgrain size and a larger NCS fraction (Figure 3d–f), which is due to the higher number of revolutions. Along with the SMCS and NCS, the initial coarse-grained highly dislocated structure residues are visible (Figure 3e), which were observed after HPT, n = 1 as well. The apparent similarity of n = 1 and n = 5 structures, as well as the partial preservation of the deformed initial coarse-grained structure, are explained by the slippage effect, which was shown in our previous study [11]. The SAED pattern (Figure 3f) is also characterized by spotted rings and arcs formed by reflexes of SMCS and NCS. It worth noting that HPT, n = 5 results in a single-phase state and consists of the stress-induced ε-martensite only. Thus, despite the significant slippage effect, the grain/subgrain size decreases and the volume fraction of stress-induced ε-martensite increases as the number of revolutions increases, and afterwards it dominates n = 5 revolutions. This indicates that the torsion deformation still occurs despite the slippage effect.
The SAED patterns after both HPT, n = 10 and AccHPT, n = 10 consist of reflexes forming spotted rings and arcs formed by stress-induced ε-martensite without reflexes of γ-austenite (Figure 3i,l), whose structure is characterized as NCS (Figure 3g,h,j,k). The NCS after HPT, n = 10 (Figure 3g,h) is characterized by a structure element (grains/subgrains) size of 15–100 nm. Alongside with the NCS, rare remnants of the initial coarse-grained and highly- dislocated structure not involved in the dynamic recrystallization process are still present. The microstructure after the AccHPT, n = 10 (Figure 3j,k) is characterized by the presence of a predominant NCS with a grain size further reduced to 5–40 nm, and without the initial coarse-grained structure remnants.
Figure 4 shows the TEM images of the Fe-30Mn-5Si alloy after AccHPT, n = 10 with subsequent PDA at 500 and 600 °C for 15 min. It is clearly seen from BF and DF images that the samples after AccHPT, n = 10 with subsequent PDA at 500 and 600 °C result in predominant SMCS alongside the NCS. The γ-phase boundaries after PDA at 500 and 600 °C became clearer, so it became possible to carry out a statistical analysis and to calculate the average grain/subgrain size of 160 ± 35 and 195 ± 40 nm, respectively. It is worth noting that PDA results in transitioning the grain/subgrain size from the nanometer range to the submicrometer range as compared to AccHPT, n = 10. This occurs due to the implementation of the collective static recrystallization and grain growth (according to [27]) during PDA at a lesser extent at 500 °C, and a greater extent at 600 °C, as indicated by the larger equiaxed grains/subgrains size as compared to AccHPT, n = 10. The SAED patterns after both AccHPT, n = 10 with subsequent PDA at 500 and 600 °C consist of reflexes forming spotted rings and arcs formed from the FCC γ-austenite and HCP cooling-induced ε-martensite, which is characterized by predominant SMCS alongside the NCS. The appearance of the γ-austenite phase is obviously due to the occurrence of the reverse martensitic transformation εγ during the PDA. It is worth noting that 15 min of annealing at 500 and 600 °C is sufficient for the complete transformation of the stress-induced ε-martensite, formed after the AccHPT, n = 10 (before PDA), into γ-austenite. Moreover, subsequent water quenching results in the formation of the cooling-induced ε-martensite in these samples, which can be due to the “physical” temperature of the forward (γε) martensitic transformation (Msphys), at which the first cooling-induced ε-martensite portions appear. This can be occur above the room temperature, similarly to the RHT mode [24]. HPT and AccHPT decrease the Msphys below the room temperature, as compared to RHT, due to the well-developed dislocation substructure and grain/subgrain refinement. Subsequent PDA results in increasing the Msphys above the room temperature due to the decrease in the overall level of crystal lattice distortion, as a result of the relief of the internal microstresses and the growth of the average grain/subgrain size. It should be emphasized that individual reflexes in the SAED pattern after PDA have a much smaller azimuthal broadening than immediately after AccHPT. The greater perfection of the crystallographic orientation inside individual reflecting objects indicates a lower overall level of lattice distortion in the entire irradiated area. It is noteworthy that the BF (Figure 4a,d) and DF (Figure 4b,e) images were taken from corresponding reflexes marked by circles in Figure 4c,f, for PDA 500 and 600 °C, respectively. In this connection, the γ-austenite and cooling-induced ε-martensite phases are observed in BF and DF images. Thus, the microstructure of the Fe-30Mn-5Si alloy after AccHPT, n = 10 with subsequent PDA at 500 and 600 °C is characterized by the presence of a two-phase state structure of γ-austenite and cooling induced ε-martensite with predominant SMCS alongside the NCS.

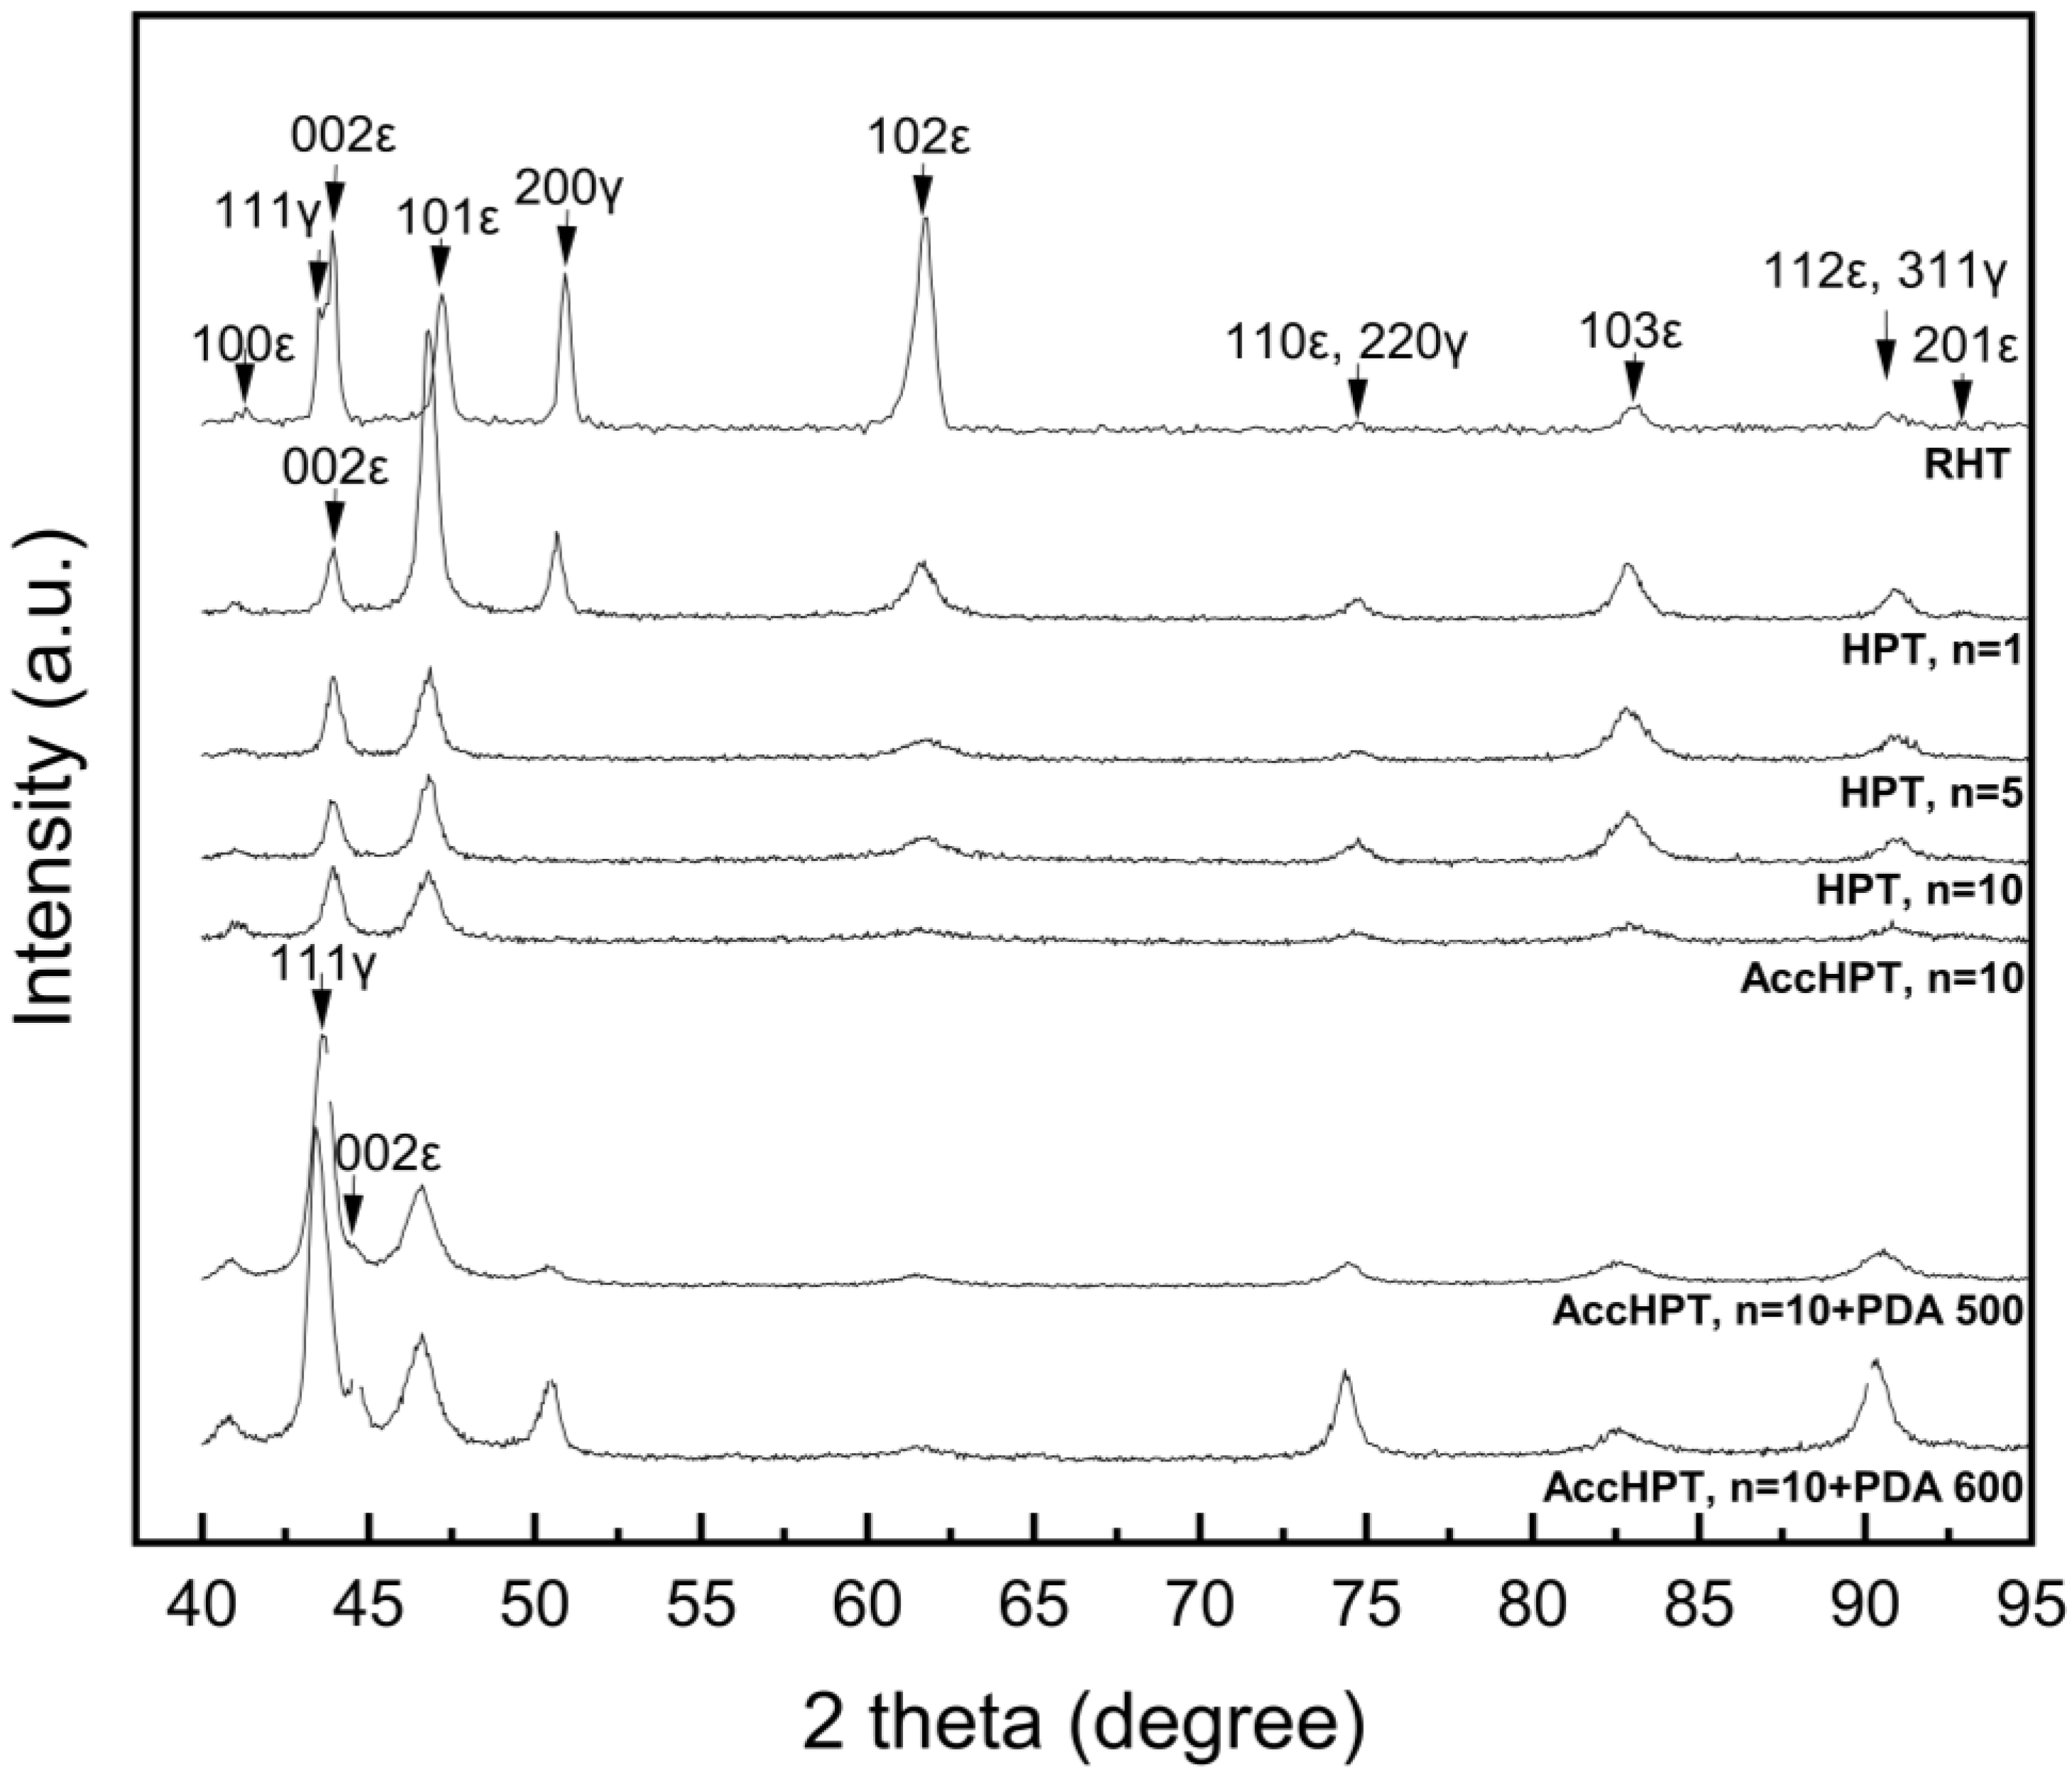
3.2. X-Ray Diffraction Analysis

Figure 5 shows X-ray diffractograms of the Fe-30Mn-5Si alloy after RHT, HPT and AccHPT with subsequent PDA, the latter aimed at forming the two-phase (γ + ε) state, which would presumably increase the biodegradation rate [10,22]. The RHT results in the two-phase state (γ-austenite and cooling-induced ε-martensite). HPT (except HPT, n = 1) and AccHPT produce a single-phase state which comprises deformed cooling-induced ε-martensite and stress-induced ε-martensite, as follows from the disappearance of {200}γ line which is the only γ-phase line free from the superposition of ε-phase lines. The PDA at 500 and 600 °C for 15 min after AccHPT results in the two-phase state indicated by the reappearance of {200}γ and {111}γ lines. The above results correlate well with the TEM results presented in Section 3.1. The PDA at 600 °C results in more γ-austenite than at 500 °C, as follows from the growth of the {200}γ and {111}γ lines intensity. It should be noted that the line located at approximately 43.5 2θ degrees for RHT and AccHPT, n = 10 with subsequent PDA at 500 and 600 C corresponds to the lattice parameter calculated through the interplanar spacing of FCC γ-austenite. In turn, the {002}ε lines located at approximately 43.9–44.5 2θ degrees for all modes belong to the cooling- and stress-induced ε-martensites.
In summary, it can be concluded that the HPT (except HPT, n = 1) and AccHPT, n = 10 produce a single phase state of deformed cooling-induced ε-martensite and stress-induced ε-martensite. Also, AccHPT with subsequent PDA at 500 and 600 C produces the two-phase state of γ-austenite and cooling-induced ε-martensite. These trends correlate well with the results of the TEM microstructure studies. We should bear in mind that the presence of only one overlapping-free {200}γ austenite line does not allow for an accurate quantitative analysis of the two-phase state of the alloy.
When discussing the results of measuring the X-ray line width during complex changes in the structural-phase state, it is necessary to take into account the complex effects of various factors changing in the course of level of crystal lattice distortion, i.e., the complex combination of microstrain fields induced by individual dislocations and their tangles, low-angle boundaries (subboundaries), high angle boundaries (grain boundaries, intercrystalline boundaries), interphase boundaries and other deformation- and transformation- induced microstresses. Thus, it is reasonable to consider the overall level of distortion of the alloy lattice determined by the combined effect of microstress fields from sources of a different nature, rather than trying to separate this overall distortion into contributions from specific stress fields.
Table 1 lists the half-height width Bhkl of the X-ray diffraction lines after RHT, HPT and AccHPT with subsequent PDA. It is shown that the HPT leads to the distinct line broadening, with the largest Bhkl obtained after the largest number of revolutions, caused by maximum grain/subgrain refinement and lattice distortion level. The broadest lines are observed after AccHPT, n = 10, associated with predominant NCS. The PDA at 500 and 600 °C leads to a slight decrease in Bhkl values. This change in the X-ray line width can be explained by the following competition between two trends: the line narrowing due to grain/subgrain growth and relaxation of lattice distortion as a result of static recovery poligonization and recrystallization, while the line broadening due to lattice distortion increases as a result of the development of interphase and intercrystalline elastic interaction during cooling-induced martensitic transformation [28].
Thus, TEM and XRD analyses show that an increase is strain of the Fe-30Mn-5Si alloy with an increase in the number of revolutions during HPT from n = 1 to 10 and then after the transition to AccHPT with n = 10 is accompanied by the following structure and phase changes: (1) grain and subgrain refinement and gradual transition of their size from the submicrometer range to the nanometer range; (2) transition from the “γ-austenite + cooling-induced ε-martensite” two-phase state to the single-phase structure “deformed cooling- and stress-induced ε-martensites” single-phase state. The post-deformation annealing after AccHPT, n = 10 is accompanied by εγ and then partial γε martensitic transformation during cooling and formation of two-phase state of γ-austenite and cooling- induced ε-martensite. These trends correlate well with the Vickers hardness measurement results shown in Figure 5.

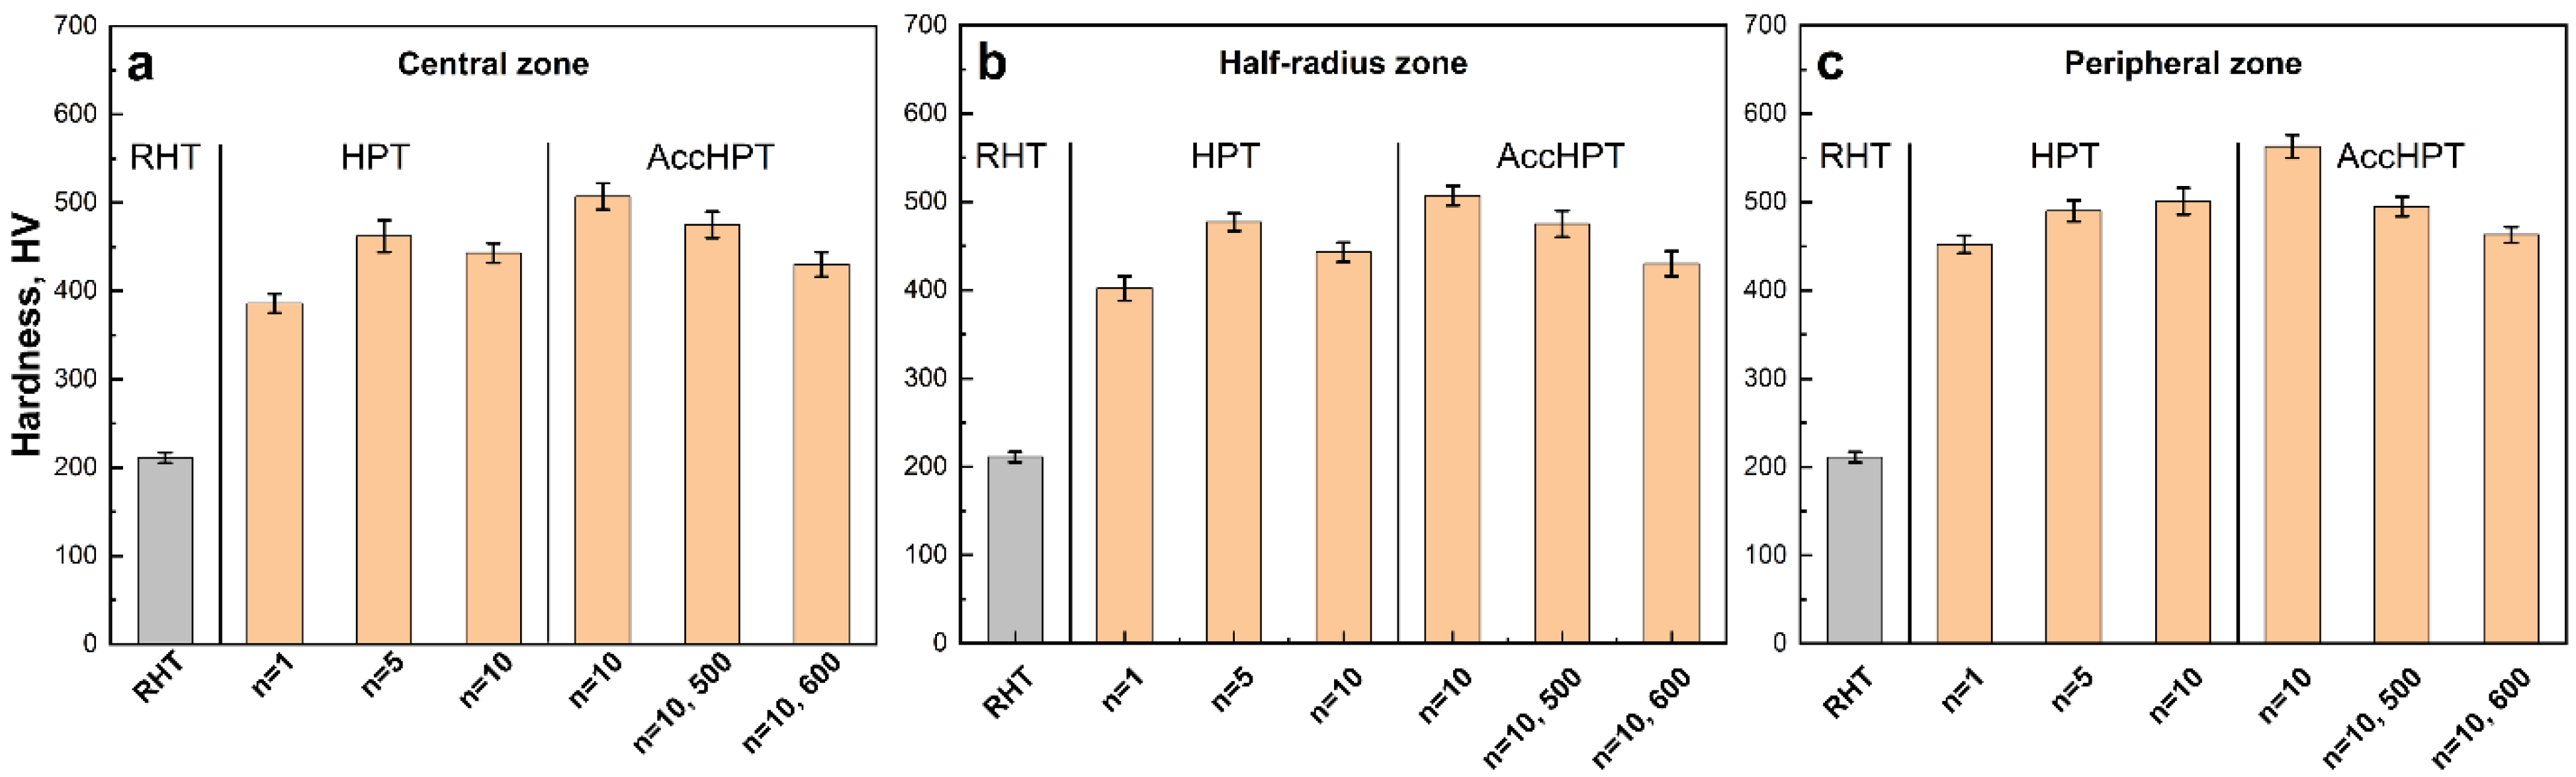
3.3. Hardness Measurements

The assessment of mechanical properties after various HPT treatments only using microhardness measurements was due to the small size of the samples, which meant they were not appropriate for other kinds of mechanical tests.
Figure 6 shows the hardness measurement results for the Fe-30Mn-5Si alloy after RHT, HPT, AccHPT and AccHPT with subsequent PDA, measured in the central, half-radius and peripheral zones. The HPT results in a significant increase in hardness in each studied zone as compared to RHT, rising from approximately 200 HV to 500 HV. This behavior is attributed to the formation of mixed SMCS and NCS after HPT, n = 1 and n = 5 and predominant NCS after HPT, n = 10 (see Figure 3), along with an increase in the overall lattice distortion level and grain/subgrain refinement. Notably, the difference in hardness values between the HPT, n = 5 and n = 10 is negligible within the error limits, in contrast to the difference between n = 1 and n = 5, which is due to the slippage effect more evident upon the increasing number of revolutions. The subsequent hardening up to approximately 560 HV is observed in the samples after AccHPT, n = 10, which is evidently due to the absence of pronounced slippage, the formation of the predominant NCS with average grain size ranging from 5 to 40 nm and the highest level of the lattice distortion. The subsequent PDA only slightly decreases the hardness, more so for 600 °C and less for 500 °C, due to the static recovery and polygonization processes in γ-austenite and two-phase mixture formation during annealing, while the microhardness still remains high enough. It should be noted that the hardness values measured for each studied zone (central zone, half-radius zone, peripheral zone) are approximately the same within the error limits, which indicates a uniform strain distribution during the HPT and AccHPT process.

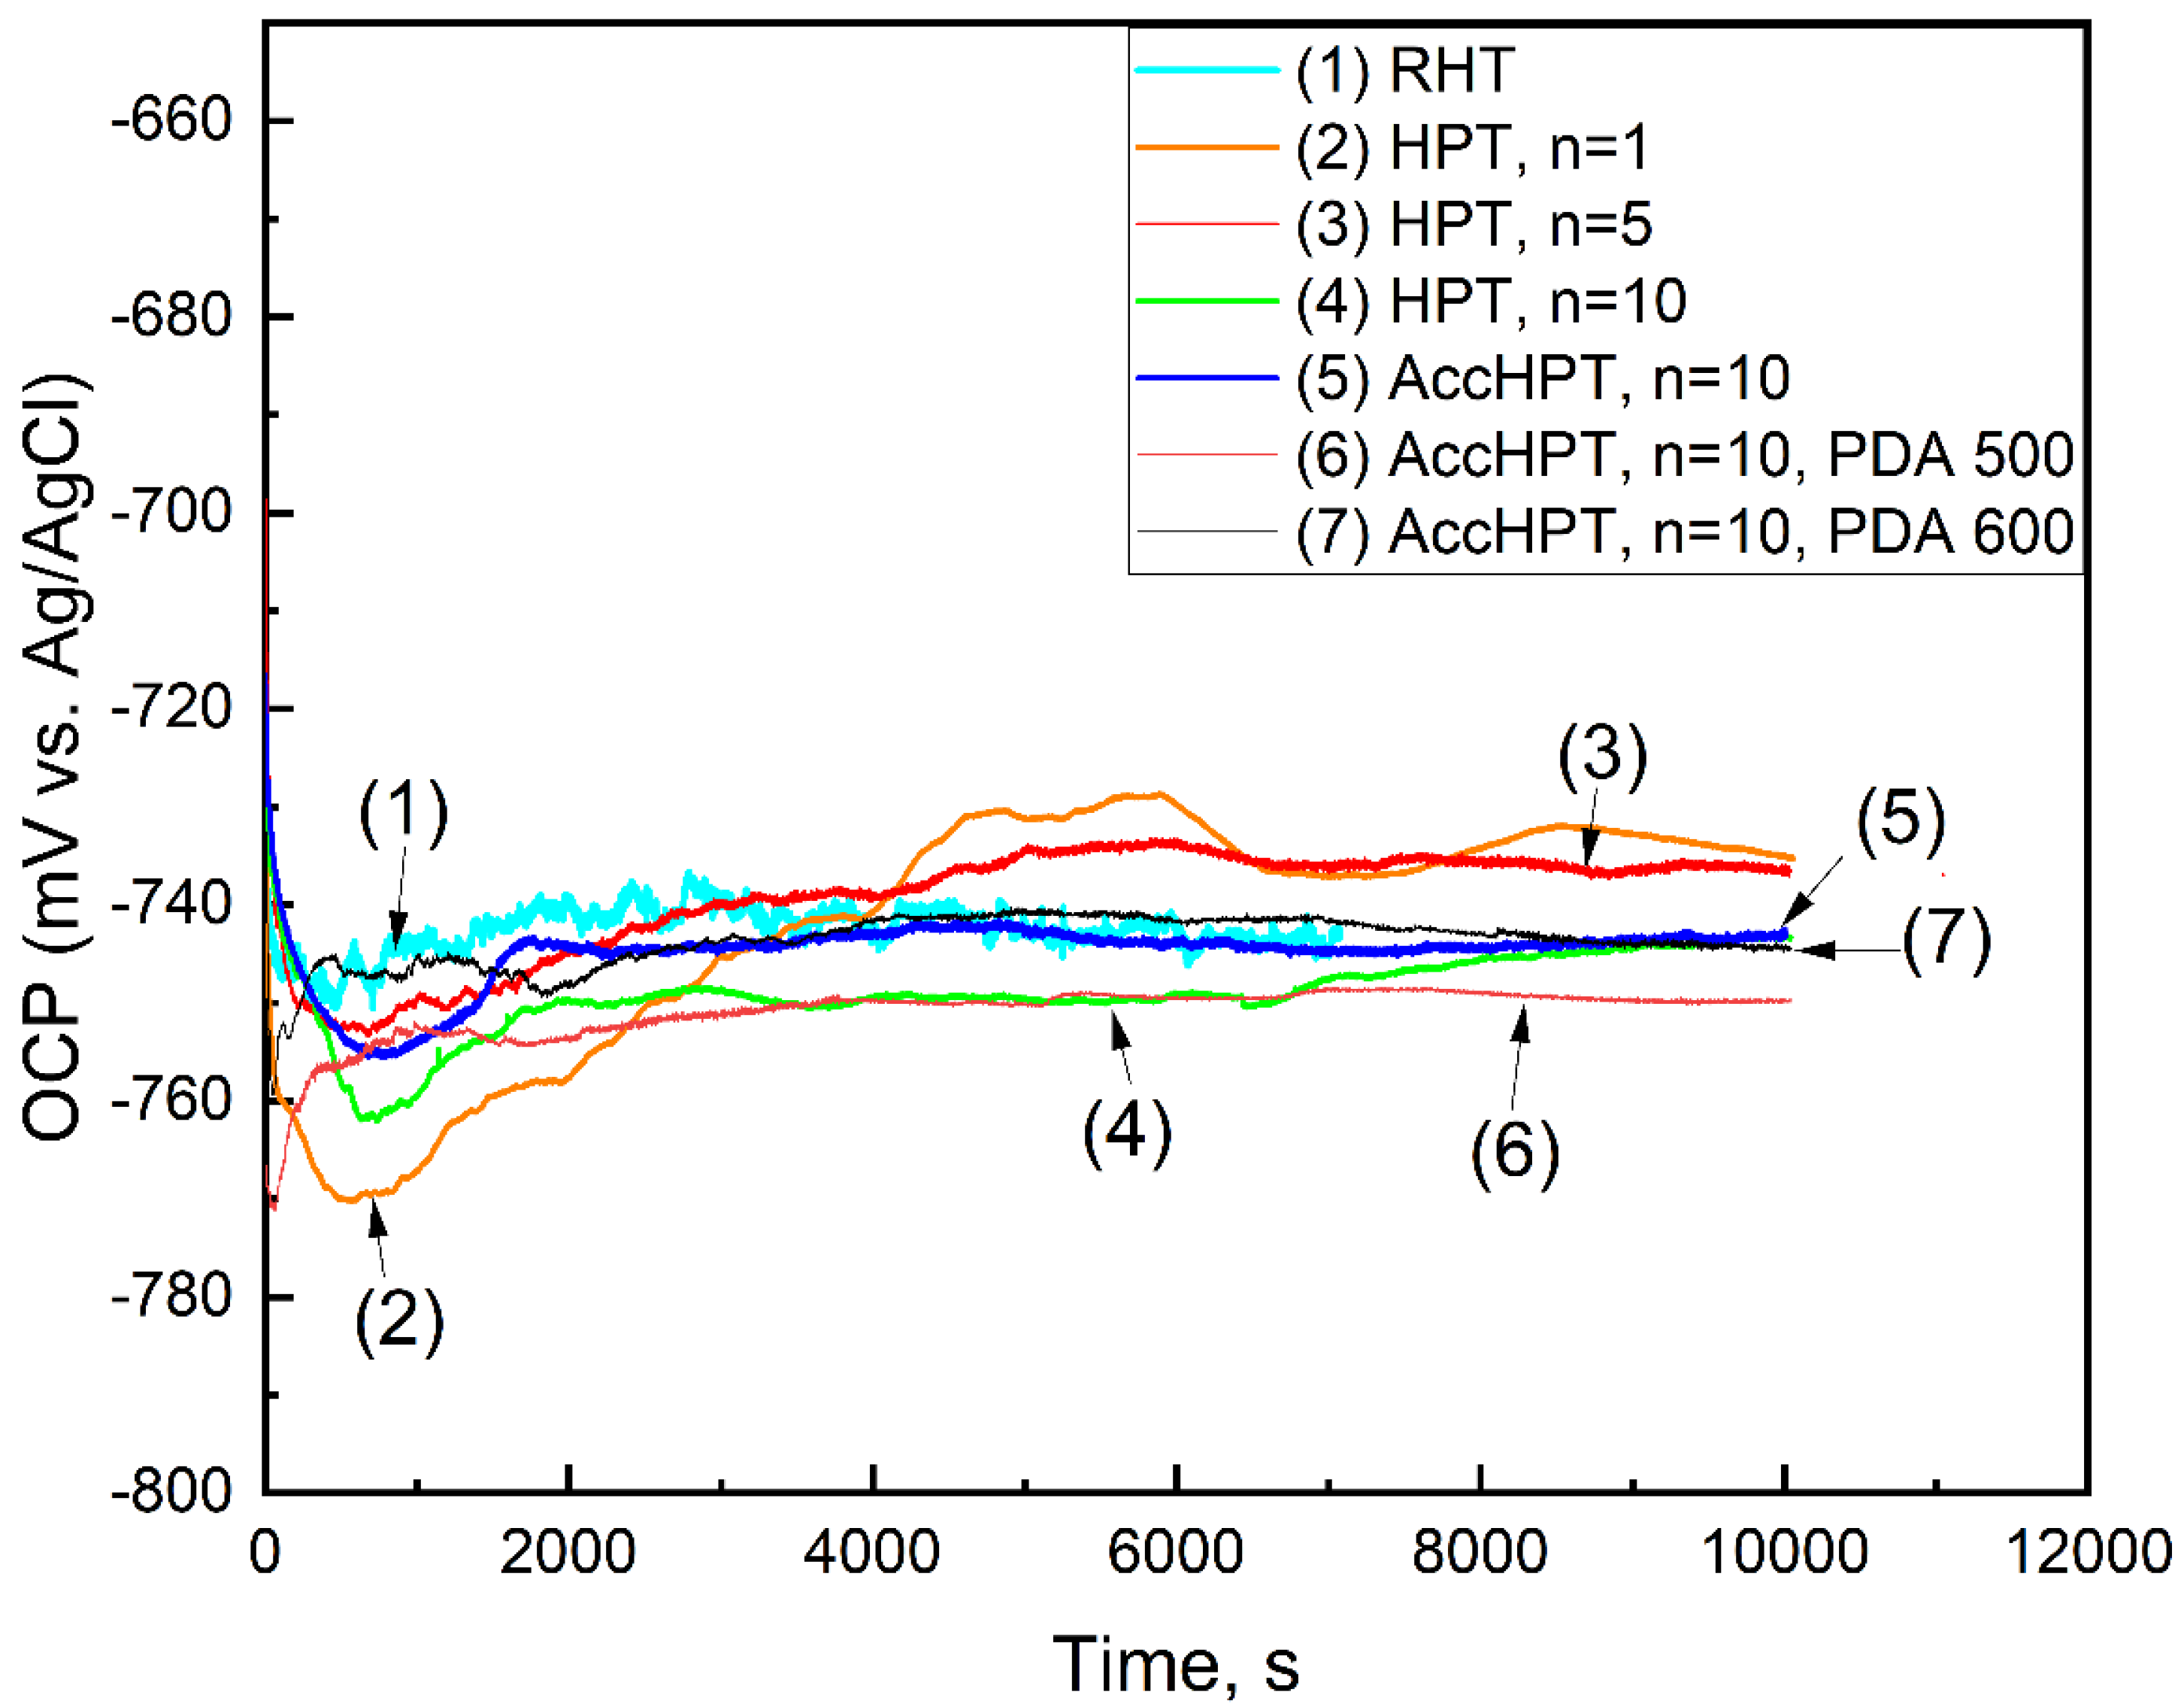
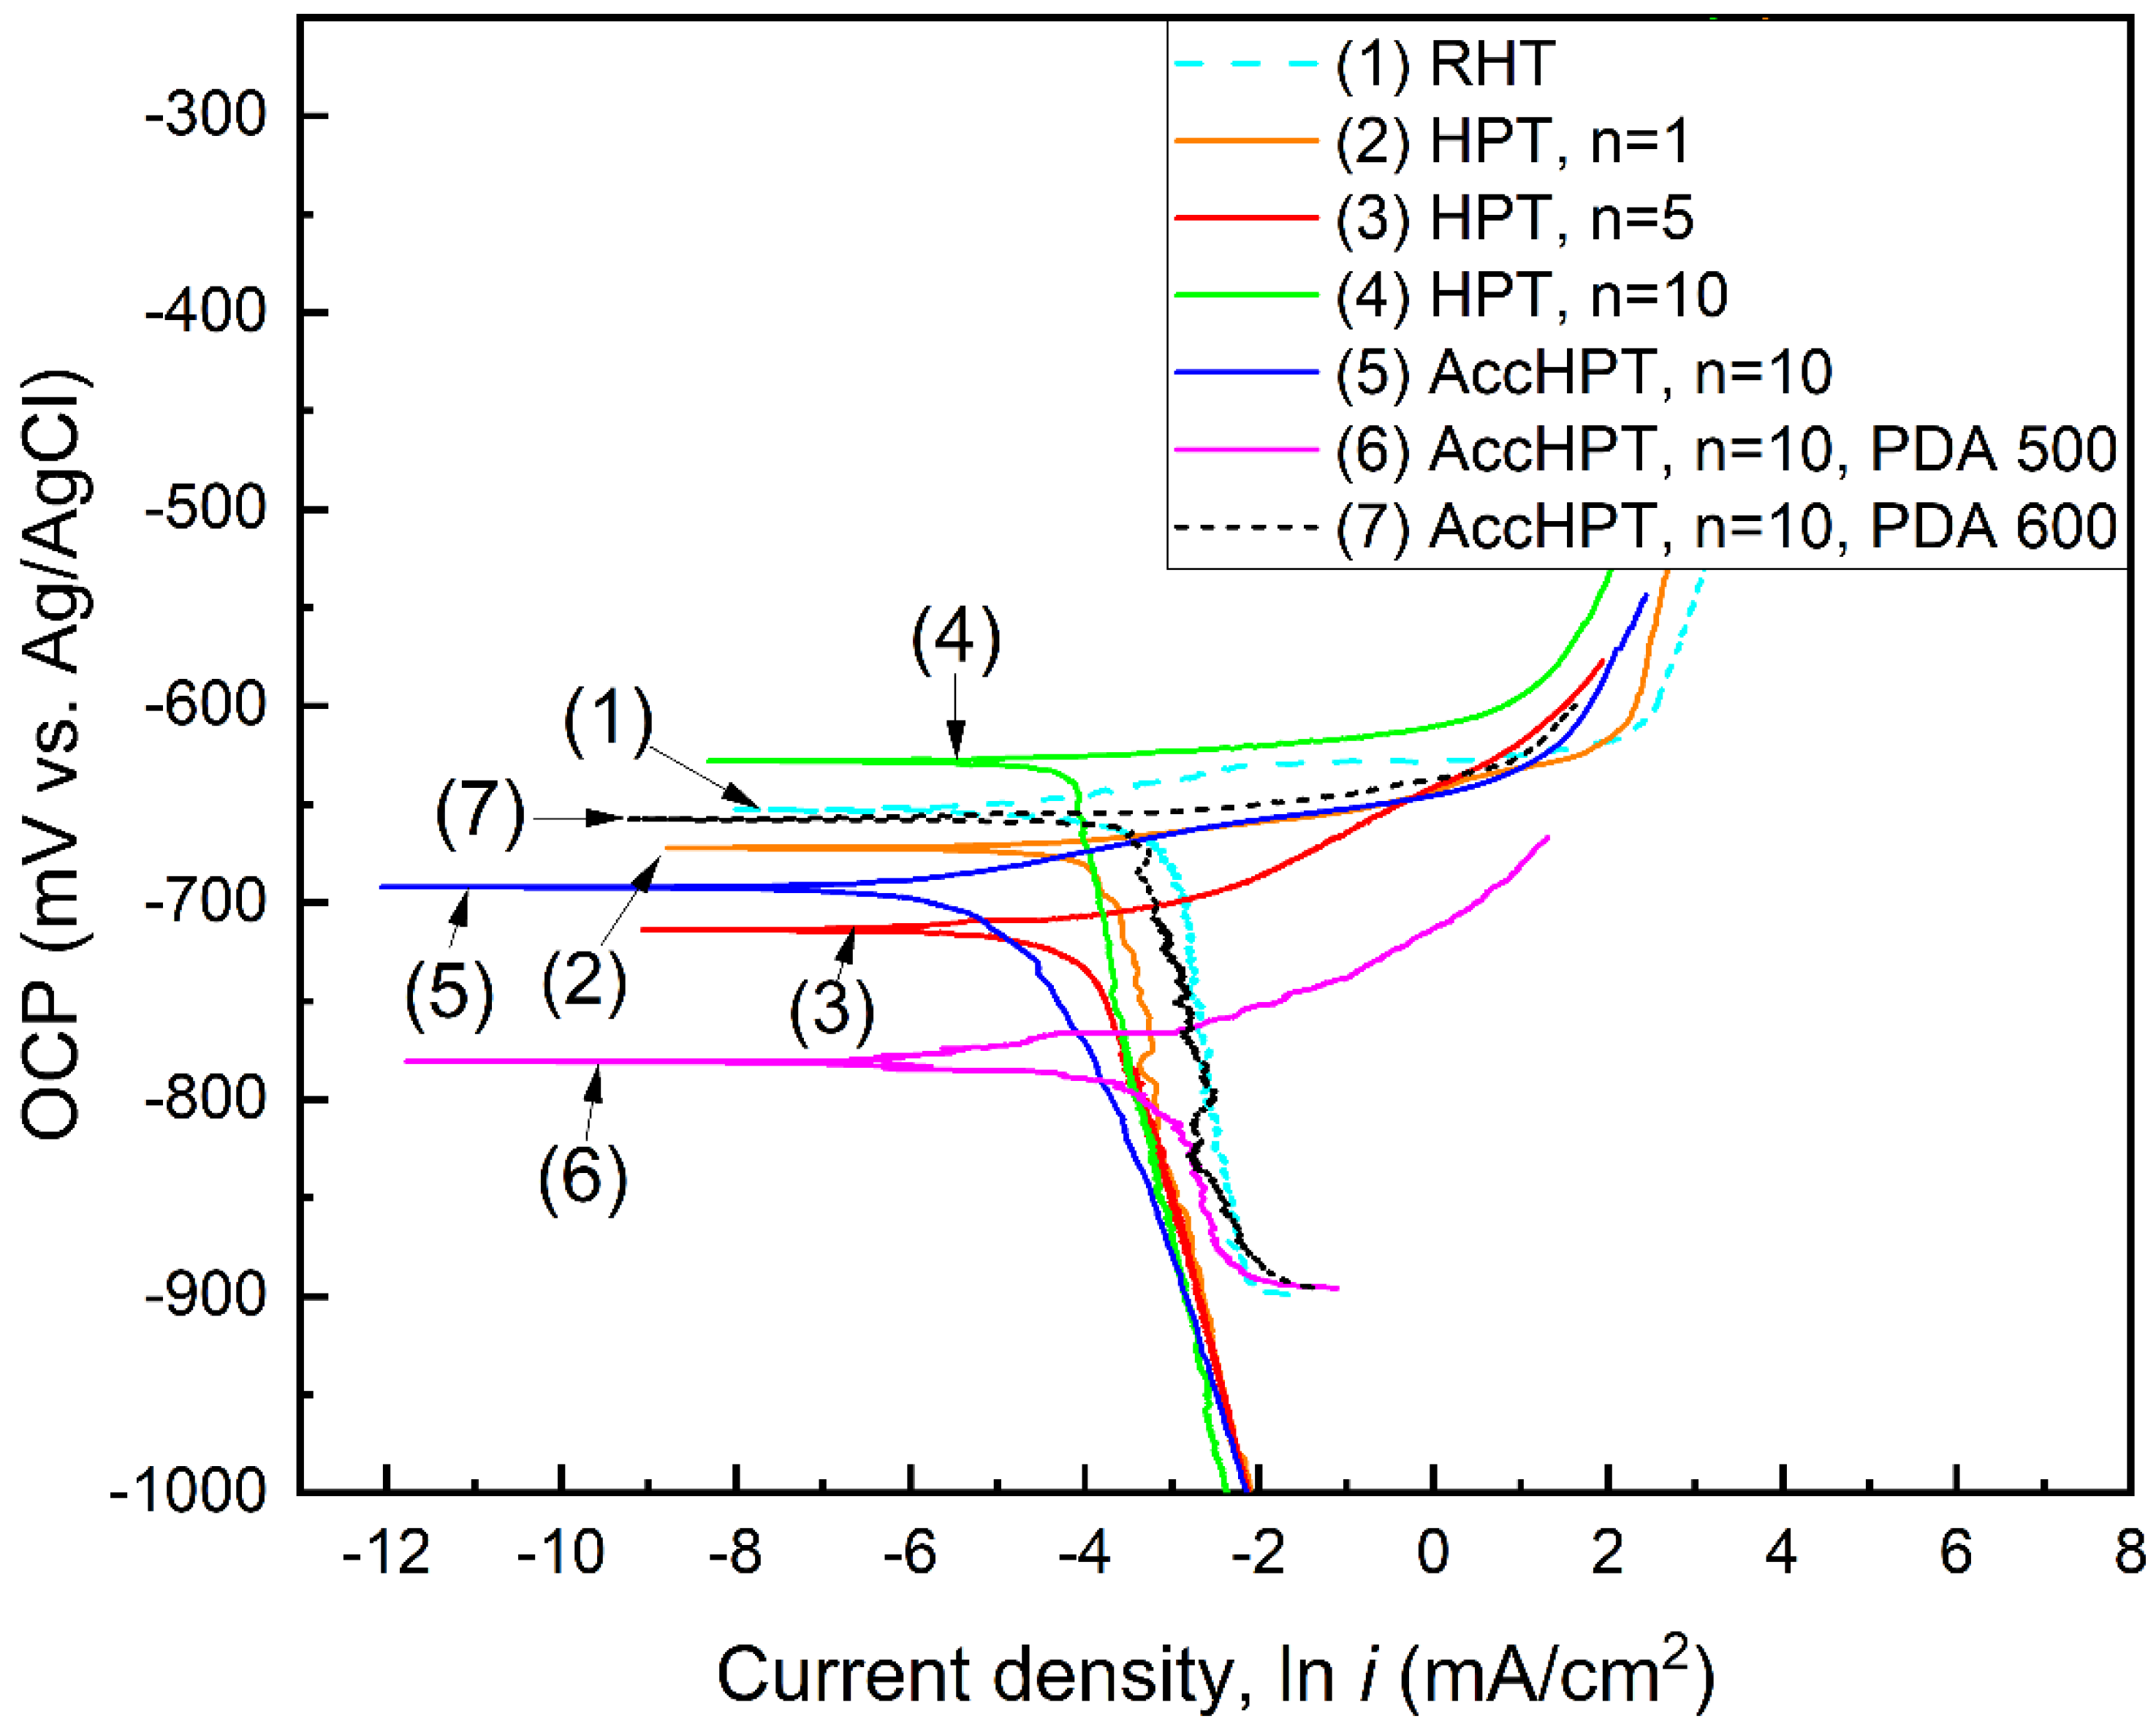
3.4. Electrochemical Characterization

The biodegradation rate is the principal functional property for biodegradable alloys. It is structure-sensitive and therefore can be controlled by applying the TMT [29]. The biodegradation rate is influenced by the presence of crystal lattice defects such as grain/subgrain boundaries and a high level of lattice distortion, as well as the two-phase state introducing effective galvanic coupling on the surface [22]. In this regard, the electrochemical behavior of the Fe-30Mn-5Si alloy after RHT, HPT, AccHPT and AccHPT with subsequent PDA with different phase and structural features was studied. Figure 7 and Figure 8 show the OCP curves and polarization diagrams for the Fe-30Mn-5Si alloy after RHT, HPT, AccHPT and AccHPT with subsequent PDA, and Table 2 summarizes the results obtained.
The kinetics of OCP variation is typical for the Fe-30Mn-5Si alloy described in detail in our previous study [22], with the steady-state values ranging from −750 to −735 mV. As shown in Figure 7, for all samples, the cathodic polarization (downward OCP shift) is observed at the initial stage (approximately 800 s) of exposure, which is due to the active dissolution of the studied alloy. After that, anodic polarization takes place until the steady-state OCP values are established (approximately 3000 s). This stage is associated with the formation of a corrosion product layer inhibiting electrolyte access to the surface, which results in the upward OCP shift.
The steady-state OCP values of the samples after HPT for n = 1 and n = 5 are higher compared to those of RHT, indicating the decrease in corrosion activity, which can be explained by the single-phase state of stress-induced ε-martensite formed after these treatments. It is noteworthy that in Fe-30Mn-5Si alloy the γ-austenite acts as the cathodic structural component, while ε-martensite is the anodic one. The small amount or the absence of γ-austenite leads to cathodic process overvoltage, limiting the overall corrosion (biodegradation) rate and resulting in a more positive OCP value. The OCP values of the samples after HPT, n = 10 and AccHPT, n = 10 are in the same region as those for RHT. This behavior can be attributed to the presence of a mixture of SMCS and NCS in both HPT, n = 10 and AccHPT, n = 10 (see Figure 3). It is well known that the development of crystal lattice defects (grain/subgrain boundaries and dislocation density) leads to a negative shift in the OCP values [22,23]. In this regard, the presence of a mixture of SMCS and NCS after the HPT and AccHPT, n = 10 compensates for the absence of the cathodic structural component (γ-austenite) and results in similar OCP values. The PDA at 500 and 600 °C after AccHPT, n = 10 results in a slight shift in the OCP values towards the negative values presumably due to with the two-phase state structure within the predominant SMCS.
For a more precise assessment of the biodegradation rate using Equation (1) in accordance with [8], it is necessary to determine the corrosion current densities by extrapolating the Tafel regions of the polarization curves (Figure 8); the calculation results are listed in Table 2.
The anodic (upper) and cathodic (lower) branches of the polarization diagrams correspond to the metal dissolution reaction (Fe − 2e → Fe2+-anodic reaction) and the depolarization reaction involving oxygen (2H2O + O2 + 4e → 4OH-cathodic reaction), respectively. For all the studied samples, the significant slope of the cathodic branch is observed, indicating the cathodic control of the corrosion process and implying the slow rate of the cathodic reaction due to the inhibited oxygen ionization (O2 + e → O2) sub-reaction [22]. The HPT, n = 1, n = 5, n = 10, and AccHPT, n = 10 decrease the biodegradation rate as compared to RHT, which is explained by the predominantly single-phase state (see Figure 5) strictly reducing the cathodic reaction sites (γ-austenite regions), and therefore impeding the overall corrosion rate [10,22]. Remarkably, the biodegradation rate of both of HPT and AccHPT samples decreases as the n value increases, which can be explained by the inhibition of the corrosion process by corrosion products, which form more rapidly due to the increased surface energy associated with high level of lattice distortion. The PDA of the two-phase state after AccHPT, n = 10 significantly increases the biodegradation rate from 0.14 (AccHPT, n = 10) to 0.42 (AccHPT, n = 10 with PDA at 500 °C) and 0.47 (AccHPT, n = 10 with PDA at 600 °C) mm/year, which is caused by higher volume fraction of cathodic γ-austenite. The presence of a two-phase state, namely the appearance and subsequent increase in the γ-austenite at PDA at 500 and 600 °C, respectively, facilitates the cathodic process, lowers its overvoltage, thus consequently accelerating the anodic dissolution of the cooling-induced ε-martensite. Based on the analysis of the results obtained, one can recommend AccHPT with subsequent PDA at 500 and 600 °C for achieving the optimal combination of mechanical properties and biodegradation rate.

3.5. Biodegradation Rate: Contributing Factors

Table 3 compares various structure and phase states of the Fe-30Mn-5Si alloy after RHT, HPT, AccHPT and AccHPT with PDA at 500 and 600 °C with the corresponding biodegradation rates. Based on the structure, phase and stress state characterization presented in Table 3, it is possible to identify the main factors affecting the biodegradation rate and, accordingly, to estimate their roles in its changes. It is seen from Table 3 that the RHT mode provides the two-phase state of recrystallized γ-austenite with coarse-grained structure and cooling-induced ε-martensite. Due to high temperature annealing at 900 °C for 1 h with subsequent water cooling (see Section 2), this mode is characterized by a low lattice distortion level and provides a very high biodegradation rate of 0.6 mm/year. The subsequent HPT with n = 1 revolutions provides predominantly plastically deformed cooling-induced and stress-induced ε-martensites with some amount of plastically deformed γ-austenite (see Figure 5), which was not involved in the stress-induced ε-martensite formation process due to an insufficient accumulated HPT strain. The grain/subgrain structure after HPT, n = 1 is characterized by predominantly SMCS alongside NCS and areas with high lattice distortion level. However, despite the high lattice distortion level, this mode results in a decrease in the biodegradation rate from 0.60 to 0.27 mm/year.
Thus, it can be concluded that the main factor increasing the biodegradation rate is the two-phase state, while the grain/subgrain refinement and the high lattice distortion level are secondary factors. This conclusion is confirmed by the following corrosion behavior after other thermomechanical treatments. HPT, n = 5, n = 10, and AccHPT, n = 10 lead to the transition of the Fe-30Mn-5Si alloy into a single-phase state of plastically deformed cooling-induced and stress-induced ε-martensites, with predominant SMCS for HPT, n = 5, and predominant NCS for HPT, n = 10 and AccHPT, n = 10, respectively. Alongside these structures, HPT, n = 5 leads to the formation of high dislocation density and high stress level. In addition, HPT, n = 10 and AccHPT, n = 10 result in a very high lattice distortion level. However, as can be seen from Table 3, the biodegradation rate is lower as compared to the two-phase state for RHT and HPT, n = 1 modes. In this connection, the biodegradation rate for HPT, n = 1 is higher than that of HPT, n = 5, n = 10, and AccHPT, n = 10 due to some amount of γ-austenite in the two-phase state. It should be noted that the high lattice distortion level for HPT, n = 5, n = 10, and AccHPT, n = 10 were assessed by the broadening of X-ray diffraction lines (see Table 1).
Subsequent PDA after AccHPT, n = 10 results in the formation of a two-phase state of recrystallized SMCS of γ-austenite and cooling-induced ε-martensite, despite the lower lattice distortion level as compared to HPT, n = 5, n = 10, and AccHPT, n = 10, and, as can be seen, results in an increase in the biodegradation rate up to 0.47 mm/year. This observation confirms the general conclusion that the main factor for increasing the biodegradation rate of the Fe-30Mn-5Si alloy is the presence of a two-phase state facilitating the microgalvanic corrosion favorable for accelerated the biodegradation [30,31,32,33]. The results obtained correlate well with our previous studies [10,22]. Moreover, the present data correlate well with other studies of the Fe-Mn-Si alloy, which also contains a single-phase state and consequently results in a low biodegradation rate in the range of 0.21–0.25 mm/year [34]. It should be noted that a further increase in the PDA temperature could lead to a greater increase in the average grain/subgrain size, which, in its turn, would not allow maintaining a high level of mechanical properties.
Based on the analysis of electrochemical parameters obtained for all studied structure and phase conditions, it was established that the determinant factor of increasing the biodegradation rate is the presence of two-phase state. These research findings provide a new insight into controlling functional properties for the Fe-Mn-Si alloys without additional alloying. Due to the small size of the samples after HPT, the practical application of the method is extremely limited. However, the obtained structure–property relation patterns can be further used to achieve the high biodegradation rate of the bulk semi-products obtained by large-scale TMT methods suitable for the industrial implant production.

4. Conclusions

In the present study, the conventional HPT (HPT) and AccHPT were applied to a biodegradable Fe-30Mn-5Si alloy. The resulting microstructure, phase composition, microhardness and electrochemical behavior data allow the following conclusions:
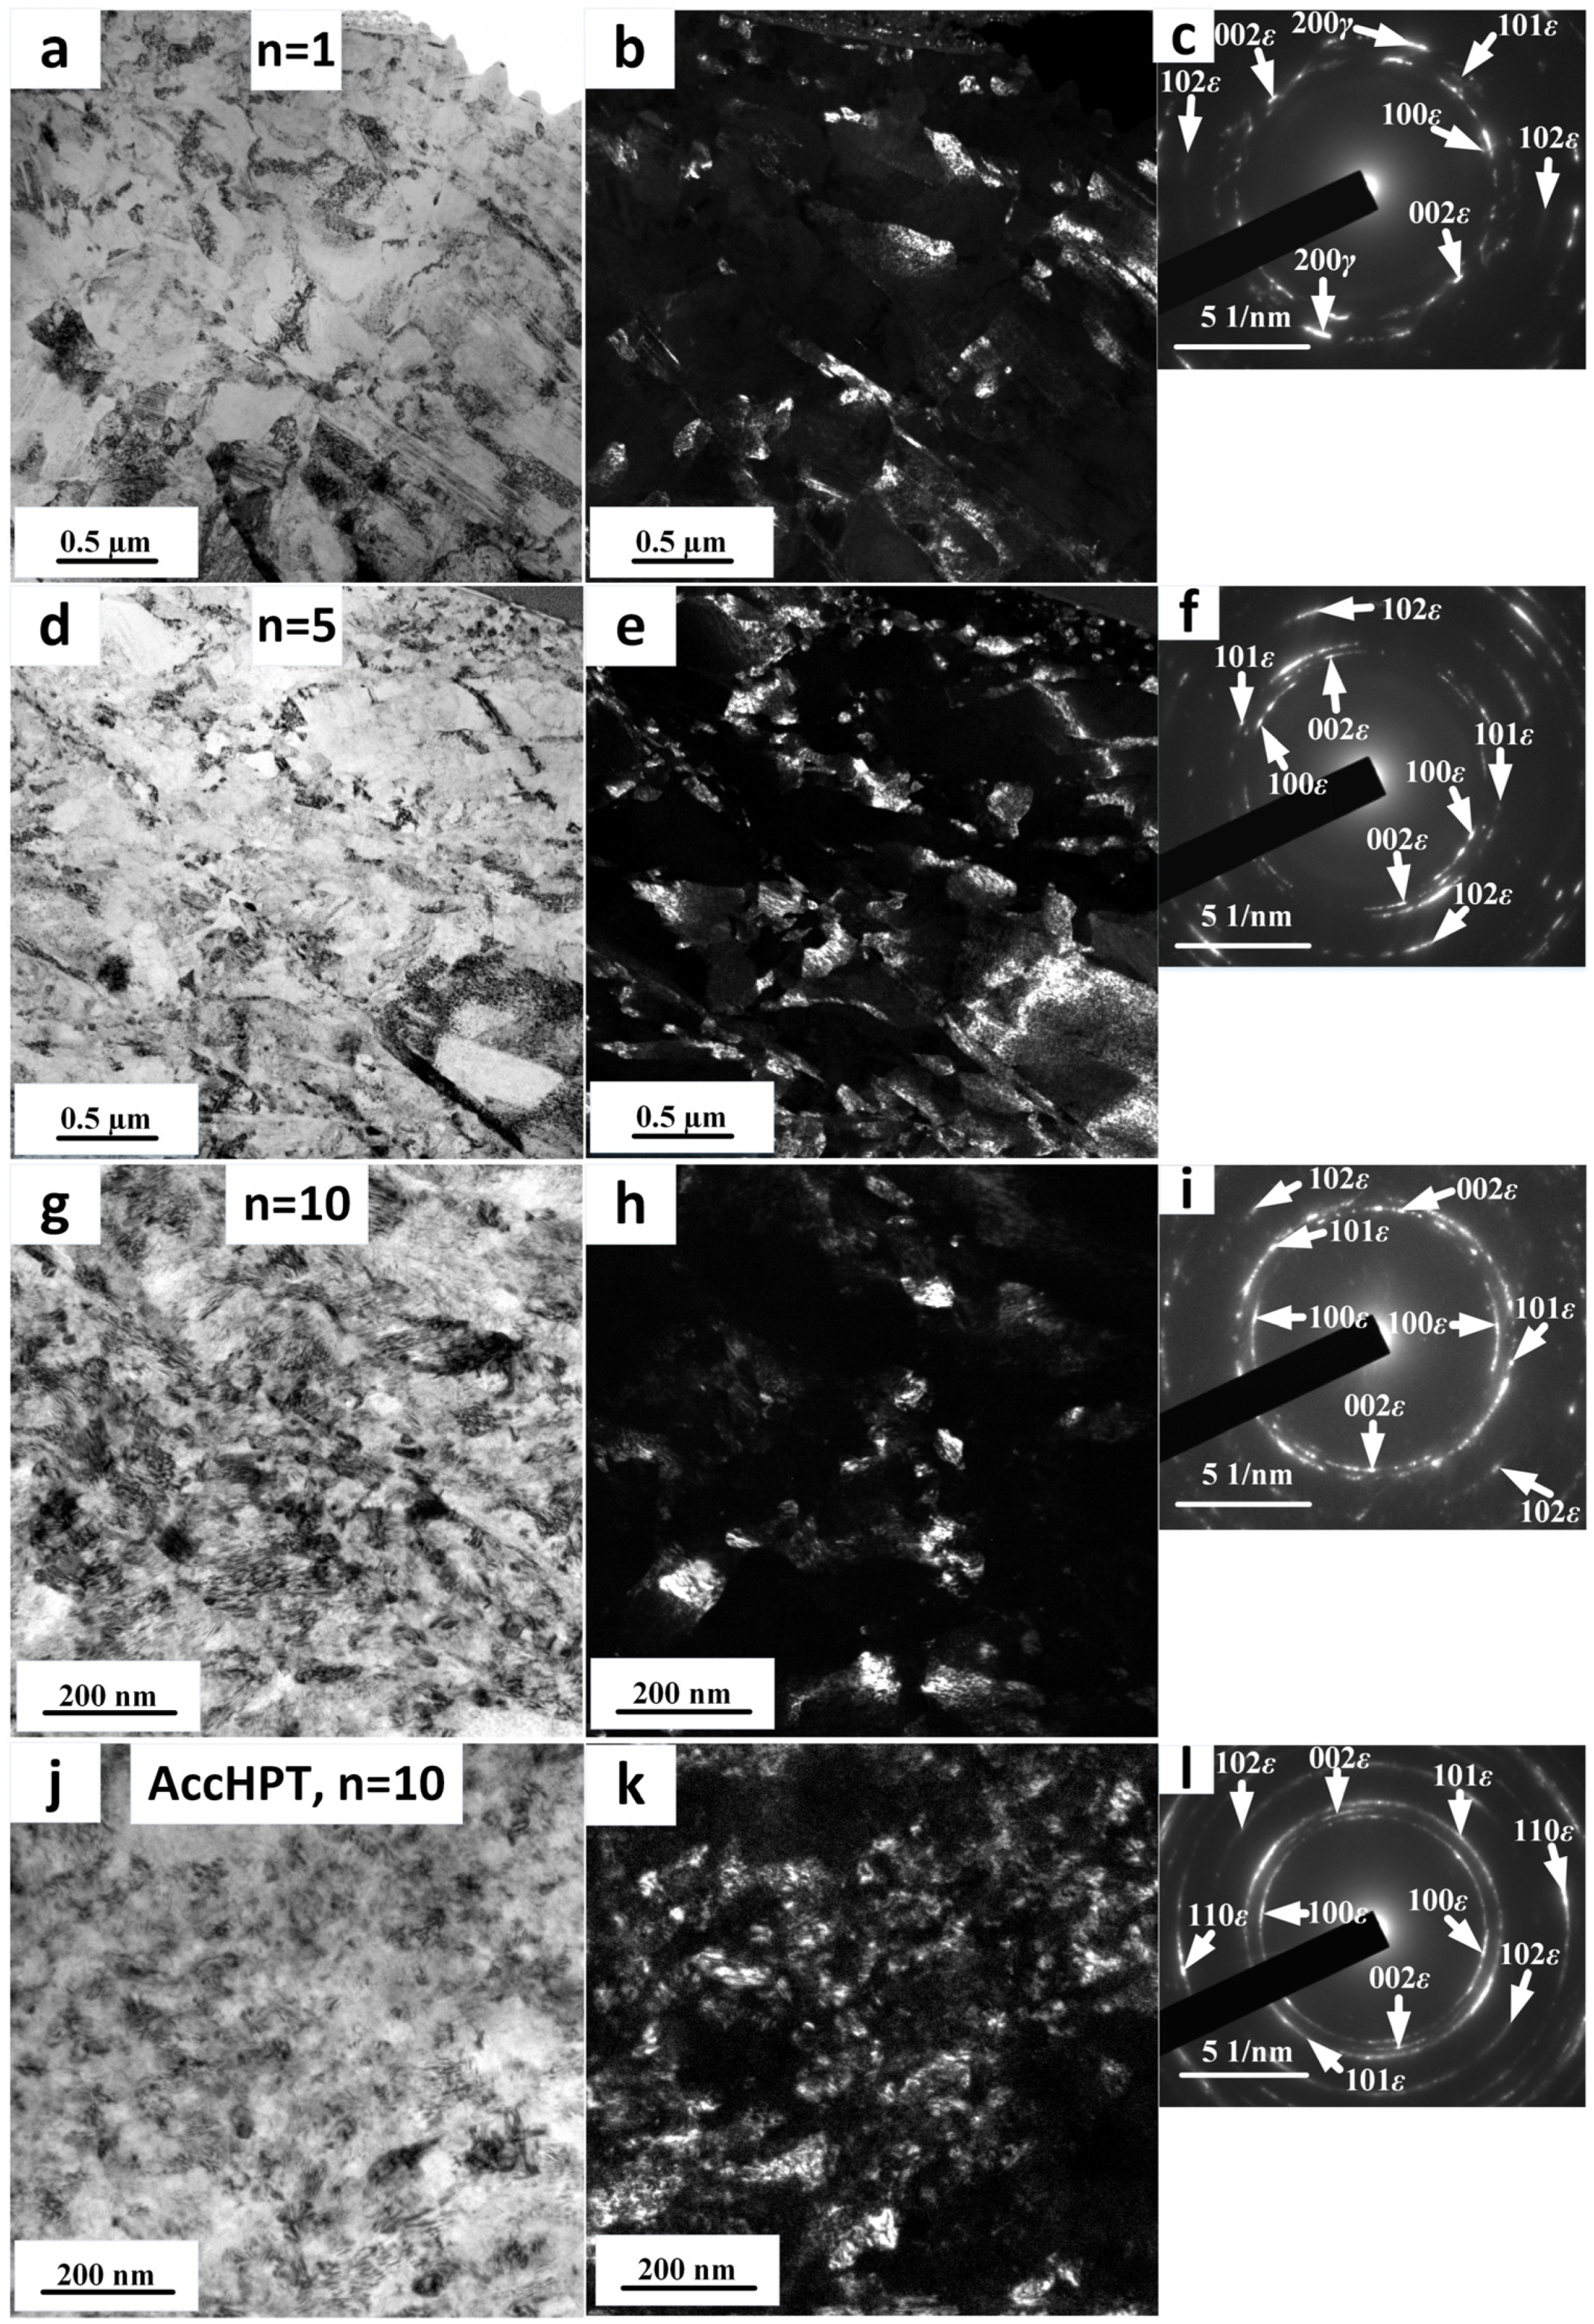
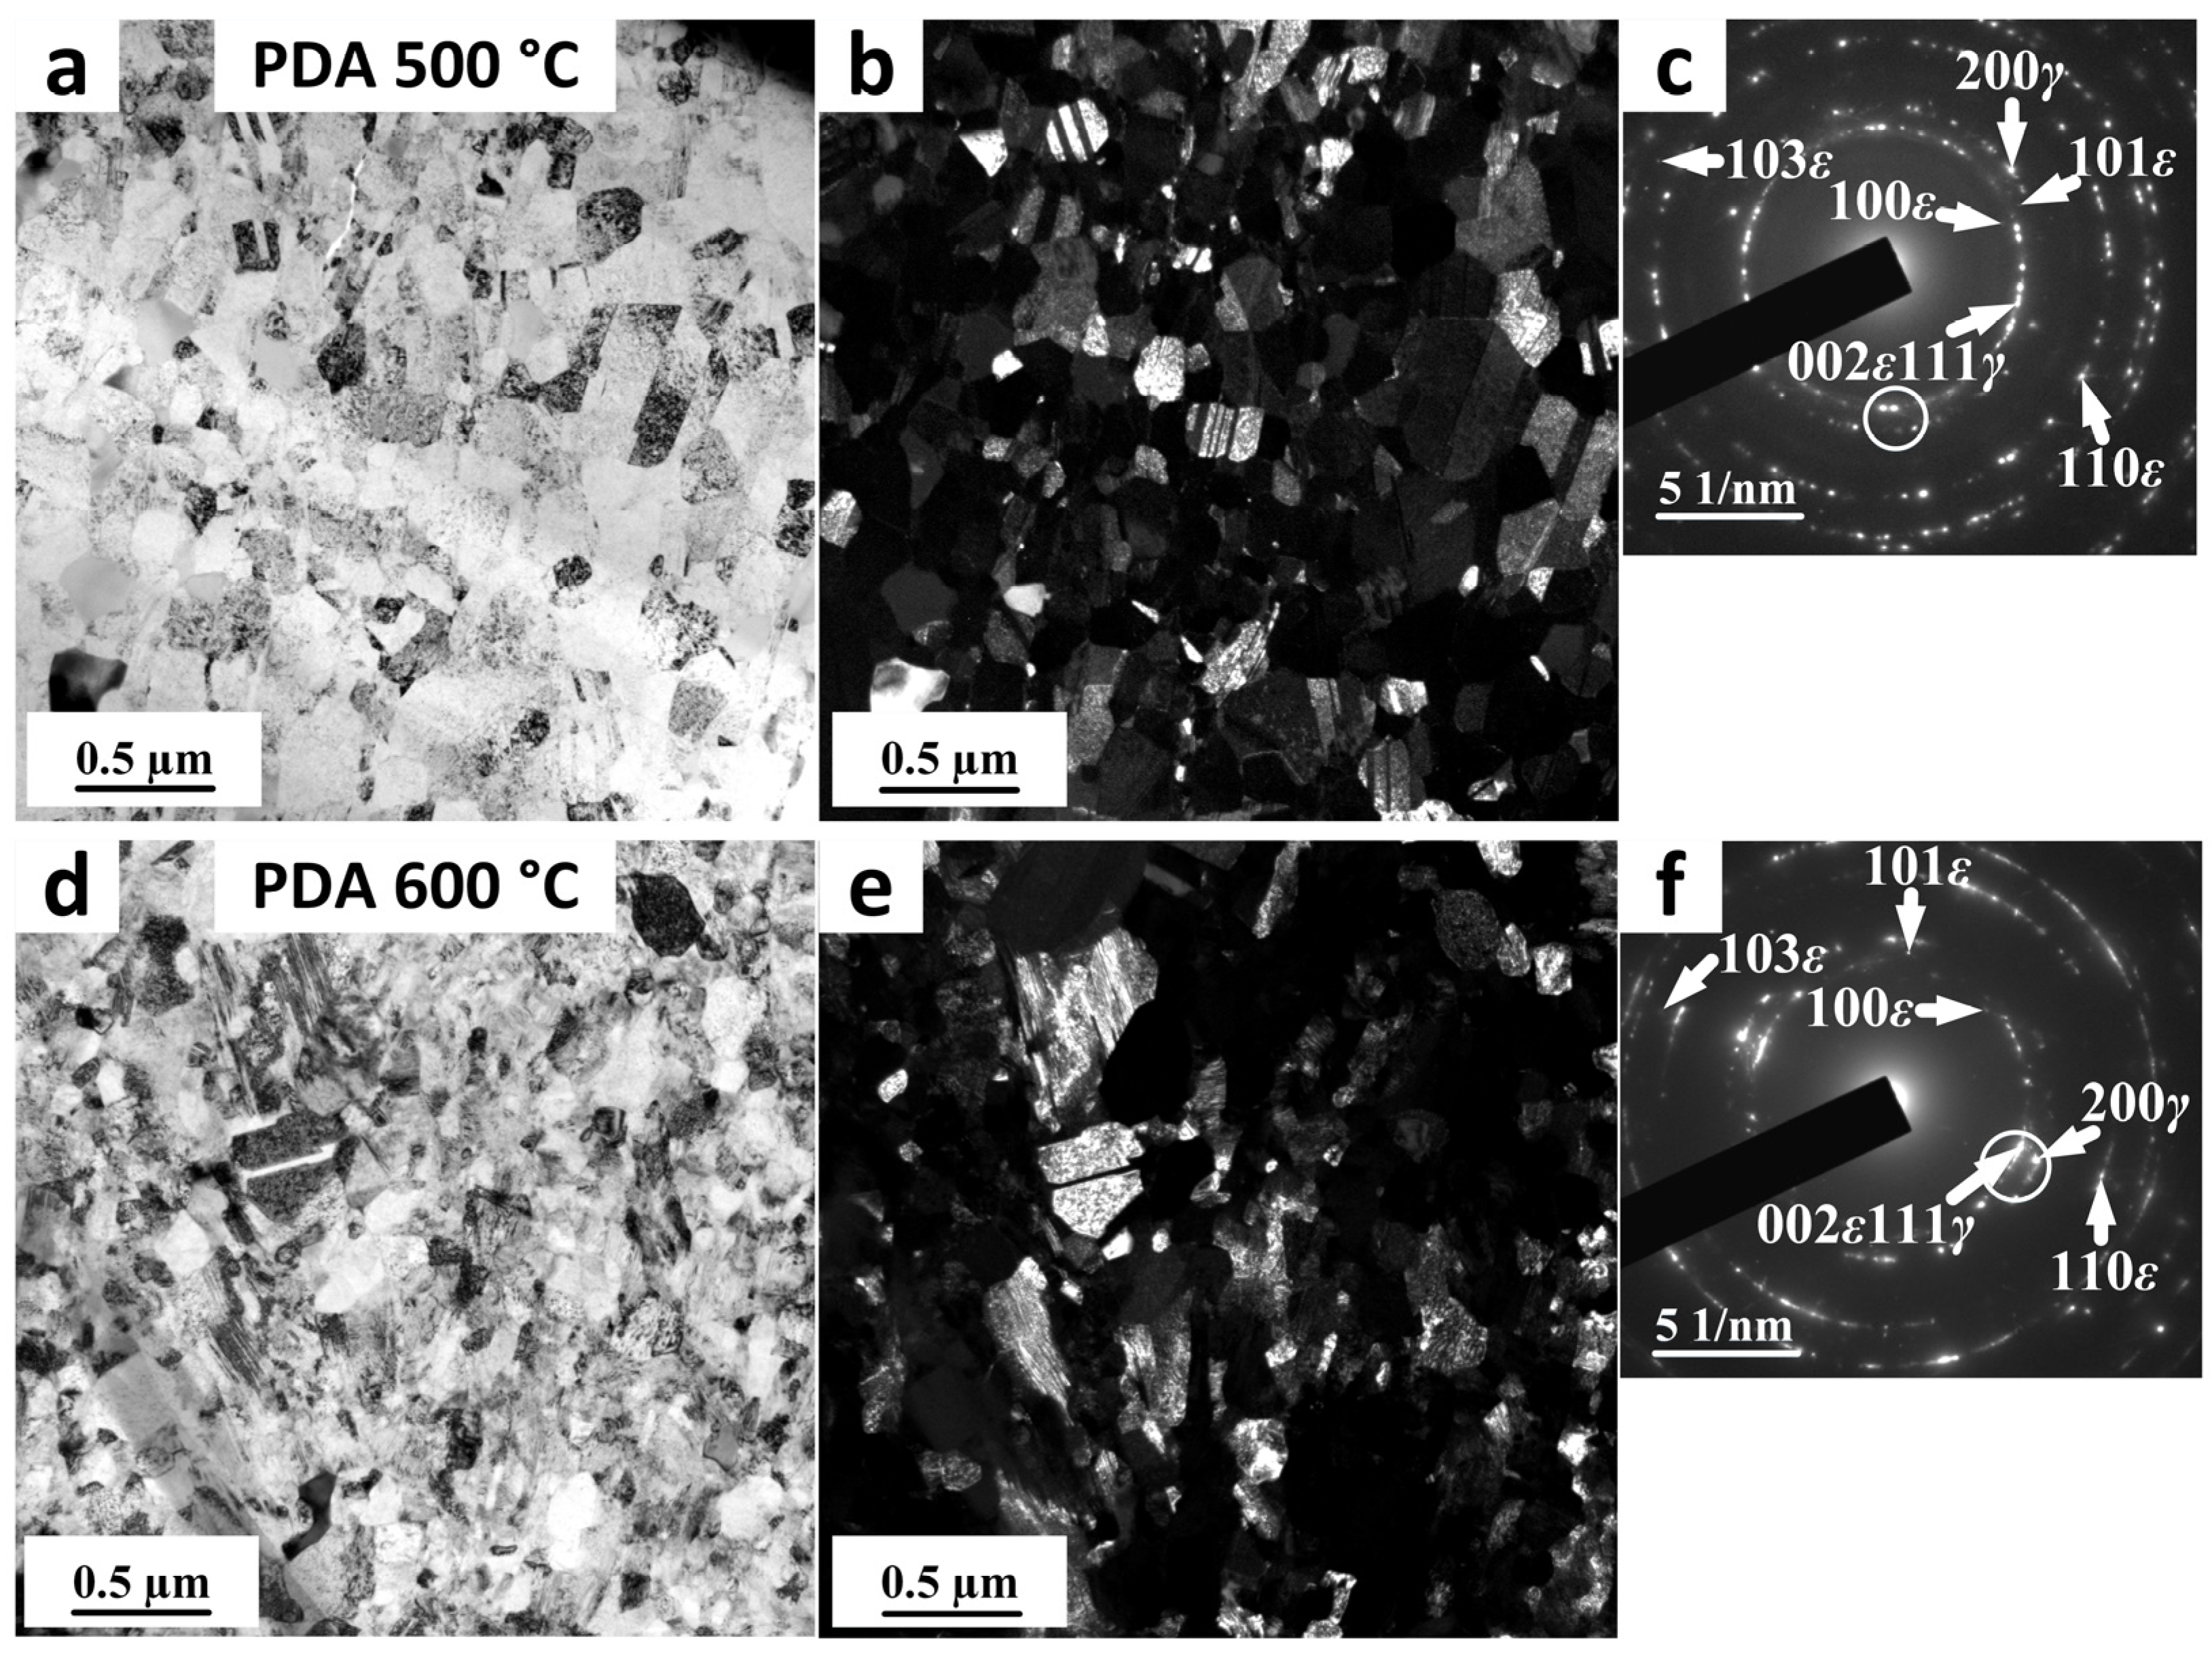
  • The HPT, n = 1 and 5 forms the mixture of submicrocrystalline (SMCS) and nanocrystalline (NCS) structures along with deformed remnants of initial coarse-grained structure. The HPT, n = 10, and AccHPT, n = 10 result in a transition of grain/subgrain size from the submicrometer to the nanometer scale after AccHPT at a greater extent (grain/subgrain size of 5–40 nm), than after HPT (grain/subgrain size of 15–100 nm). The subsequent PDA at 500 and 600 °C for 15 min after AccHPT, n = 10 results in formation of predominant SMCS alongside the NCS with grain/subgrain size of 160 ± 35 and 195 ± 40 nm, respectively.
  • The HPT and AccHPT treatments result in the formation a single-phase state (except for HPT, n = 1) of stress-induced ε-martensite due to stress-induced γε martensitic transformation. The AccHPT, n = 10 with subsequent PDA at 500 and 600 °C results in the two-phase state of γ-austenite and cooling-induced ε-martensite due to εγ transformation upon heating and γε martensitic transformation during subsequent water cooling, respectively. With the increase in the number of HPT revolutions and transition to AccHPT, the width of the X-ray diffraction lines and the microhardness increase. Subsequent PDA after AccHPT is accompanied by some reduction in these parameters.
  • The single-phase state of the stress-induced ε-martensite formed after HPT and AccHPT results in lowering of the biodegradation rate down to 0.14 mm/year due to the decrease (HPT, n = 1) and disappearance of the cathodic structural component (γ-austenite), thereby inhibiting the cathodic process, increasing its overvoltage, and thus decreasing the overall corrosion reaction rate.
  • Subsequent PDA after the AccHPT increases the biodegradation rate by up to 0.47 mm/year due to formation a two-phase state of γ-austenite and cooling-induced ε-martensite through the reverse martensitic transformation εγ upon heating, and then partial forward martensitic transformation γε upon cooling, respectively. This accelerating effect of the two-phase state on the biodegradation rate is weakened in the presence of high lattice distortion level in the severely deformed alloy. Evidenced by TEM study, XRD line width and microhardness values, PDA after AccHPT does not lead to the significant softening effect while significantly increasing the biodegradation rate.

Author Contributions

Conceptualization, P.K. and S.P.; methodology, D.G.; validation, P.K., S.P., Y.Z. and Y.P.; formal analysis, Y.Z.; investigation, M.A., T.T., N.T., A.B. and S.G.; resources, P.K.; data curation, P.K.; writing—original draft preparation, P.K.; writing—review and editing, S.P.; supervision, S.P.; project administration, P.K.; funding acquisition, P.K. All authors have read and agreed to the published version of the manuscript.

Funding

The present work was carried out with the financial support of the Russian Science Foundation, project number 23-79-01150, https://rscf.ru/project/23-79-01150/ (accessed on 27 March 2025).

Data Availability Statement

No new data were created or analyzed in this study. Data sharing is not applicable to this article.

Conflicts of Interest

The authors declare no conflicts of interest.

References

  1. Witte, F.; Hort, N.; Vogt, C.; Cohen, S.; Kainer, K.U.; Willumeit, R.; Feyerabend, F. Degradable biomaterials based on magnesium corrosion. Curr. Opin. Solid State Mater. Sci. 2008, 12, 63–72. [Google Scholar] [CrossRef]
  2. Yang, H.; Jia, B.; Zhang, Z.; Qu, X.; Li, G.; Lin, W.; Zhu, D.; Dai, K.; Zheng, Y. Alloying design of biodegradable zinc as promising bone implants for load-bearing applications. Nat. Commun. 2020, 11, 401. [Google Scholar] [CrossRef] [PubMed]
  3. Li, X.; Shi, Z.; Zhang, J.; Zhou, C.; Wang, L. 380 MPa-30% grade biodegradable Zn-Mn-Mg-Ca alloy: Bimodal grain structure, large work-hardening strain, and enhanced biocompatibility. Acta Biomater. 2025, 193, 584–603. [Google Scholar] [CrossRef]
  4. Koch, C.; Ovidko, I.; Seal, S.; Veprek, S. Structural Nanocrystalline Materials: Fundamentals and Applications; Cambridge University Press: Cambridge, UK, 2007; 380p. [Google Scholar]
  5. Kraus, T.; Moszner, F.; Fischerauer, S.; Fiedler, M.; Martinelli, E.; Eichler, J.; Witte, F.; Willbold, E.; Schinhammer, M.; Meischel, M.; et al. Biodegradable Fe-based alloys for use in osteosynthesis: Outcome of an in vivo study after 52 weeks. Acta Biomater. 2014, 10, 3346–3353. [Google Scholar] [CrossRef] [PubMed]
  6. Hermawan, H.; Purnama, A.; Dube, D.; Couet, J.; Mantovani, D. Fe-Mn alloys for metallic biodegradable stents: Degradation and cell viability studies. Acta Biomater. 2010, 6, 1852–1860. [Google Scholar] [CrossRef]
  7. Drevet, R.; Zhukova, Y.; Malikova, P.; Dubinskiy, S.; Korotitskiy, A.; Pustov, Y.; Prokoshkin, S. Martensitic Transformations and Mechanical and Corrosion Properties of Fe-Mn-Si Alloys for Biodegradable Medical Implants. Metall. Mater. Trans. A Phys. Metall. Mater. Sci. 2018, 49, 1006–1013. [Google Scholar] [CrossRef]
  8. Prokoshkin, S.; Pustov, Y.; Zhukova, Y.; Kadirov, P.; Dubinskiy, S.; Sheremetyev, V.; Karavaeva, M. Effect of Thermomechanical Treatment on Functional Properties of Biodegradable Fe-30Mn-5Si Shape Memory Alloy. Metall. Mater. Trans. A 2021, 52, 2024–2032. [Google Scholar] [CrossRef]
  9. Valiev, R.Z.; Islamgaliev, R.K.; Alexandrov, I.V. Bulk nanostructured materials from severe plastic deformation. Prog. Mater. Sci. 2000, 45, 103–189. [Google Scholar] [CrossRef]
  10. Kadirov, P.; Sheremetyev, V.; Pustov, Y.; Karavaeva, M.; Zhukova, Y.; Cheverikin, V.; Galkin, S.; Prokoshkin, S. Effect of combined thermomechanical treatment on structure, mechanical properties, electrochemical behavior and functional corrosion fatigue of biodegradable Fe-30Mn-5Si alloy. J. Alloys Compd. 2024, 1008, 176635. [Google Scholar] [CrossRef]
  11. Kadirov, P.; Karavaeva, M.; Zhukova, Y.; Gunderov, D.; Teplyakova, T.; Bazlov, A.; Tabachkova, N.; Prokoshkin, S. Effect of high-pressure torsion on the structure and microhardness of biodegradable Fe-30Mn-5Si (wt.%) alloy. Mater. Lett. 2024, 363, 136318. [Google Scholar] [CrossRef]
  12. Valiev, R. Nanostructuring of metals by severe plastic deformation for advanced properties. Nat. Mater. 2004, 3, 511–516. [Google Scholar] [CrossRef] [PubMed]
  13. Zhilyaev, A.P.; Langdon, T.G. Using high-pressure torsion for metal processing: Fundamentals and applications. Prog. Mater. Sci. 2008, 53, 893–979. [Google Scholar] [CrossRef]
  14. Beygelzimer, Y.; Estrin, Y.; Davydenko, O.; Kulagin, R. Gripping Prospective of Non-Shear Flows under High-Pressure Torsion. Materials 2023, 16, 823. [Google Scholar] [CrossRef] [PubMed]
  15. Jang, G.; Kim, J.; Lee, H.; Lee, T.; Enikeev, N.; Abramova, M.; Valiev, R.; Kim, H.; Lee, C. Microstructural evolution and mechanical properties of nanocrystalline Fe–Mn–Al–C steel processed by high-pressure torsion. Mater. Sci. Eng. A 2021, 827, 142073. [Google Scholar] [CrossRef]
  16. Schiøtz, J.; Di Tolla, F.D.; Jacobsen, K.W. Softening of nanocrystalline metals at very small grain sizes. Nature 1998, 391, 561–563. [Google Scholar] [CrossRef]
  17. Conrad, H.; Narayan, J. On the grain size softening in nanocrystalline materials. Scr. Mater. 2000, 42, 1025–1030. [Google Scholar] [CrossRef]
  18. Kalahroudi, F.J.; Koohdar, H.; Jafarian, H.R.; Huang, Y.; Langdon, T.G.; Nili-Ahmadabadi, M. On the microstructure and mechanical properties of an Fe-10Ni-7Mn martensitic steel processed by high-pressure torsion. J. Mater. Sci. Eng. A 2019, 749, 27–34. [Google Scholar] [CrossRef]
  19. Kovács, Z.; Schafler, E.; Szommer, P.; Révész, Á. Localization of plastic deformation along shear bands in Vitreloy bulk metallic glass during high pressure torsion. J. Alloys Compd. 2014, 593, 207–212. [Google Scholar] [CrossRef]
  20. Dmowski, W.; Yokoyama, Y.; Chuang, A.; Ren, Y.; Umemoto, M.; Tsuchiya, K.; Inoue, A.; Egami, T. Structural rejuvenation in a bulk metallic glass induced by severe plastic deformation. Acta Mater. 2010, 58, 429–438. [Google Scholar] [CrossRef]
  21. Edalati, K.; Horita, Z.; Langdon, T.G. The significance of slippage in processing by high-pressure torsion. Scr. Mater. 2009, 60, 9–12. [Google Scholar] [CrossRef]
  22. Kadirov, P.; Pustov, Y.; Zhukova, Y.; Karavaeva, M.; Sheremetyev, V.; Korotitskiy, A.; Baranova, A.; Prokoshkin, S. Dependence of electrochemical characteristics of a biodegradable Fe-30Mn-5Si wt% alloy on compressive deformation in a wide temperature range. Metals 2023, 13, 1830. [Google Scholar] [CrossRef]
  23. Winston Revie, R. (Ed.) Uhlig’s Corrosion Handbook, 3rd ed.; John Wiley & Sons, Inc.: Hoboken, NJ USA, 2011. [Google Scholar] [CrossRef]
  24. Kadirov, P.; Zhukova, Y.; Pustov, Y.; Karavaeva, M.; Sheremetyev, V.; Korotitskiy, A.; Shcherbakova, E.; Baranova, A.; Komarov, V.; Prokoshkin, S. Effect of plastic deformation in various temperature-rate conditions on structure and mechanical properties of biodegradable Fe–30Mn–5Si alloy. Met. Mater. Trans. A 2024, 55, 895–909. [Google Scholar] [CrossRef]
  25. Prokoshkin, S.; Dubinskiy, S.; Brailovski, V. Features of a Nanosubgrained Structure in Deformed and Annealed Ti–Ni SMA: A Brief Review. Shape Mem. Superelasticity 2019, 5, 336–345. [Google Scholar] [CrossRef]
  26. Sheremetyev, V.; Dubinskiy, S.; Kudryashova, A.; Prokoshkin, S.; Brailovski, V. In situ XRD study of stress- and cooling-induced martensitic transformations in ultrafine and nano-grained superelastic Ti-18Zr-14Nb alloy. J. Alloys Compd. 2022, 902, 163704. [Google Scholar] [CrossRef]
  27. Sadovnikov, S.I. Thermal stability and recrystallization of semiconductor nanostructured sulfides and sulfide solid solutions. J. Alloys Compd. 2019, 788, 586–599. [Google Scholar] [CrossRef]
  28. Dubinskiy, S.; Prokoshkin, S.; Brailovski, V.; Inaekyan, K.; Korotitskiy, A. In situ X-ray diffraction strain-controlled study of Ti–Nb–Zr and Ti–Nb–Ta shape memory alloys: Crystal lattice and transformation features. Mater. Charact. 2014, 88, 127–142. [Google Scholar] [CrossRef]
  29. Zheng, Y.F.; Gu, X.N.; Witte, F. Biodegradable metals. Mater. Sci. Eng. R Rep. 2014, 77, 1–34. [Google Scholar] [CrossRef]
  30. Venezuela, J.; Dargusch, M.S. Addressing the slow corrosion rate of biodegradable Fe-Mn: Current approaches and future trends. Curr. Opin. Solid State Mater. Sci. 2020, 24, 100822. [Google Scholar] [CrossRef]
  31. Shuai, C.; He, C.; Dong, Z.; Yang, Y.; Peng, S.; Tan, W. Galvanic corrosion induced by heterogeneous bimodal grain structures in Fe-Mn implant. Mater. Charact. 2021, 180, 111445. [Google Scholar] [CrossRef]
  32. Gąsior, G.; Szczepański, J.; Radtke, A. Biodegradable Iron-Based Materials—What Was Done and What More Can Be Done? Materials 2021, 12, 3381. [Google Scholar] [CrossRef]
  33. Muhammad Rabeeh, V.P.; Hanas, T. Biodegradable Iron Implants: Development, Processing and Applications; Springer Nature: Berlin, Germany, 2025. [Google Scholar] [CrossRef]
  34. Rybalchenko, O.; Anisimova, N.; Martynenko, N.; Rybalchenko, G.; Belyakov, A.; Shchetinin, I.; Lukyanova, E.; Chernogorova, O.; Raab, A.; Pashintseva, N.; et al. Biocompatibility and Degradation of Fe-Mn-5Si Alloy after Equal-Channel Angular Pressing: In vitro and in vivo Study. Appl. Sci. 2023, 13, 9628. [Google Scholar] [CrossRef]
Figure 1. Schematic representation of the AccHPT of the Fe-30Mn-5Si alloy.
Crystals 15 00351 g001
Figure 2. Typical optical micrograph of the Fe-30Mn-5Si alloy after RHT; average grain size is 200–300 μm.
Crystals 15 00351 g002
Figure 3. TEM images of Fe-30Mn-5Si alloy after HPT, n = 1 (ac), n = 5 (df), n = 10 (gi) and AccHPT, n = 10 (jl); (a,d,g,j)—BF images; (c,f,i,l)—corresponding SAED patterns; (b,e,h,k)—DF images, taken from SAED patterns in (c,f,i,l), respectively.
Crystals 15 00351 g003
Figure 4. TEM images of Fe-30Mn-5Si alloy after AccHPT, n = 10 with subsequent PDA at 500 (ac) and 600 (df) °C; (a,d)—BF images; corresponding SAED patterns; (b,e)—DF images, taken from reflexes marked by circles in corresponding SAED patterns (c,f), respectively.
Crystals 15 00351 g004
Figure 5. X-ray diffractograms of Fe-30Mn-5Si alloy after RHT, HPT, AccHPT and AccHPT + PDA.
Crystals 15 00351 g005
Figure 6. Hardness values obtained in the central zone (a), half-radius zone (b) and peripheral zone (c) of the Fe-30Mn-5Si alloy after RHT, HPT, AccHPT and AccHPT with subsequent PDA.
Crystals 15 00351 g006
Figure 7. OCP curves of Fe-30Mn-5Si alloy after RHT, HPT, AccHPT and AccHPT with subsequent PDA.
Crystals 15 00351 g007
Figure 8. Polarization diagrams of Fe-30Mn-5Si alloy after RHT, HPT, AccHPT and AccHPT with subsequent PDA.
Crystals 15 00351 g008
Table 1. XRD line width Bhkl (2θ degrees), microhardness and the electrochemical parameters of the Fe-30Mn-5Si alloy after RHT, HPT, and AccHPT with PDA.
TreatmentB101εB200γB103ε
RHT0.50 ± 0.030.38 ± 0.020.76 ± 0.04
HPT (n = 1)0.58 ± 0.030.47 ± 0.030.87 ± 0.04
HPT (n = 5)0.65 ± 0.03-1.09 ± 0.05
HPT (n = 10)0.65 ± 0.03-1.15 ± 0.05
AccHPT (n = 10)0.90 ± 0.03-1.45 ± 0.10
AccHPT (n = 10) + PDA5000.82 ± 0.020.74 ± 0.051.32 ± 0.08
AccHPT (n = 10) + PDA6000.82 ± 0.030.64 ± 0.030.98 ± 0.05
Table 2. The electrochemical parameters of the Fe-30Mn-5Si alloy after RHT, HPT, AccHPT, and AccHPT with subsequent PDA.
TreatmentCorrosion Potential Ecorr, mVCurrent Density icorr·105 (A/cm2)Biodegradation Rate, Cr mm/year
RHT−743 ± 35.11 ± 0.260.60 ± 0.02
HPT (n = 1)−730 ± 82.30 ± 0.100.27 ± 0.01
HPT (n = 5)−735 ± 51.75 ± 0.150.20 ± 0.02
HPT (n = 10)−743 ± 31.50 ± 0.100.18 ± 0.01
AccHPT (n = 10)−743 ± 31.30 ± 0.100.15 ± 0.02
AccHPT (n = 10) + PDA500−745 ± 33.60 ± 0.050.42 ± 0.01
AccHPT (n = 10) + PDA600−749 ± 34.00 ± 0.050.47 ± 0.01
Table 3. Phase-state, grain size scale, dislocation substructure parameters, residual stress, and the corresponding biodegradation rate after all treatments of Fe-30Mn-5Si alloy.
TreatmentPhasesGrain ScaleOverall Distraction LevelBiodegradation Rate, Cr mm/year
RHTRecrystallized γ-austenite + cooling induced ε-martensiteCoarse Grained structure (200–300 µm)Low 0.60 ± 0.02
HPT (n = 1)Plastically deformed γ-austenite + Plastically deformed cooling-induced and stress-induced ε-martensitePredominant SMCS alongside NCSHigh 0.27 ± 0.01
HPT (n = 5)Plastically deformed cooling-induced and stress-induced ε-martensitePredominant SMCS alongside NCSHigh0.20 ± 0.02
HPT (n = 10)Plastically deformed cooling-induced and stress-induced ε-martensitePredominant NCSVery high0.18 ± 0.01
AccHPT (n = 10)Plastically deformed cooling-induced and stress-induced ε-martensitePredominant NCSVery high0.15 ± 0.02
AccHPT (n = 10) + PDA500Recrystallized γ-austenite + cooling induced ε-martensitePredominant SMCS alongside NCSModerate; relief state0.42 ± 0.01
AccHPT (n = 10) + PDA600Recrystallized γ-austenite + cooling induced ε-martensitePredominant SMCS alongside NCSModerate; relief state0.47 ± 0.01
Disclaimer/Publisher’s Note: The statements, opinions and data contained in all publications are solely those of the individual author(s) and contributor(s) and not of MDPI and/or the editor(s). MDPI and/or the editor(s) disclaim responsibility for any injury to people or property resulting from any ideas, methods, instructions or products referred to in the content.

