1. Introduction
Inconel 625 is a nickel-based superalloy and possesses enhanced properties due to the solid solution of Nb and Mo in its Ni-Cr matrix. The alloy has been found to have multiple advantages in terms of exceptional oxidation resistance, better mechanical properties, and phase stability at high temperatures [
1]. It is widely utilized in the nuclear, aerospace, marine, automotive, power generation, and chemical sectors for high-temperature applications [
2]. It is extensively used to manufacture nozzle guide vanes, metallic bellows, and hot ducts [
3], as well as heat exchanging devices, chemical processing systems, combustor system casings, and liners [
4]. Inconel 625 welds are vulnerable to metallurgical issues during the welding process, which include micro-fissuring, constitutional segregation [
5], and liquation cracking in the HAZ [
6]. Nevertheless, the primary issue concerned with the welding of Inconel 625 and other Ni-based superalloys is the micro-segregation of refractory elements (Nb and Mo) and consequent Laves formation. Laves is a brittle intermetallic phase, which deteriorates the mechanical properties of weld joints [
7]. Researchers have reported the application of suitable filler metal, the use of different shielding gas to enhance the cooling rate, and techniques to refine grain size, i.e., current pulsating and arc oscillation to reduce the amount of Laves formation in the weld metal [
8]. Tungsten inert gas (TIG), Metal inert gas (MIG), and Shielded metal arc (SMA) welding are commonly used conventional fusion welding processes to weld Ni-based superalloys.
However, these conventional welding methods have certain disadvantages, including higher heat input due to a broader arc column, which causes micro-fissuring in the heat-affected zone (HAZ) [
8], more distortion of joints, residual stresses, slow welding speed, and a higher degree of micro-segregation [
9]. Also, it is difficult to weld thin sheets using these welding methods because the higher intensity of heat supplied causes blow holes and distortion of the weld joints [
10]. Fibre laser welding has several advantages, which include high beam quality and high power densities [
11], as well as high welding speed and a higher degree of automation [
12]. It results in a high cooling rate, fine grain formation, and less elemental segregations [
13]. Apart from these, laser is a universal tool that finds applications in many other processes like laser-based deposition [
14], additive manufacturing through layer deposition [
15], and many more.
D. Janicki used a high-power fibre laser to weld 0.8 mm-thick sheets into butt joints. The author observed that apart from the weld aspect ratio, the arm spacing of the dendrite and the grain size in the fused zone were highly dependent on the welding speed and laser power [
16]. Anbarsan et al. recommended that to control the distribution and size of the Laves phase, enhanced cooling rate of the weld joint, low heat input to the weld, pulsing arc oscillation techniques, steep thermal gradient, forced cooling, and using low Nb fillers should be employed [
17]. Several researchers have reported micro-segregation and the formation of Laves phase in the welding of Ni-based superalloys [
18]. Micro-segregation is a time-dependent phenomenon, and its severity depends on the solidification cooling rate and heat input supplied during welding [
19]. Monitoring the thermal cycle of the molten weld pool facilitates non-destructive evaluation of the weld metal [
20]. Mechanical and metallurgical properties are significantly affected by the cooling rate of the joint while it is being solidified [
21].
Although various thermal modelling approaches are available, experimental thermal monitoring during the laser welding of Inconel 625 remains scarce in the literature, especially regarding the correlation of measured cooling rates with elemental segregation behaviour, the evolution of Laves phase morphology, and mechanical performance. Therefore, this study concentrates on the real-time observation of the thermal history of the weld pool during the laser beam welding (LBW) of Inconel 625 under varying heat-input conditions. The assessed thermal cycles are employed to determine cooling rates, which are then associated with microstructural evolution, Nb/Mo micro-segregation in interdendritic areas, Laves phase development, and the mechanical properties of the resultant welds. The present work integrated thermal–microstructural–mechanical correlation, which fills a distinct void in the existing literature and offers essential insights for enhanced regulation of Laves phase formation in laser-welded Inconel 625.
3. Results and Discussions
3.1. Thermal History of Molten Weld Pool
The temperature signal plays a pivotal role in process control as it provides valuable insights into the thermal history of the laser–material interaction.
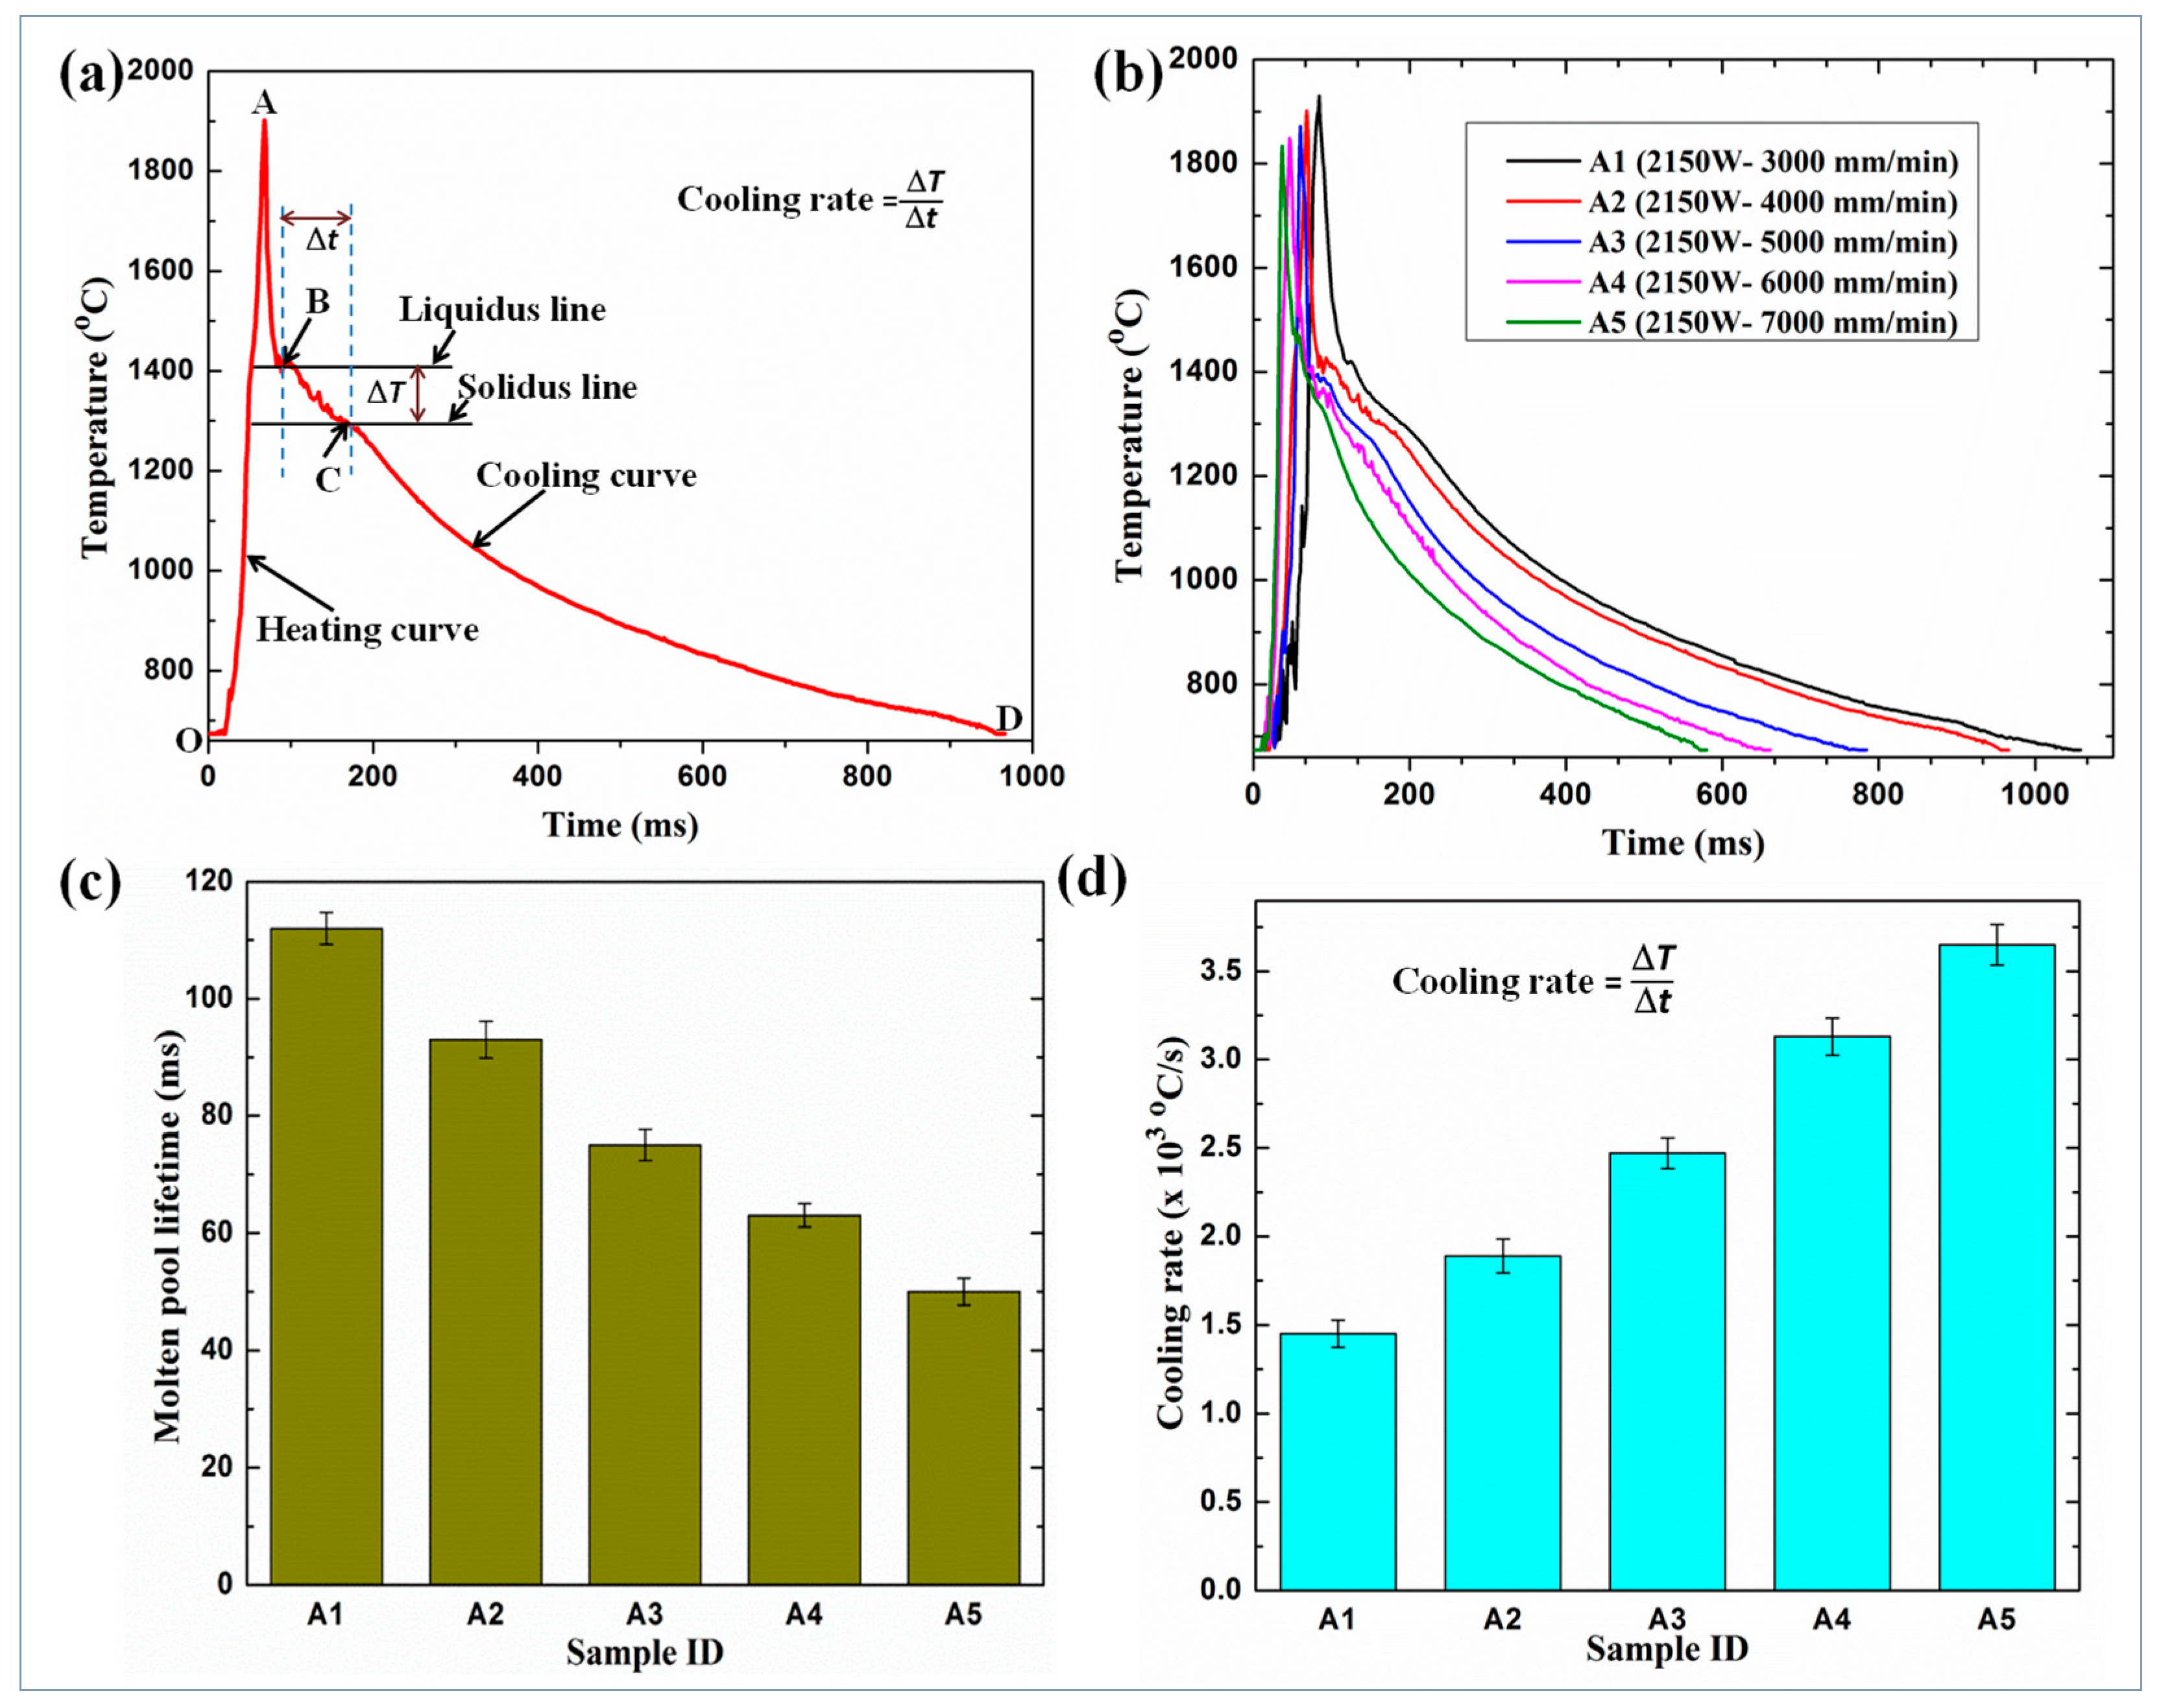
Figure 4a presents a thermo-cycle plot depicting distinct phases in the thermal history of the molten weld pool. The time-versus-temperature graph of the molten weld pool, depicted in
Figure 4a, is divided into two primary segments: the heating cycle (OA) followed by the subsequent cooling cycle (AD). The slope of the curve is utilized to calculate the rates of both heating and cooling. In the heating cycle (OA), the surface of the FZ is subjected to intense laser irradiation. So, the temperature rises beyond the melting point of the metal. During the cooling cycle (AD), as the laser beam progresses, the molten pool behind begins to cool down. During the cooling cycle, the development of nucleation leads to the formation and propagation of various types of grains.
The lifetime of the molten pool is attributed to the time duration of zone AC. Cooling that happens before nucleation is represented by zone AB, while that taking place during solidification is depicted by zone BC. Solidification initiates at point B and concludes at position C, representing the liquidus and solidus temperatures, respectively, as indicated in
Figure 4a. The slope of the curve BC, denoted as (∆T/∆t), is utilized to determine the cooling rate. Here, ∆T signifies the temperature change and ∆t represents the time interval between points B and C [
24]. The solidification rate of the molten pool is directly proportional to the cooling rate. A higher cooling rate corresponds to a faster solidification rate, while a lower cooling rate results in a slower solidification rate. This solidification rate plays a pivotal role in the development of distinct grain structures, dendrite spacing, and micro-segregation within the weld metal. A higher solidification rate leads to the formation of finer dendritic grains, whereas a lower rate gives rise to larger and coarser grain structures [
25]. Subsequent cooling in the solid phase, as represented by zone CD, results in the formation of precipitates and the development of various phases.
The maximum temperature of the molten weld pool of all the weld samples, as shown in
Figure 4b, is more than the base metal melting point. As the heat input decreases from sample A1 to A5, the melt pool lifetime also decreases from 112 ms to 50 ms, respectively, due to the increased cooling rate, as shown in
Figure 4c. The average cooling rate during the solidification of weld samples A1 to A5 is depicted in
Figure 4d. With decreasing heat input from sample A1 to A5, the average cooling rate increased from 1.45 × 10
3 °C/s to 3.65 × 10
3 °C/s, respectively. The reason attributed to this is that the high rate of heat transfer between the molten weld pool and the adjacent base metal leads to the decrease in the heat input. This results in an increased thermal gradient and consequently a higher cooling rate of the weld pool [
26].
3.2. Morphology of the Weld Profile
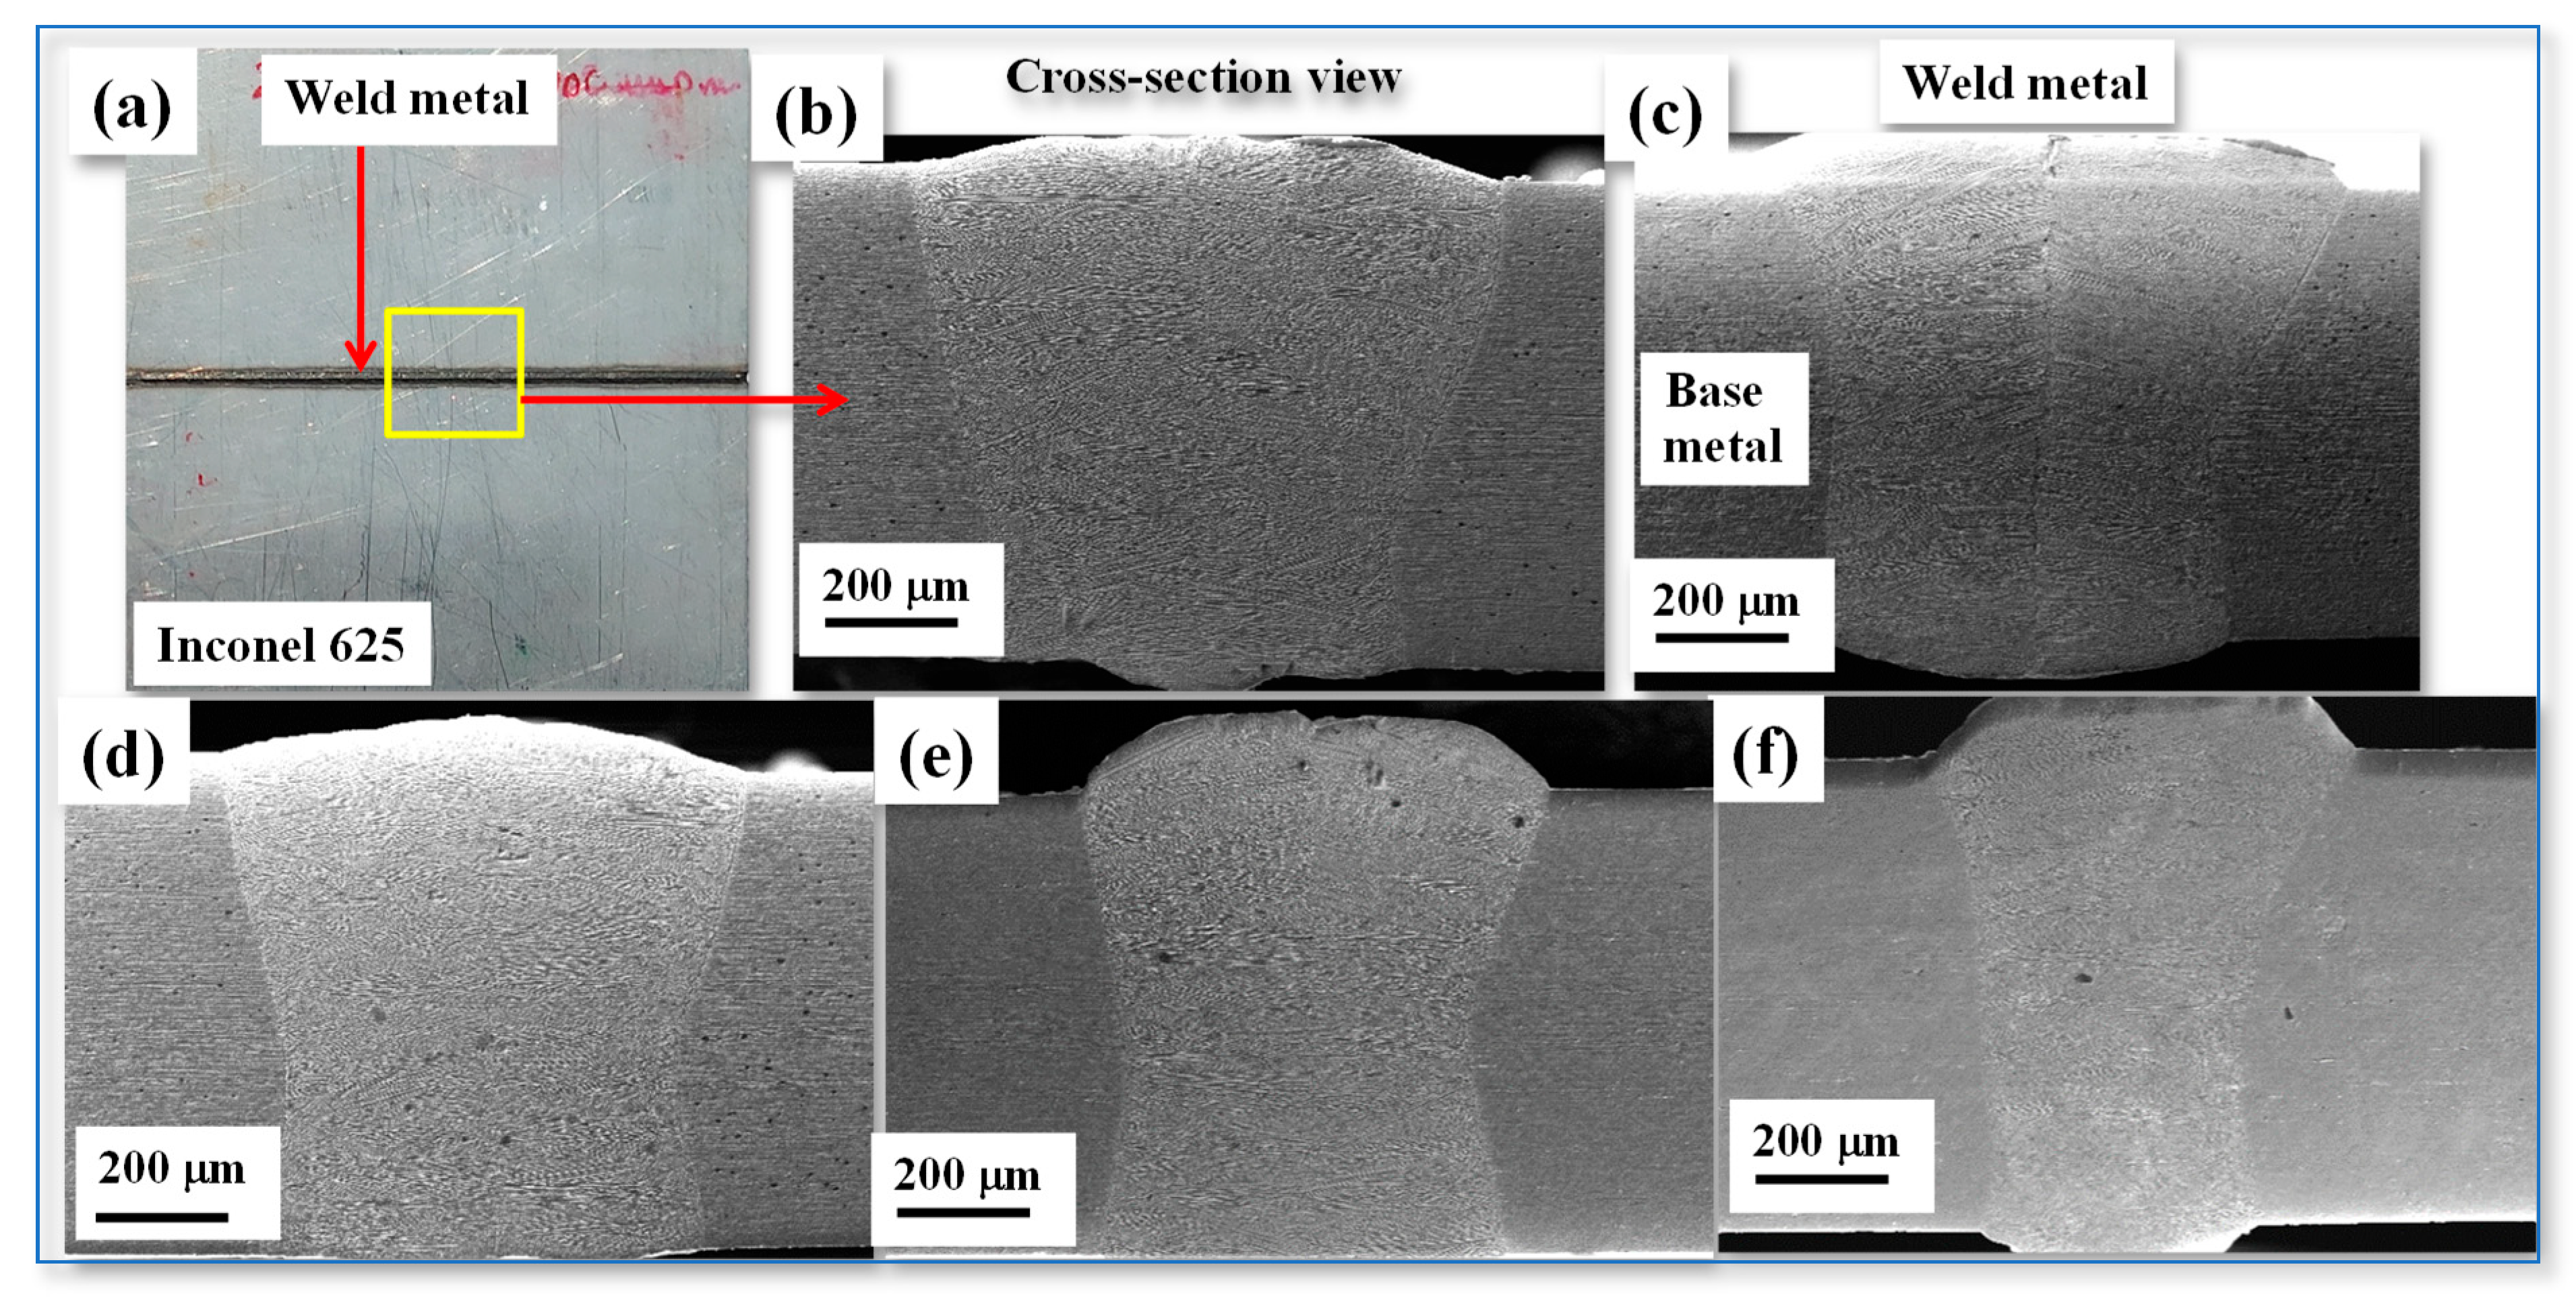
Figure 5a shows the morphology of the weld sample top surface, while
Figure 5b–f present SEM micrographs illustrating the cross-section of the fusion zone (FZ) at varying heat inputs.
All joints have full penetration with no volumetric defect in the FZ. As seen in
Figure 5, two different weld bead profiles were observed in the present investigation, namely, hourglass shape and a truncated-cone shape. The bead profile is nearly an hourglass shape at the heat inputs of 43, 32.2, 25.8, and 18.5 J/mm (weld sample A1, A2, A3, and A4) and changes to a nearly truncated-cone shape at the lowest heat input of 18.5 J/mm (weld sample A5), as shown in
Figure 5b–f. Physical parameters of the weld such as the area of cross-section of the joined samples and weld bead width were measured using an image analysis software called ImageJ version 1.52a April 2018. The heat input variations’ effect on the area and width of the FZ (top, minimum neck, and bottom) is given in
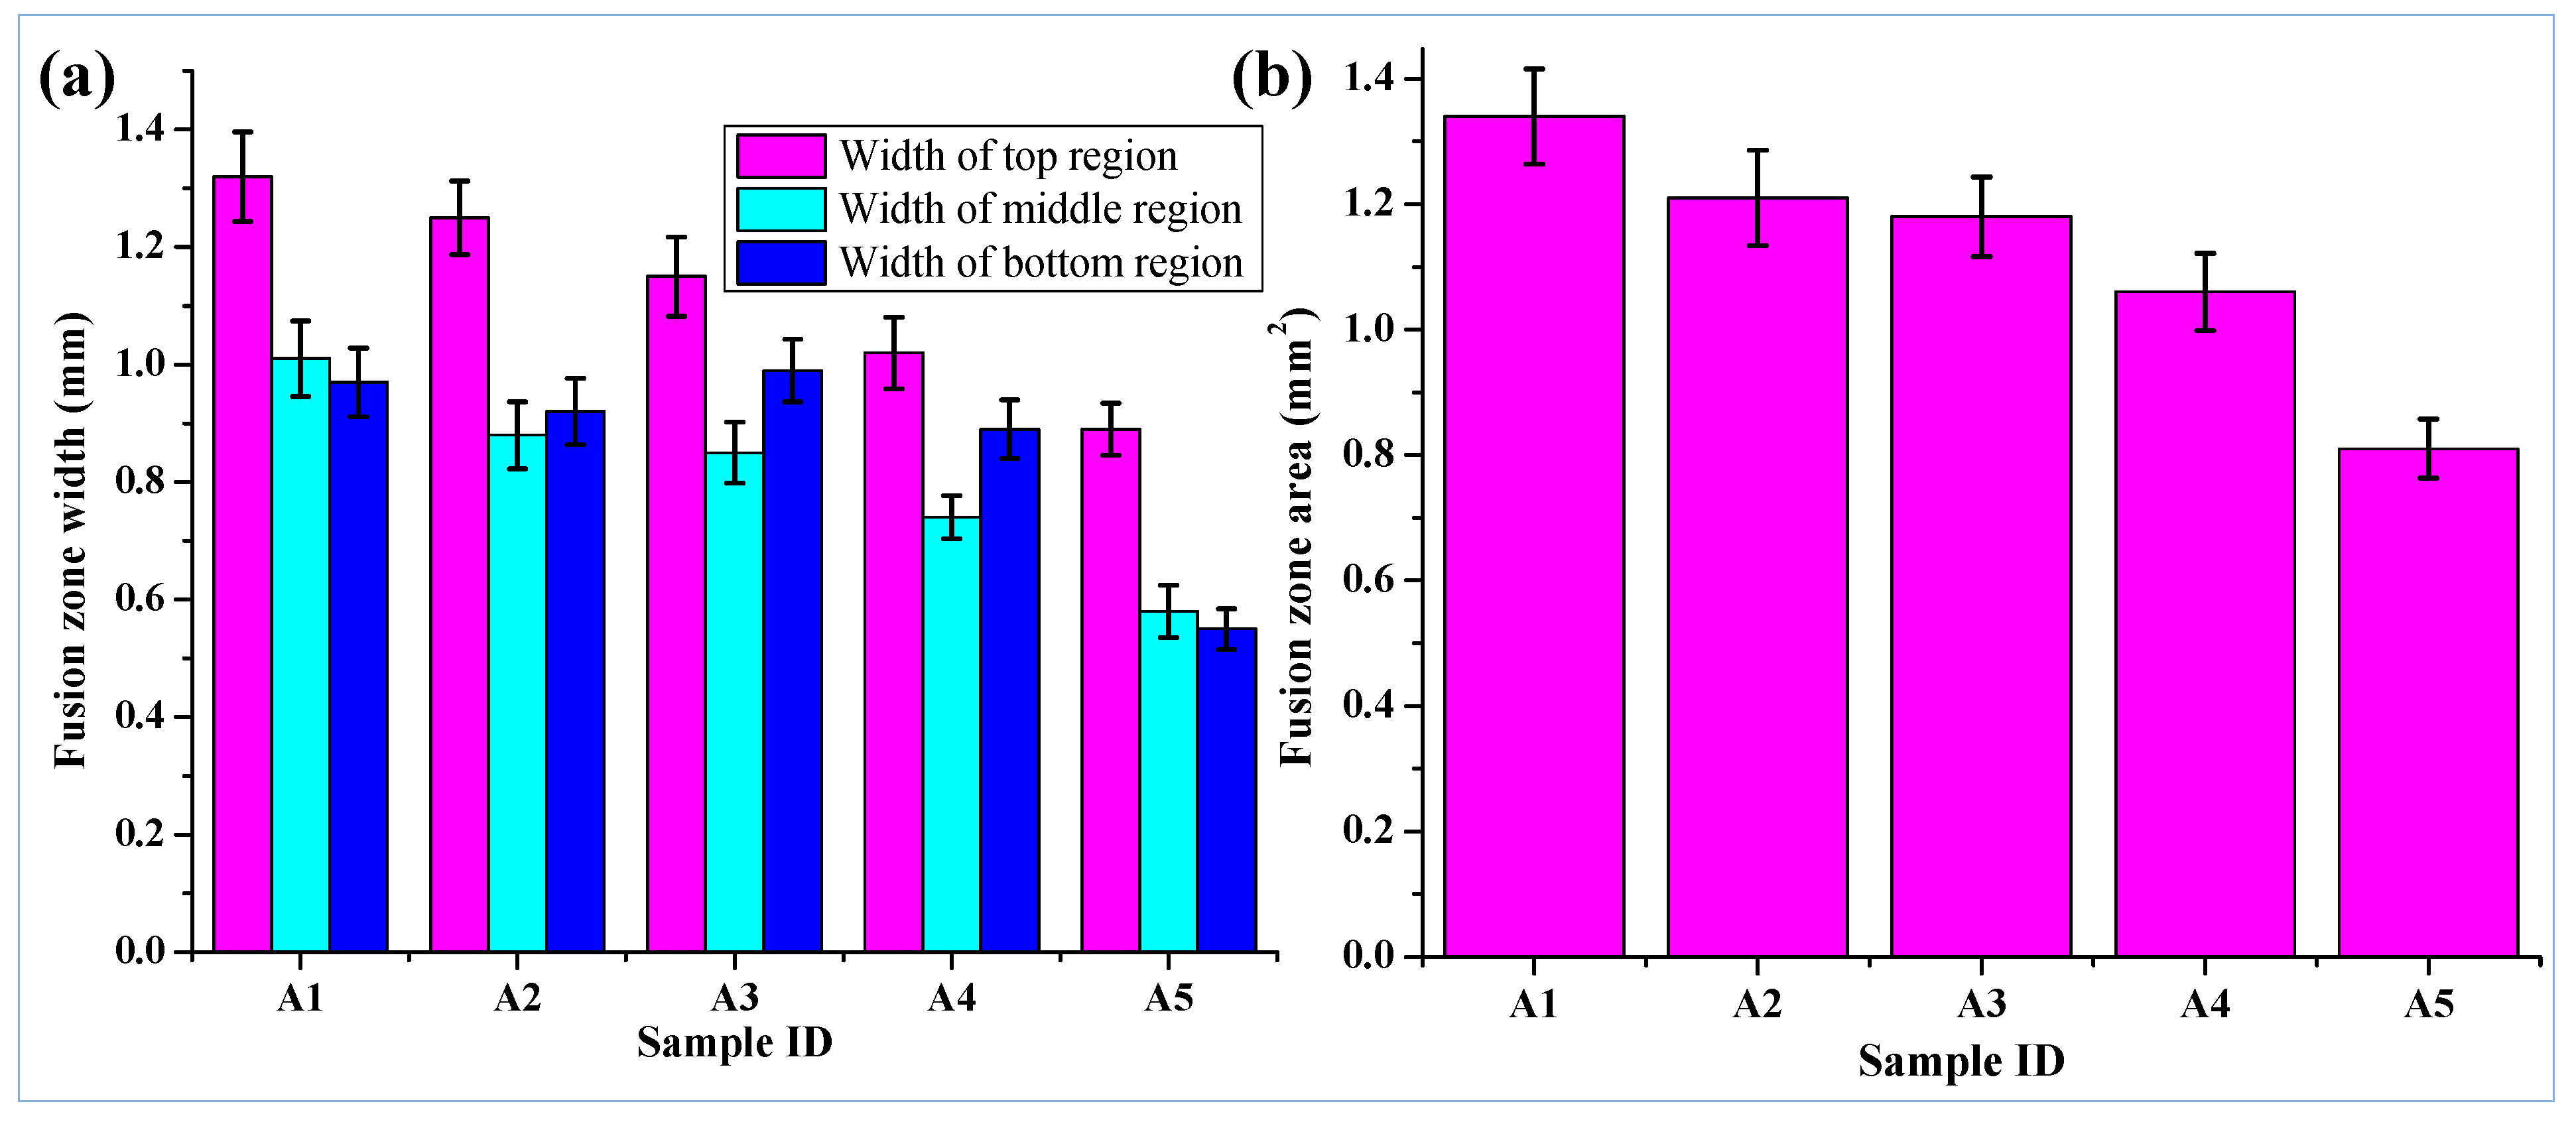
Figure 6a,b. As illustrated in
Figure 6a, the weld bead width reduces as the heat input decreases. For weld sample A1, the fusion zone width at the top, middle, and bottom regions are 1.32 ± 0.076 mm, 1.01 ± 0.064 mm, and 0.97 ± 0.058 mm, respectively. Similarly, for sample A5 fusion zone, the width at the top, middle, and bottom regions are 89 ± 0.044, 0.58 ± 0.046, and 0.55 ± 0.034, respectively. Due to the heat input decrement from sample A1 (43 J/mm) to A5 (18.5 J/mm) the molten pool lifetime decreases from 112 ms to 50 ms. A decrease in melt pool lifetime results in less time available for the propagation of the melt pool, and correspondingly, the FZ width decreases.
Similar observations were stated by Squillace et al. for variations in FZ width and area with the change in heat input [
27]. The increased weld width at the top relative to the bottom of the fusion zone in all samples is mainly attributable to the higher molten metal flow in the upper portion of the weld pool, resulting in keyhole distortion and uneven heat distribution. These molten metal flow dynamics, in conjunction with atmospheric exposure that facilitates increased lateral heat dissipation at the base, leads to a narrower weld bottom, aligning with previous findings [
13]. This results in the weld bead being wider at the top and narrow at the bottom. In addition, the lower portion of the FZ is exposed to the atmosphere, which enhances the process of solidification by distributing heat energy laterally. As a result, the FZ bottom is wider than the FZ middle.
3.3. Microstructure Evolution in the Welded Zone
LBW is characterized by a high rate of cooling (10
3–10
4 °C/s) that has a substantial impact on the solidification process of the weld metal. Since Inconel 625 is a heavy alloyed material and due to this, solidification takes place in dendritic mode. It is known that increasing the solidification cooling rate decreases the dendritic grain size [
25].
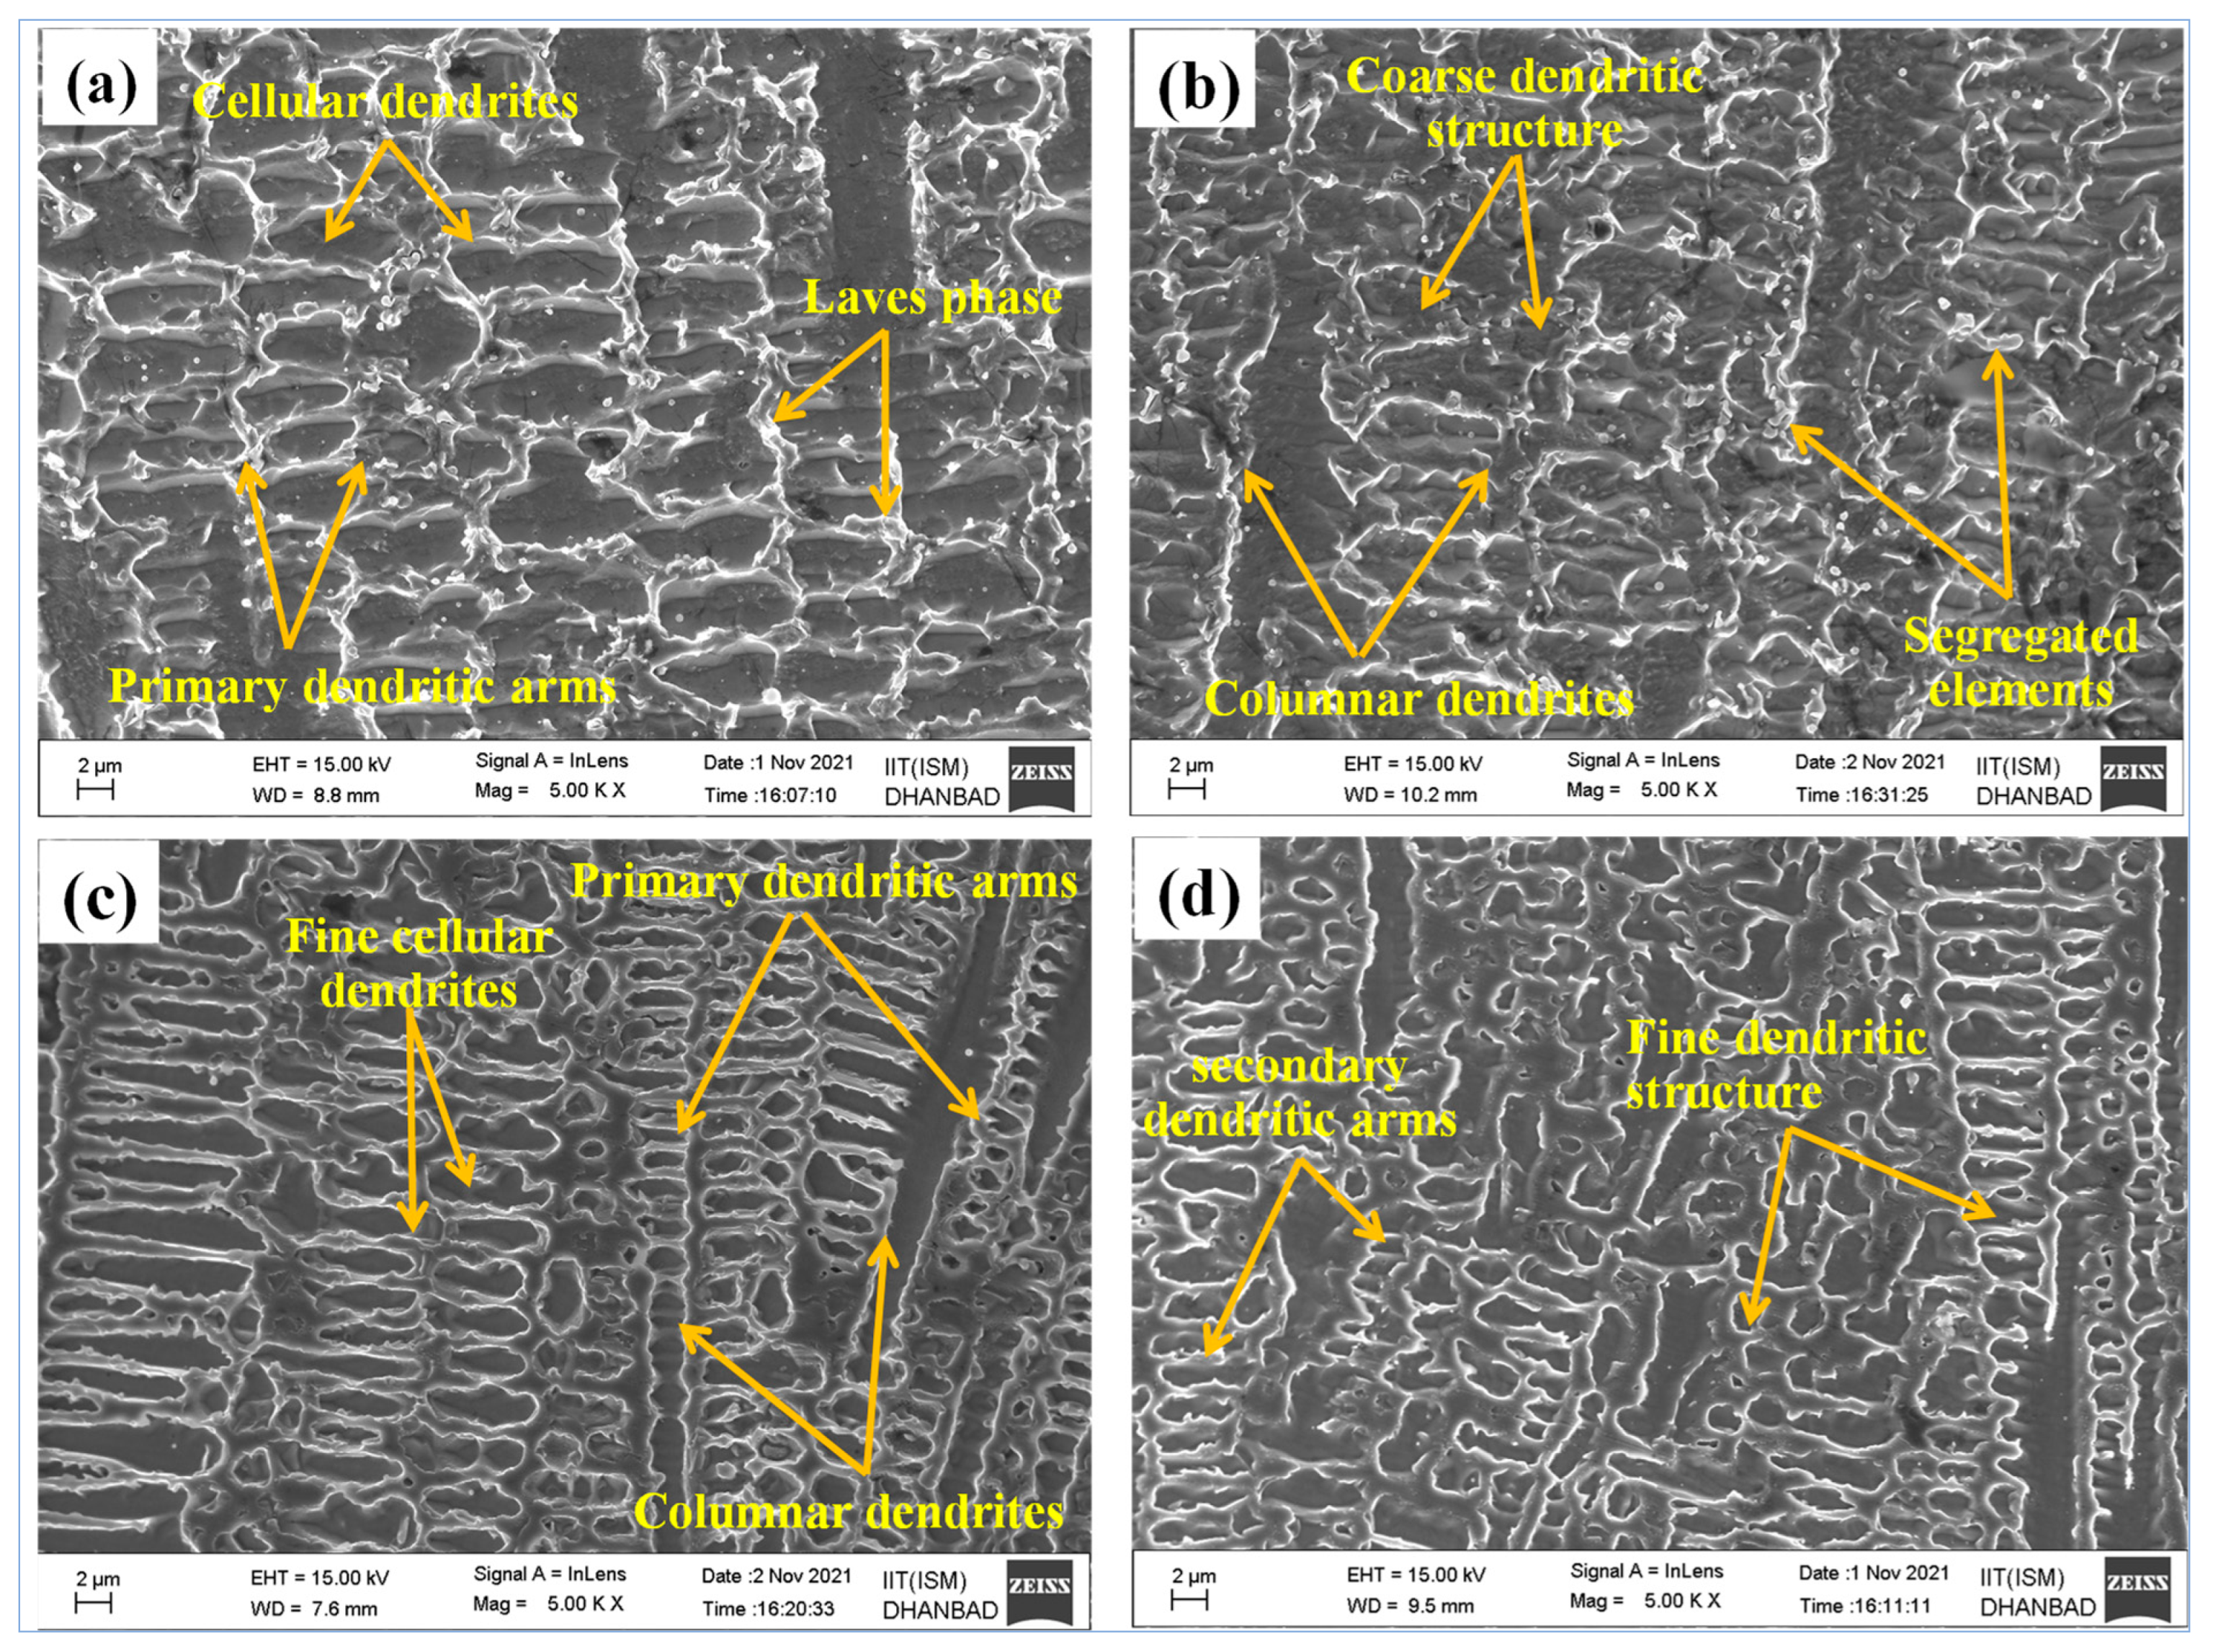
Figure 7a–d shows SEM micrographs of the microstructure of the weld transverse cross-section of the FZ at variable heat inputs for weld samples A1 (43 J/mm) to A5 (18.5 J/mm), respectively. The SEM micrographs demonstrate that the microstructure of the weld sample comprised columnar and cellular dendrites with primary and secondary dendritic arms with segregation of refractory metal (Mo, Nb) in interdendritic areas. The dark grey region observed in
Figure 7a–d is a dendritic core/matrix (γ austenitic phase) and interdendritic regions look brighter, resulting from the micro-segregation of Nb and Mo [
26].
Micro-segregation occurs due to the redistribution of solutes during the solidification of the weld pool. These micro-segregated phases are usually brittle and are known to negatively affect the toughness and tensile strength of the welds. Their presence signifies inhomogeneous solute distribution, which correlates with the deteriorated mechanical properties observed in higher heat-input samples such as A1 [
25].
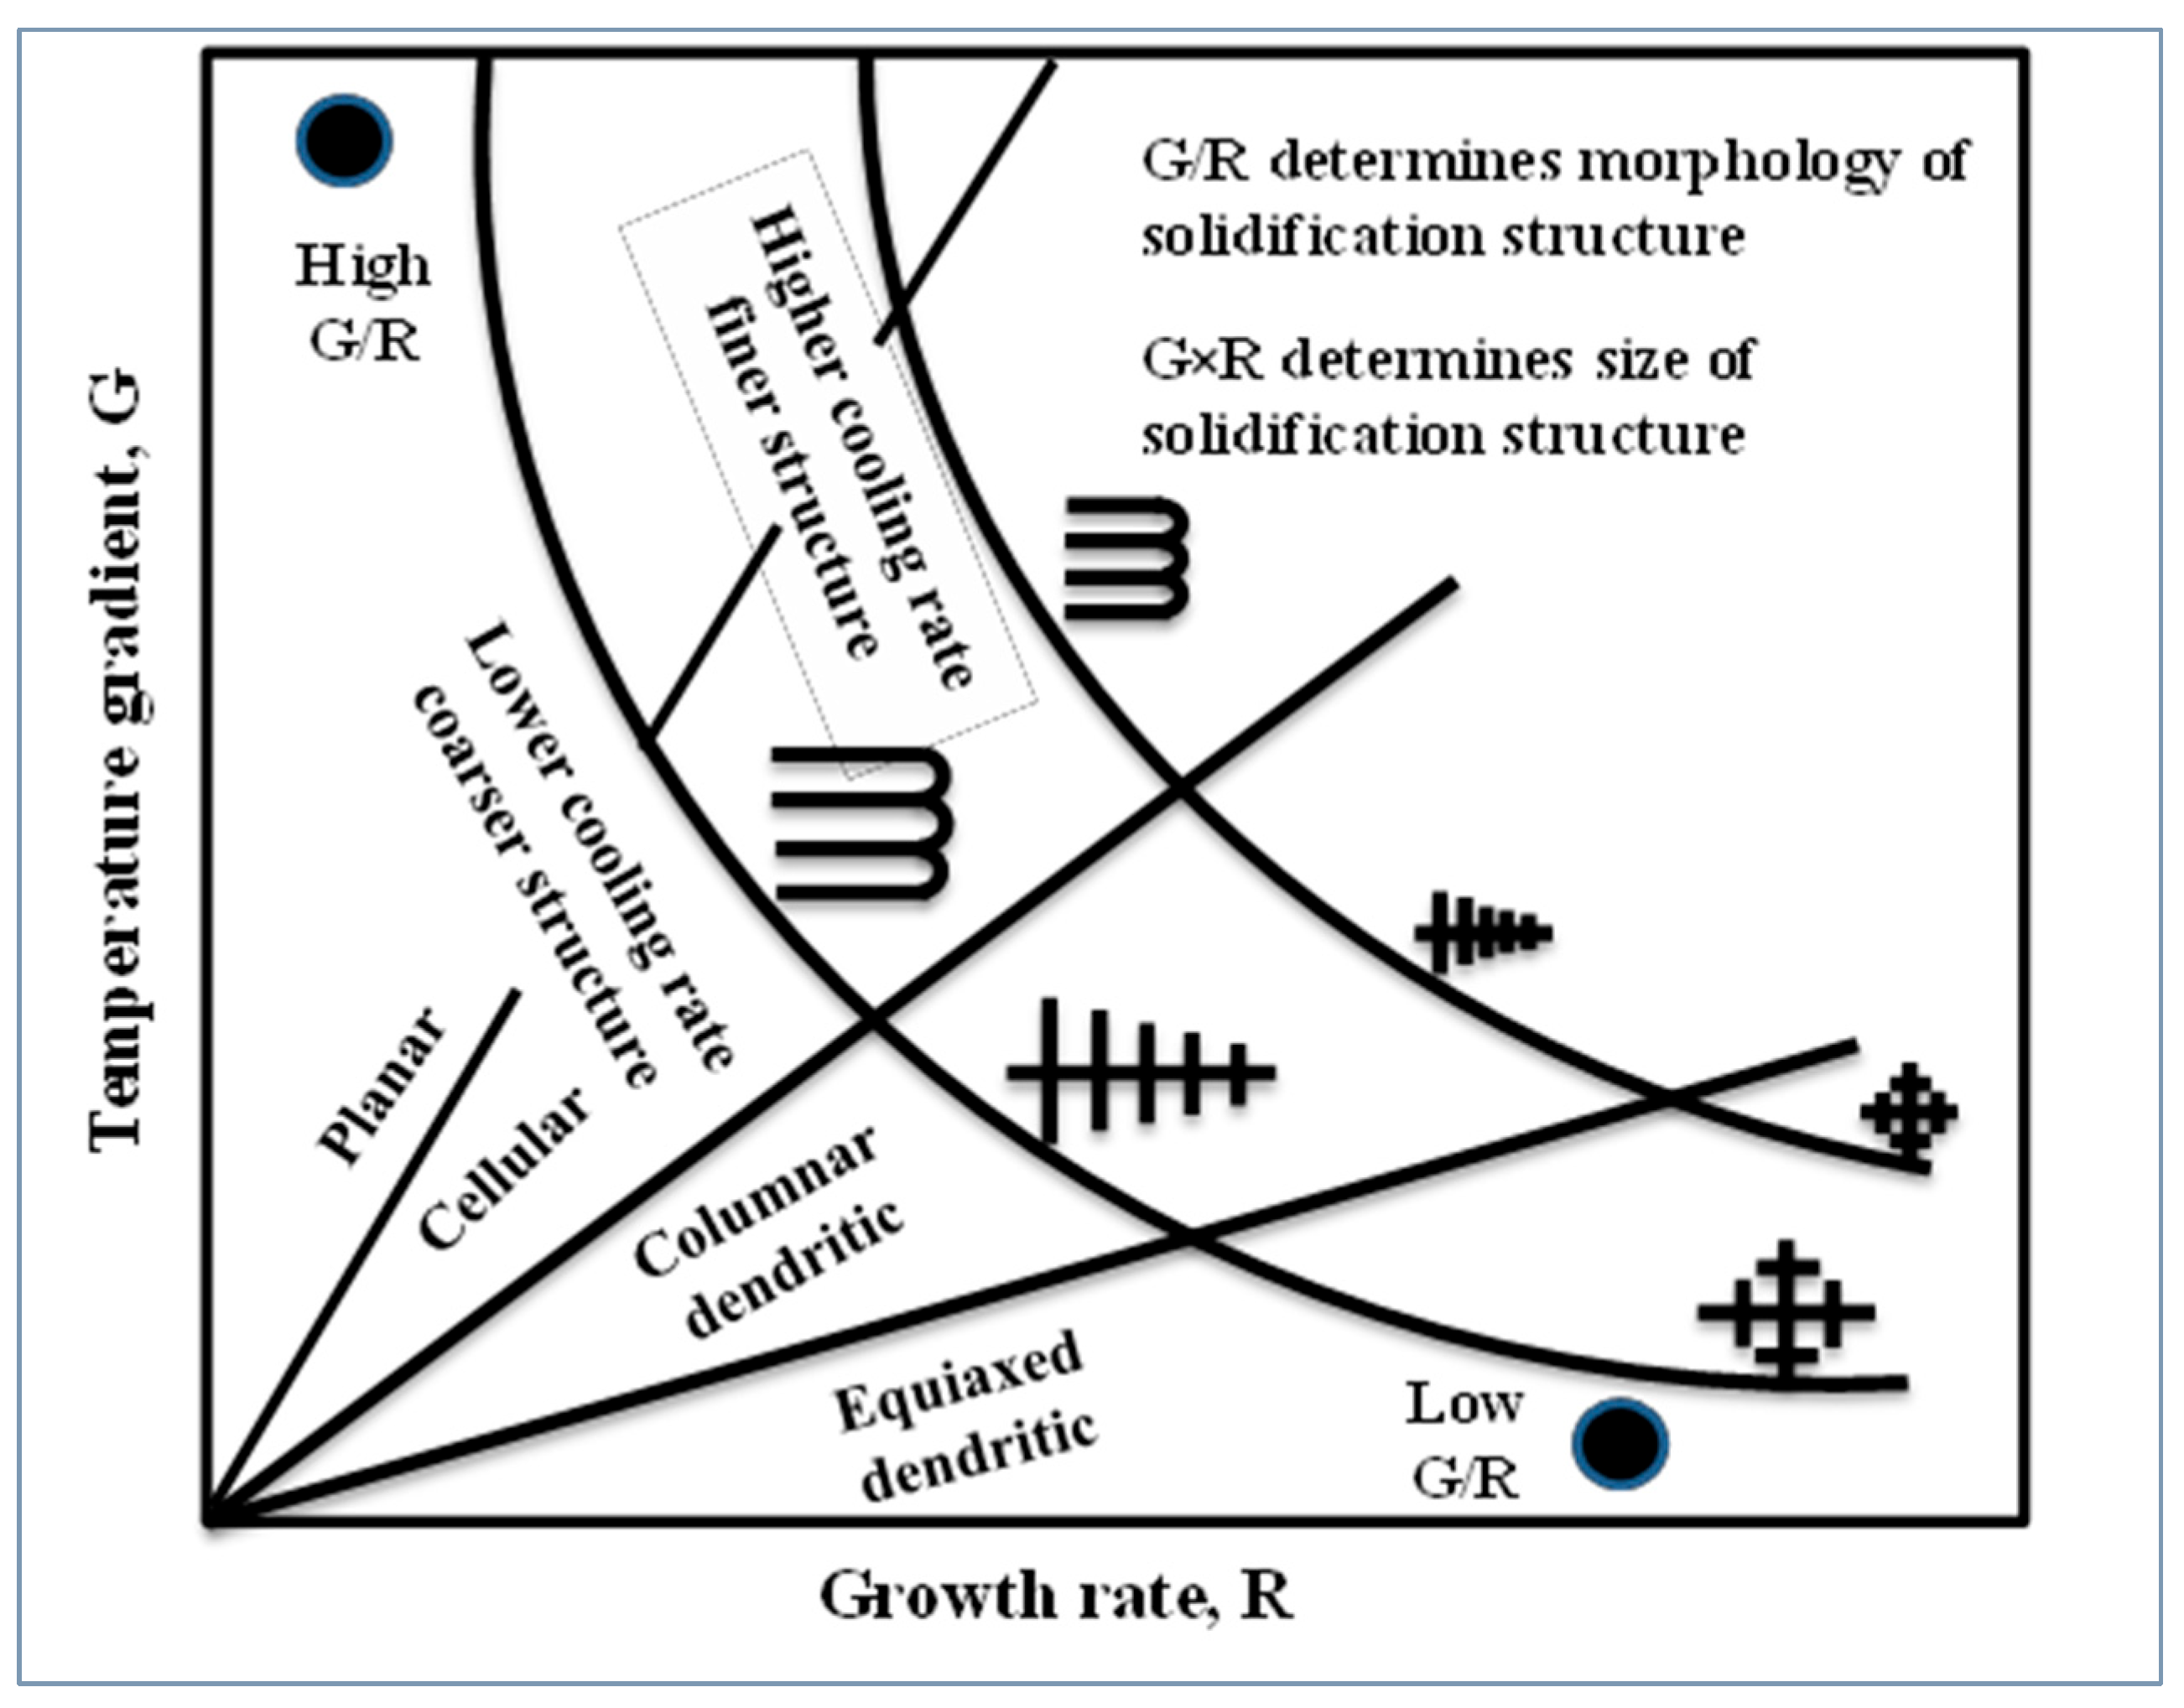
The mode of solidification (columnar, cellular, or equiaxed) is primarily dependent on the factor G/R. Here, thermal gradient (G) is influenced by the heating and cooling rates, while growth rate (R) is determined by the welding speed at the solid–liquid interface of the weld metal. A high G/R ratio indicates a large temperature gradient relative to the solidification rate, and it results in columnar dendrites formation. In this mode, dendrites grow predominantly in the direction of the temperature gradient, forming elongated columnar structures. As the G/R ratio decreases, the solidification process transitions to cellular mode. In this case, the dendrites form a cellular structure, branching out in various directions perpendicular to the temperature gradient. Also, the solidification structure is dependent on G × R (i.e., cooling rate), and this morphology of formation of grain has been depicted schematically in
Figure 8. A high cooling rate (G × R) results in the formation of fine dendritic grains, whereas a low cooling rate results in large and coarse grain formation [
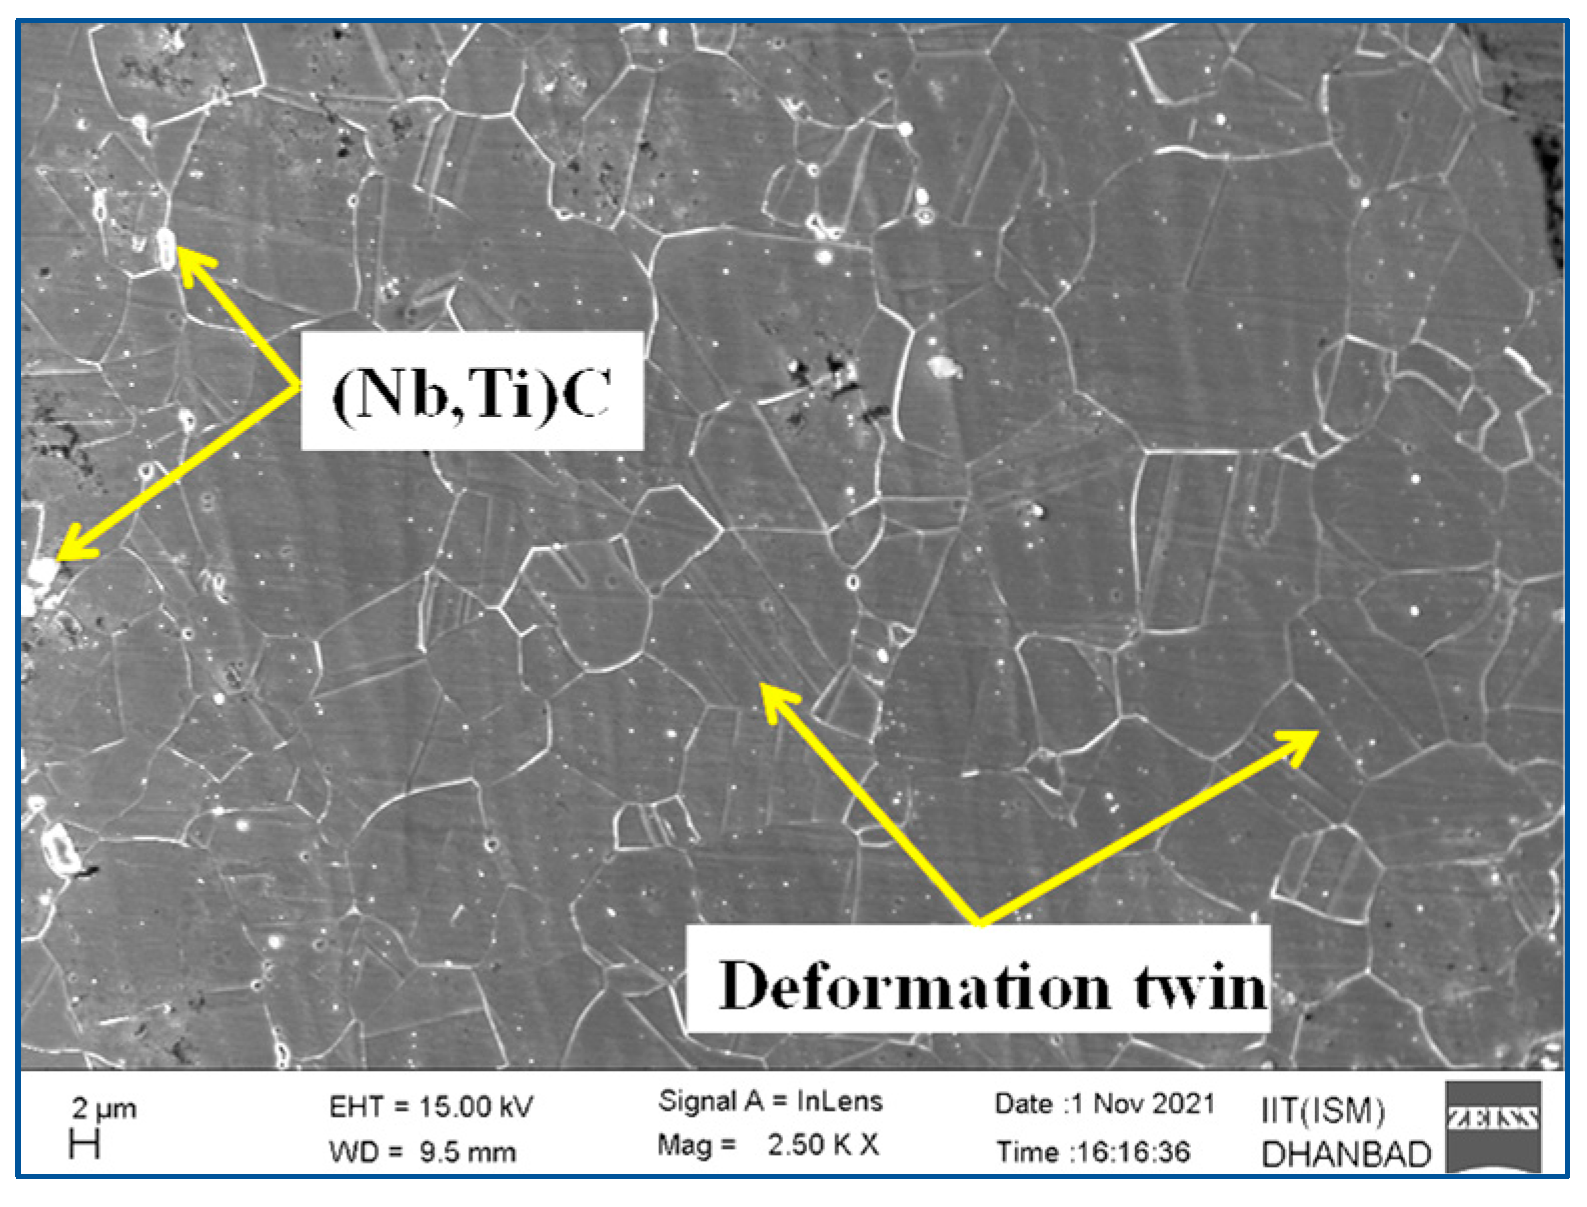
22]. The variations in the grain morphology of the FZ and parent material can be seen; bright phases look more apparent in the FZ (
Figure 7a–d) than in the parent metal (
Figure 1), which confirms the effect of micro segregation in the FZ. Examining the weld joints of A1 (43 J/mm) and A2 (32.2 J/mm), the microstructure in the FZ exhibited growth of grain in multiple directions, comprising columnar and cellular dendrites with coarser secondary dendritic arms, as depicted in
Figure 7a,b. The microstructure displayed in
Figure 7c,d for weld joints A4 (21.5 J/mm) and A5 (18.5 J/mm) is cellular and columnar with fine primary as well as secondary dendritic arms. The reason is that, as the rate of cooling increases, dendritic arm spacing could decrease. The rate of cooling for sample A5 (i.e., 3.65 × 10
3 °C/s) was higher than A1 (i.e., 1.45 × 10
3 °C/s), as shown
Figure 4d. As stated by S. Kou [
28], dendritic arm spacing is inversely proportional to the rate of cooling, and the higher the cooling rate, the smaller the secondary dendritic arm spacing will be. The smaller the dendrites’ arm spacing, the finer the dendritic structure formation takes place. It was earlier stated that with increasing heat input or a decrease in cooling rate, large dendritic arms are formed by coalescing smaller ones to curtail the total surface energy of the material undergoing solidification.
Quantitative microstructural analysis of SEM images for samples A1–A5 is shown in
Table 4. It was conducted by utilizing an automated workflow in Python version 3.8.10. Each image was partitioned into sub-regions and transformed into greyscale to ensure uniform analysis. Scale calibration was determined using the 2 μm bar, which corresponds to 89.211 pixels, resulting in a spatial resolution of 0.0224 μm per pixel. To quantify primary and secondary dendrite arm spacings (PDAS and SDAS, respectively), the workflow employed intensity autocorrelation and directional band-pass filtering: autocorrelation identified periodic dendritic structures, while the filter accentuated fine details and minimized background noise. The initial prominent peaks of the autocorrelation function along orthogonal directions were interpreted as PDAS and SDAS in pixels, subsequently converted to micrometres.
Samples A1 and A2 exhibited relatively coarse dendritic structures, with primary dendrite arm spacings (PDASs) of approximately 22.72 ± 1.81 μm and 22.64 ± 2.11 μm, respectively. The secondary arm spacings (SDASs) were approximately 0.68 ± 0.067 μm and 0.62 ± 0.055 μm, respectively. These results imply a slower solidification rate in the samples and thermal conditions that facilitated the growth of larger dendrites. In comparison, samples A4 and A5 exhibited significantly finer dendrites, with PDASs of approximately 0.856 ± 0.072 μm and 0.826 ± 0.069 μm, respectively, and SDASs of around 0.59 ± 0.054 μm and 0.56 ± 0.057 μm, respectively, indicating rapid solidification at elevated cooling rates.
3.4. Micro-Segregation and Laves Phase Formation Analysis
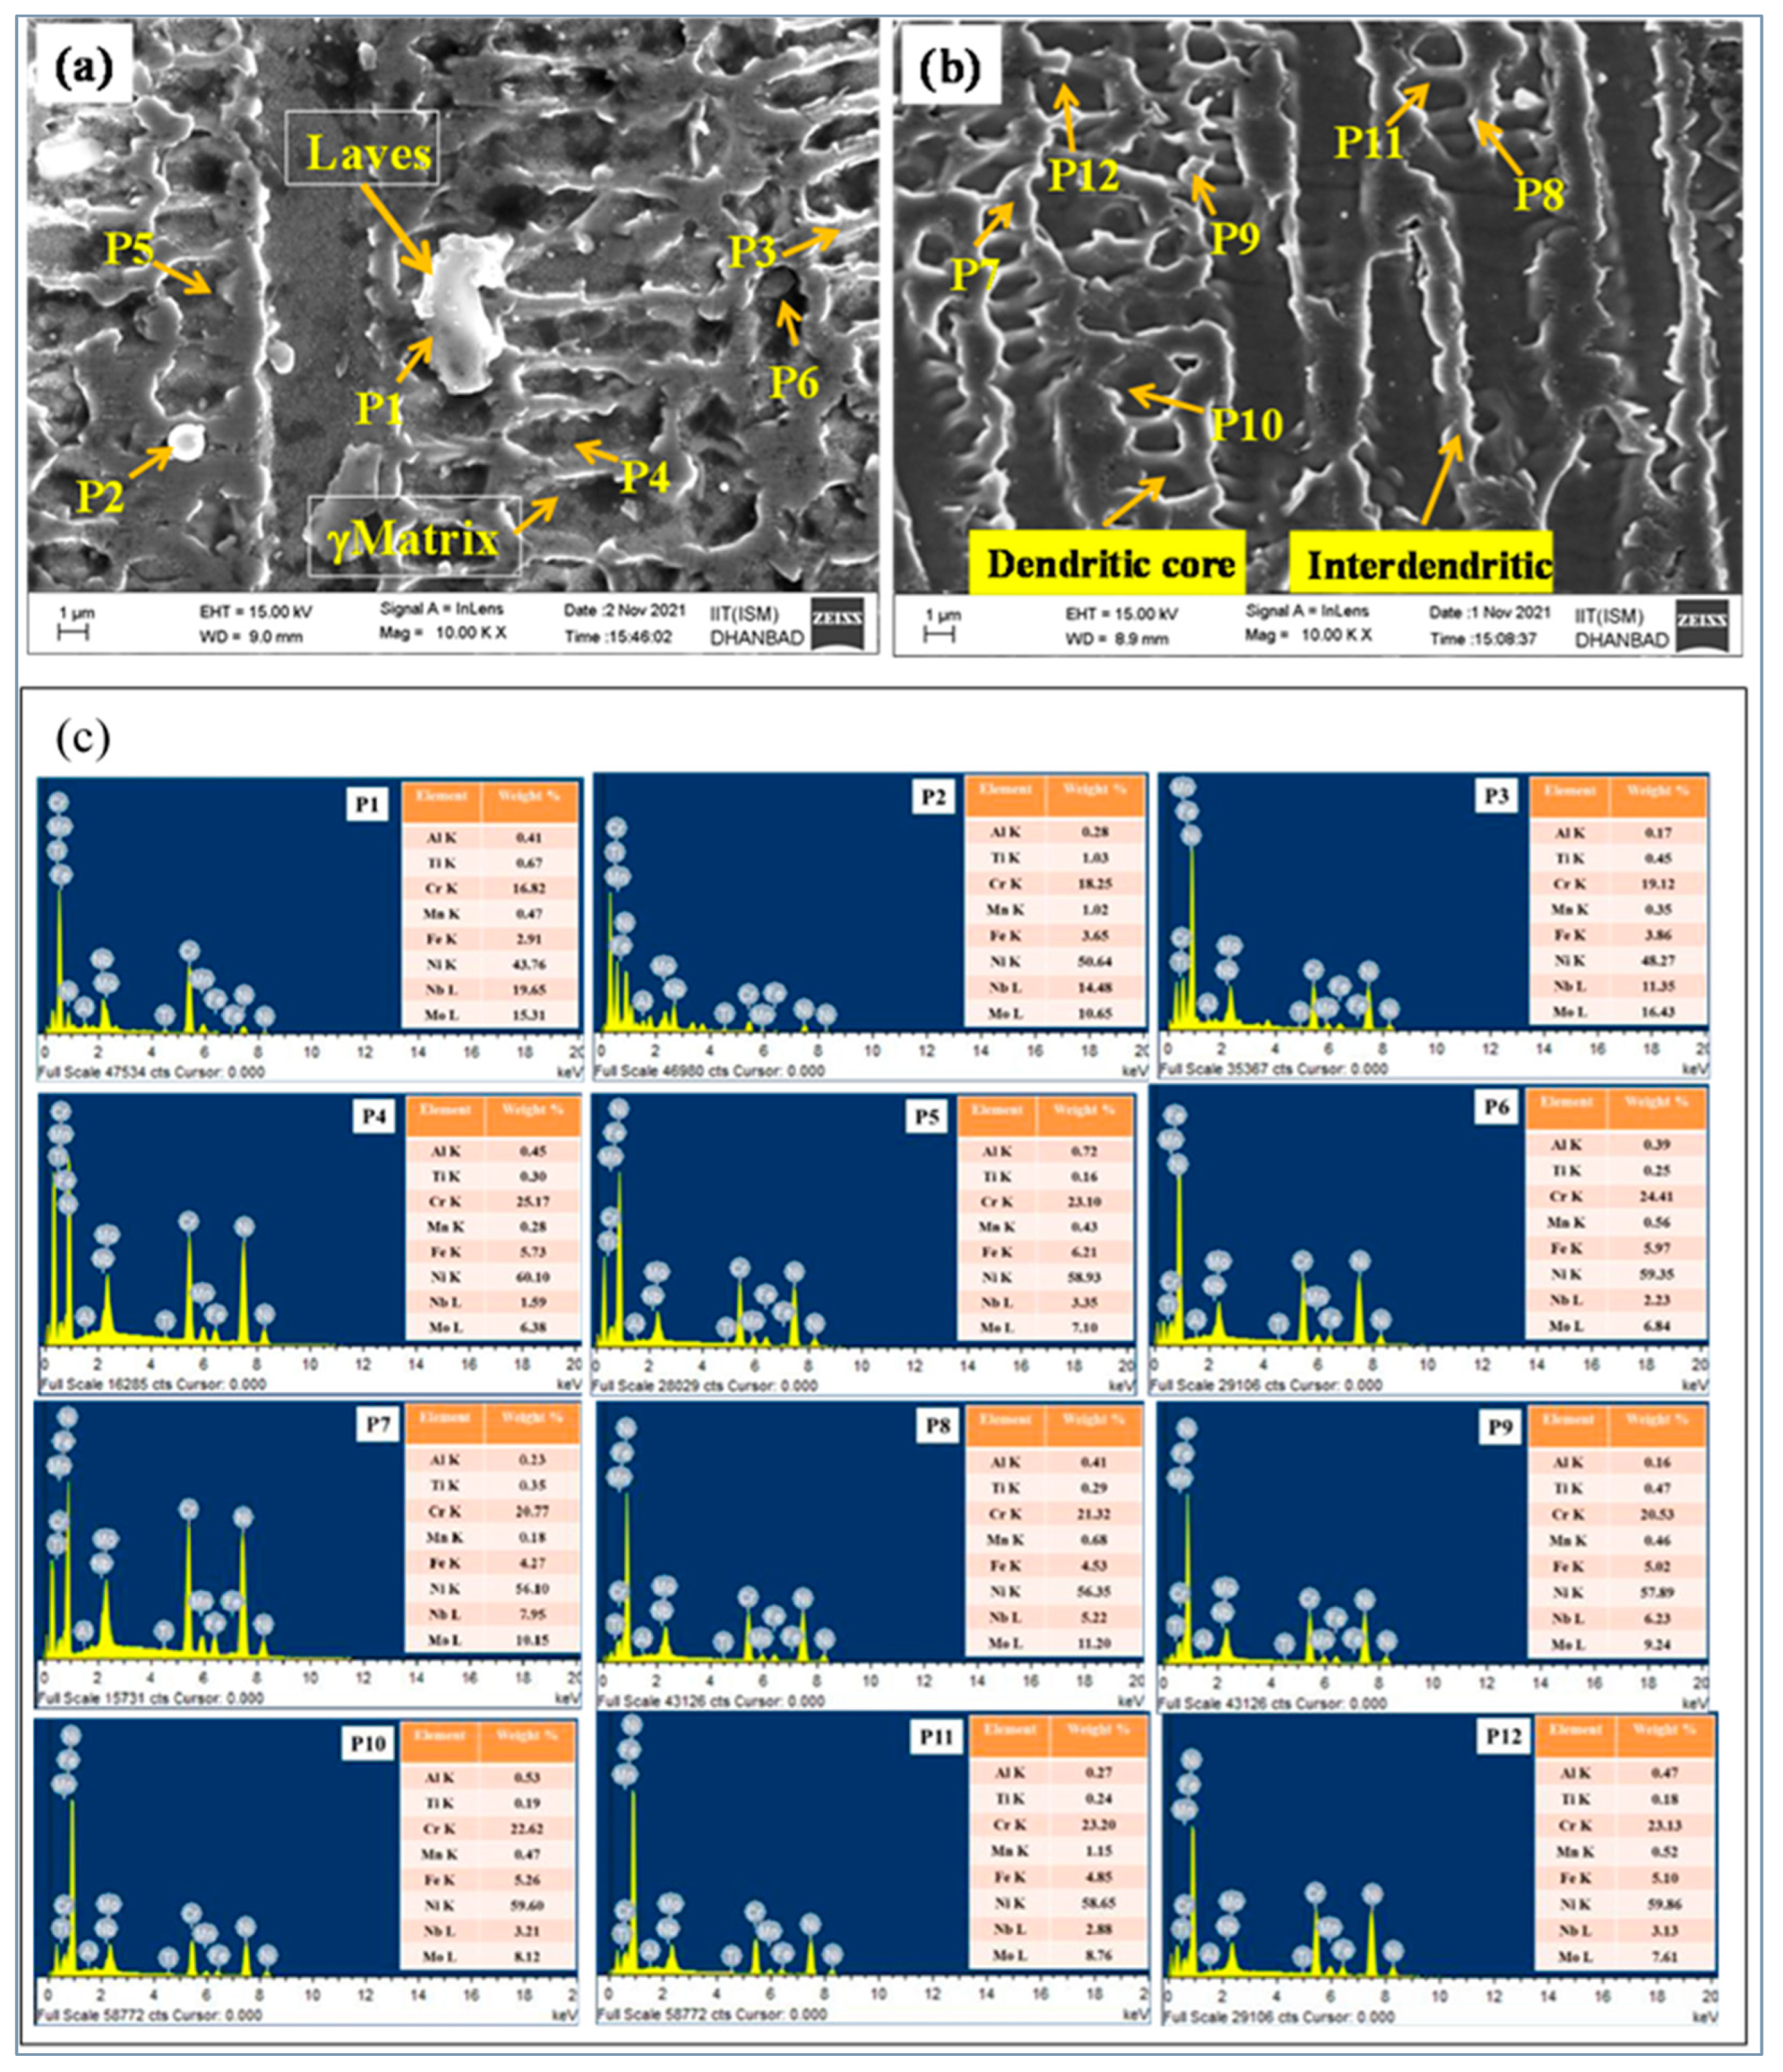
EDS point analysis for weld samples A1 and A5 were carried out at various locations in
Figure 9a,b to analyze the elemental composition which is given in
Table 5. EDS analysis was presented only for samples A1 (43 J/mm) and A5 (18.5 J/mm) as the difference in heat input is maximum between these two samples. So, the microstructural variations were very prominent to explain/cover all the aspects of elemental distribution, segregation, and precipitation. EDS graphs P1–P6, as shown in
Figure 9, are taken for weld sample A1, and similarly, P7–P12 are taken for weld sample A5. The EDS data in
Table 5 show that interdendritic regions are richer in Nb, Mo, and Ti than in dendritic core regions. The compositional gradient between the core of dendrites and the interdendritic region represents the micro-segregation, resulting in Laves formation. Laves are brittle intermetallic phases that deteriorate the mechanical properties of weld joints [
29].
Laves formation is because of the micro-segregation of Mo and Nb caused by non-equilibrium solidification. As the solidification begins, Nb and Mo are continuously rejected from the dendritic core to interdendrites. Rejection of elements (Nb and Mo) continues until the interdendritic region (grain boundary) becomes saturated, final solidification terminates, and Laves phase tends to form [
30]. The presence of Fe and Cr in a Ni-based superalloy has a significant impact on the rejection of Nb. The solubility limit of Nb in Fe is low, and therefore, intermetallic compounds are formed, which can be corroborated by a Nb–Fe phase system [
31].
Solidification of Inconel 625 weld commences with the formation of γ dendrites. At the core of this microstructure, the alloying elements (Nb and Mo) are observed to be deficient. The sequence of solidification can be phased as L → L + γ → L + γ + Nb/TiC→ γ + Laves [
32].
Figure 10 shows the schematic process of microstructure evolution in the Inconel 625 FZ. During solidification, Mo and Nb segregate preferentially to the interdendritic regions due to the low solubility of these elements in γ dendrites [
33]. As solidification progresses, Mo and Nb are continuously rejected from γ dendrites and accumulate at the solid–liquid interface (interdendritic region). As the ratio of Nb to Cr increases locally, the formation of γ + laves phase takes place, which further results in the appearance of a γ/laves eutectic microstructure. This phenomenon is in tandem with the EDS point analysis depicted in
Figure 9a,b and
Table 5, which reveals that the amount of Nb in the interdendritic region is higher than that of what was observed in the austenite matrix of the FZ. For weld sample A1, the weight percentage of the Nb in interdendritic regions varies from 11.35 to 19.65%, while for Mo, it was in the range of 10.65–16.43%. Similarly, for weld sample A5, Nb concentration was 5.22–7.95 wt%, and Mo was observed in the range of 9.24–11.20 wt%.
Figure 11 depicts the EDS area mapping analysis for weld sample A1. Area mapping of the elements indicates non-uniform distribution of constituents within the matrix. As illustrated in
Figure 11, the density of Mo and Nb particles is higher in the interdendritic zones, resulting in the formation of a microstructure enriched with Mo and Nb. On the other hand, the core of the dendrites is rich in Cr and Ni particles. Elements Mn and Ti were found to be uniformly distributed. Evaluating the two weld samples from
Table 5 and
Figure 9, it manifests that samples welded at the lowest heat (A5-18.5 J/mm) have lower segregation of Mo and Nb than those were welded at the higher supply of heat (A1-43 J/mm). A lesser amount of Mo and Nb segregation causes a lower volume of Laves phase formation. The reason attributed to the higher cooling rate of weld sample A5 than A1 results from insufficient time for solute redistribution [
32].
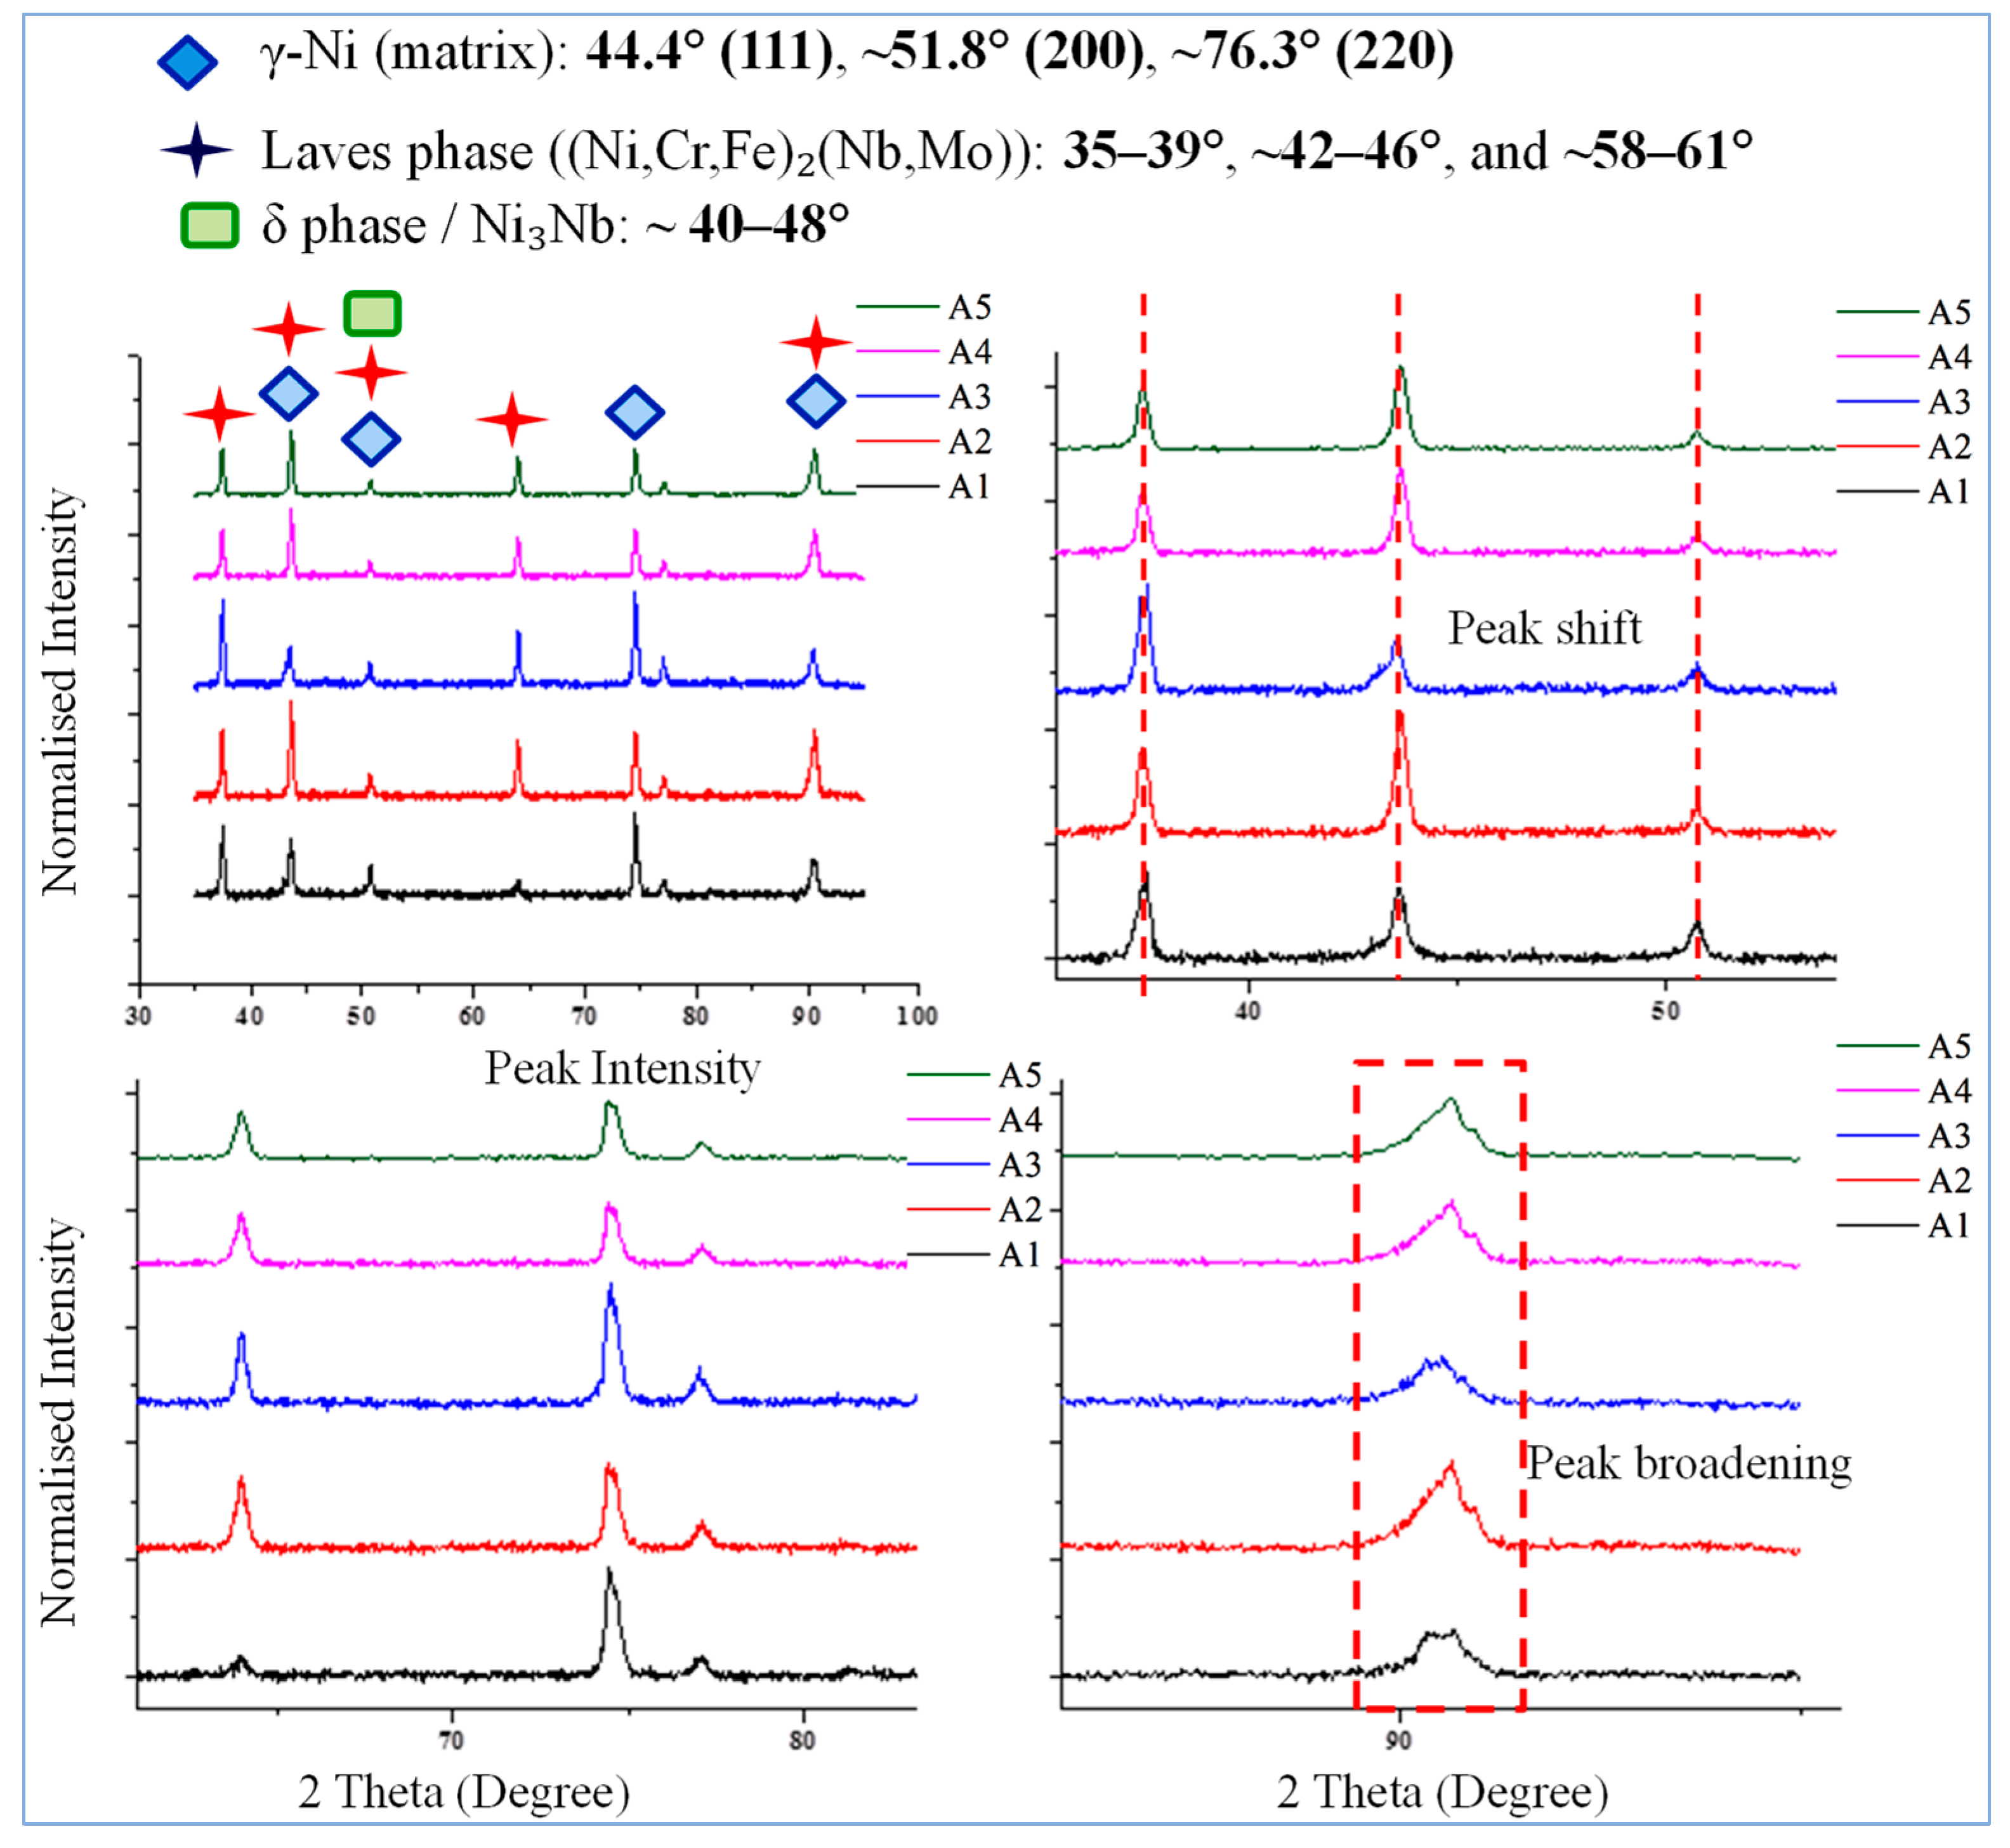
To better understand the phase formations, XRD analysis was carried out for some of the experimental results.
Figure 12 shows the XRD patterns of Inconel 625 weldments processed at varied scan speeds, which indicate major microstructure changes related to heat input and cooling rates. Slow scan speeds (A1 and A2) cause the weld pool to cool slowly, micro-segregating refractory elements like Nb and Mo into the liquid between the dendrites. This promotes Nb/Mo-rich Laves intermetallic phases, which appear as secondary diffraction peaks at 35–39°, 42–46°, and 58–61° in XRD spectra. The Laves phase is more crystalline and has a higher volume percent because samples A1 and A2 have sharper and more dramatic peaks. Slower cooling allows the Laves phase to precipitate in an orderly manner; hence, the sharp peaks indicate coarse dendritic structures. However, when the scan speed increases (from A3 to A5), the cooling rate increases, reducing elements partitioning and Laves phase formation. The secondary peaks in samples A4 and A5 gradually decrease and nearly disappear.
High scan speeds reduce Nb and Mo segregation and prevent interdendritic eutectic Laves. Shifts in principle γ-Ni peak intensities demonstrate the impact of scan speed on weld microstructure. A low scan speed results in greater intensities and narrower γ peaks due to coarser grains from sluggish solidification. As the scan speed increases, γ peaks become less strong and broader. The grains cool faster, making them finer. Peak broadening is linked to dendrite arm spacing reduction and tiny cellular–dendritic structures. More grain boundaries and crystal imperfections reduce coherent X-ray scattering in these materials. Due to thermally generated residual stresses, the quicker cooling rate generates micro-strain in the weld metal, widening the diffraction peaks in samples A4 and A5. Across scan speeds, peak shifts are consistent. At decreasing scan speeds, γ-Ni peaks appear to shift towards lower 2θ values. When dendritic cores include more Nb and Mo atoms, the lattice grows. These large refractory elements increase the lattice parameter and decrease the diffraction angle. As scan speeds increase, peaks shift towards higher 2θ values, indicating a smaller lattice spacing. Rapid cooling reduces solute retention in the matrix, resulting in a cleaner and less deformed γ-Ni lattice. The peak shift towards higher angles is strengthened by compressive micro-strain caused by fast thermal contraction at high scan rates. In general, XRD research shows that greater scan speeds cool faster. This slows Laves phase formation, improves microstructure, broadens peaks, and induces modest but significant peak changes. Results show that high-speed laser welding reduces segregation and promotes a more uniform γ-Ni matrix in Inconel 625 weldments.
3.5. Microhardness Analysis of Welded Sample
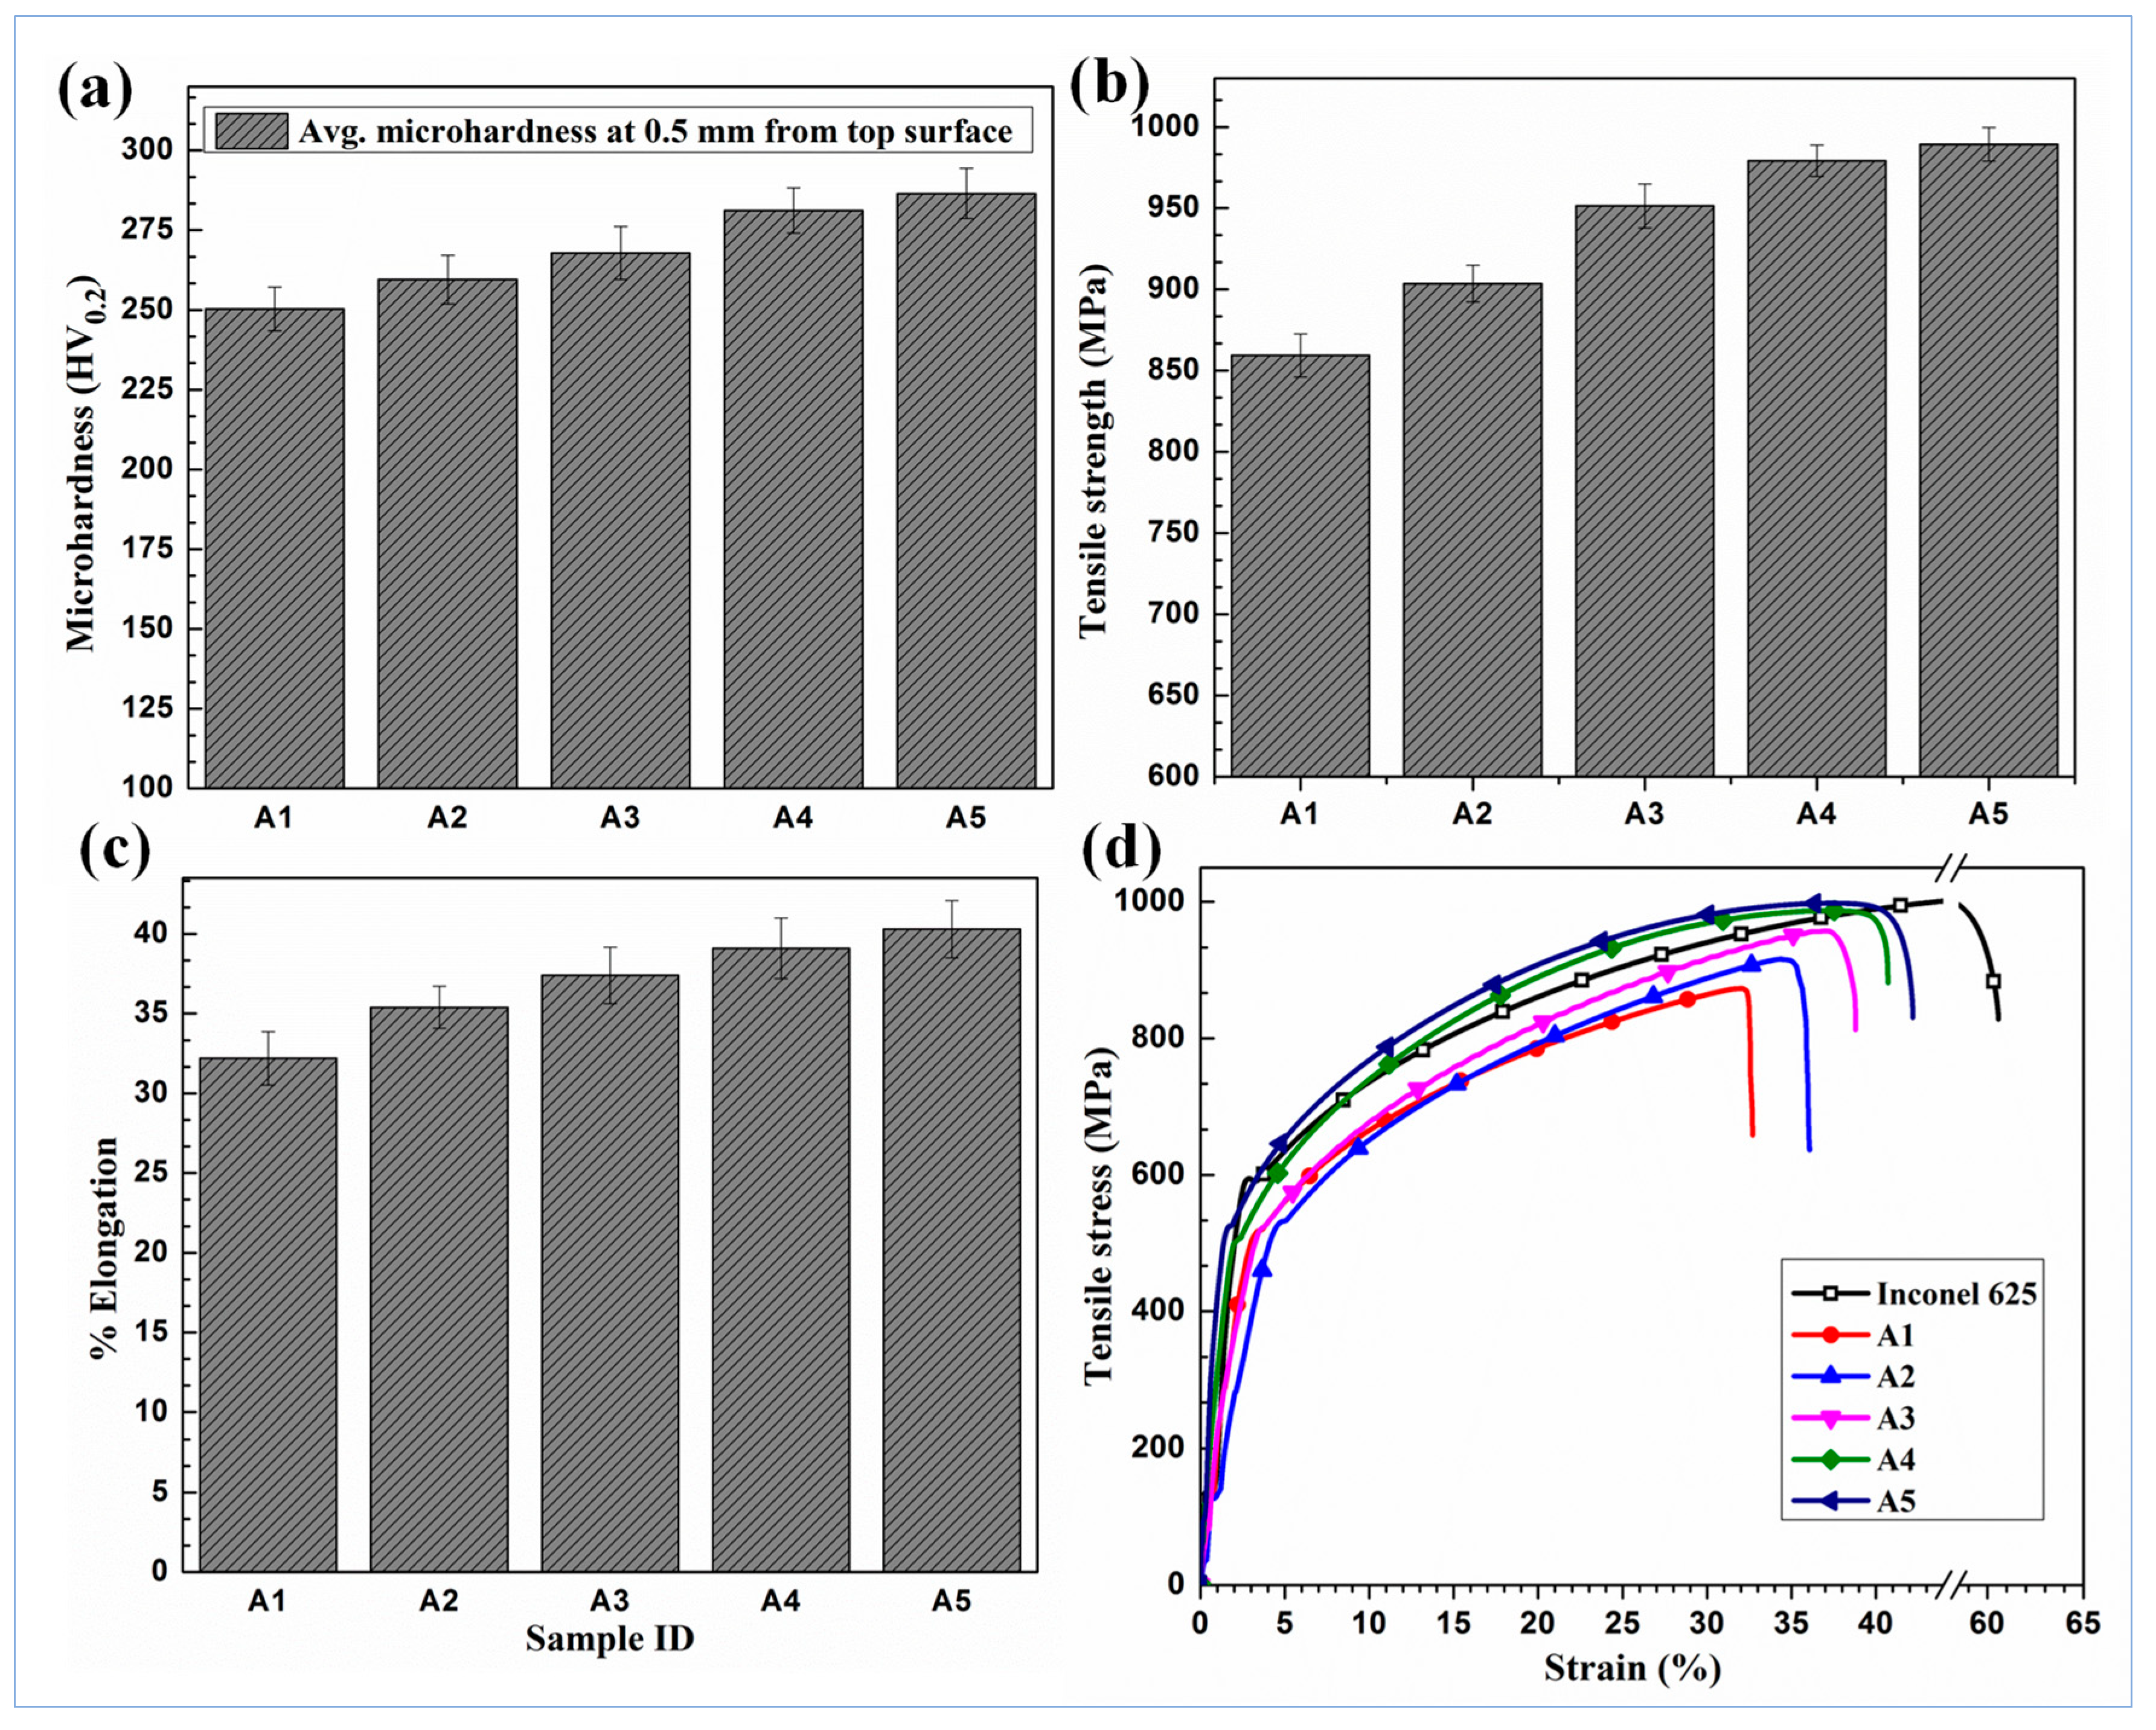
Figure 13a demonstrates the change in micro-hardness of the FZ for the various weld samples (A1–A5) taken along the weld cross-section. The average hardness of the parent metal, Inconel 625, was reported to be 268.2 ± 8.1 HV. From
Figure 13, it is observed that the average hardness of the FZ increases from 250.3 ± 6.9 HV to 286.5 ± 7.9 HV with the decreasing heat input from 43 J/mm (A1) to 18.5 J/mm (A5). Microhardness in the FZ depends on the size of dendritic grains, the distribution of solute elements, and phase transformations [
34]. With the decreasing heat input from sample A1 to A5, the cooling rate increases. Increasing the cooling rate results in fine dendritic grain formations and strengthening alloying elements like Mo and Nb entrapped within the γ matrix. Due to this, microhardness in the FZ is highest for weld sample A5.
3.6. Tensile Testing and Fractographical Analysis
Three tensile samples were load tested and the average values were taken to avoid any systematic errors. The values were plotted using stress–strain curves for samples subjected to different heat inputs.
Figure 13b,c present the histograms of tensile strength and percentage elongation measured in transverse sections, as shown in
Figure 3, of welded joints, respectively.
The stress–strain curve for the base material and laser-welded samples A1 to A5 are shown in
Figure 13d. The tensile properties of the weld joints increase with the decrease in heat input from sample A1 to A5. Ultimate tensile strength for sample A1 was found to be 859.4 ± 13.2 MPa, and the percentage elongation was 32.2 ± 1.67%. For sample A5, the values for ultimate tensile strength and percentage elongation were reported as 989.3 ± 10.4 MPa and 40.3 ± 1.8%, respectively. The maximum failure strength of weld joint A5 is close to the strength of the parent metal (1005 ± 12 MPa). The failure for all the samples welded at different heat inputs occurred in the FZ only.
The enhancement of mechanical properties by changing the process parameters from A1 to A5 is primarily due to increased cooling rate, resulting in grain refinement, reduced micro-segregation, and suppression of brittle Laves phase formation [
35]. When weld sample A5 is subjected to tensile load, an increased rate of cooling and homogenized grains in the weld microstructure enables more pinning and dislocation, providing better strength to A5. Domination of the Laves forming element (i.e., segregation of Mo and Nb) at a lower rate of cooling for sample A1, in comparison to A5, weakened the FZ. Intermetallic Laves, being hard and brittle in nature, display unsatisfactory plastic flow features and result in the lowest tensile strength obtained for sample A1.
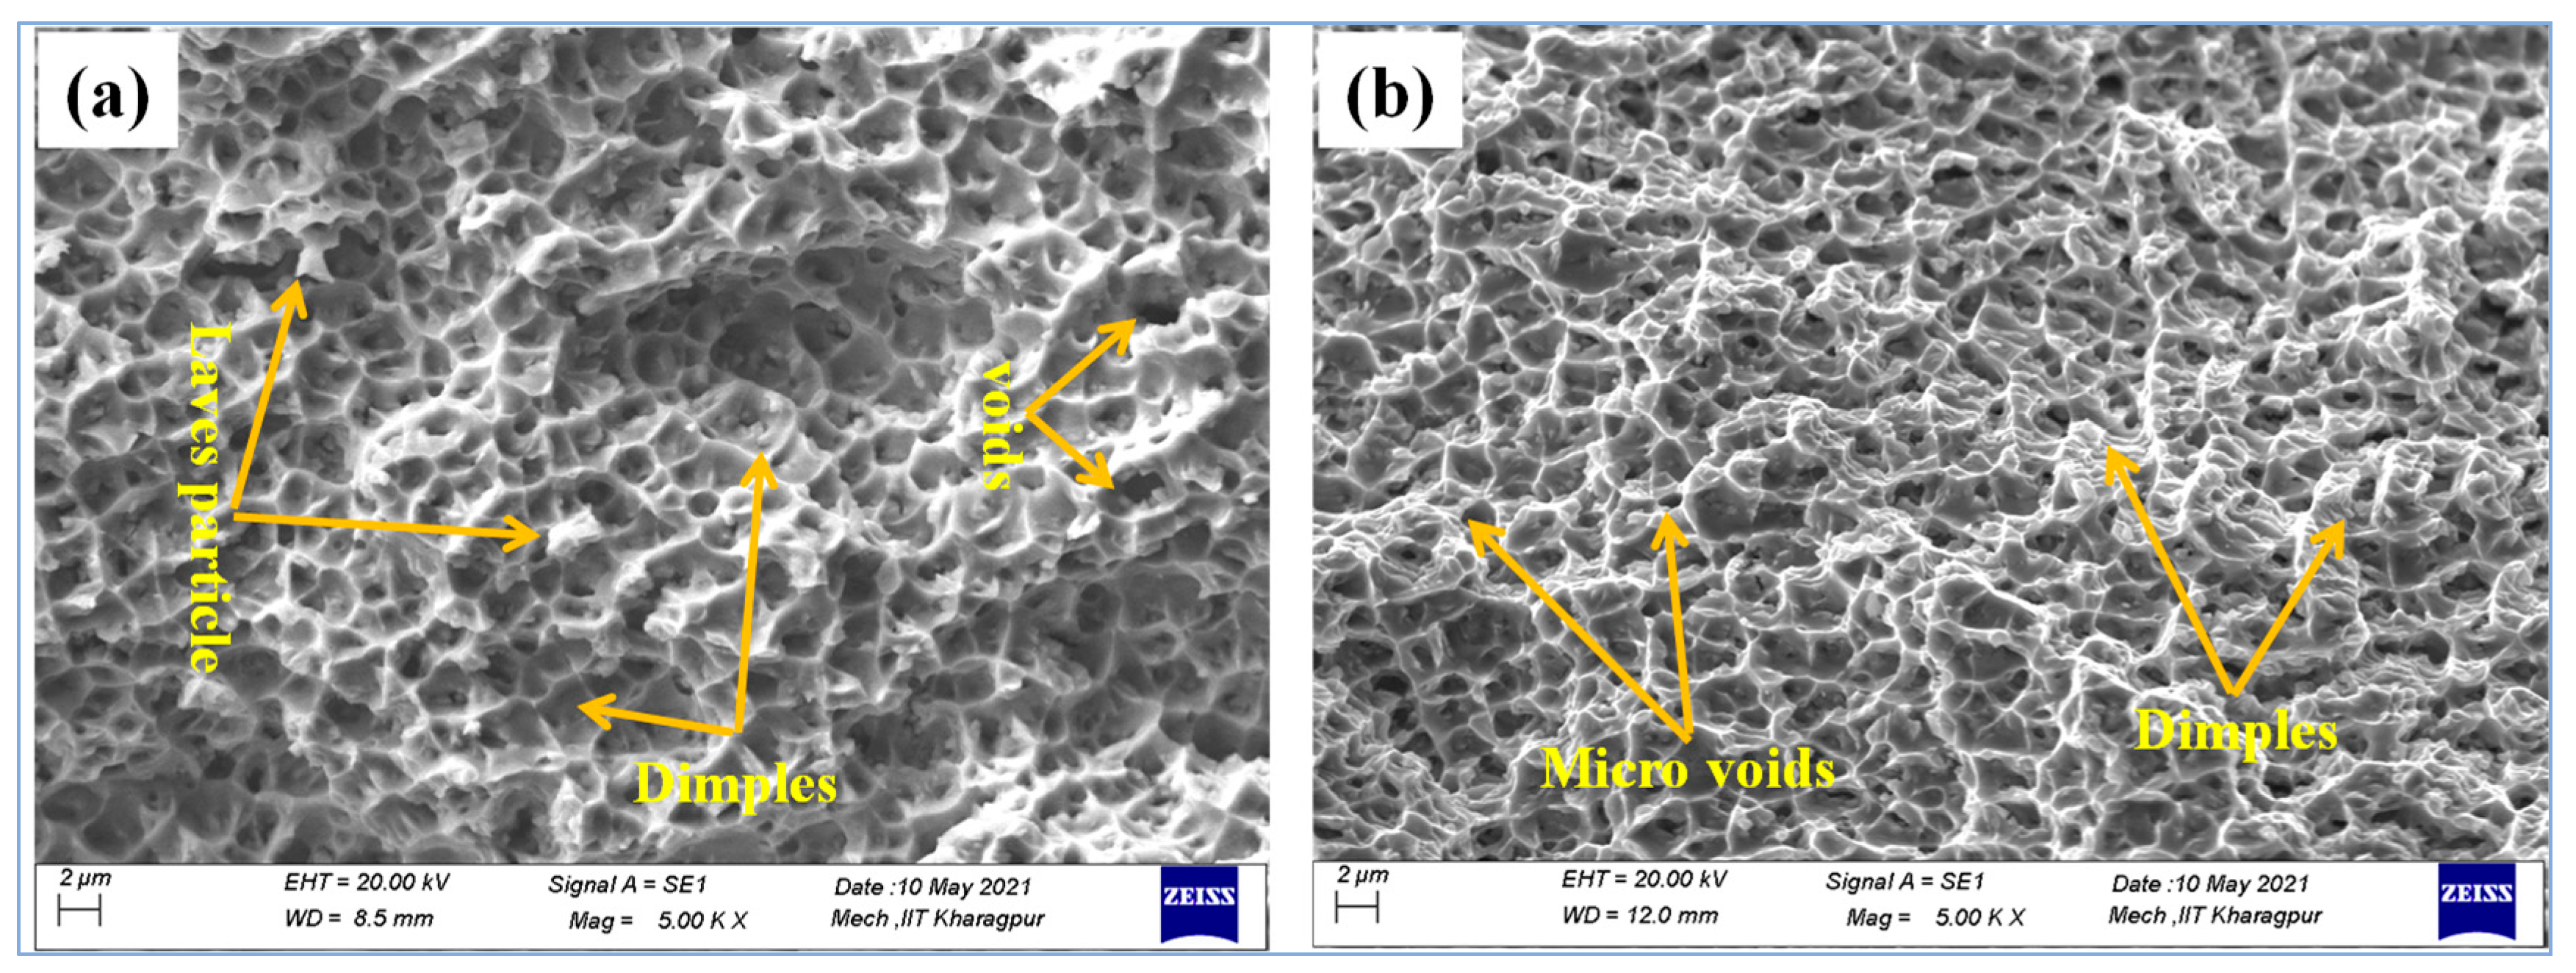
Figure 14a,b show the magnified view of the cross-section of fractured surfaces of the tensile-tested weld samples A1 and A5. A fracture SEM image of weld sample A1 (
Figure 14a) confirms the presence of Laves particles in the grain boundary, coarse dimples, and micro-voids, which indicate combined quasi cleavage and ductile failure. The occurrence of Laves particles in the interdendritic regions of the FZ favoured the initiation of micro-voids/cracks on Laves/matrix, resulting in quasi-cleavage failure, and due to the presence of dimple in the matrix, the fracture is ductile [
36].
Figure 14b shows the fracture surface of weld sample A5, which has a well-formed structure of fine ductile dimples and micro-void coalescence. The fine dendritic grains of the weld sample are primarily responsible for such observations. The fine dimples indicate that more energy was absorbed during the fracturing process and thus resulted in ductile failure [
9].
4. Conclusions
In conclusion, this study demonstrates the relationship between heat input, cooling rates, microstructure, elemental distribution, and mechanical properties in Inconel 625 weld joints. The findings of this investigation provide valuable insights for optimizing the fabrication of high-quality Inconel 625 joints using LBW for various industrial applications. Several key findings that emerged from this study are mentioned below.
The well-bonded and defect-free joints of Inconel 625 were obtained using fibre laser welding with different heat-input conditions. The quality of the weld metal was found to be dependent on the cooling rate during the solidification process after the LBW.
With the decrease in heat input from sample A1 to A5, the cooling rate of the molten weld pool increased from 1.45 × 10³ °C/s to 3.65 × 10³ °C/s, respectively, due to increase in the thermal gradient of the melt pool. The melt pool lifetime of the weld sample decreases with the decrease in heat input.
Weld bead shapes change from an hourglass shape to a truncated-cone shape with the decrease in melt pool lifetime.
The microstructures in the FZ exhibit grain growth in multiple directions and comprise both cellular as well as columnar dendrites with coarser secondary dendritic arms at high heat inputs and comparatively fine cellular and columnar dendrites at low heat inputs.
EDS point analysis shows segregation of Nb and Mo in the interdendritic region of the weld metal. The concentration varies in the range for Nb (11.35–19.65%) wt% and Mo (10.65–16.43%) wt% for weld sample A1, and similarly for weld sample A5, Nb (5.22–7.95) wt% and Mo (9.24–11.20) wt%. A higher cooling rate for weld sample A5 compared to A1 results in less segregation of Mo, Nb, and Laves formation because of its inability to redistribute solute within a small time.
Micro-hardness testing of the weld metal revealed that with decreasing heat input from sample A1 to A5, the hardness value increases. A high cooling rate results in the formation of fine dendritic grains and strengthening elements get entrapped in the γ matrix.
The weld joint tensile strength increased with the decrease in heat input. Lower heat input combinations showed a higher cooling rate leading to the formation of more homogenized and fine grains, which helped increase pinning and dislocation when subjected to tensile load.
The weld joints exhibited a maximum failure strength of 989.3 ± 10.4 MPa and a percentage elongation of 40.3 ± 1.8% for weld sample A5. This strength is remarkably close to that of the parent metal, which was measured at 1005 ± 12 MPa.
Future work related to process monitoring could be carried out by correlating the thermal signatures along with optical data of beat size and surface defects so that more robust feedback systems can be integrated to automate the welding process of such super alloys.
