Article

Modeling Fatigue Crack Growth Under Compressive Loads: The Role of Non-Monotonic Stress and Crack Closure

by
Yahya Ali Fageehi
and
Abdulnaser M. Alshoaibi
*
Department of Mechanical Engineering, College of Engineering and Computer Sciences, Jazan University, Jazan 45142, Saudi Arabia
*
Author to whom correspondence should be addressed.
Crystals 2025, 15(11), 979; https://doi.org/10.3390/cryst15110979
Submission received: 26 October 2025 / Revised: 7 November 2025 / Accepted: 13 November 2025 / Published: 14 November 2025
(This article belongs to the Special Issue Fatigue and Fracture of Crystalline Metal Structures)

Abstract

A comprehensive numerical investigation of Fatigue Crack Growth (FCG) under negative stress ratios (R < 0) was conducted using the Finite Element Method (FEM) and the ANSYS Benchmark 19.2 SMART crack growth module on modified Compact Tension (CT) specimens. This study addresses the critical challenge posed by the compressive portion of cyclic loading, which traditional Linear Elastic Fracture Mechanics (LEFM) models often fail to capture accurately due to the complex interaction of crack closure and reversed plastic zones. The analysis focused on the evolution of the von Mises stress and maximum principal stress distributions at the crack tip across a range of stress ratios, including R = 0.1, −0.1, −0.2, −0.3, −0.4, −0.5, and −1.0. The results demonstrate a significant inverse correlation between fatigue life cycles and the magnitude of the negative stress ratio, consistent with the detrimental effect of increasing tensile stress. Crucially, the numerical simulation successfully captured the non-monotonic behavior of the crack tip stress field, revealing that the compressive load phase substantially alters the effective stress intensity factor range and the crack growth path, which was governed by the Maximum Tangential Stress (MTS) criterion. This research provides a validated computational methodology for accurately predicting FCG life in engineering components subjected to demanding, fully reversed, or compressive–dominant cyclic loading environments.

1. Introduction

The structural integrity of metallic components is a cornerstone of modern engineering, underpinning the safety and reliability of numerous applications. However, these components are rarely subjected to simple, static loads. Instead, they are often exposed to fluctuating or cyclic stresses over their operational lifetime. This cyclic loading introduces the insidious threat of metal fatigue, a progressive and localized structural damage process that is a primary cause of failure in engineered systems [1,2]. Unlike ductile failure, which is often preceded by visible plastic deformation, fatigue failure can be sudden and catastrophic, occurring without obvious prior warning. The process of fatigue failure is typically divided into three stages: crack initiation, crack growth, and final fracture. While crack initiation is a critical phase, the subsequent propagation of an existing crack, a process known as FCG, often consumes the majority of a component’s service life. Therefore, understanding the mechanics of FCG is paramount for designing durable structures and implementing effective maintenance and life-prediction strategies [3,4]. The field of fracture mechanics provides the essential tools for this analysis, enabling engineers to predict how a crack will grow under a given set of loading conditions [5,6]. The established framework for FCG analysis is LEFM, which uses the SIF range (ΔK) as the primary parameter governing the crack growth rate (da/dN). This framework has proven remarkably successful for a wide range of conditions, particularly for loading cycles that are purely tensile, defined by a positive stress ratio (R > 0) [7,8]. However, the operational reality for many critical components is far more complex. A significant number of real-world applications involve stress cycles that include both tension and compression, a condition defined by a negative stress ratio (R < 0). Such loading scenarios are prevalent across numerous industries. For instance, rotating components like shafts and axles naturally experience fully reversed loading (R = −1) with each revolution, cycling between tension and compression. In the aerospace and automotive sectors, structures such as aircraft wings and vehicle suspension systems are subjected to complex, fluctuating loads from gusts and road conditions, leading to cycles with negative R-ratios. Similarly, civil engineering structures like bridges endure variable stresses from traffic and environmental factors, while medical implants, such as artificial joints, undergo repetitive, compression–dominant loading during daily activities. Furthermore, negative R-ratios can modify the effects of load interactions, such as overloads and underloads. While overloads typically induce crack growth retardation at positive R-ratios due to residual compressive stresses, their effect can be more complex, sometimes leading to acceleration, under negative R-ratios. This behavior depends on the interplay between damage accumulation, residual stress shielding, and material properties [9,10]. The complexity extends to mixed-mode (Mode I-II) FCG under negative R-ratios, which is particularly relevant for pressurized structures subjected to multi-axial loading conditions [11]. Research into FCG at negative R-ratios has shown that as the compressive portion of the cycle increases (i.e., as R becomes more negative), the rate of crack growth decreases, and the fatigue life of the component increases. This is a direct consequence of the enhanced crack closure effect [12]. The primary reason that negative stress ratios complicate FCG analysis is the phenomenon of crack closure. When a compressive load is applied, the opposing crack faces can come into contact. This contact, which can arise from crack surface roughness or the accumulation of residual plastic deformation in the crack wake, shields the crack tip from the full extent of the stress cycle. The practical consequence is a reduction in the effective stress intensity factor range (ΔKeff) experienced at the crack tip, which can lead to a lower crack growth rate than predicted by considering the nominal stress range [13]. Several researchers have developed analytical and numerical models to predict crack growth under these conditions [3,4], but accurately simulating the contact mechanics of the crack faces remains a significant challenge for finite element models.
Recent research has underscored the limitations of traditional fracture mechanics parameters when applied to negative stress ratio conditions. As Benz [14] notes, for negative R-ratios, “the cyclic crack tip loading cannot be defined by ΔK and R,” highlighting a fundamental uncertainty in established predictive models. This is because the compressive portion of the load cycle introduces complex phenomena not fully captured by these parameters. Compressive loads can induce reversed plastic zones at the crack tip, which can significantly alter the crack opening levels and, consequently, the effective stress intensity factor range [15,16]. The interaction between compressive loading and crack closure mechanisms can lead to unusual FCG behavior, such as the tendency for FCG curves to become more uniform under negative stress ratios, and the generation of negative crack opening loads [17]. This complex interaction demonstrates that a more nuanced approach is required, one that accounts for the distinct mechanical behavior induced by compressive stresses to accurately predict fatigue life in real-world applications. A deeper analysis of the deformation mechanisms at the crack tip during the compressive phase of the loading cycle is also essential to fully elucidate the underlying physics [14]. Numerical simulations have been crucial in exploring these mechanics. For instance, studies on metallic materials like titanium have shown that the compressive load and resulting crack closure significantly affect the FCG rate, with the crack closure level itself varying between a “pre-stage” where it remains constant and a “post-stage” where it gradually decreases [17]. The role of crack closure under negative R-ratios is a subject of ongoing debate and complexity. While some studies suggest that crack closure may not correlate well with crack growth at negative R-ratios, others emphasize its substantial influence [15,17].
Zhang et al. [18] investigated I-II mixed-mode FCG and found that under these conditions, the crack closure mechanism is governed by a competition between Crack Surface Contact Closure (CSCC) and Crack Deflection/Crook Closure (CDCC). Their work showed that the crack closure level “decreases with an increase in the loading angle in the I-II mixed mode loading,” indicating that both the directionality of the load and the presence of compression must be considered to accurately predict the crack growth path and fatigue life. An investigation by Xie et al. [10] into the effect of a single tensile overload on CP-Titanium at negative load ratios revealed a critical interaction. While the overload induced a retardation effect, this effect was “weakened by the compressive load.” The study concluded that the compressive portion of the baseline fatigue cycle reduces the residual plastic strain and shielding effect caused by the overload. This demonstrates that the protective effect of a beneficial overload can be partially negated by subsequent compressive cycles, a crucial consideration for damage tolerance analysis in aerospace and other applications where variable amplitude loading is the norm.
In the context of low-cycle fatigue (LCF), which is critical for marine structural steels subjected to extreme loads, the Crack Tip Opening Displacement (CTOD) has been identified as a more suitable fracture parameter than the SIF. Research by Qin et al. [19] on marine-grade steel demonstrated that under LCF conditions, there is a “noticeable accumulative plastic deformation phenomenon at the crack tip.” Their work established a direct correlation between the applied load range and the CTOD, which in turn governs the crack growth rate. This indicates that for materials in a state of large-scale yielding, particularly under the complex cyclic loads experienced by maritime structures, fatigue models must be based on parameters that can accurately characterize plastic deformation, as traditional linear elastic approaches are inadequate. Further investigation into the underlying mechanics reveals that the plastic deformation process itself is fundamentally different under negative R-ratios. Benz and Sander [15] utilized a novel “cut-unload” method in their finite element analyses to visualize the plastic deformations both before and behind the crack tip. Their work proved that an alternative stress-based parameter, which quantifies the compressive loading at the crack tip, “correlates with the crack tip loading for negative loads.” This finding suggests that the key to accurate prediction lies in moving beyond SIF-based parameters for the compressive part of the cycle and instead adopting a more direct measure of the local stress state, thereby creating a more robust framework for analyzing fatigue data. They also concluded that two identical ΔK and R values can lead to different crack growth rates depending on the specimen geometry and loading history because these factors influence the magnitude of the compressive stresses and the resulting closure behavior.
Given the inherent complexities of FCG under negative R-ratios, advanced numerical simulation techniques, particularly the FEM, have become indispensable tools for investigation. Traditional analytical and experimental methods can be time-consuming and costly, making advanced numerical simulation an essential tool for modern engineering design and analysis. FEM, especially when integrated with sophisticated crack growth simulation methodologies, enables a detailed examination of the mechanical state at the crack tip. This approach facilitates the modeling of localized plastic deformation, the precise evaluation of crack tip opening and closure loads, and the accurate simulation of crack growth paths. Such insights are often difficult, if not impossible, to obtain solely through experimental methods.
This study specifically leverages the capabilities of the ANSYS Workbench 19.2 SMART (Separating, Morphing, Adaptive, and Remeshing Technology) crack growth module for the numerical simulation of FCG under negative stress ratio conditions. By employing this advanced computational tool, the aim is to accurately model the complex interactions occurring at the crack tip and to reliably predict crack growth paths and component fatigue life. This study provides a comprehensive numerical analysis of the evolution of von Mises stress and maximum principal stress distributions in modified CT specimens across a range of negative stress ratios (R = 0.1, −0.1, −0.2, −0.3, −0.4, −0.5, −1). This detailed mapping highlights the complex, non-monotonic response of these critical stress parameters to varying compressive loads. The objective is to demonstrate the effectiveness of this computational approach in addressing the challenges posed by negative R-ratio loading, thereby providing a validated methodology for damage-tolerant design and fitness-for-service assessments of engineering components subjected to these demanding operational environments. The presence of a compressive portion in a load cycle significantly influences fatigue behavior, introducing complexities that challenge traditional predictive models. This discrepancy between simplified analytical frameworks and real-world conditions represents a critical gap in structural integrity assessment and motivates the present investigation. By bridging the gap between experimental observation and mechanical theory, this research aims to enhance the accuracy of fatigue life prediction and, ultimately, improve the safety and reliability of engineered structures.

2. Numerical Analysis

The simulation of FCG was performed using ANSYS Workbench, a highly versatile and robust platform that extends traditional finite element analysis (FEA) capabilities to specialized fracture mechanics applications. This approach was selected to provide a comprehensive and efficient framework for modeling the complex, dynamic process of crack growth. To optimize the computational workflow, an unstructured mesh strategy was initially employed. This choice significantly reduced the required preprocessing time, allowing for rapid initial mesh generation while maintaining geometric fidelity. For the critical phase of crack growth, the analysis leveraged the Separating Morphing Adaptive and Remeshing Technology (SMART) meshing technique, which is specifically designed for simulating crack growth. SMART is an advanced, remeshing-based method that ensures the mesh accurately conforms to the evolving crack front. The model utilized higher-order SOLID187 tetrahedral elements. As a 10-node element with quadratic displacement behavior, the SOLID187 is particularly well-suited for modeling the irregular, adaptive meshes generated by the SMART technique, providing superior accuracy in capturing the stress field near the crack tip compared to lower-order elements. Crucially, the simulation incorporated automatic mesh updates at every step of the analysis to precisely capture the changes in the crack front geometry as propagation occurred. This adaptive capability is essential for generating a reliable simulation of the crack’s path and rate. The SIFs were determined using the Interaction Integral evaluation technique [20]. This method is a well-established and highly robust approach in computational fracture mechanics, offering significant advantages in accuracy and stability over simpler methods like the displacement extrapolation technique. The interaction integral is an energy-based approach that relates the SIFs to the J-integral, ensuring a precise and robust analysis of the fracture parameters. The direction of the FCG path was governed by the Maximum Tangential Stress (MTS) criterion [21], a widely accepted theory for predicting the initiation and direction of crack growth under mixed-mode loading conditions. The MTS criterion posits that, for isotropic materials, the crack will tend to propagate along a path that is perpendicular to the direction of the maximum tangential tensile stress at the crack tip. Mathematically, the crack growth angle (in rad) is determined by the following formula [22]:
θ = cos 1   3 K I I 2 + K I K I 2 + 8 K I I 2 K I 2 + 9 K I I 2
where KI and KII denotes the opening mode and in-plane shear mode of SIF, respectively.
The equivalent stress-intensity factor is determined as [22,23]:
Δ K e q = 1 2 cos θ 2 Δ K I ( 1 + cos θ ) 3 Δ K I I sin θ
where
Δ K I = K I max K I min = ( 1 R ) K I max Δ K I I = K I I max K I I min = ( 1 R ) K I I max
and R is the stress ratio.
The correlation between the FCG rate, and the equivalent SIF range is established through a modified Paris-Erdogan law. This approach, often attributed to the work of Tanaka [24], extends the classic Paris law to mixed-mode scenarios by substituting the mode I SIF range with the equivalent SIF range. The relationship is expressed as:
d a d N = C ( Δ K e q ) m
where a denotes the crack length, N denotes the fatigue life cycles, C and m are the Paris constant and Paris exponent, respectively.

3. Results and Discussion

Modified Compact Tension Specimen

An investigation into mixed-mode FCG was performed on SAE 1020 steel, with mechanical properties detailed in Table 1. A modified CT specimen, shown in Figure 1, was used for the experiments. Unlike a standard CT specimen which only permits pure mode I crack growth, this modified version includes an additional hole to generate mixed-mode stress states and induce crack deflection. A maximum load of 10 kN was applied to each specimen, with stress ratios (R) of 0.1, −0.1, −0.2, −0.3, −0.4, and −0.5 to explore various loading conditions. The study involved two distinct specimen geometries, differentiated by the placement of this third hole.
  • Configuration 1: The hole was positioned with a horizontal distance (K) of 8.3 mm and a vertical distance (C) of 8.1 mm.
  • Configuration 2: The distances were adjusted to K = 8.4 mm and C = 6.9 mm.
The presence of this hole was observed to influence the crack’s trajectory in two ways: either by attracting it (a “sink hole” effect) or by diverting its path (a “miss hole” effect).
The model utilized a fine mesh near the crack tip using the sphere of influence feature, employing the advanced ANSYS SMART module for automatic crack growth simulation. The specimen was modeled under a pin-loaded condition, with the load applied directly to the inner surfaces of the upper and lower holes. To prevent rigid body motion, a nodal displacement constraint was applied to the node located at the mid-point of the specimen’s left vertical edge, fixing its displacement to 0 mm in the x, y, and z directions. The cyclic load was applied as a remote force distributed over the inner surfaces of the upper and lower holes, acting in the y-direction (opening mode).
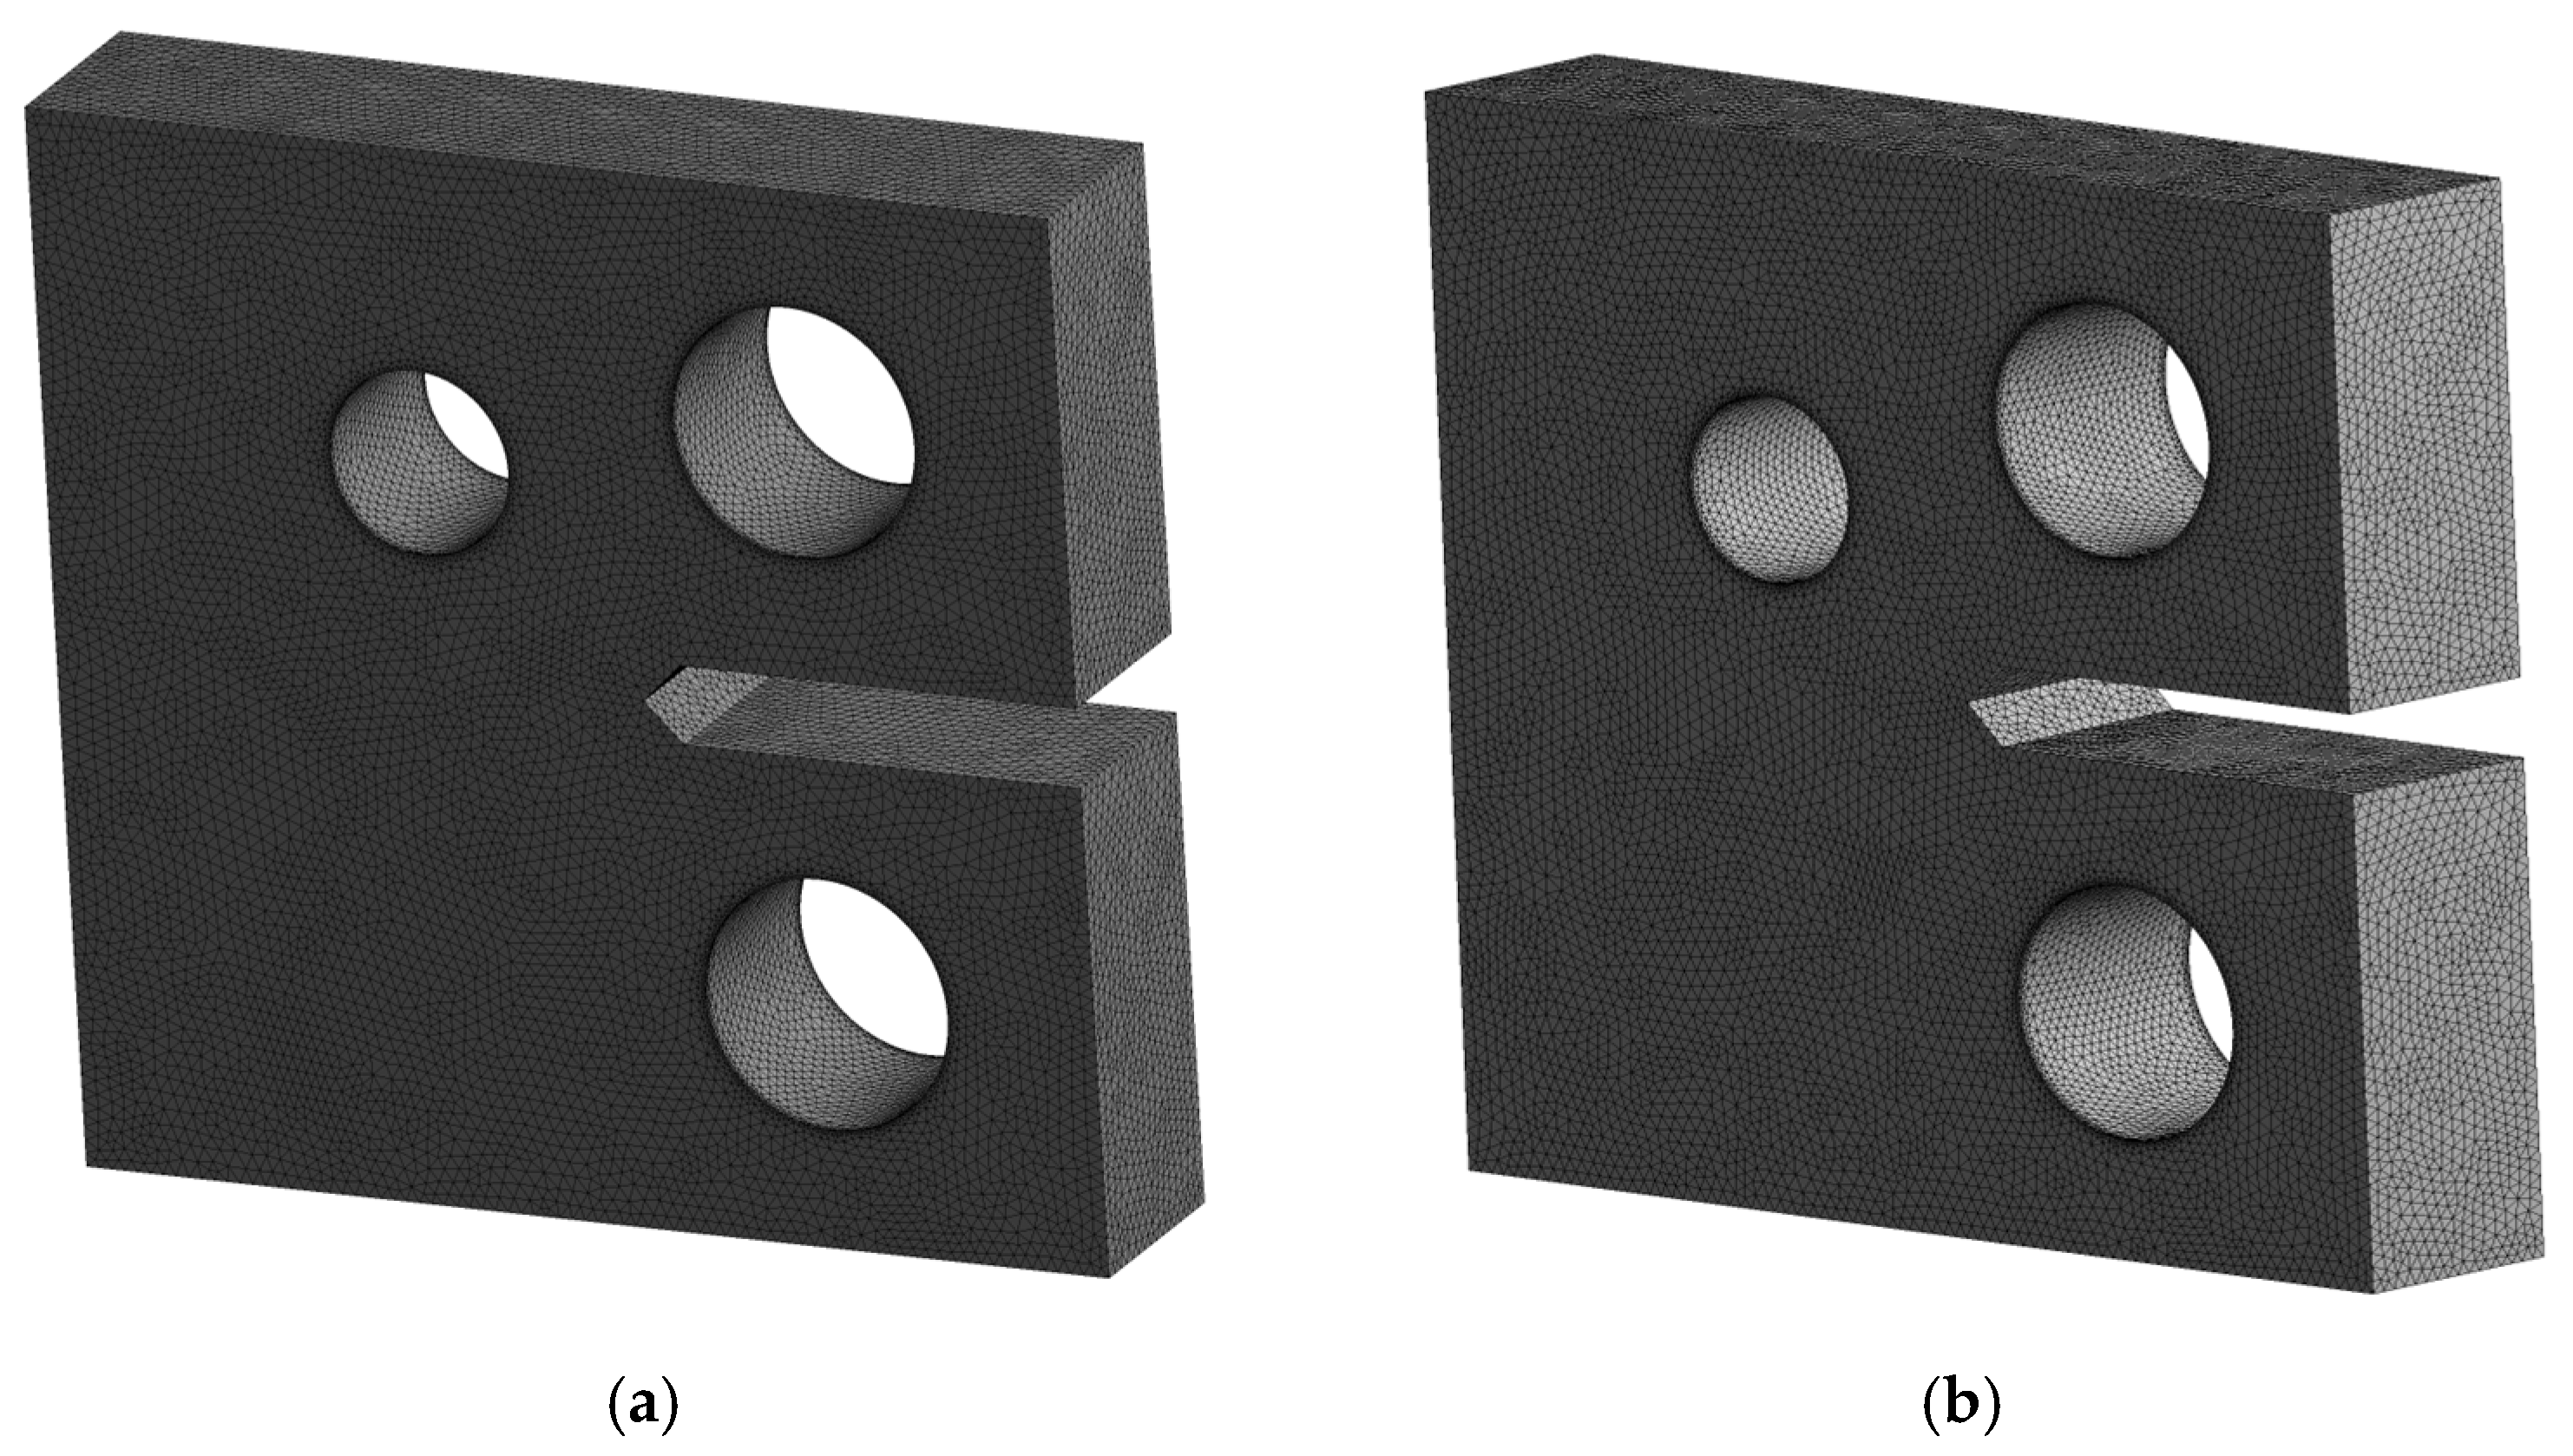
The mesh for configurations CT1 and CT2, shown in Figure 2, was generated with an element size of 0.5 mm. The resulting mesh for each configuration is as follows:
  • CT1: 491,691 nodes and 326,808 elements.
  • CT2: 503,546 nodes and 334,795 elements.
To establish the validity of the current simulation methodology, an initial comparison was made against existing experimental and numerical data from the literature for a stress ratio of 0.1. This validation phase, crucial for ensuring the reliability of our model, preceded further simulations conducted under various negative stress ratios.
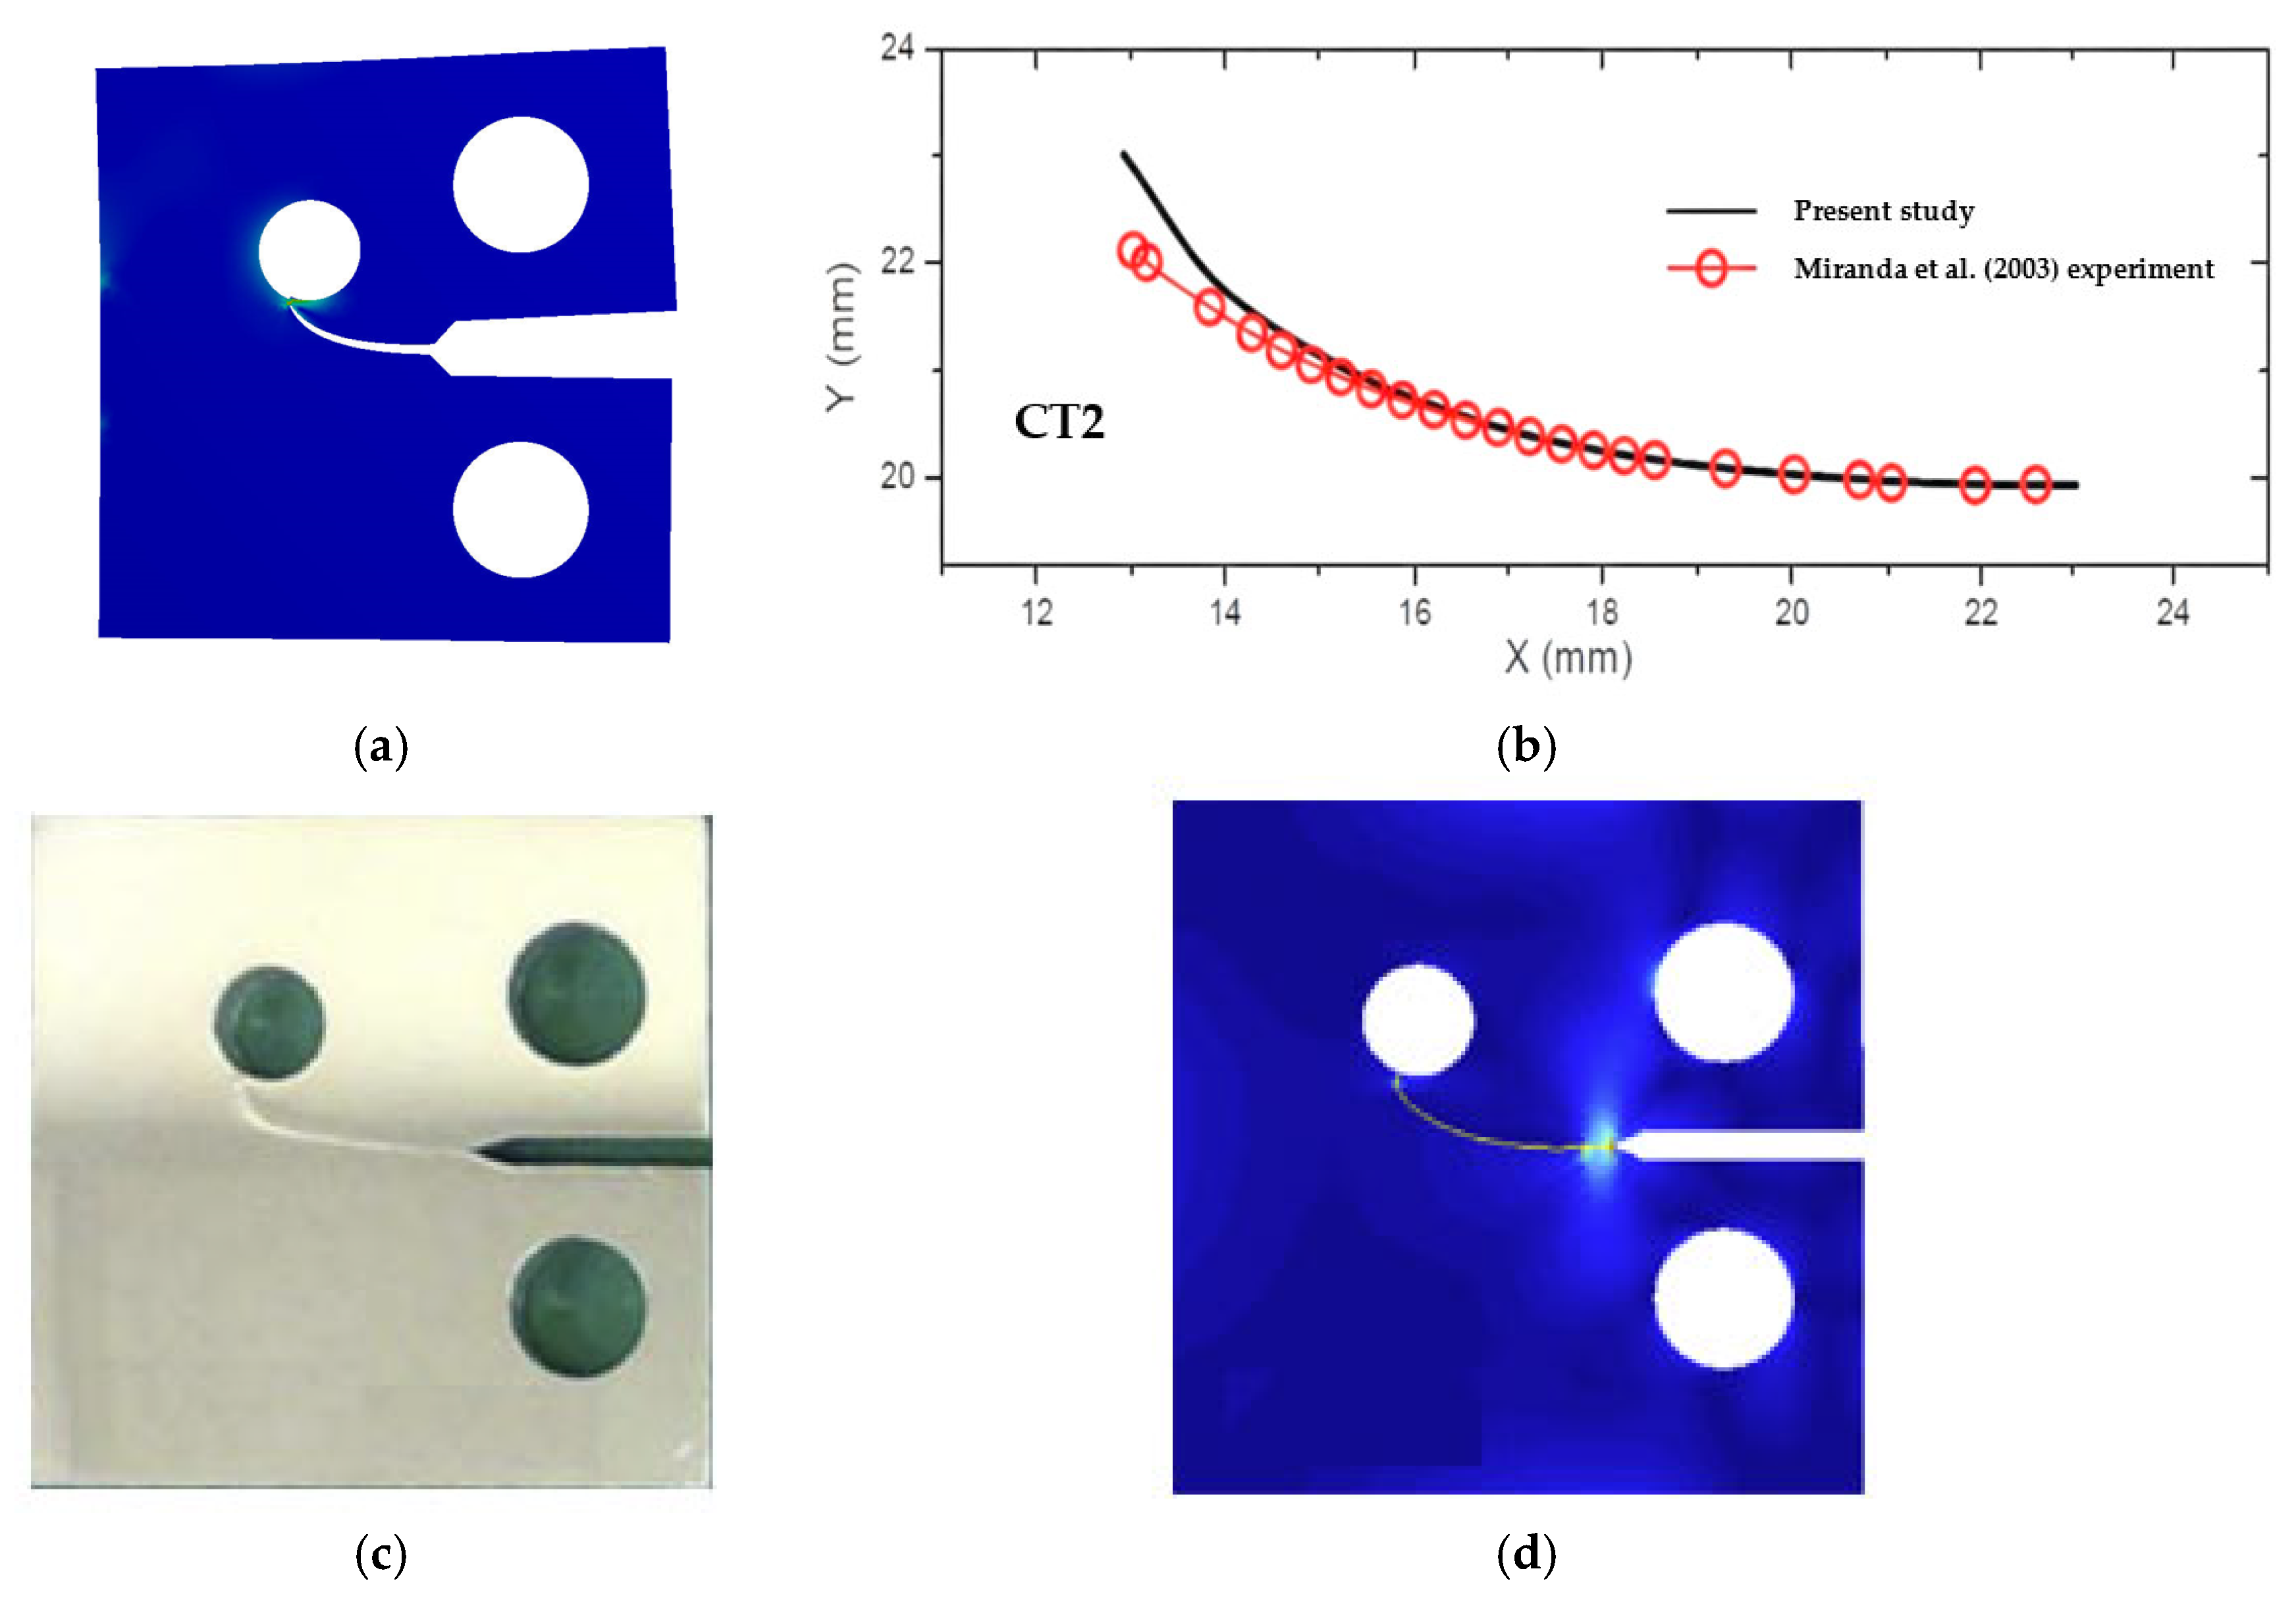
Figure 3 presents a comparative analysis of the predicted crack growth path for the first configuration (CT1) from the current study. These results are juxtaposed with experimental data from Miranda et al. [25]. Similarly, Figure 4 illustrates the estimated crack growth path for the second configuration (CT2), comparing it against experimental data from Miranda et al. [25] (Figure 4b), and experimental and numerical results using extended finite element method (XFEM) results by Lu et al. [11]. Collectively, these figures underscore the efficacy of the modified CT specimen’s strategically placed holes in influencing crack growth direction. The predicted crack growth paths consistently demonstrate strong agreement with both experimental observations and established numerical predictions found in the literature.
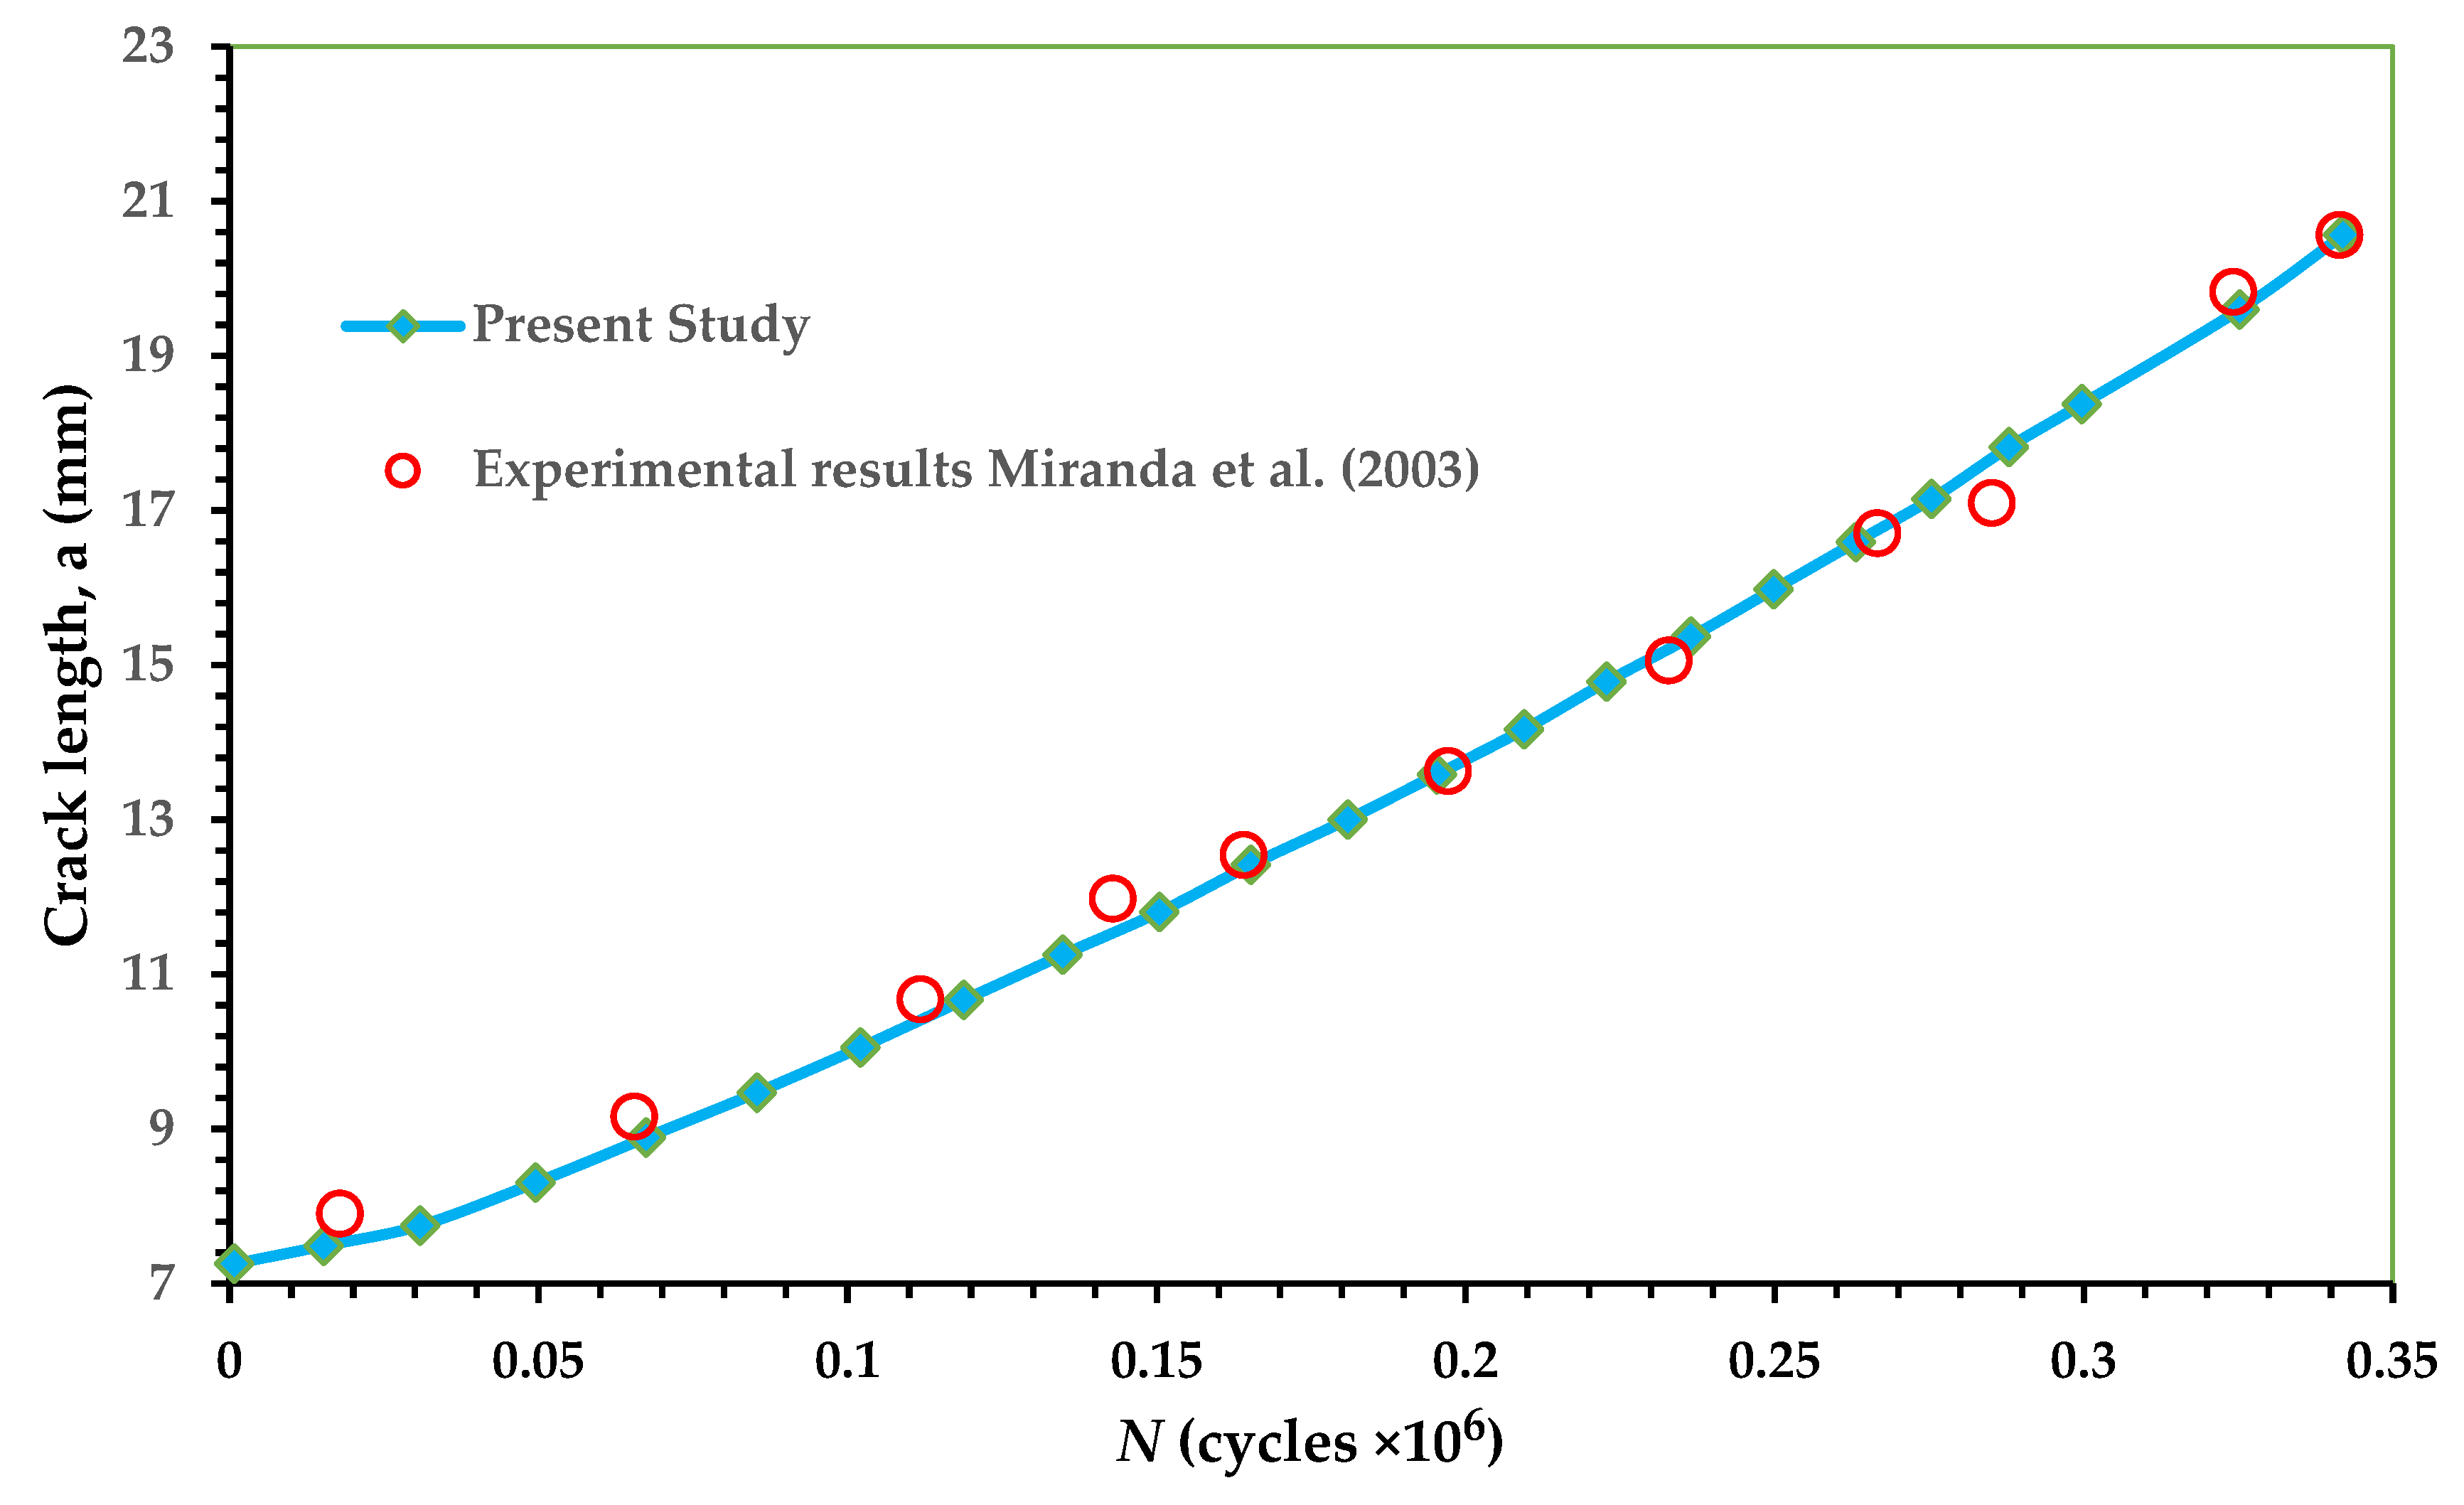
Figure 5 and Figure 6 present comparisons between the simulated FCG life from the present study and the experimental data reported by Miranda et al. [25] for the two CT specimen configurations, CT1 and CT2, respectively. The simulated FCG life, calculated using ANSYS, shows excellent agreement with the experimental results from Miranda et al. [25] as clearly demonstrated in these figures.
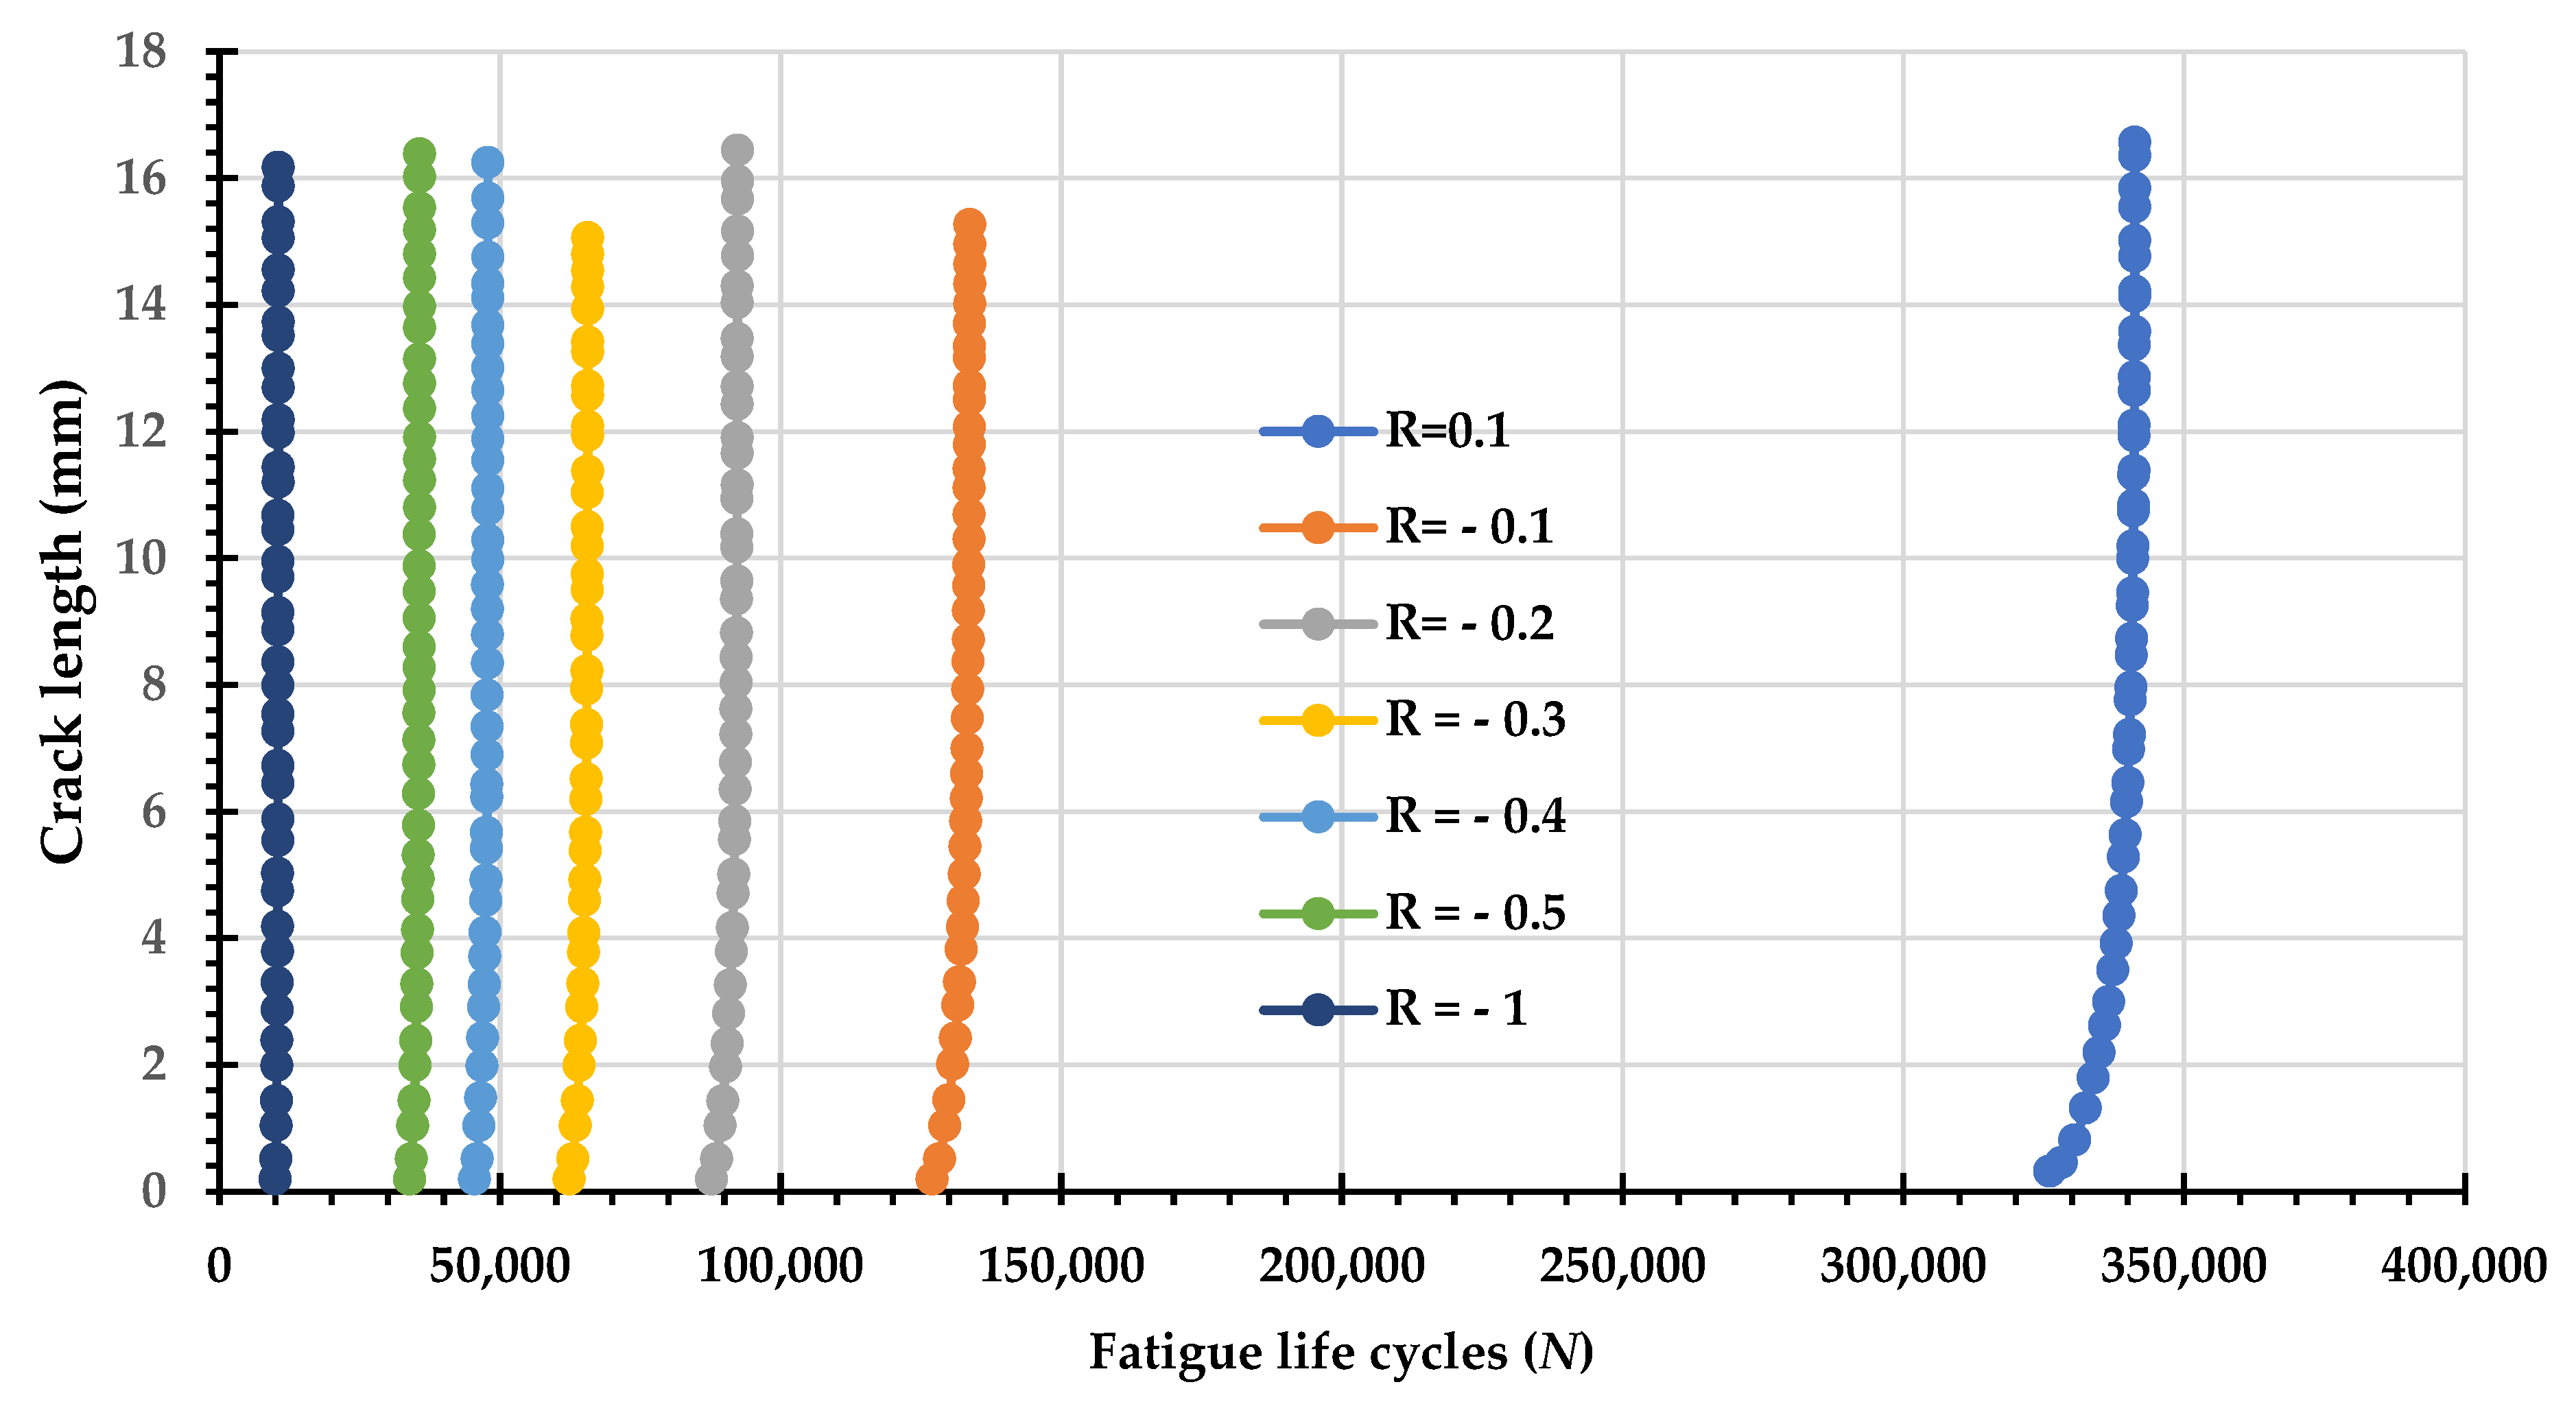
The influence of the stress ratio on the fatigue life cycles of a material is a fundamental consideration in fracture mechanics, particularly under cyclic loading conditions that include a compressive component (R < 0). Figure 7 and Figure 8 illustrate the impact of varying stress ratios (R) on the fatigue life of a material, specifically focusing on negative values ranging from −0.1 to −0.5 and −1 for the simulated specimens, CT1 and CT2. As depicted in Figure 7 and Figure 8, the predicted data for the two CT specimens, CT1 and CT2, reveal a distinct and critical trend: the fatigue life is inversely proportional to the magnitude of the negative stress ratio. The longest fatigue life was recorded at R = 0.1, achieving 341,250 cycles for CT1 and 142,092 cycles for CT2. Progressively, as the stress ratio decreased into the negative range, the fatigue life cycles significantly reduced as shown in Table 2. Conversely, a significant reduction in fatigue life was observed as the stress ratio became increasingly negative for both specimens.
A more negative stress ratio, for a constant stress amplitude, implies an increase in the tensile mean stress component of the loading cycle. Tensile mean stresses are known to accelerate fatigue crack initiation and propagation, thereby reducing the overall fatigue life of a component. Conversely, compressive mean stresses tend to prolong fatigue life [26]. The visual evidence presented in Figure 7 strongly corroborates the numerical fatigue life data and crack length observations. The consistent trend of decreasing fatigue life with increasingly negative stress ratios is vividly illustrated. This reinforces the understanding that higher mean stresses, inherent in more negative R-ratios, accelerate both crack initiation and propagation, leading to a reduced service life for the component. The introduction of R = −1 further emphasizes this trend, showing the lowest fatigue life among all investigated ratios, indicating a severe reduction in material endurance under highly compressive loading conditions.
The quantitative results presented in Table 2, which summarize the simulated fatigue life for the various stress ratios, are consistent with established fracture mechanics principles for CT specimens under compressive loading. While the qualitative trend, that increasing the magnitude of the negative stress ratio leads to an increased fatigue life, is anticipated due to the enhanced crack closure effect, the value of this table lies in the quantitative validation of the ANSYS SMART methodology. These data confirm the model’s ability to accurately predict the specific magnitude of the life extension for the material and loading parameters used in this study, thereby validating the computational framework for challenging negative R-ratio conditions.
While both specimens exhibit the same inverse correlation between the stress ratio and the fatigue life cycles, the fatigue life of CT2 is consistently and significantly lower than that of CT1 across all tested stress ratios, as clearly shown in Table 2 and corroborated by the visual evidence in Figure 8. Specifically, the position of a third hole was closer to the crack path in CT2 (described as ‘sinking in the hole’), whereas CT1 effectively ‘missed the hole.’ The proximity of this geometric discontinuity in CT2 acts as a stress concentrator, significantly increasing the local SIF near the crack tip. This elevated SIF accelerates the FCG rate, leading directly to the observed reduction in cycles to failure for CT2 compared to CT1.
The analysis of the crack tip stress fields utilized two distinct criteria to interpret the simulation results:
  • Maximum Principal Stress ( σ 1 ) Criterion: The σ 1 distribution is evaluated based on the Maximum Tangential Stress (MTS) criterion. This criterion is fundamental for predicting the driving force and the propagation path of the crack. The magnitude and orientation of the σ 1 field at the crack tip directly indicate the local tensile stress responsible for crack opening and growth.
  • Equivalent Stress ( σ v M ) Criterion: The von Mises equivalent stress ( σ v M ) distribution is used as the primary indicator of plastic deformation. The size and shape of the σ v M contour define the extent of the plastic zone at the crack tip. This is critical because the plastic zone size dictates the formation of the plastic wake, which is the physical origin of the plasticity-induced crack closure.
The variation in computational analysis time observed across different stress ratios is a direct consequence of the mechanical complexity. More negative R -ratios (e.g., R = 1.0 ) involve more extensive crack face contact and a larger, more complex reversed plastic zone.
The comparative evaluation of the results is performed by examining the relative intensity and size of the crack tip stress fields ( σ 1 and σ v M ) at the point of maximum tensile load for each R -ratio. A clear reduction in both the intensity and the size of the stress fields for more negative R -ratios (e.g., comparing R = 0.1 to R = 1.0 ) serves as quantitative evidence for the effectiveness of crack closure in shielding the crack tip. This shielding effect is the underlying mechanism that explains the observed increase in fatigue life.
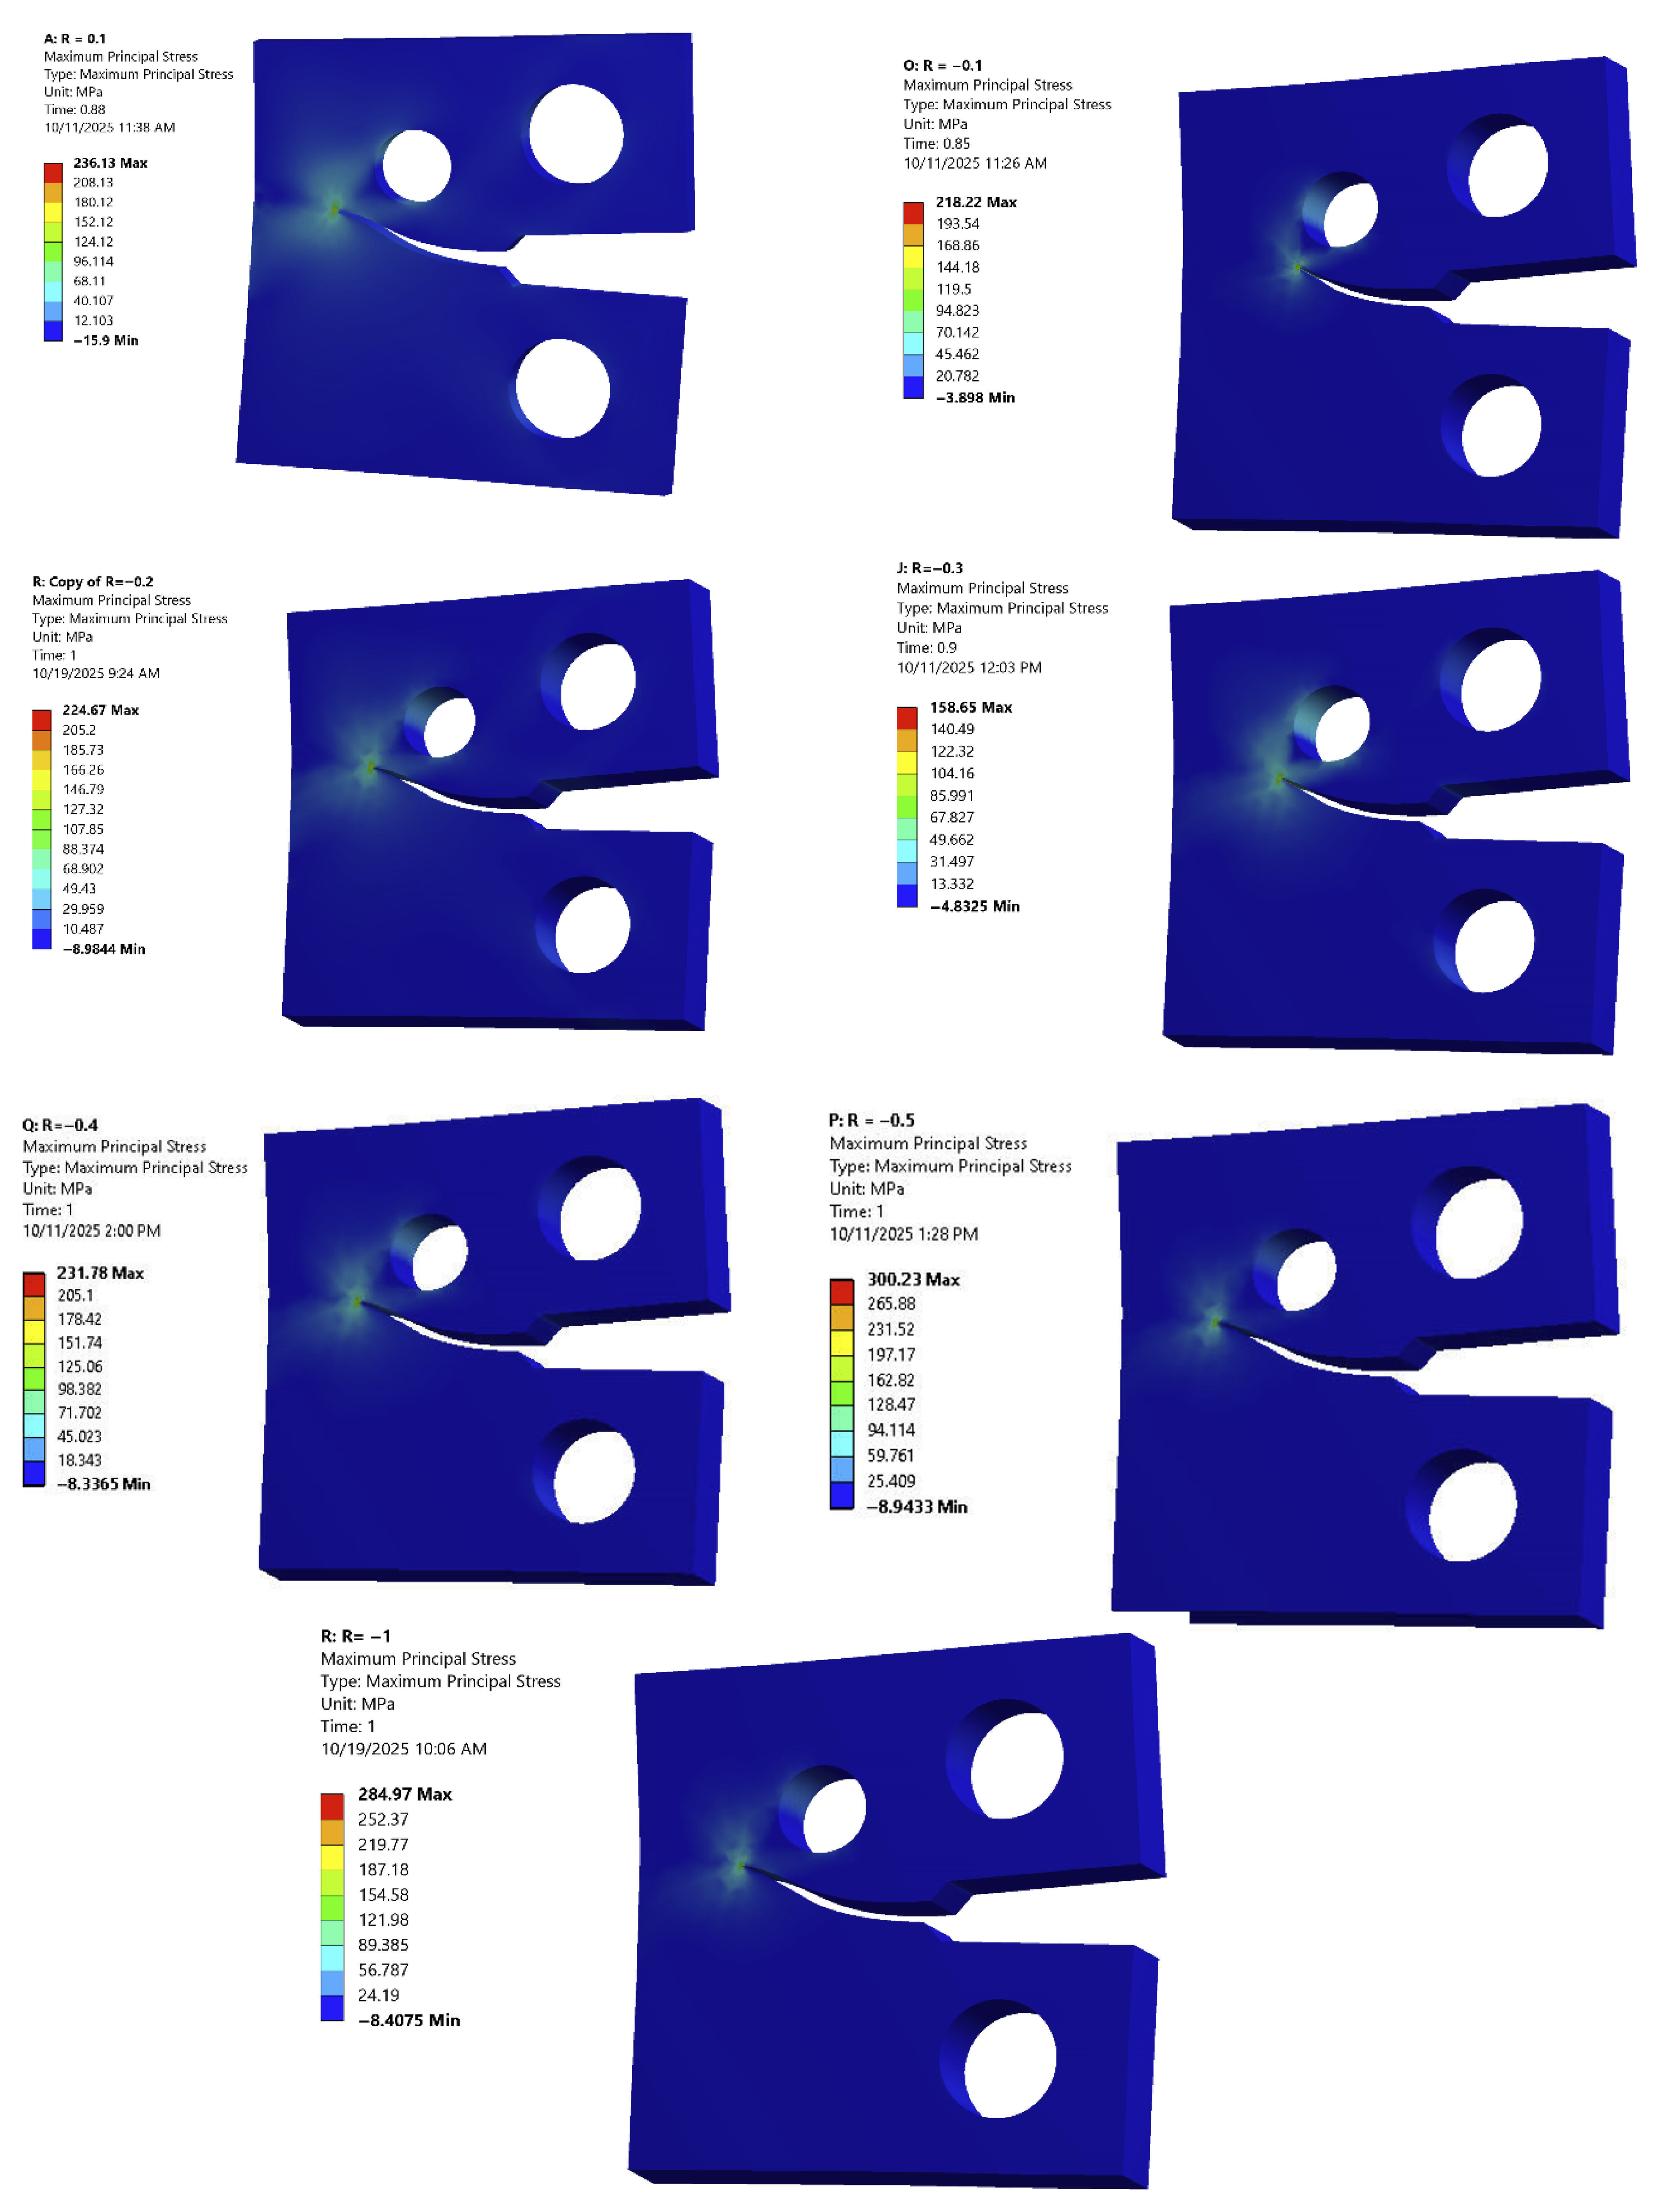
The analysis of the maximum principal stress reveals a complex and non-monotonic trend across the investigated stress ratios for both specimens, CT1 and CT2, as detailed in Table 3. This irregular distribution, which is graphically presented in Figure 9 and Figure 10, highlights the intricate interaction between the applied cyclic load and the specimen’s geometry, particularly the stress concentration around the notch tip.
For specimen CT1, the maximum principal stress values exhibit significant variation. Contrary to a simple linear relationship, the highest recorded stress was observed at R = −0.5, reaching 300.23 MPa. This was followed closely by the stress at R = −1.0 (284.97 MPa) and R = 0.1 (236.13 MPa). The lowest maximum principal stress was recorded at R = −0.3, with a value of 158.65 MPa. This non-uniformity suggests that the maximum stress is not solely governed by the magnitude of the applied load but is also highly sensitive to the mean stress component introduced by the varying stress ratios. The high stress values at R = −0.5 and R = −1.0 are particularly noteworthy, as they reflect the severe stress state induced by the highly compressive portions of the loading cycle, which can significantly influence the effective SIF. Specimen CT2 mirrors the non-monotonic trend observed in CT1, but at consistently lower absolute stress values across all stress ratios. The highest maximum principal stress for CT2 was also recorded at R = −0.5 (219.58 MPa), and the lowest at R = −0.3 (115.85 MPa). A direct comparison reveals that the maximum principal stress in CT2 is approximately 73% of the corresponding value in CT1 for any given stress ratio. This consistent scaling factor is likely a direct consequence of the geometric difference between the two specimens, specifically the position of the third hole. As discussed previously, the hole’s proximity to the crack path in CT2 creates a localized stress concentration that alters the overall stress field. The lower absolute stress values in CT2 compared to CT1, despite the geometric discontinuity, indicate a complex redistribution of the stress field, which is visually supported by the referenced contour plots in Figure 10.
The contour plots in Figure 10 visually confirm the non-uniform distribution of maximum principal stress across the CT2 specimen for different stress ratios. Specifically, areas of high stress concentration, typically around the notch tip, are evident. The variation in color intensity and spread across these critical regions for each stress ratio visually supports the numerical data in Table 3, highlighting how the stress field redistributes under varying load conditions.
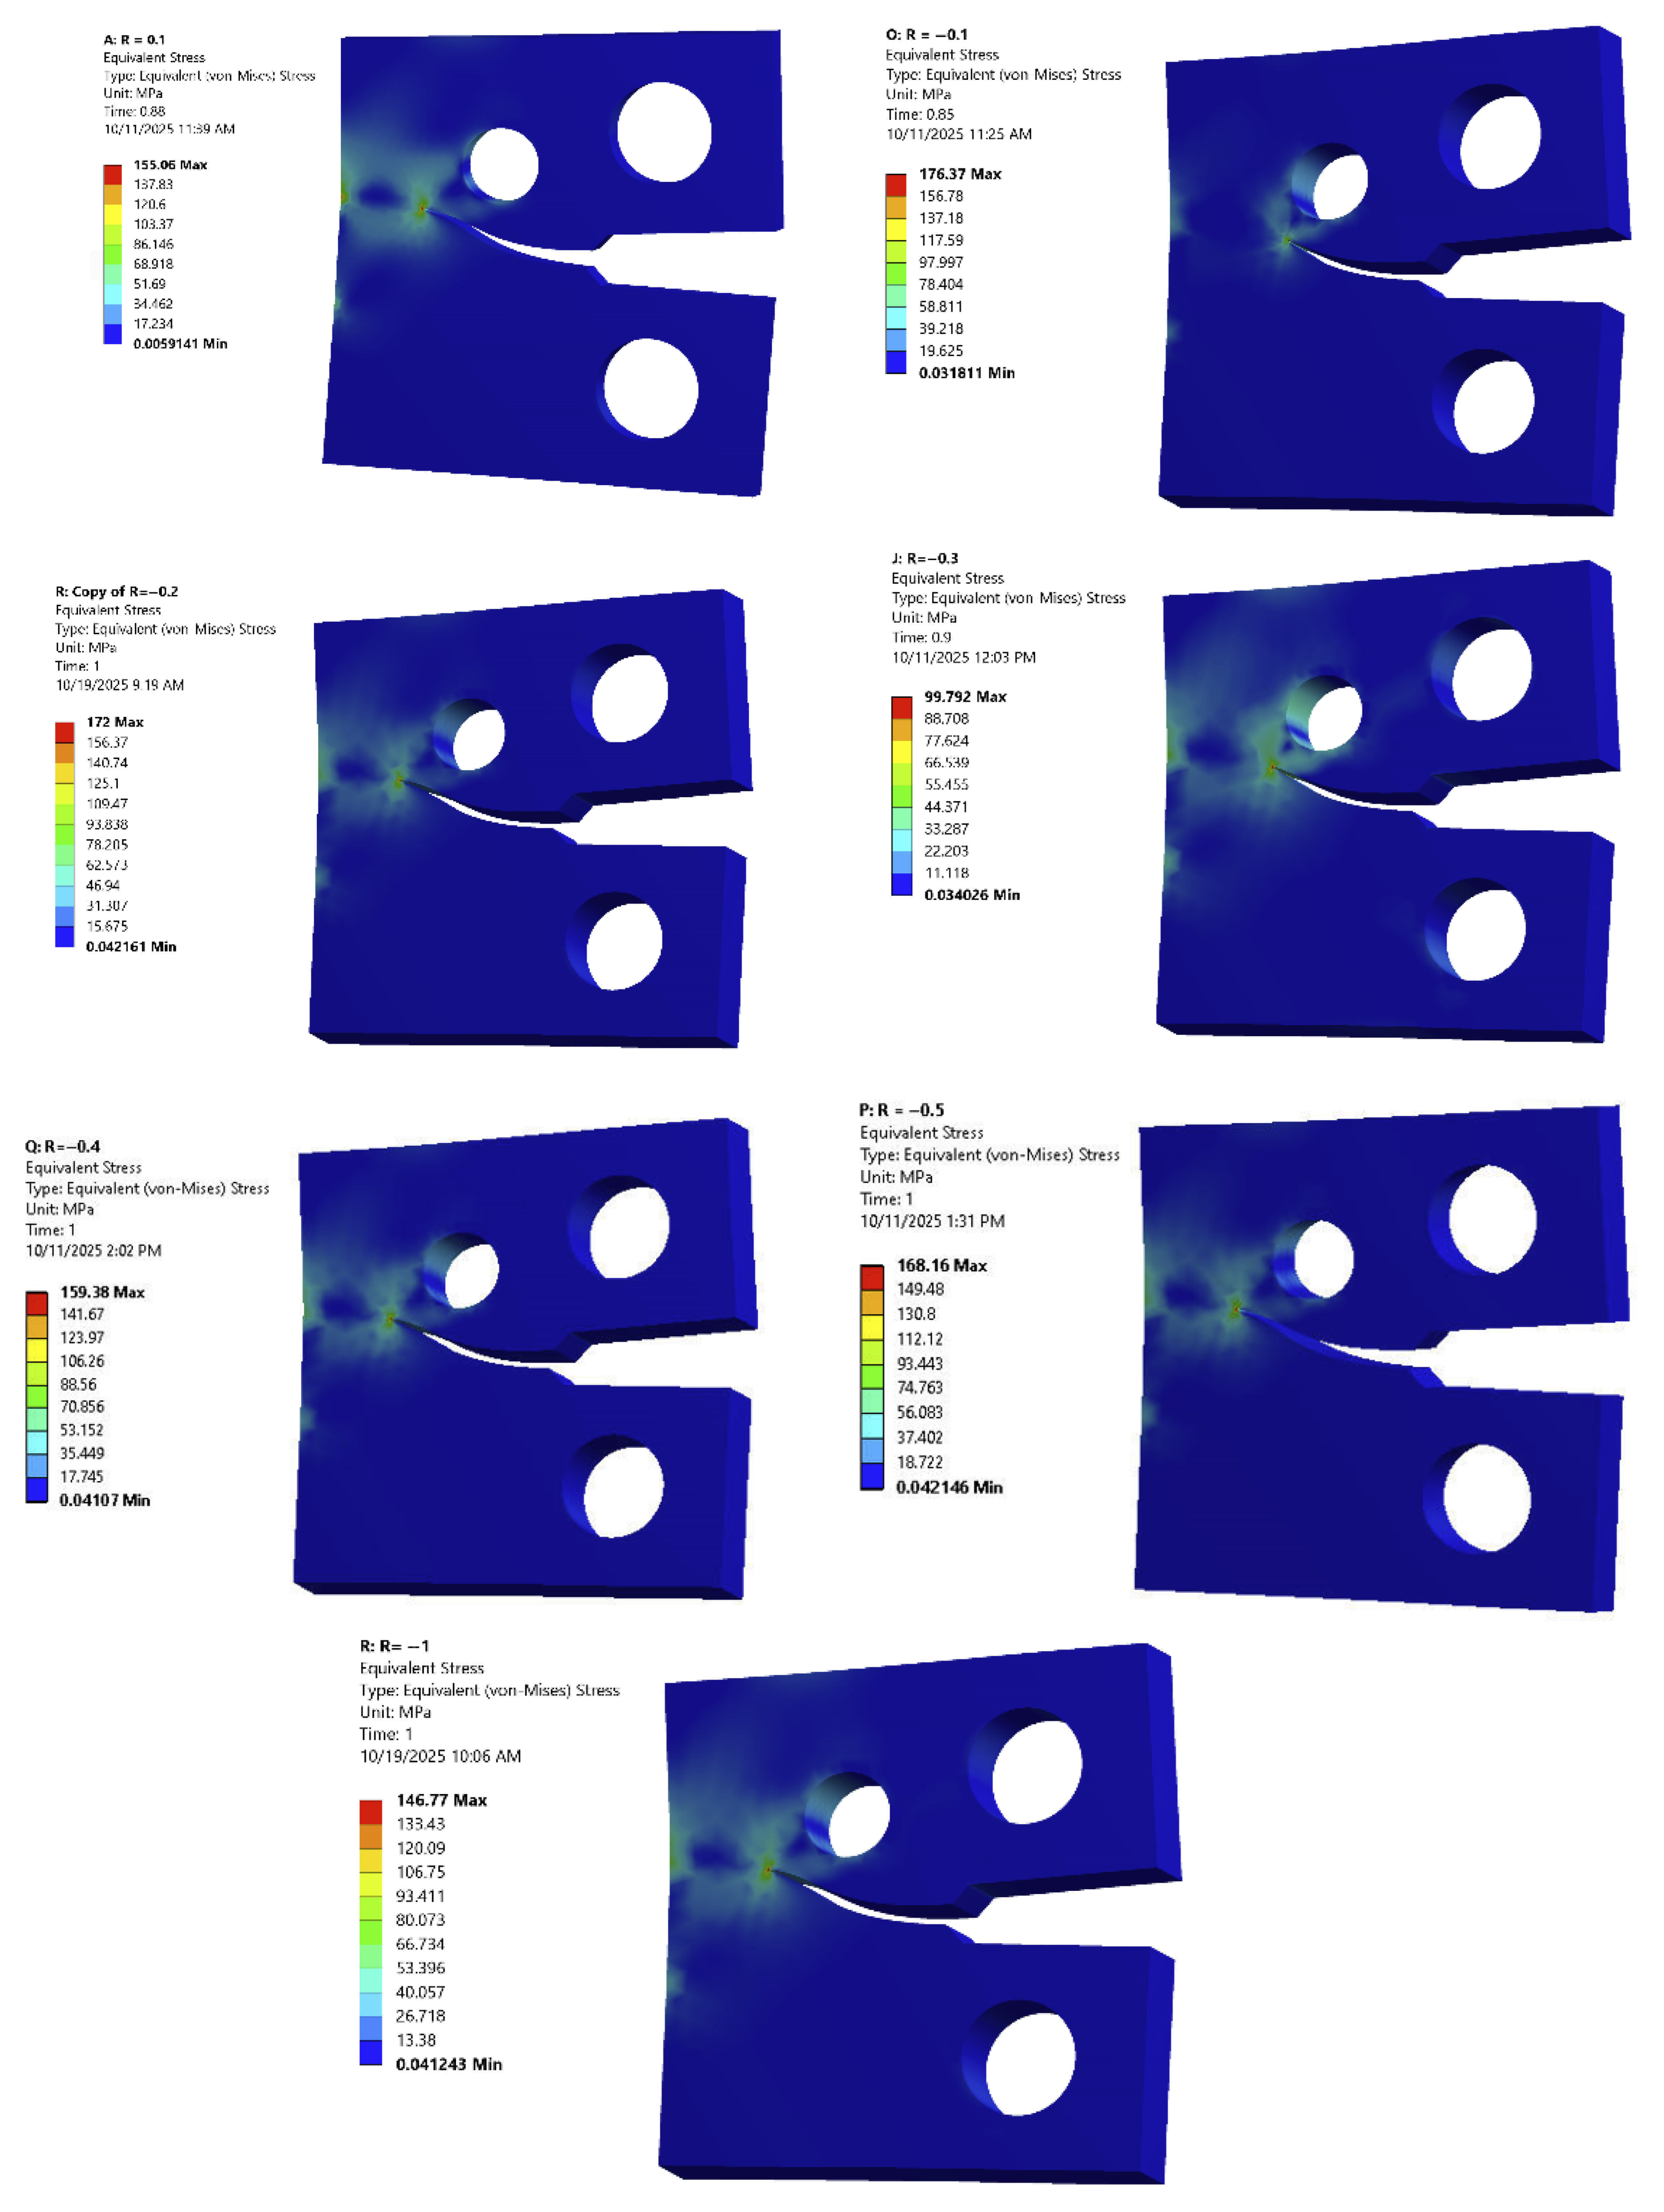
For negative stress ratios, the compressive portion of the loading cycle can significantly enhance crack closure. When the minimum stress is compressive, the crack faces are forced together more strongly, leading to a more pronounced crack closure effect. This increased closure means that the crack tip experiences a smaller effective stress intensity factor range for a longer duration of the cycle, which can reduce the overall crack growth rate. The von Mises stress, representing the effective shear stress, provides insight into the material’s yielding behavior. As presented in Table 4, the maximum von Mises stress exhibits a complex, non-monotonic relationship with the stress ratio. Starting from R = 0.1 (153.06 MPa), the von Mises stress increases as the stress ratio becomes more negative, reaching a local peak of 176.37 MPa at R = −0.1. However, at R = −0.2, the von Mises stress slightly decreases to 172 MPa. Further decreasing the stress ratio to R = −0.3 and R = −0.4 leads to an increase in von Mises stress (199.76 MPa and 198.14 MPa, respectively), before decreasing again at R = −0.5 (188.16 MPa). The lowest von Mises stress among the negative R-ratios is observed at R = −1, with a value of 146.77 MPa. This non-monotonic behavior underscores the intricate interplay between the tensile and compressive components of the loading cycle. The presence of a compressive component (negative R-ratio) significantly influences the effective stress state, which is crucial for understanding the material’s response to cyclic loading and its susceptibility to yielding. Figure 11 provides a graphical representation of this non-standard distribution, emphasizing the nonlinearity that is fundamental for accurate assessments of fatigue and yielding. The contour plots in Figure 11 illustrate the spatial distribution of von Mises stress, revealing critical regions where plastic deformation is most likely to initiate. Similarly to the principal stress, the von Mises stress contours show concentrations around the notch, but their patterns further elucidate the shear stress components. The visual comparison across different R-ratios in Figure 9 demonstrates how the effective stress field evolves, with variations in magnitude and extent of highly stressed zones. This visual evidence reinforces the non-monotonic trend observed in Table 4, suggesting that the interplay between tensile and compressive loading phases significantly alters the material’s susceptibility to yielding, and thus, its fatigue performance.
The numerical results confirm the expected inverse relationship between the magnitude of the negative stress ratio (R) and the fatigue life. However, a deeper mechanistic analysis reveals the complex, non-monotonic nature of the crack tip response under compressive loading. The compressive portion of the cycle is not merely a passive phase; it actively influences the subsequent tensile loading by inducing a large, reversed plastic zone ahead of the crack tip. This phenomenon results in a non-monotonic behavior of the crack tip stress field. Specifically, the maximum principal stress and the von Mises equivalent stress distributions at the crack tip are significantly altered. The compressive phase promotes extensive crack face contact, leading to a substantial plasticity-induced crack closure effect. This closure shields the crack tip from the full range of the applied SIf, effectively reducing it to an effective stress intensity factor range. The magnitude of this shielding effect is non-linear with respect to R, necessitating a shift in analytical perspective from traditional LEFM to an Elastic–Plastic Fracture Mechanics (EPFM) approach to accurately model the crack growth rate. The simulation successfully captures this transition, demonstrating that the primary mechanism for the increased fatigue life at more negative R-ratios is the enhanced shielding provided by the residual plastic wake and the resulting crack closure.
The simulation results for FCG under negative stress ratios are fundamentally governed by the interplay between crack closure and residual stresses. The R < 0 condition, which involves a compressive load cycle, significantly amplifies the shielding effect of these mechanisms.
The elastic–plastic model successfully captures Plasticity-Induced Crack Closure (PICC), as originally described by Elber [27]. PICC arises from the residual plastic wake left by the advancing crack, which causes the crack flanks to contact at a positive applied load, thereby shielding the crack tip. The true driving force for FCG is the effective stress intensity factor range, calculated from the difference between the maximum stress intensity factor and the crack opening stress intensity factor. Elber’s classical analytical model [27] established a critical theoretical basis for PICC; however, it is generally built upon 2D plane stress assumptions and incorporates empirical estimates of crack opening behavior. Under the severe conditions of R < 0, the limitations of this analytical approach become apparent.
The present three-dimensional FEM approach offers a more rigorous and direct determination of the crack opening load by explicitly modeling the contact between the crack faces. This numerical approach naturally accounts for:
  • Three-Dimensional Effects: The transition from plane strain (at the specimen core) to plane stress (at the surfaces).
  • Material Non-linearity: The complex elastic–plastic material response under cyclic loading.
  • Residual Stresses: The residual stresses generated by the plastic zone are intrinsically included in the stress state of the model.
Under negative stress ratios, the compressive load phase forces the crack flanks into contact, causing the crack to remain fully closed for a significant portion of the cycle. The numerical results, which precisely track the contact status of the crack faces, confirm that the crack opening load is frequently much higher than the minimum applied load. This leads to a substantially smaller effective stress intensity factor range compared to the nominal range. While analytical models are useful for quick estimations, the FEM results provide a more accurate representation of the effective driving force in this complex loading regime.
The presence of residual stresses is intrinsically linked to the plastic deformation near the crack tip. Under negative stress ratios, the large compressive loads can induce significant compressive residual stresses in the crack wake. These compressive stresses further contribute to crack closure, effectively reducing the mean stress at the crack tip and, consequently, the FCG rate. Recent research, such as the work by Salvati et al. [28], has highlighted the importance of separating the contributions of PICC and residual stresses, particularly in complex loading histories. Salvati et al. demonstrated that while residual stress effects are relatively short-lived, the closure effect is dominant at low stress ratio values and causes longer-range retardation. The present numerical model, by simulating the full elastic–plastic response, implicitly includes both effects, demonstrating the necessity of advanced numerical techniques for accurately predicting FCG under negative stress ratio conditions. The observed FCG rates are a direct consequence of the combined shielding effect from PICC and the beneficial compressive residual stresses.

4. Conclusions

This study provides a validated computational methodology for accurately predicting FCG life in engineering components subjected to demanding, fully reversed, and compressive–dominant cyclic loading environments. The structural integrity of metallic components under cyclic loading, particularly those involving compressive stress cycles (negative stress ratios, R < 0), presents a significant challenge to traditional LEFM-based life prediction models. This study successfully leveraged the advanced capabilities of the ANSYS Workbench 19.2 SMART crack growth module within a Finite Element framework to conduct a detailed numerical investigation into FCG behavior in modified CT specimens under R < 0 conditions. The comprehensive numerical investigation of FCG under negative stress ratios (R < 0) using the ANSYS SMART methodology yielded the following key conclusions:
  • The results confirm that the presence of a compressive load component fundamentally alters the FCG kinetics. A clear inverse relationship was established between the magnitude of the negative stress ratio and the predicted fatigue life cycles, highlighting the necessity of accounting for the increased tensile mean stress effect associated with these loading condition. The simulation successfully captured the expected inverse correlation between the magnitude of the negative stress ratio and the component’s fatigue life cycles, validating the computational model’s predictive capability under challenging loading conditions.
  • The primary mechanism for the observed increase in fatigue life at more negative R-ratios is the enhanced plasticity-induced crack closure resulting from the extensive reversed plastic zone created by the compressive load phase.
  • The crack tip stress field exhibits a complex, non-monotonic response to the cyclic loading, which significantly alters the effective stress intensity factor range and necessitates an Elastic–Plastic Fracture Mechanics (EPFM) perspective for accurate analysis.
  • The maximum principal stress distribution was confirmed to be the critical parameter governing the crack growth path, aligning with the Maximum Tangential Stress (MTS) criterion.
  • The von Mises equivalent stress analysis provided a clear delineation of the plastic zone size, directly correlating the extent of plastic deformation with the magnitude of the crack closure effect.
  • This study provides a validated computational methodology for accurately predicting FCG life in engineering components subjected to demanding, fully reversed, and compressive–dominant cyclic loading environments.

Author Contributions

Conceptualization, A.M.A.; Methodology, Y.A.F.; Software, A.M.A.; Validation, A.M.A.; Formal analysis, Y.A.F. and A.M.A.; Investigation, Y.A.F. and A.M.A.; Resources, Y.A.F. and A.M.A.; Data curation, A.M.A.; Writing—original draft, A.M.A.; Writing—review & editing, A.M.A.; Visualization, A.M.A.; Supervision, Y.A.F. and A.M.A.; Project administration, Y.A.F. and A.M.A.; Funding acquisition, Y.A.F. and A.M.A. All authors have read and agreed to the published version of the manuscript.

Funding

The authors gratefully acknowledge the funding of the Deanship of Graduate Studies and Scientific Research, Jazan University, Saudi Arabia, through Project number: JU-20250230-DGSSR-RP-2025.

Data Availability Statement

The original contributions presented in this study are included in the article. Further inquiries can be directed to the corresponding author.

Conflicts of Interest

The authors declare no conflicts of interest.

References

  1. Manson, S.S.; Halford, G.R. Fatigue and Durability of Structural Materials; ASM International: Novelty, OH, USA, 2006. [Google Scholar]
  2. Tiwari, S. Fatigue in Structures and Materials; Educohack Press: Delhi, India, 2025. [Google Scholar]
  3. Krupp, U. Fatigue Crack Propagation in Metals and Alloys: Microstructural Aspects and Modelling Concepts; John Wiley & Sons: Hoboken, NJ, USA, 2007. [Google Scholar]
  4. Carpinteri, A. Handbook of Fatigue Crack Propagation in Metallic Structures; Newnes: London, UK, 2012. [Google Scholar]
  5. Sun, C.-T.; Jin, Z. Fracture mechanics; Academic Press: Cambridge, MA, USA, 2011. [Google Scholar]
  6. Gdoutos, E.E. Fracture Mechanics Criteria and Applications; Springer Science & Business Media: Berlin, Germany, 2012; Volume 10. [Google Scholar]
  7. Fageehi, Y.A.; Alshoaibi, A.M. Investigating the Influence of Holes as Crack Arrestors in Simulating Crack Growth Behavior Using Finite Element Method. Appl. Sci. 2024, 14, 897. [Google Scholar] [CrossRef]
  8. Fageehi, Y.A.; Alshoaibi, A.M. Comparative Finite Element Analysis of Fatigue Crack Growth in High-Performance Metallic Alloys: Influence of Material Parameters and Paris Law Constants. Crystals 2025, 15, 801. [Google Scholar] [CrossRef]
  9. Silva, F. Fatigue crack propagation after overloading and underloading at negative stress ratios. Int. J. Fatigue 2007, 29, 1757–1771. [Google Scholar] [CrossRef]
  10. Xie, L.-Q.; Zhang, P.; He, X.-H.; Zhou, C.-Y. Effect of single tensile overload on fatigue crack growth behavior of CP-Ti at negative load ratio. Int. J. Fatigue 2021, 145, 106129. [Google Scholar] [CrossRef]
  11. Lu, Z.; Xu, J.; Wang, L.; Zhang, J.; Liu, Y. Curvilinear fatigue crack growth simulation and validation under constant amplitude and overload loadings. J. Aerosp. Eng. 2015, 28, 04014054. [Google Scholar] [CrossRef]
  12. Oplt, T.; Vojtek, T.; Kubíček, R.; Pokorný, P.; Hutař, P. Numerical modelling of fatigue crack closure and its implication on crack front curvature using ΔCTODp. Int. J. Fatigue 2023, 171, 107570. [Google Scholar] [CrossRef]
  13. Wang, S.; Zhou, S.; Yang, B.; Xiao, S.; Yang, G.; Zhu, T. Effective stress intensity factor range for fatigue cracks propagating in mixed mode I-II loading. Eng. Fract. Mech. 2024, 312, 110641. [Google Scholar] [CrossRef]
  14. Benz, C. Fatigue crack growth at negative stress ratios: On the uncertainty of using ΔK and R to define the cyclic crack tip load. Eng. Fract. Mech. 2018, 189, 194–203. [Google Scholar] [CrossRef]
  15. Benz, C.; Sander, M. Reconsiderations of fatigue crack growth at negative stress ratios: Finite element analyses. Eng. Fract. Mech. 2015, 145, 98–114. [Google Scholar] [CrossRef]
  16. Zhang, P.; Zhou, C.-Y.; Xie, L.-Q.; He, X.-H. Numerical investigation of mechanical behavior of crack tip under mode I and mixed-mode I-II fatigue loading at negative load ratios. Theor. Appl. Fract. Mech. 2020, 108, 102673. [Google Scholar] [CrossRef]
  17. Zhang, P.; Zhou, C.-Y.; Li, J.; Miao, X.-T.; He, X.-H. Effect of compressive load and crack closure on fatigue crack growth of commercial pure titanium at negative load ratios. Eng. Fract. Mech. 2019, 219, 106622. [Google Scholar] [CrossRef]
  18. Zhang, P.; Xie, L.-Q.; Zhou, C.-Y.; He, X.-H. Experimental and numerical investigation on fatigue crack growth behavior of commercial pure titanium under I-II mixed mode loading at negative load ratios. Int. J. Fatigue 2020, 138, 105700. [Google Scholar] [CrossRef]
  19. Qin, D.; Xiayang, L.; Geng, X. Experimental study on low-cycle fatigue characteristics of marine structural steel. J. Mar. Sci. Eng. 2024, 12, 651. [Google Scholar] [CrossRef]
  20. Ghafoori Ahangar, R.; Verreman, Y. Assessment of mode I and mode II stress intensity factors obtained by displacement extrapolation and interaction integral methods. J. Fail. Anal. Prev. 2019, 19, 85–97. [Google Scholar] [CrossRef]
  21. Erdogan, F.; Sih, G. On the crack extension in plates under plane loading and transverse shear. J. Basic Eng. 1963, 85, 519–525. [Google Scholar] [CrossRef]
  22. Bjørheim, F. Practical Comparison of Crack Meshing in ANSYS Mechanical APDL 19.2. Master’s Thesis, University of Stavanger, Stavanger, Norway, 2019. [Google Scholar]
  23. Xiangqiao, Y.; Shanyi, D.; Zehua, Z. Mixed-mode fatigue crack growth prediction in biaxially stretched sheets. Eng. Fract. Mech. 1992, 43, 471–475. [Google Scholar] [CrossRef]
  24. Tanaka, K. Fatigue crack propagation from a crack inclined to the cyclic tensile axis. Eng. Fract. Mech. 1974, 6, 493–507. [Google Scholar] [CrossRef]
  25. Miranda, A.; Meggiolaro, M.; Castro, J.; Martha, L.; Bittencourt, T. Fatigue life and crack path predictions in generic 2D structural components. Eng. Fract. Mech. 2003, 70, 1259–1279. [Google Scholar] [CrossRef]
  26. Pradhan, D.; Mahobia, G.; Chattopadhyay, K.; Fernando, D.; Paulose, N.; Babu, S.; Singh, V. Effect of stress ratio and mean stress on high cycle fatigue behavior of the superalloy IN718 at elevated temperatures. Mater. Res. Express 2019, 6, 0965a6. [Google Scholar] [CrossRef]
  27. Elber, W. The Significance of Fatigue Crack Closure; American Society for Testing and Materials (ASTM): West Conshohocken, PA, USA, 1971. [Google Scholar]
  28. Salvati, E.; Zhang, H.; Fong, K.S.; Song, X.; Korsunsky, A.M. Separating plasticity-induced closure and residual stress contributions to fatigue crack retardation following an overload. J. Mech. Phys. Solids 2017, 98, 222–235. [Google Scholar] [CrossRef]
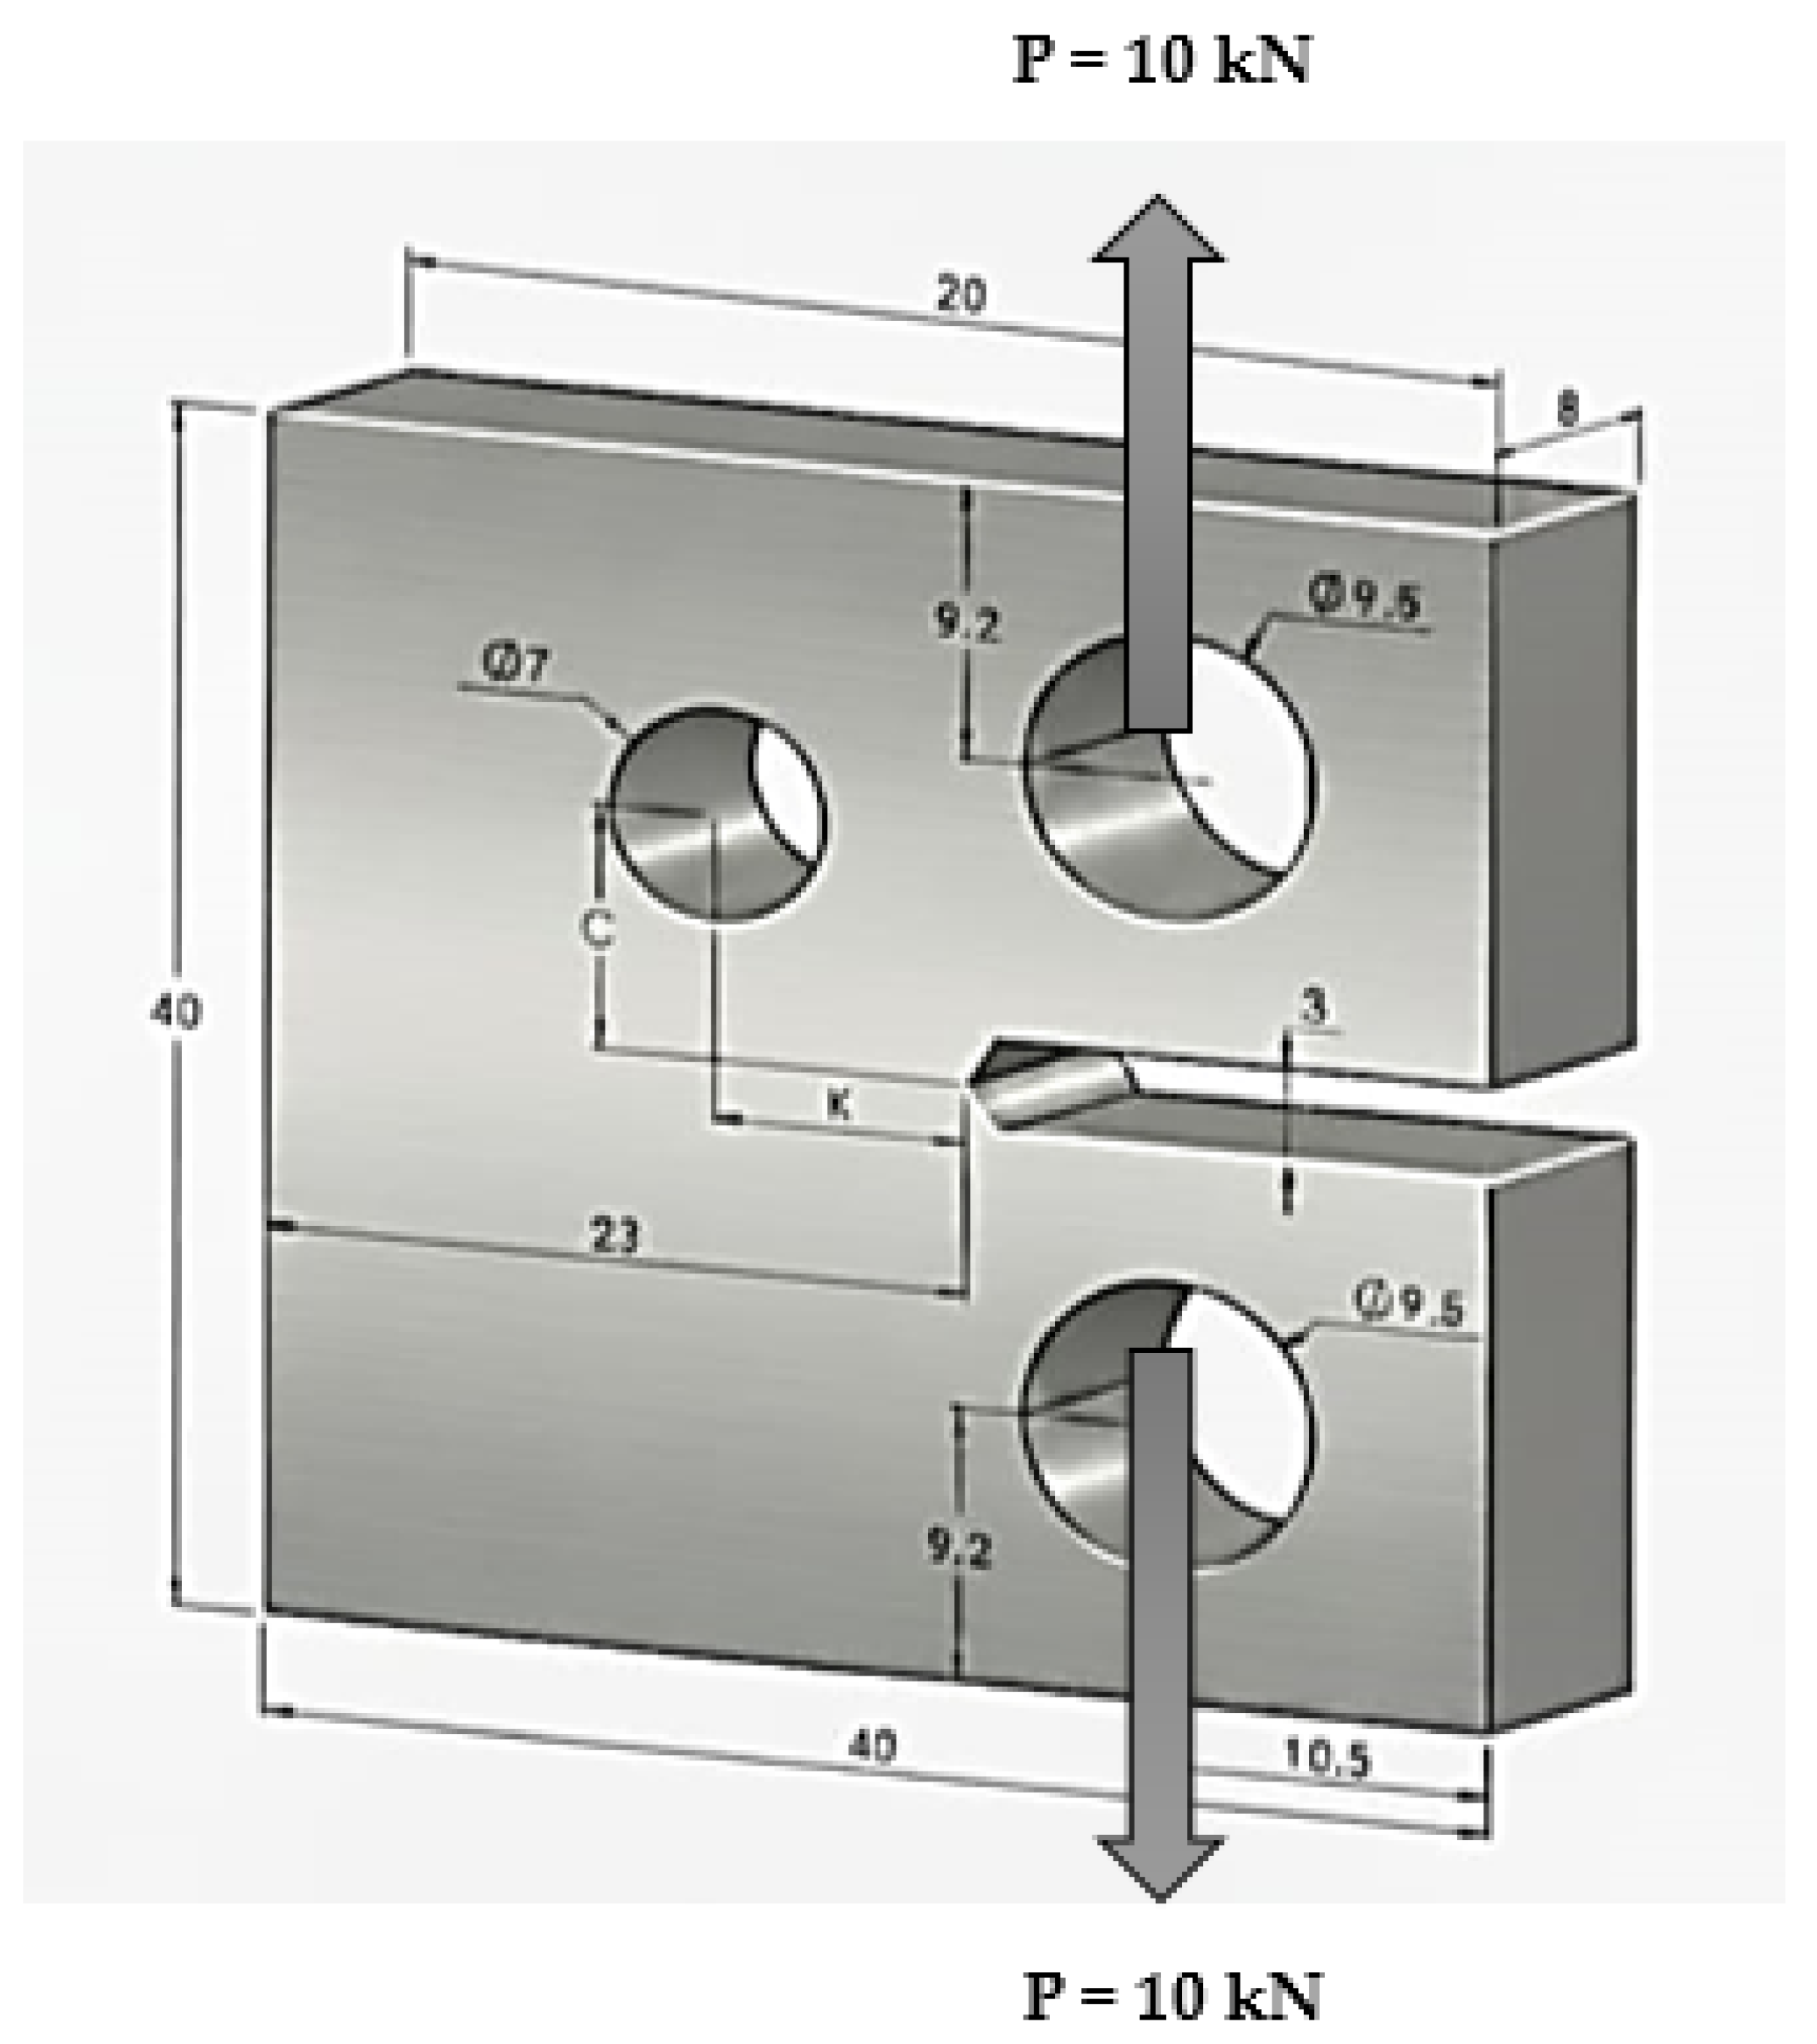
Figure 1. Modified CT Specimen dimensions.
Crystals 15 00979 g001
Figure 2. Generated mesh (a) CT1, (b) CT2.
Crystals 15 00979 g002
Figure 3. Crack growth path of the CT1 specimen compared to the experimental results from Miranda et al. [25].
Crystals 15 00979 g003
Figure 4. Crack growth path of the CT2 (a) Present study, (b) Compared to the experimental results from Miranda et al. [25], (c) experimental [11], and (d) extended finite element method [11].
Crystals 15 00979 g004
Figure 5. Comparison of fatigue life cycles for CT1 [25].
Crystals 15 00979 g005
Figure 6. Comparison of fatigue life cycles for CT2 [25].
Crystals 15 00979 g006
Figure 7. Relationship between fatigue life cycles and stress ratio for CT1.
Crystals 15 00979 g007
Figure 8. Relationship between fatigue life cycles and stress ratio for CT2.
Crystals 15 00979 g008
Figure 9. Maximum principal stress distribution across the investigated stress ratios for CT1.
Crystals 15 00979 g009
Figure 10. Maximum principal stress distribution across the investigated stress ratios for CT2.
Crystals 15 00979 g010
Figure 11. The von Mises stress distribution across the investigated stress ratios.
Crystals 15 00979 g011
Table 1. Mechanical properties of specimens.
PropertyValue in Metric Unit
Modulus of elasticity, E205 GPa
Poisson’s ratio, υ0.29
Yield strength, σy285 MPa
Ultimate strength, σu491 MPa
Paris’ law coefficient, C8.59 × 10−14
Paris law exponent, m4.26
Table 2. Fatigue life cycles at different stress ratio.
Stress Ratio (R)Fatigue Life of CT1 (Cycles to Failure)Fatigue Life of CT2 (Cycles to Failure)
0.1341,250142,092
−0.1133,65556,836
−0.292,15939,197
−0.365,62227,998
−0.447,86220,436
−0.535,67415,720
−110,4714623
Table 3. Maximum principal stress values at different stress ratio.
Stress Ratio (R)Maximum Principal Stress (MPa), CT1Maximum Principal Stress (MPa), CT2
0.1236.13173.71
−0.1218.22159.23
−0.2224.67164.24
−0.3158.65115.85
−0.4231.78169.12
−0.5300.23219.58
−1284.97208.75
Table 4. Maximum von Mises stress at different stress ratios.
Stress Ratio (R)Max Von Mises Stress (MPa)
0.1153.06
−0.1176.37
−0.2172
−0.3199.76
−0.4198.14
−0.5188.16
−1146.77
Disclaimer/Publisher’s Note: The statements, opinions and data contained in all publications are solely those of the individual author(s) and contributor(s) and not of MDPI and/or the editor(s). MDPI and/or the editor(s) disclaim responsibility for any injury to people or property resulting from any ideas, methods, instructions or products referred to in the content.