Article

Explicit Crystal Plasticity Modeling of Texture Evolution in Nonlinear Twist Extrusion

by
Ülke Şimşek
1,*,
Hiroyuki Miyamoto
2 and
Tuncay Yalçınkaya
3
1
Roketsan Missiles Industries Inc., Ankara 06780, Türkiye
2
Department of Mechanical Engineering, Doshisha University, Kyoto 610-0321, Japan
3
Department of Aerospace Engineering, Middle East Technical University, Ankara 06800, Türkiye
*
Author to whom correspondence should be addressed.
Crystals 2025, 15(11), 950; https://doi.org/10.3390/cryst15110950
Submission received: 30 September 2025 / Revised: 27 October 2025 / Accepted: 29 October 2025 / Published: 2 November 2025
(This article belongs to the Section Crystalline Metals and Alloys)

Abstract

The Nonlinear Twist Extrusion (NLTE) method, a novel severe plastic deformation (SPD) technique, aims to enhance grain refinement and achieve a more uniform plastic strain distribution. Grain size and its uniform distribution strongly influence the physical properties of metals. Therefore, predicting texture evolution during processing is essential for optimizing forming parameters and improving material performance. In this study, a rate-dependent crystal plasticity formulation is implemented in an explicit framework in Abaqus finite element software, based on a finite strain approach with multiplicative decomposition of the deformation gradient. Crystal plasticity finite element (CPFEM) simulations are conducted on single-crystal copper under boundary conditions representing the NLTE process. The influence of dynamic friction coefficients on texture evolution is systematically investigated, and the results are compared with experimental observations. The study provides new insights into deformation mechanisms during NLTE and highlights the strong correlation between texture development and forming parameters.

1. Introduction

Developing nanocrystalline materials, emphasizing their dominant traits like enhanced hardness and strength, has been proposed for over four decades [1]. Materials with exceptional mechanical properties are expected to exhibit high strength, toughness, extended fatigue life, and excellent wear resistance qualities desirable for structural applications. However, several investigations suggest that nanocrystalline materials often demonstrate reduced ductility [2] and even brittle behavior in advanced structural applications [3,4]. The mechanism of plastic deformation linked to the generation and movement of dislocations within ultrafine grains (UFGs) possibly accounts for the weak mechanical properties observed in the production of nanocrystalline materials [5]. Recent advancements in severe plastic deformation (SPD) techniques applied to bulk billets under high pressure have demonstrated promising outcomes in addressing the intrinsic mechanical limitations typically associated with nanocrystalline materials. By refining the microstructure through advanced processing routes, these methods aim to significantly enhance their overall mechanical performance. The pioneering work of predisposing UFG structures through SPD processing has sparked interest in a fresh approach to producing bulk nanostructured metals and alloys. To address the challenge of achieving a uniform distribution of fine-grained materials, various SPD techniques have been investigated. These techniques include equal channel angular pressing (ECAP) [6,7], high-pressure torsion (HPT) [8,9], accumulated roll bonding (ARB) [10,11], multi-directional forging (MDF) [12,13,14], and twist extrusion (TE) [15,16]. The ECAP method, since its initial development, has been the subject of SPD research due to its ability to produce high-quality UFG materials [17,18]. The practical implementation of ECAP is often restricted by several factors, including die instability, limited tool life, and the overall complexity of the forming route [19,20]. Similar to ECAP, the TE technique also displays a distinct characteristic: intense grain refinement predominantly occurs during the early stages of deformation. However, this method suffers from non-uniform strain distribution within the workpiece [21]. Although ECAP is known to effectively refine microstructures, achieving a stable and homogeneous ultrafine-grained structure through repeated passes remains challenging [22]. Furthermore, TE requires a relatively high punch load and leads to heterogeneous strain along the billet’s transverse section. To address these limitations, an alternative severe plastic deformation route, known as Non-linear Twist Extrusion (NLTE), has been developed. Early investigations have demonstrated that this method offers several advantages, such as lowering the punch force and promoting a more uniform strain distribution after a single deformation step [23].
Recent advancements in the finite element method (FEM) and computer science have facilitated the understanding of the physical explanations behind deformation and enabled comprehensive investigations into SPD processes. FEM can solve intricate problems involving geometric nonlinearities [24,25], material nonlinearities [26,27], and variable contact issues, including frictional conditions, typically found in simulations of metal forming processes [28,29].
In general, FEM employs two primary solver types for metal forming simulations: implicit and explicit algorithms [30,31]. Implicit solvers rely on Newton–Raphson iterations, which require a smooth residual for convergence. Sudden contact state changes (stick–slip–separation) and non-differentiable Coulomb friction result in a discontinuous stiffness matrix and an ill-conditioned Jacobian. As a result, implicit schemes often face convergence issues in dynamic contact and friction problems. Therefore, implicit methods may not be optimal for problems dominated by highly discontinuous nonlinearities, such as frequent changes in contact and frictional sliding [32,33]. As the simulation model size increases, the number of mesh elements increases, leading to higher memory usage and more significant CPU costs per iteration and increment [34,35]. Rapid changes in contact conditions may cause convergence difficulties. In contrast, explicit solution techniques are advantageous for analyzing substantial three-dimensional contact problems, making them suitable for metal-forming simulations [36]. However, explicit algorithms are conditionally stable, requiring smaller time increments than the duration of the forming process. This limitation can be addressed by artificially increasing simulation loading velocity and material density. The advantages of explicit methods in metal forming have been highlighted in prior works [37,38].
Anticipating texture evolution in metals during SPD processes is crucial for mold design and determining process parameters. The crystal plasticity finite element method (CPFEM) is recognized as a powerful tool for simulating microstructure evolution during SPD processes. The success of CPFEM in predicting texture evolution and its contributions to production methods are growing in the literature, with research encompassing both implicit and explicit CPFEM approaches.
In light of material science and technology advancements, reliable experimental data on microstructural plasticity have become increasingly accessible. These data are crucial for comprehensive research into metal-forming processes, understanding local phenomena, and identifying macroscopic models. In industrial manufacturing, predicting material mechanical properties throughout the material processing phase requires improved predictive and physically based models to inform processing. The influence of texture and anisotropy on the mechanical properties of products is a key area of investigation. Copper (Cu) has traditionally served as the primary material for thermal management and electrical conduction across various industrial fields due to its exceptional thermal and electrical conductivity. Refining the grain size results in a notable enhancement in hardness and mechanical properties [39]. Understanding the material’s behavior throughout various processing stages enables the customization of mechanical properties and the development of innovative materials suitable for diverse applications.
Metal forming simulations with CPFEM can be conducted using implicit and explicit algorithms. Implicit CPFEM methods may encounter numerical challenges when simulating highly discontinuous nonlinear and high-speed dynamic processes [40,41]. At the same time, explicit algorithms are often preferred for stable analysis increments due to contact nonlinearities and frictional discontinuities. However, employing crystal plasticity in large-scale finite element simulations can pose challenges, mainly due to the computational cost associated with stress update algorithms.
In this study, a novel rate-dependent crystal plasticity user subroutine (VUMAT) algorithm is developed for the explicit solver within the Abaqus FE commercial program. The single copper crystal is produced by using the Bridgman method [42]. The initial orientation of a single copper crystal is determined using electron backscatter diffraction (EBSD), a material characterization technique widely applied to metallic materials for determining phase fractions and grain sizes of the microstructure [43]. The texture determined by the EBSD experiment is used in CPFEM analysis. The impact of the dynamic friction coefficient on the final texture is investigated, and the texture evolution of a single copper crystal specimen following the NLTE process is simulated and compared with the experimental results.

2. Finite Element Model Definition

In the NLTE analysis, the inner extrusion surfaces of the 3D mold geometry are isolated and subsequently converted into a 2D surface representation. This transformation is carried out to optimize mesh quality and significantly decrease computational time (Figure 1). Both the mold and punch are modeled as rigid bodies with a material density of ρ = 7800 kg / m 3 . To constrain the mold, Encastre boundary conditions ( u 1 = u 2 = u 3 = R 1 = R 2 = R 3 = 0 ) are imposed on the reference node at its center of mass. Meanwhile, the velocity boundary conditions are applied to the reference point of the punch rigid body, enabling controlled motion during the extrusion step.
The cylindrical specimen has a radius of 5 mm and a length of 20 mm. To reduce geometric distortion during deformation, the billet is discretized using 900 C3D8R linear hexahedral elements (Table 1), with particular consideration of the ratio between deformation velocity and dilatational wave speed. The initial crystallographic orientations (Euler angles) assigned to the specimen are summarized in Table 2.
The rigid punch is controlled through a prescribed velocity boundary condition defined at its reference node, while its lateral motion is restricted by applying slot constraints, enforcing u 1 = u 2 = R 1 = R 2 = R 3 = 0 . The punch itself is also meshed with C3D8R elements. For the contact formulation, the explicit general contact algorithm is employed in combination with a tangential frictional interaction to accurately capture interface behavior during the CPFEM simulations.
The effect of interface friction is explored for three different friction coefficients: μ = 0 (frictionless), μ = 0.01 , and μ = 0.05 [44]. The objective of this analysis is to investigate how friction influences the evolution of the initial texture and orientation distribution after undergoing the NLTE process.
A mass scaling factor of four is introduced to stabilize and accelerate the explicit computation without compromising solution accuracy. Furthermore, a back pressure of 200 MPa is applied to the bottom surface opposite to the extrusion direction to preserve the billet’s circular cross-section [45], along with an additional gravity load acting on the entire model.
The contact between the polycrystalline and single-crystal copper regions is modeled using tie constraints. The polycrystalline copper domain is represented with a von Mises plasticity model, incorporating the experimentally obtained [46] true stress–strain response.

3. Explicit CPFEM Formulation

3.1. Kinematics

The material constitutive response of single crystals can be effectively modeled by considering crystallographic slip mechanisms [47,48]. The total deformation gradient ( F = R * U ), where R * represents rigid body rotation and U denotes the right stretch tensor, can be multiplicatively decomposed into elastic ( F e ) and plastic ( F P ) components [49] as shown in Equation (1). Moreover, the elastic portion of the deformation ( F e ) can be expressed as the product of the left stretch tensor ( V e ) and the rotation tensor ( R e ) Figure 2.
F = F e F p
In the Abaqus explicit formulation, the total rotation tensor R * represents rigid body rotation and is determined using the Green–McInnis–Naghdi rate [50]. When assuming plastic deformation, the plastic component of the deformation gradient has no impact on the rigid body rotation of the single crystal. Consequently, the elastic part of rotation R e can be considered equivalent to the total rotation R * of the deformation, as shown in Equation (2).
F = R * U = V e R * F p
The resolved shear stress τ α acting on the α -th slip system in the undeformed lattice can be described as
τ n α = k = 1 α C n e 0 S n e 0 s ˜ 0 α n ˜ 0 α
where C n e 0 in Equation (3) is the elastic right Cauchy–Green strain tensor and defined as Equation (4) and subscript n defines the iteration number.
C n e 0 = F n e T F n e
The term S n e 0 represents the Piola-Second Kirchhoff stress (PK2) on the intermediate state U 0 as shown in Figure 2. Furthermore, C n e 0 S n e 0 is the Mandel stress [51,52] on the intermediate state U 0 in Figure 2. s ˜ 0 α n ˜ 0 α is the tensor product of the slip direction and nominal direction of initial slip system directions, which can be found by multiplying the slip system ( s α , n α ) with the Bunge-formulated Euler angles ( α , β , γ ) from Equation (5).
s ˜ 0 α = Q 0 s α , n ˜ 0 α = Q 0 n α
Q = R * Q 0
The initial orientation matrix Q 0 is determined by the Euler angles ( α , β , γ ) . The transformation matrix Q, which corresponds to the reference frame of the corotational lattice frame, is updated using Equation (6) [53,54,55]. The Euler angles of the single crystal during deformation can be obtained from the matrix Q, and they are utilized to characterize the final texture.

3.2. Power Law Type Flow Model

The rate-dependent power-law type model is utilized. This model establishes a connection between the slip rate on each slip system, the current yield stress τ α , and the slip resistance g α , as expressed in Equation (7) [56].
γ ˙ n α = γ ˙ 0 | τ n α g n α | m s i g n ( τ n α )
Here, γ ˙ 0 represents the reference shearing rate, and the exponent m denotes the strain rate sensitivity coefficient. This flow model is characterized by its simplicity and ease of implementation in the user subroutine due to its straightforward formulation and straightforward calibration of the model parameters.

3.3. Hardening Model

The slip resistance, denoted as g α , is expressed in Equation (8). The initial slip resistance g 0 is initially equal to the critical resolved shear stress τ c r . The hardening moduli h α β indicate the rate of strain hardening on slip system α as a result of slip on slip system β . The phenomenon of self and latent hardening is phenomenologically described by Equation (8) [57].
g ˙ α = k = 1 12 h α β | γ ˙ β |
The saturation-type model is introduced in Equation (9) [58,59].
h α β = h 0 [ q + ( 1 q ) δ α β ] ( 1 g β / g s a t ) a s i g n ( 1 g β g s a t )
Here, δ α β = 1 when α = β , and zero otherwise. The material parameters h 0 , g s a t , and a denote the reference self-hardening coefficient, the saturation values of slip resistance, and the hardening exponent, respectively. The parameter q represents the latent hardening parameter.

3.4. Plastic Component of Deformation Gradient

The plastic deformation gradient L p can be determined by summing the shear rates associated with each slip system, represented as γ ˙ α , as specified in Equation (10).
L p = k = 1 α γ ˙ n α s ˜ 0 α n ˜ 0 α
Plastic component of deformation gradient can be computed using Equation (11),
F n + 1 p = ( I + Δ t k = 1 α γ ˙ n α s ˜ 0 α n ˜ 0 α ) F n p

3.5. Elastic Component of Deformation Gradient

The intermediate configuration denoted by U 0 in Figure 2 is not necessarily uniquely defined, as an arbitrary rigid body rotation can be added to it without inducing stress. This non-uniqueness can be resolved by applying a total rigid body rotation to the plastic deformation gradient. Consequently, the elastic left stretch tensor can be determined using Equation (12), and the elastic deformation gradient can be obtained via Equations (1) and (2).
V n + 1 e = F n + 1 ( R * F p ) 1
F n + 1 e = V n + 1 e R *

3.6. Corotational Stress Rate

The Green–Naghdi stress rate σ can be defined as the pushforward of the time derivative of the corotational stress σ . One can construct objective rates by pulling back and pushing forward with the rotation tensor R only since the rotation causes the stress rates to be non-objective. To define the time derivative of the corotational Cauchy stress, we need to calculate the term R * T σ ˙ R * , where R * is the orthogonal rotation tensor, whereas the Cauchy stress rate is related to the second Piola-Kirchhoff (PK2) stress, and the PK2 stress rate can be found from the multiplication of the rotated elastic modulus according to initial orientations C ˜ = Q 0 c C Q 0 c T with the material strain rate tensor, elastic Green–Lagrange strain rate from Equations (14) and (15), Q 0 c is the transformed fourth order initial rotational orientation tensor [60,61].
E ˙ n + 1 = 1 2 [ ( F ˙ n + 1 e ) T F n + 1 e + ( F n + 1 e ) T F ˙ n + 1 e ]
S ˙ n + 1 e 0 = C ˜ : E ˙ n + 1
The corotational stress is defined in the intermediate configuration shown in Figure 2. The material derivative of the material PK2 stress tensor, S ˙ , is objective. It can be thought of as the push forward of the PK2 stress rate from the reference configuration through the elastic part of the right stretch U e , scaled by J 1 . The corotational stress can be expressed as given in Equation (16).
σ = R * T σ R *
The time derivative of the corotational stress can be calculated as,
σ ˙ = R ˙ * T σ R * + R * T σ ˙ R * + R * T σ R ˙ *
From the second PK2 stress rate, the Kirchhoff stress rate ( T ˙ ) of a push-forward operation can determine the defined current state [62,63],
T ˙ n + 1 = F n + 1 e S ˙ n + 1 e 0 F e n + 1 T
From the Kirchhoff stress rate, the Cauchy stress rate can be defined on the current configuration ( U s ) according to
T ˙ n + 1 = J e σ ˙
By employing Equations (2), (18) and (19), we can derive the second term of the time derivative of the corotational stress
R * T σ ˙ R * = 1 d e t F n + 1 e U n + 1 e S ˙ n + 1 e 0 U n + 1 e
U n + 1 e = R * T F n + 1 e
The rigid body rotation R * is formulated using the Green–Naghdi rate. In the context of a rigid body rotation, the first and third terms in Equation (17) represent the rate caused by the rigid body spin. In contrast, the second term corresponds to the portion of the rate caused by other factors (for stress, this refers to the rate associated with the constitutive response). This second term is known as the corotational rate of σ .
σ ˙ = σ + Ω σ n σ n Ω
σ ˙ Δ t = Δ σ + R * σ n R * T
In this equation, σ represents the rate of objective, corotational stress, or the rate associated with the constitutive response. The skew-symmetric angular velocity tensor Ω can be computed using Equation (24).
Ω = R ˙ * R * T
The Cauchy stress σ n at the beginning of the increment has already been rotated [64], so the rigid body rotation of σ n is not performed. As a result, the stress update for the spatial configuration U s can be determined using Equation (25). The explicit crystal plasticity framework VUMAT algorithm is illustrated in Figure 3.
σ n + 1 = σ n + σ ˙ Δ t

3.7. Calibration of Crystal Plasticity Model

In this study, due to the significant inconsistency and scarcity of reliable tensile test data for single-crystal copper reported in the literature [65,66], stress–strain responses of polycrystalline copper are utilized for parameter calibration. A representative volume element (RVE) containing 500 grains, as illustrated in Figure 4 with randomly assigned crystallographic orientations, is subjected to uniaxial tension, with the applied boundary constraints presented in Figure 5. Although the 500-grain homogenization cube does not fully capture the material anisotropy, it provides a sufficiently close approximation to the macroscopic isotropy of polycrystalline copper, effectively representing the averaged mechanical response of the material at the structural scale. The current CPFEM model yields a smooth hardening curve that tends to zero at large strains. This difference can be attributed to the simplified hardening law used in the model, which mainly considers dislocation slip as the dominant deformation mechanism. In real copper, other mechanisms such as dynamic recovery, cross-slip, latent hardening, or dislocation cell formation may contribute to the bi-modal behavior. The homogenization procedure serves as the basis for the CPFEM parameter identification. Throughout the loading process, the stress triaxiality, defined as the ratio of hydrostatic stress to von Mises equivalent stress, is rigorously maintained at a constant value of 1/3. Moreover, all RVE surfaces are constrained to preserve their initial planar geometry during deformation.
To impose the boundary condition, the bottom face of the RVE cube is constrained in the y-direction ( u 2 ). A master node is assigned at the corner of the cube with coordinates ( L 1 , L 2 , L 3 ), which serves as the reference point for coupling the displacement of all boundary surfaces. Because the edges of the RVE are aligned with the global coordinate axes, their linearity is preserved during the entire deformation process [68]. For each surface connected to the master node M, the displacement components u i , where i 1 , 2 , 3 , of all surface nodes are linearly constrained to follow the corresponding displacement of node M. This constraint is defined through the following linear relations:
u 1 ( L 1 , x 2 , x 3 ) ( u 1 ) M = 0 , u 1 ( 0 , x 2 , x 3 ) + ( u 1 ) M = 0 , u 3 ( x 1 , x 2 , L 3 ) ( u 3 ) M = 0 , u 3 ( x 1 , x 2 , 0 ) + ( u 3 ) M = 0 , u 2 ( x 1 , L 2 , x 3 ) ( u 2 ) M = 0 , u 2 ( x 1 , 0 , x 3 ) = 0 .
This procedure establishes the link between the microscopic stress field and the macroscopic constitutive response. The calibrated material parameters employed in the VUMAT CPFEM framework for single-crystal copper are summarized in Table 3.

4. Experimental Procedure

The Bridgman method, a technique designed for controlled crystal growth, is employed to produce single-crystal copper. The core principle behind crystal growth using the Bridgman technique involves directional solidification. This is accomplished by transferring molten material (melt) from a hot region to a colder region within a furnace. A seed crystal is positioned at the bottom of the crucible to ensure specific crystallographic orientations [69].
The experimental procedure begins by placing the crucible, containing the polycrystalline charge and the seed crystal, into the growth chamber. Subsequently, the chamber is evacuated using a vacuum pump and refilled with an inert gas. The furnace temperature is gradually raised during this process. Throughout this stage, the melt inside the crucible undergoes homogenization, driven by natural convection and diffusion within the melt itself, eliminating the need for forced convection [70].
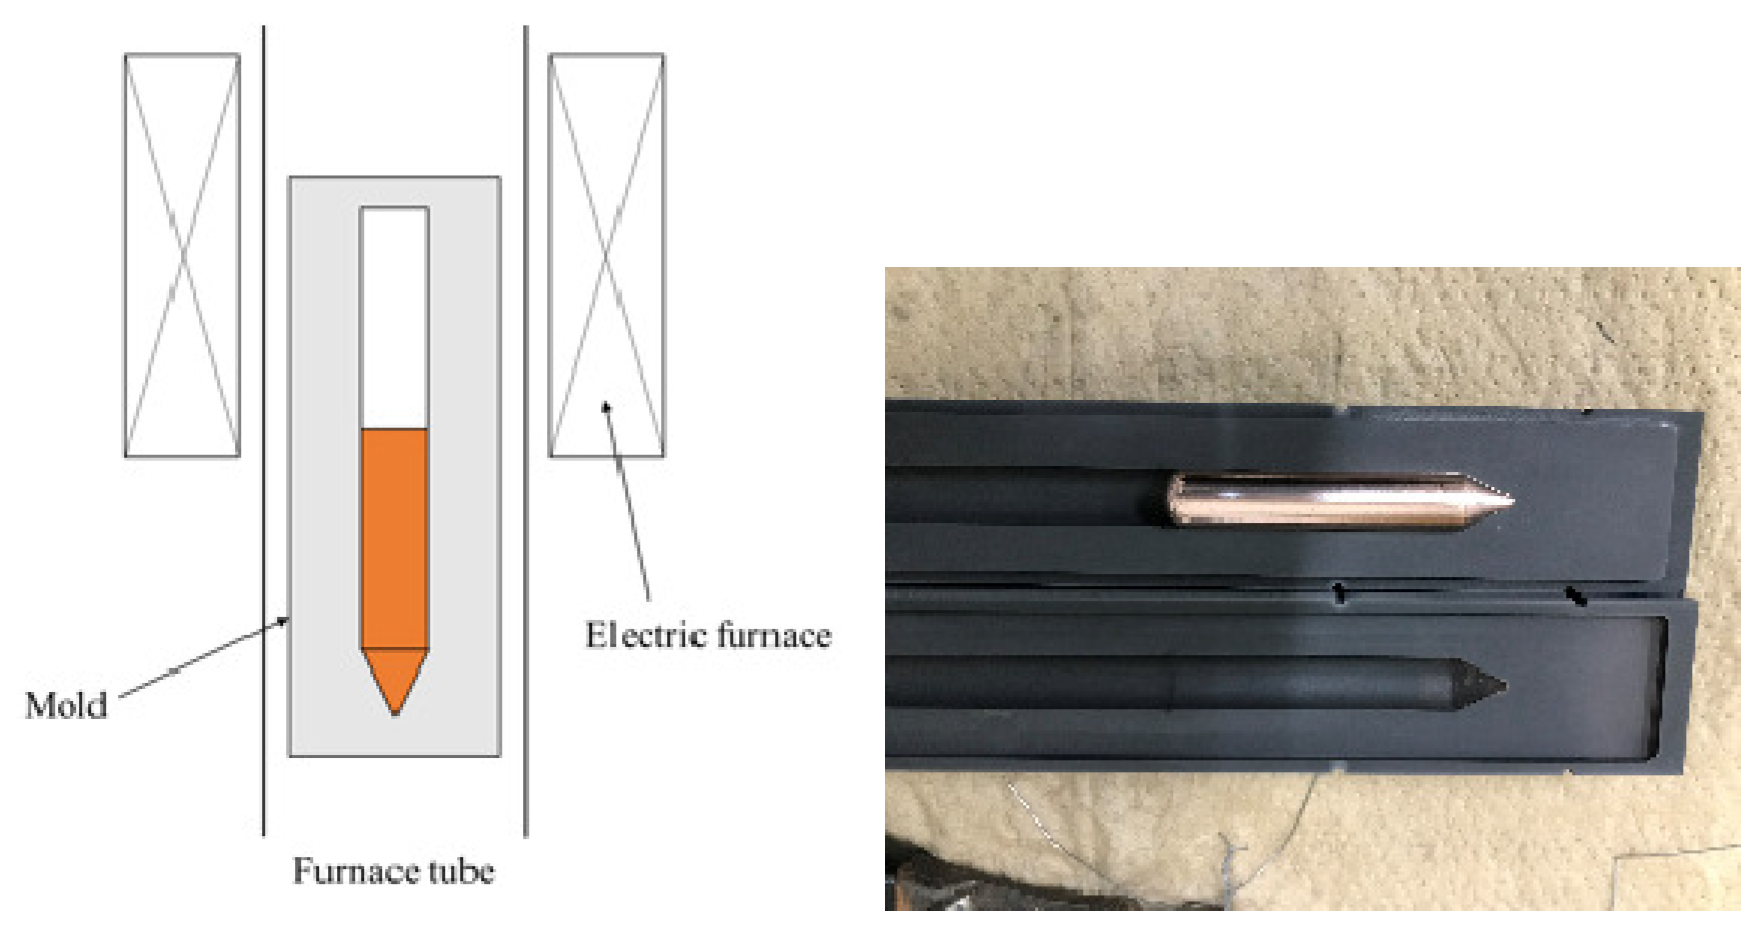
Figure 6 presents a schematic representation of the Bridgman method for single-crystal production. In this method, the furnace is heated to a temperature of 1453 K, and the pulling speed, which determines the rate at which the furnace is moved, is set at approximately 10 mm/h. This carefully controlled process enables the growth of single-crystal materials with the desired properties and orientations [71].
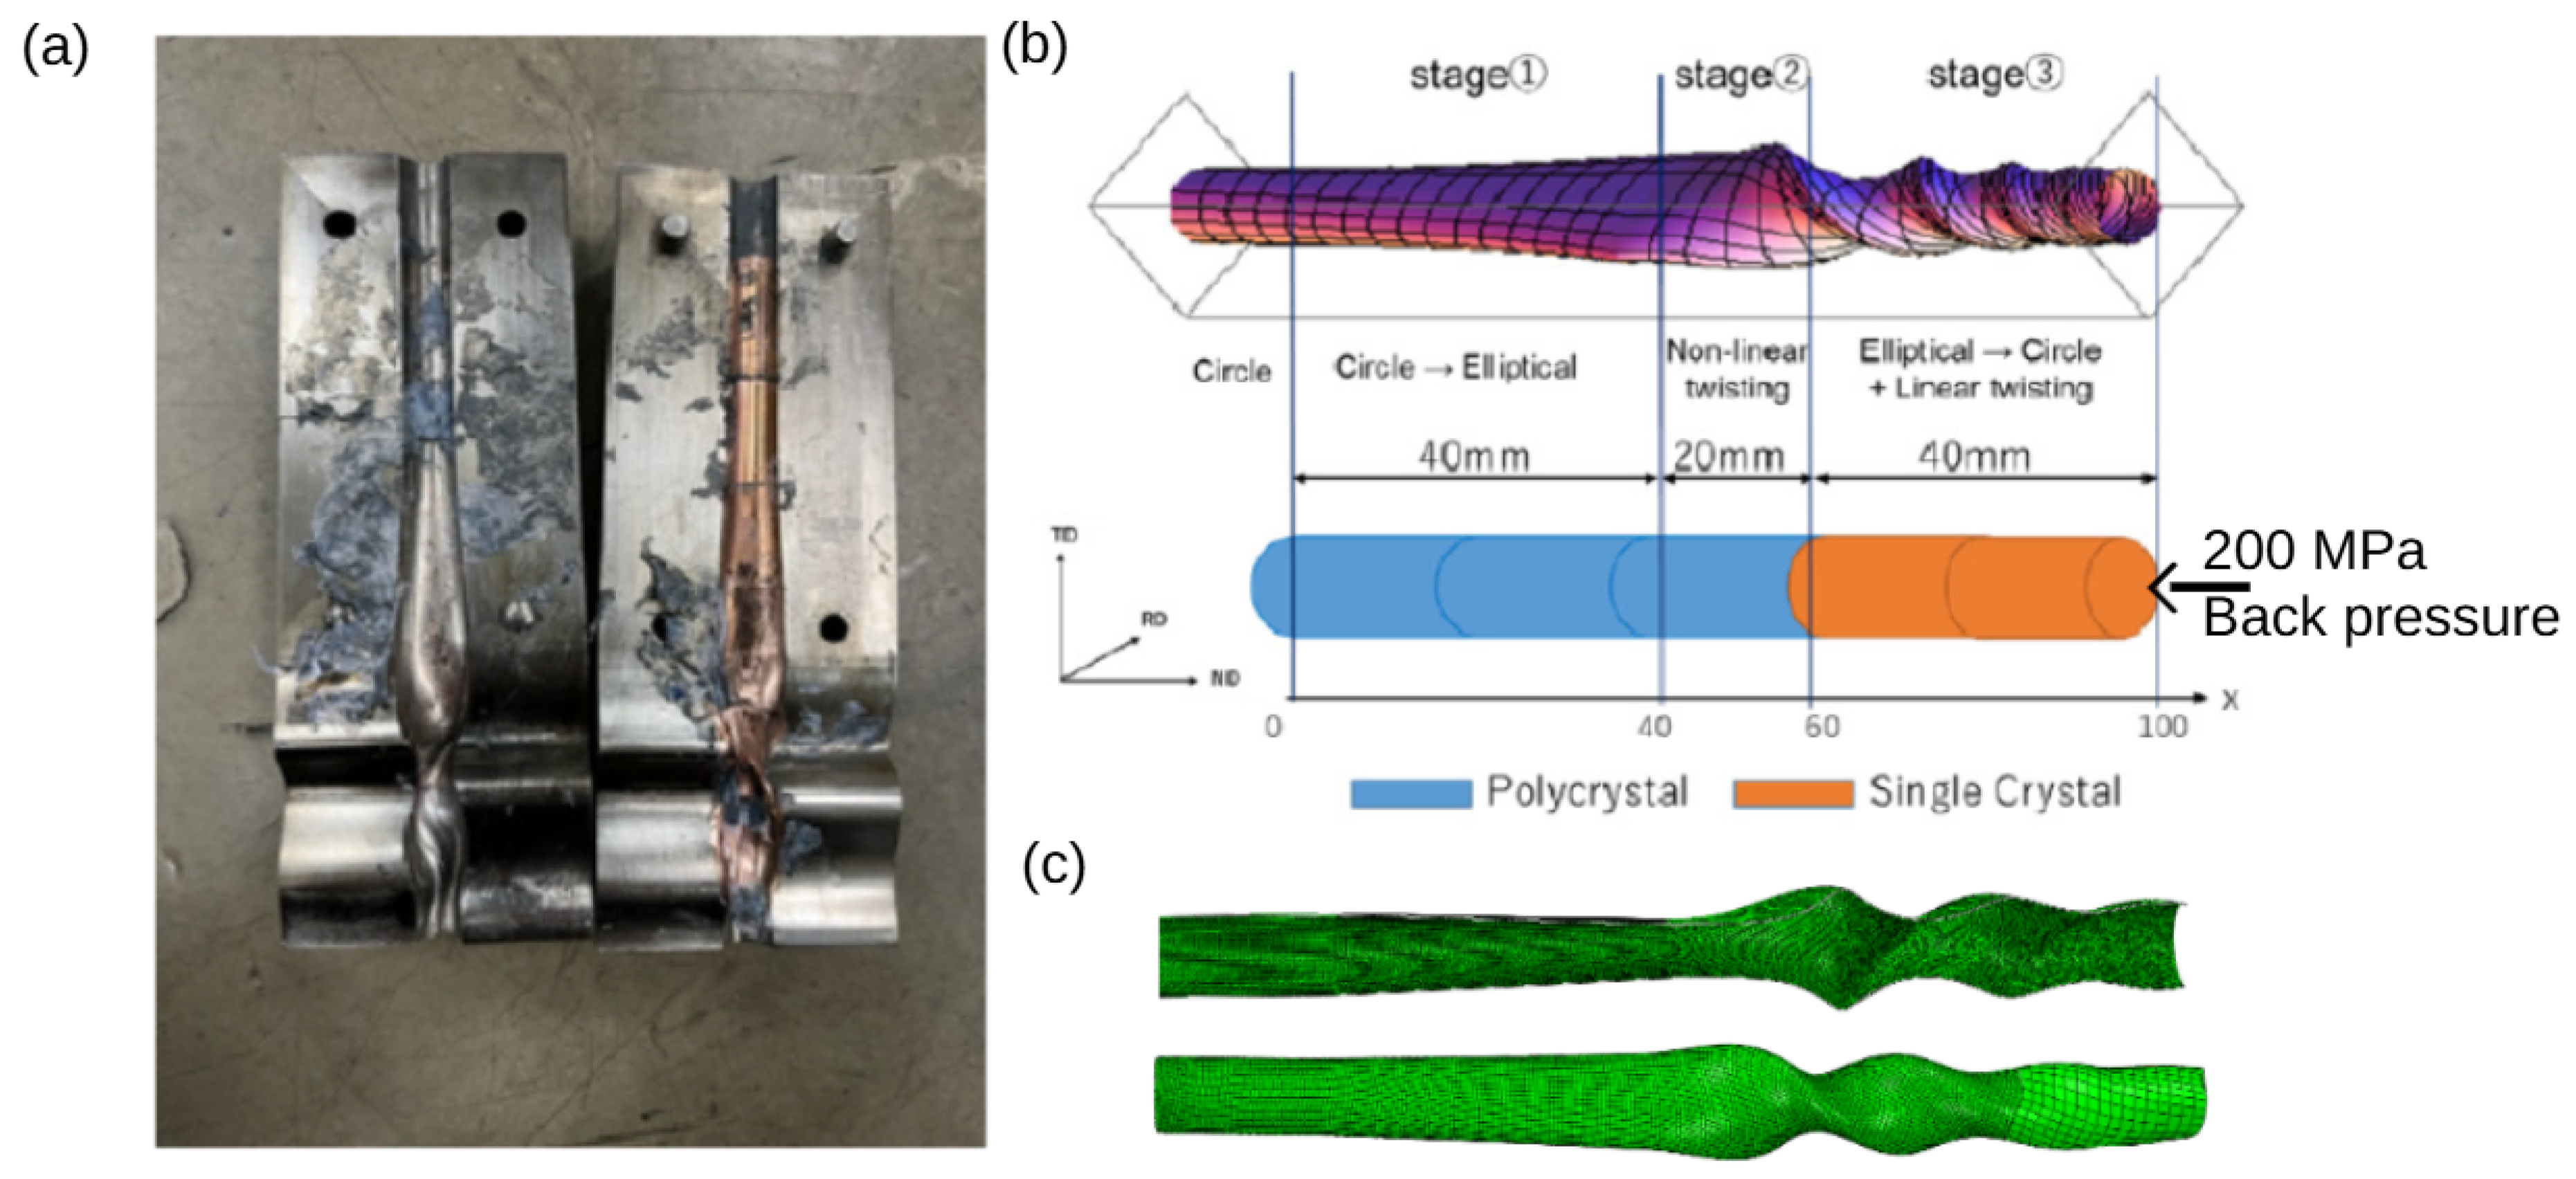
To determine their orientations, the Markov-offline technique uses single copper crystals and a polycrystalline copper sample [72]. An NLTE experiment is conducted at room temperature with a punch speed of 1 mm/s. The experimental setup and the final state of the NLTE process are illustrated in Figure 7. This technique enables the investigation and analysis of the material behavior and orientation changes resulting from the NLTE process.
The samples undergo a series of preparation steps before the EBSD experiments. Initially, the samples are cut using a wire cutter and then progressively refined using fine grades of emery paper (400, 600, 800, 1000, 2400, 4200). Subsequently, they are polished using a polishing wheel with diamond paste of particle sizes 5 μm, 3 μm, and 1.5 μm to achieve a mirror-like finish. The final step involves etching the samples with an appropriate etchant. These prepared samples are then subjected to EBSD experiments. The experimental procedures are summarized and depicted in Figure 8. This series of steps ensures the preparation of samples suitable for detailed microstructural analysis.

5. Results and Discussion

The explicit crystal plasticity model discussed earlier simulates the NLTE process for the single copper crystal specimen. The predicted results obtained through CPFEM are compared to the experimental outcomes for specimens with the same initial orientation. However, before comparing results, it is essential to determine whether the explicit analysis solution is sufficiently close to quasi-static conditions to be considered acceptable. Stability is crucial in explicit dynamic analysis, especially for quasi-static metal forming processes. Time and mass scaling are introduced to reduce the computational time required for solving. However, it is imperative to exercise caution when applying these factors, as they can compromise solution accuracy. Extremely high punch speeds can yield unrealistic results. When the loading rate is increased to model a quasi-static problem efficiently, the material strain rates calculated in the simulation become artificially high due to the scaling factor applied to the loading rate. This can lead to erroneous solutions, particularly when considering strain rate sensitivity. Applying mass scaling to the finite element model can help alleviate issues related to computational time. This study applies a mass scaling factor of four to the entire model in explicit CPFEM analyses for all friction conditions. Energy balance equations can be employed to assess whether a simulation is yielding an appropriate quasi-static response. One common approach is to compare kinetic energy history with internal energy, which is widely accepted in the literature. In metal forming analyses, a significant portion of internal energy arises from plastic deformation. For an acceptable quasi-static solution, the kinetic energy should represent only a small fraction of the internal energy, typically no more than 1–5% [73]. The evolution of internal and kinetic energy concerning analysis time is illustrated in Figure 9 for three different friction coefficients. Upon comparing Figure 9, it becomes evident that the kinetic energy remains a small fraction (less than 1 % ) of the internal energy throughout the analysis, except at the beginning. This observation meets the criterion that kinetic energy should be significantly smaller than internal energy, indicating an acceptable quasi-static solution. Kinetic energy, much smaller than internal energy, holds for both punch speeds of 25 mm/s and 50 mm/s. The completion times for the analyses are provided in Table 4, considering the variation in punch speeds. These considerations ensure that the explicit dynamic analysis solution is stable and quasi-static, providing a reliable basis for comparing CPFEM predictions with experimental results.
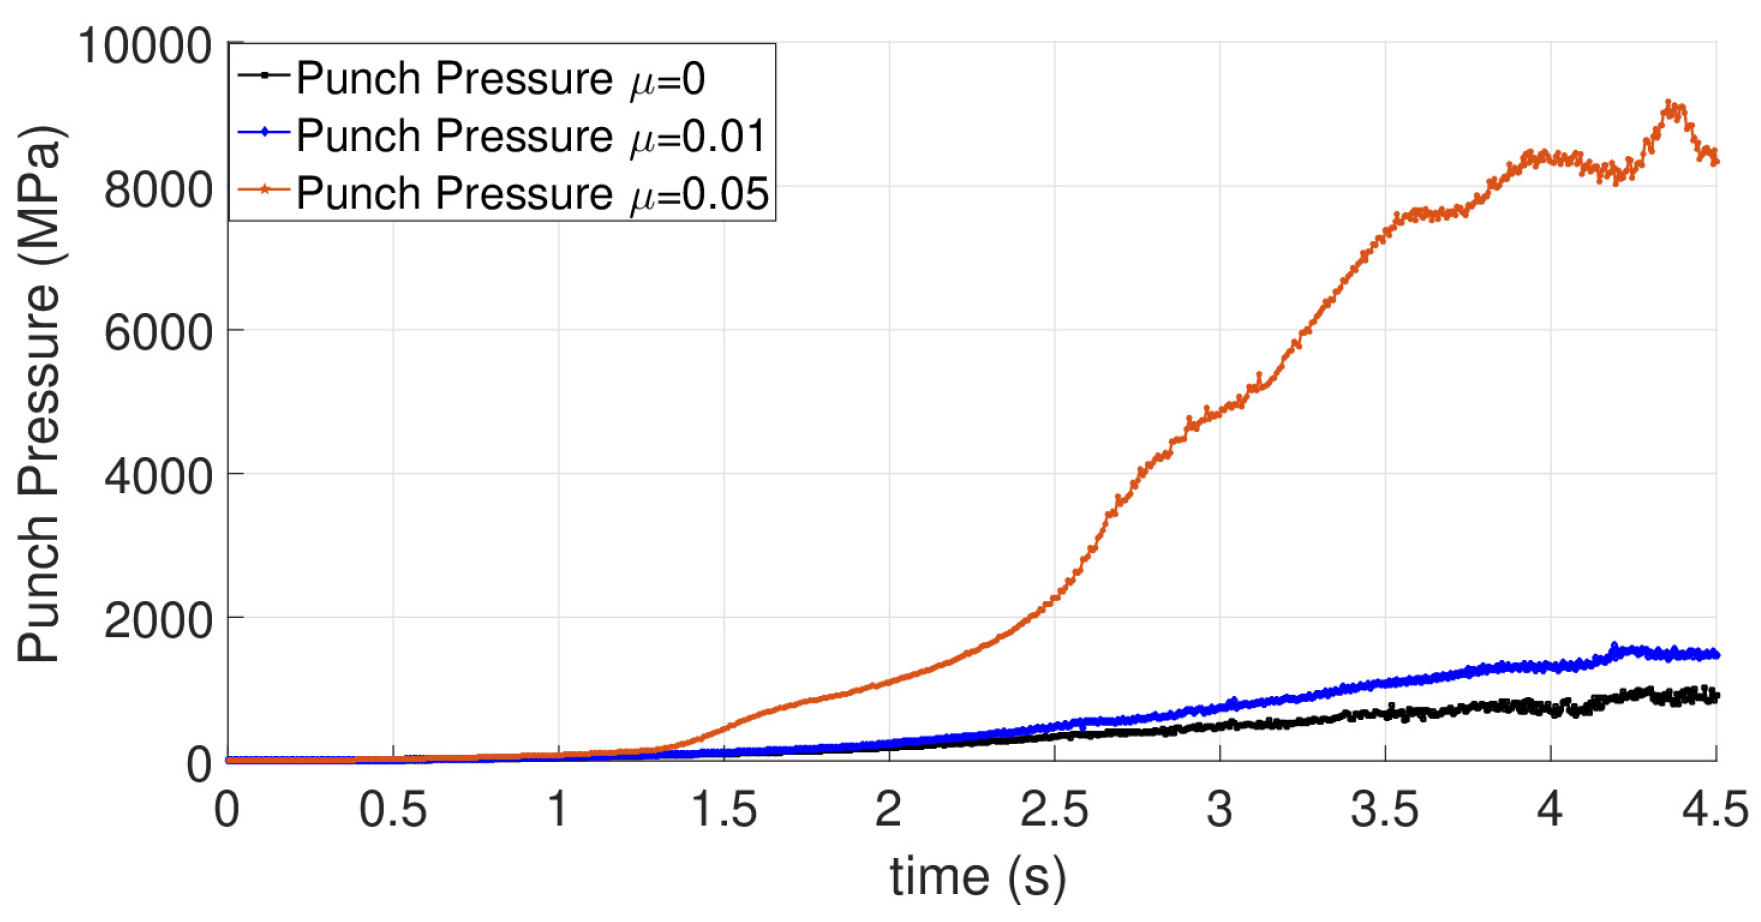
The simulation results unveil distinctive behaviors for NLTE processes with three different friction coefficients, although they all exhibit similar overall trends in NLTE processing time. Figure 10 illustrates the variation of punch force normalized by the cross-sectional area of the specimen, providing a clearer understanding of these behaviors.
The analysis of the punch force evolution reveals a distinct pattern. The load is initially increased as the workpiece head enters the twist zone. Subsequently, the workpiece advances through the twist zone while maintaining a steady increase in force. This force continues to rise consistently until the conclusion of the process. These observations align with the major events discussed in a previous report [74].
Furthermore, the punch pressure values increase with higher friction coefficients. Specifically, there is an approximate 20 % difference in the reaction forces between the frictionless state ( μ = 0 ) and μ = 0.01 . This difference becomes more pronounced when the friction coefficient is elevated to μ = 0.05 , resulting in nearly five times higher punch pressure values throughout the process. These variations underscore the substantial impact of friction on the NLTE process’s overall behavior. The evolution of punch force during the NLTE process demonstrates consistent patterns across different friction coefficients. The presence of friction influences the specific behavior. The friction coefficient directly impacts the punch pressure values, resulting in significant variations in reaction forces among different friction conditions.
A comparison of von Mises stress contours in the longitudinal plane and sectional views of the workpieces for two friction conditions is shown in Figure 11 and Figure 12. These figures provide insight into the distribution and magnitude of von Mises stress within the workpiece.
In the transverse section, the von Mises stress increases from the center of the billet toward the peripheral regions. The highest stress concentrations are observed in the longitudinal plane after the NLTE processes are completed. The frictional conditions at the contact surfaces between the mold and the workpiece notably influence stress distribution.
Comparing the stress distributions for the two friction coefficient values reveals several observations. First, stress accumulation increases with higher friction coefficients at the contact interfaces. Second, when the friction coefficient is reduced, the stress distribution becomes more uniform at the center of the specimen. This suggests that friction plays a significant role in shaping the stress distribution patterns during the NLTE process.
The contours of von Mises’s stress in the longitudinal plane and the sectional views of the workpieces provide valuable insights into stress distribution and accumulation. The friction coefficient has a strong influence on stress patterns, with higher friction values leading to increased stress concentrations at the contact surfaces and lower friction values promoting a more uniform stress distribution in the specimen’s central region.
Accumulated plastic strain is a critical factor in forming processes, as it represents the sum of plastic strain increments and plays a role in preventing unstable fractures or plastic collapse. Excessive accumulated plastic strain can reduce the ductility and toughness of materials. The rate of accumulated plastic strain can be linked to the rate of plastic deformation using the formula ϵ ˙ a p = 2 3 D p : D p , where D p represents the rate of plastic deformation tensor [75].
The distribution of accumulated plastic strain within the workpiece is depicted in Figure 13 and Figure 14, along with sectional views. Typically, the area around the axis of the workpiece displays an average magnitude of accumulated plastic strain. Notably, the highest accumulation of plastic strain occurs on the contact surfaces between the mold and the workpiece. Moreover, the accumulated plastic strain exhibits a uniform distribution throughout the workpiece, spanning from the central region to its periphery.
Comparing the two friction coefficient values, variations in the distribution of accumulated plastic strain become apparent. In particular, as the friction coefficient increases from μ = 0.01 to μ = 0.05 , there is a noticeable increase in the amount of accumulated plastic strain. This indicates that the selection of the friction coefficient substantially impacts the development of plastic strain within the workpiece, with higher friction coefficients resulting in more significant plastic strain accumulation.
Accumulated plastic strain represents the cumulative effect of plastic deformation within the workpiece, with higher strain accumulation typically observed at contact surfaces and a generally uniform distribution from the center to the periphery. The friction coefficient is a key parameter influencing the magnitude and distribution of accumulated plastic strain, where increased friction leads to more pronounced plastic strain accumulation.
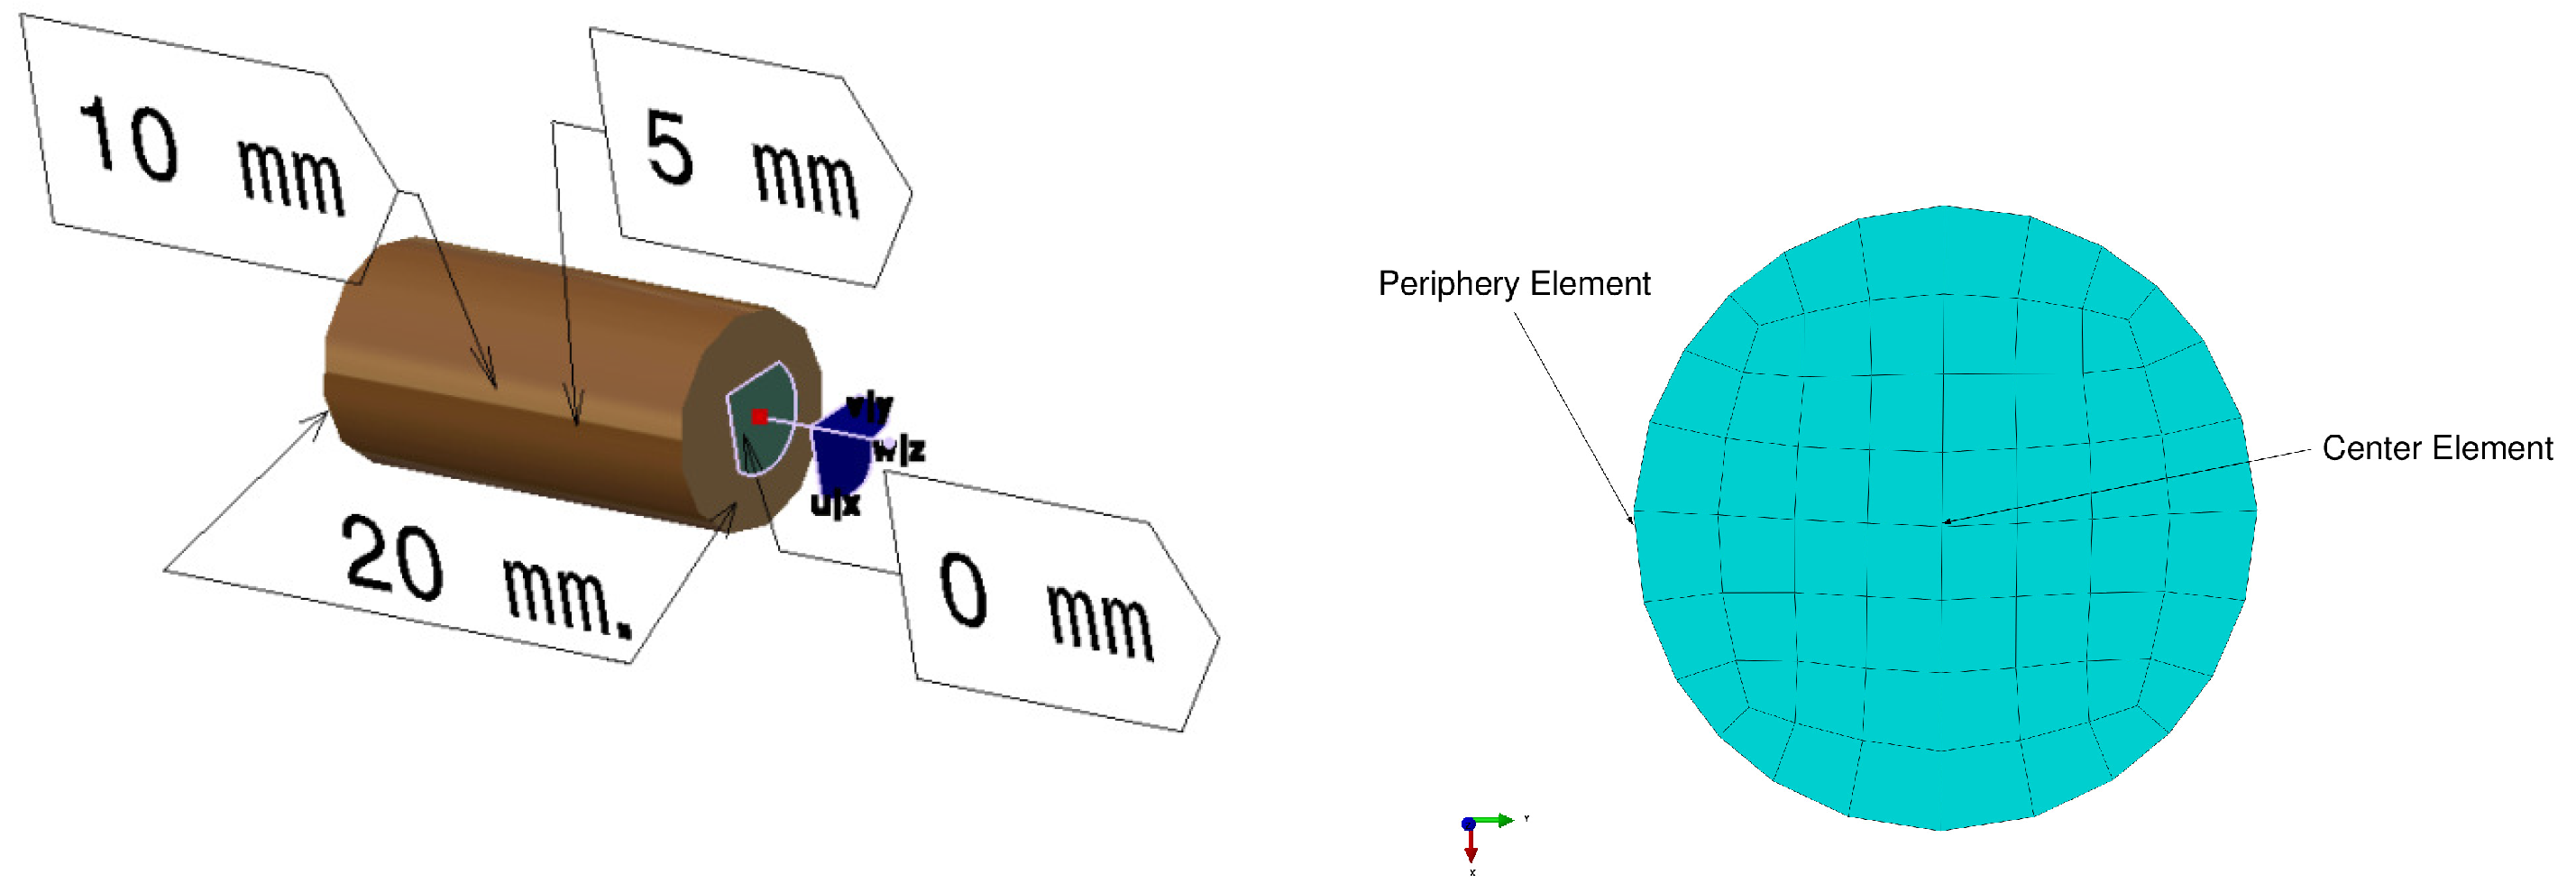
The analysis of deformation behavior and texture evolution in the single copper crystal involved examining specific regions and elements of the specimen, as shown in Figure 15. Modifications are made to the mold’s channel design in the twist section during the NLTE process to address challenges like strain reversal and rigid body rotation commonly associated with twist extrusion processes.
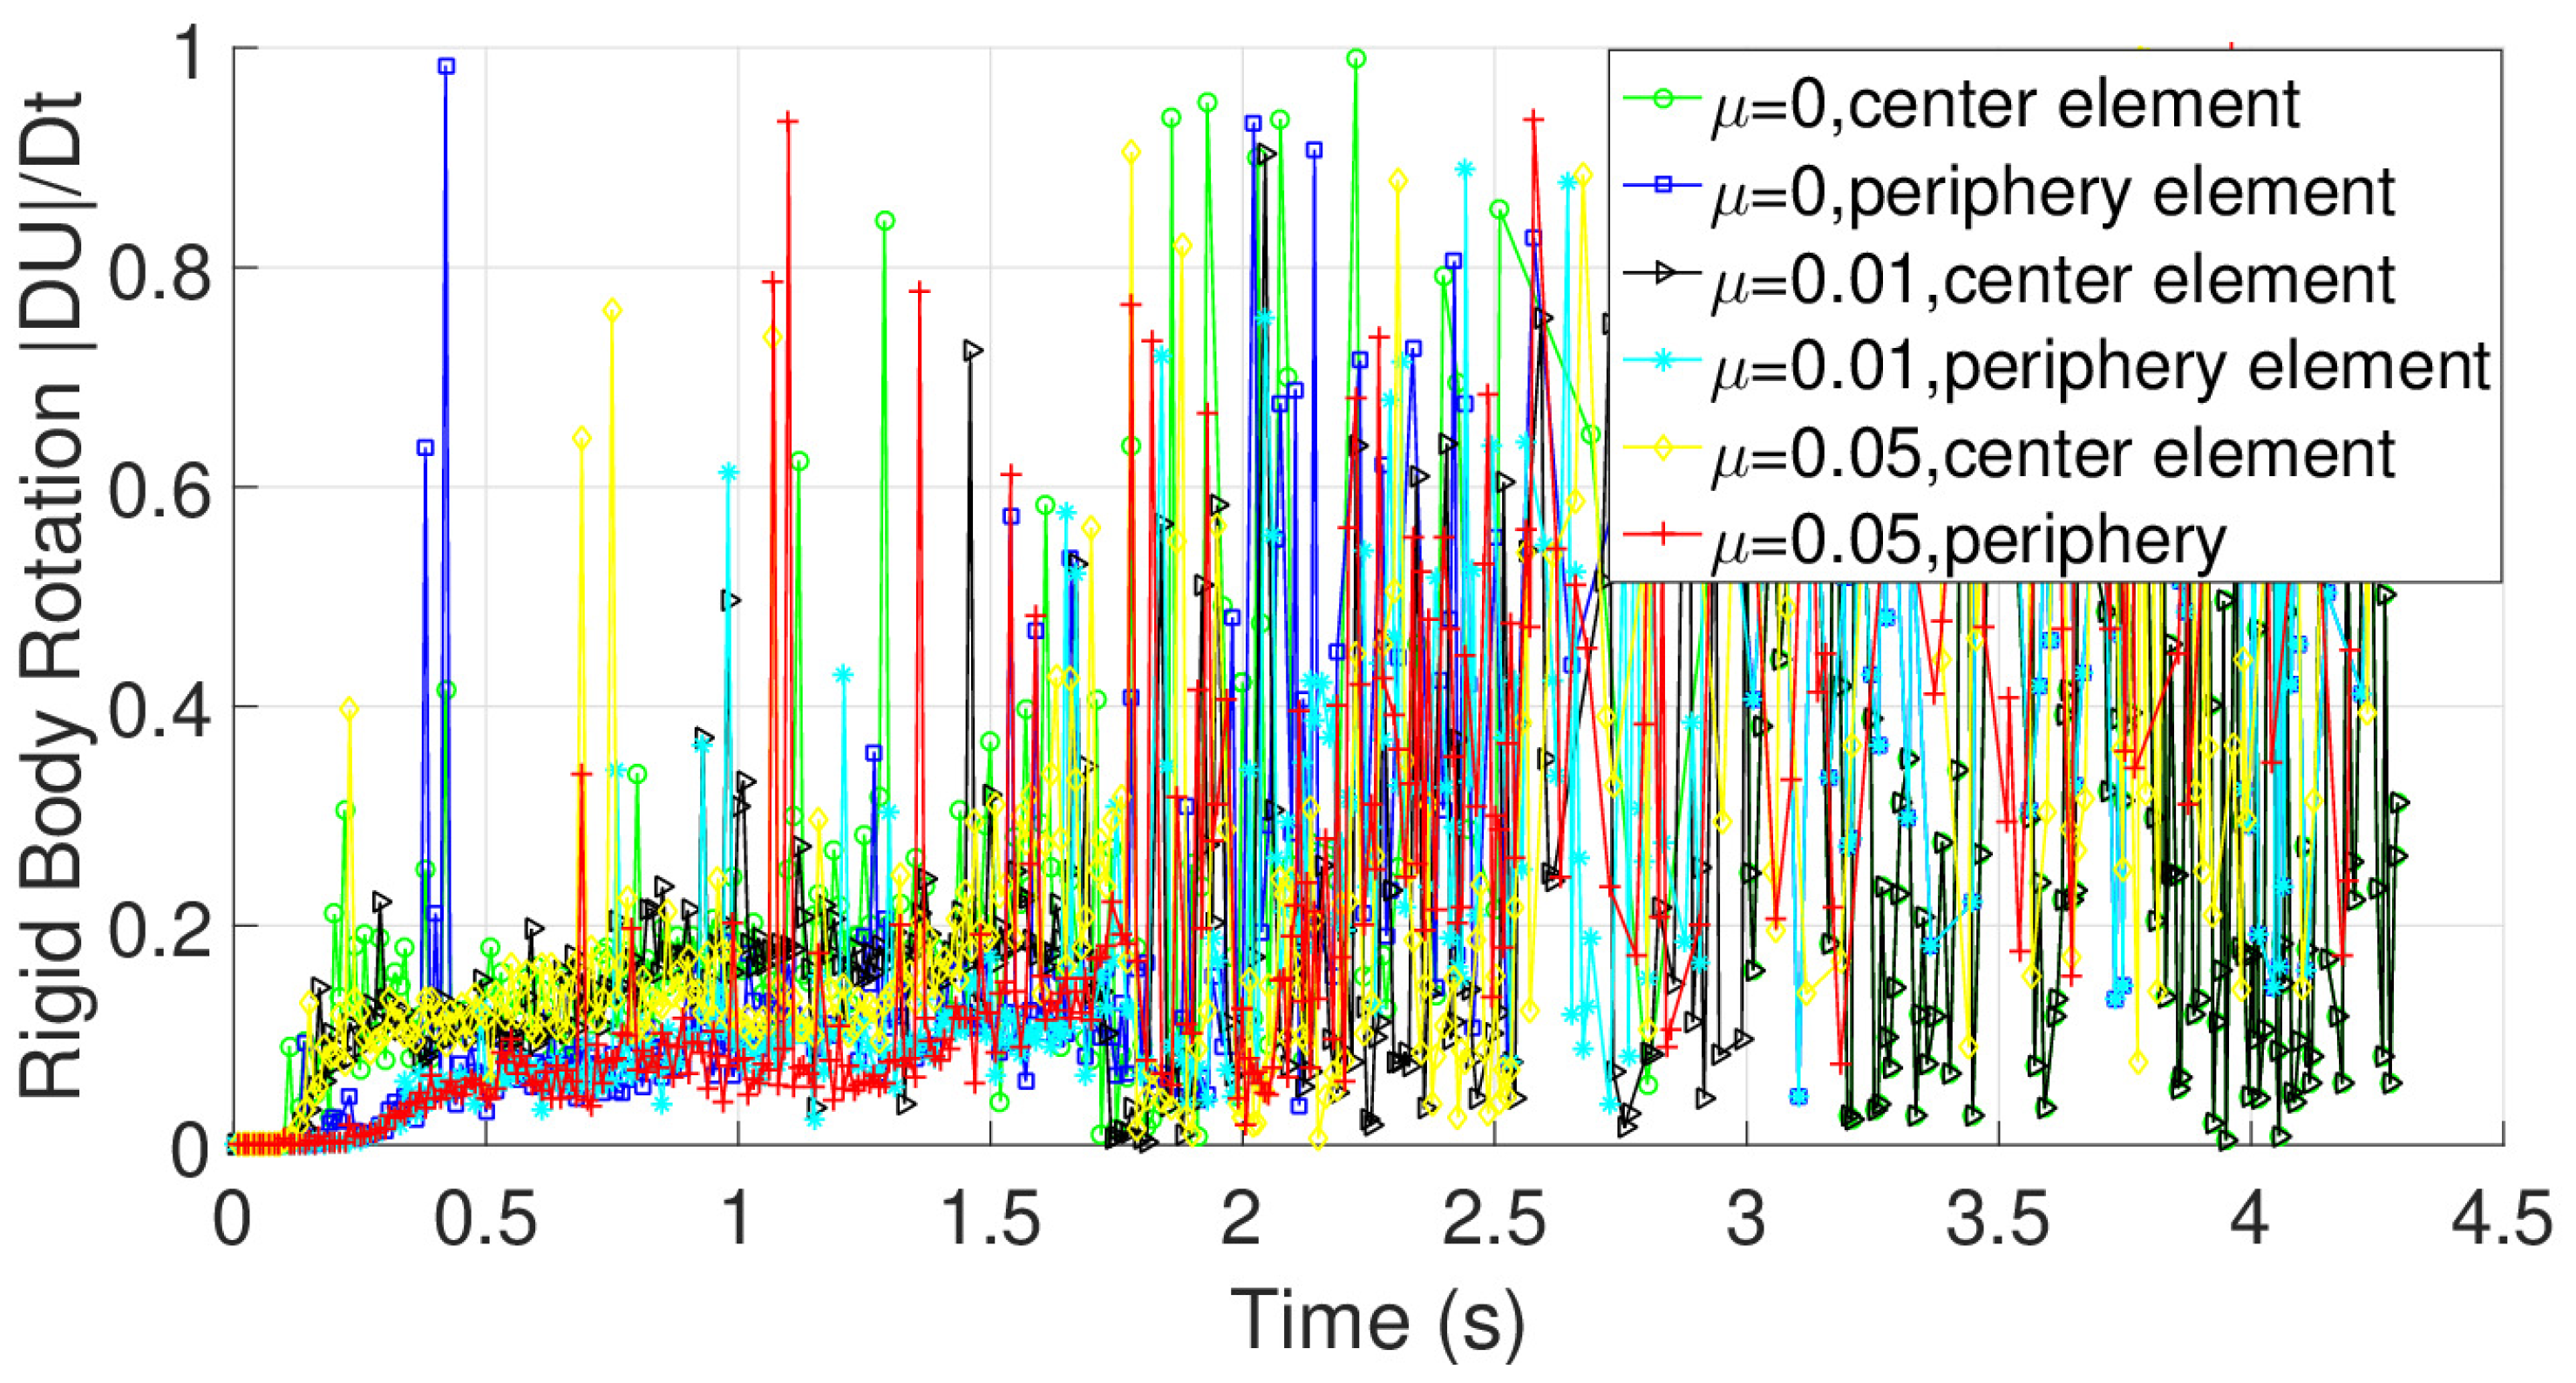
In situations involving rigid body rotation, the movement of elements can be approximated as pure rotation. This simplification leads to the time derivative of the stretch tensor ( U ˙ ) being equal to zero ( U ˙ = 0 ). As a result, the magnitude of the time derivative of the stretch tensor should also be zero ( | U ˙ | = 0 ) when rigid body rotation is occurring.
Figure 16 displays the norm of the time derivative of the stretch tensor for both center and periphery elements of the specimen, considering different friction coefficients as a function of the process time. As expected under the assumption of rigid body rotation, the analyses conducted during the NLTE process period show values very close to zero for the norm of the time derivative of the stretch tensor. However, it is worth noting that while no strict rigid body rotation is observed in any case, there are instances where values very close to rigid body rotation are observed during specific time intervals. Specifically, these occurrences are observed between 1.5 and 2 s and 3 to 4 s in the simulations.
The NLTE method involves adjustments to the mold’s channel design to mitigate unwanted effects, such as strain reversal and rigid body rotation, typically associated with twist extrusion. Although strict rigid body rotation is not observed in the simulations, there are moments when values closely resembling rigid body rotation occur during specific time intervals within the NLTE process.
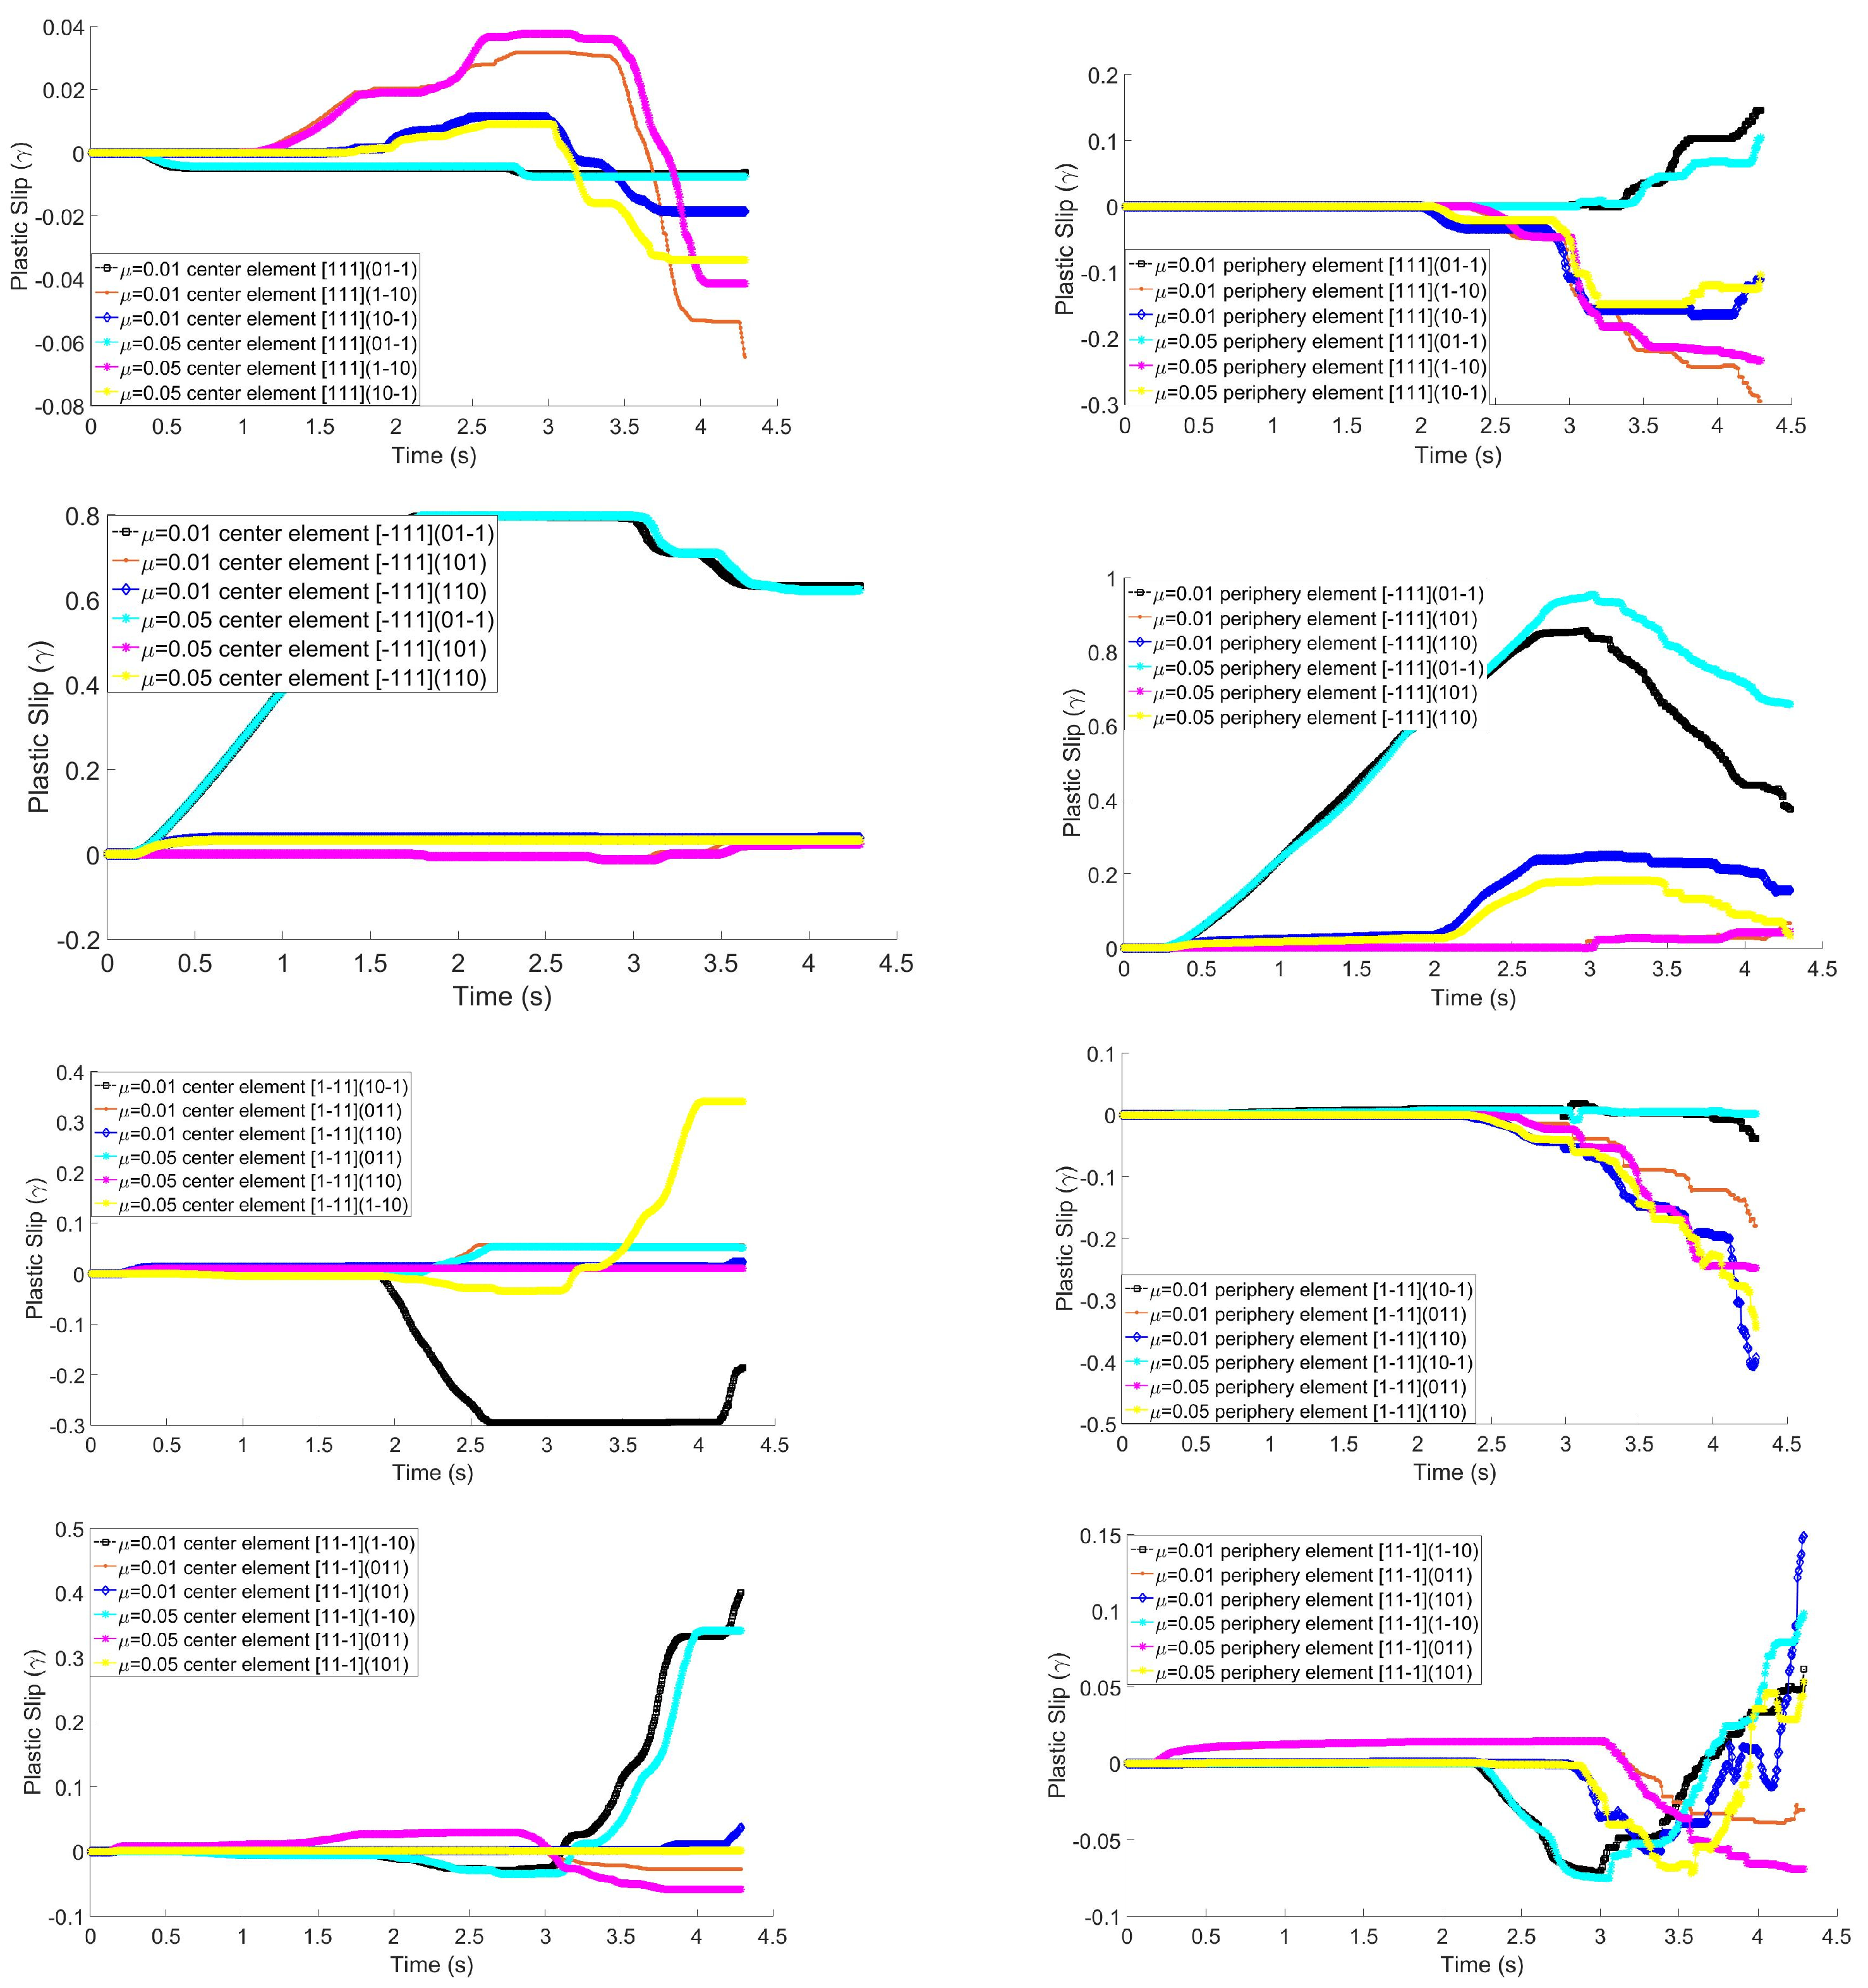
Twelve 111 slip systems contribute to plastic deformation in face-centered cubic metals, such as copper. Figure 17 compares the evolution of plastic slip in all twelve slip systems for two different friction coefficients. This analysis covers both center and periphery elements for each slip system family.
This analysis aims to investigate the strain reversal behavior of a single copper crystal during its initial pass and identify the most active shear systems. The evolution of plastic slip over the NLTE processing time is illustrated in the figure to visually demonstrate this behavior. For both friction coefficients, it is observed that the most active slip system plane and direction for both center and peripheral elements are 111 and <01-1>, respectively.
As the friction coefficient increases, there is a corresponding increase in the strain values for all slip system families. Among the twelve slip systems, the least active shear system for the central element is observed to be the 111 plane.
Notably, instances of shear strain reversal are observed during the NLTE process time. These reversals are noted in the 11-1 and 111 planes between 3 and 3.5 s.
The analysis investigates the behavior of shear strain evolution in all twelve 111 slip systems for different friction coefficients. The results reveal the most active slip systems and demonstrate the occurrence of shear strain reversals during specific time intervals in the NLTE process.
Texture in crystalline materials can often be represented by a combination of discrete texture components along with a random background component. In the case of face-centered cubic (FCC) metals, several essential texture components play a significant role in shaping the overall texture, including the Cube, Brass, Goss, Copper, and S-texture components (Table 5).
For instance, the initial pole figure of the sample can be associated with Shear and Brass texture components (Table 2). After undergoing the NLTE process, both experimental and predicted pole figures indicate that the center and periphery sections of the specimen rotate in the same direction (Table 6). Analyzing the distribution of the 111 planes on 111 pole figures provides a visual representation of how the orientations of the Euler angles have changed in space. The results suggest that reducing the friction coefficient between the mold and the specimen leads to a smaller rotation of the Euler angles for both sections. Conversely, increasing the friction coefficient results in more extensive rotations in orientations for both sections.
By comparing the experimental findings with the CPFEM predictions, the final crystallographic orientation can be described as a combination of S-type and copper-type textures following the NLTE process. The pronounced intensity of the S-type texture indicates that slip is the dominant deformation mechanism during this process.
The comparison of ODF sections obtained from the main FCC texture components is shown in Table 7. Additionally, Table 8 illustrates experimental and CPFEM-predicted Euler angles for the ODF, both before and after the NLTE process, categorized into ODF sections ( ϕ 2 = 0 , 45 , 65 ) for a single copper crystal specimen. The texture spectrum, ranging from zero to fifty, defines the dominance of the center and peripheral elements’ texture components. The initial texture of the sample is characterized by Goss, Brass, Shear, and Copper components, standard rolling textures in FCC metals. The predicted volume fraction distributions of these texture components, along with the corresponding Euler angles, are displayed in Figure 18 and Table 8, respectively. After one pass of the NLTE process, both experimental and CPFEM-predicted results indicate a weakening of the copper texture and an enhancement of the S texture. The severe plastic deformation of the copper specimen results in a weak Copper Cube texture and reduced orientation density values. This suggests the potential occurrence of dynamic recrystallization. The friction coefficient plays a role in the evolution of texture. An increase in friction leads to increased strain and a transition from Goss to Brass textures. More significant deformations result in the formation of Brass and S textures. When comparing different friction coefficients, it is observed that Shear and S textures undergo substantial changes under shear deformation. Higher friction coefficients promote the accumulation of plastic strain and the activation of slip systems during the NLTE process, leading to changes in texture.
In Figure 18, the volume fractions of the main predicted texture components after the NLTE process are displayed, along with quantitative statistics of texture evolution for two different friction coefficients: μ = 0.01 and μ = 0.05 . When the friction coefficient is set to μ = 0.01 , the Brass and S-type texture fractions exhibit a noticeable increase from lower to moderate levels, as shown in Figure 18. A further rise in the coefficient to μ = 0.05 leads to the transformation of the Goss component into Brass texture, accompanied by a reduction in the Shear texture content. Among the main texture components, Brass and Goss show more evident variations, while Copper and Cube remain comparatively stable. Distinct differences in both texture types and their respective fractions are observed between the two friction conditions. The gradual loss of the Shear texture can be attributed to slip-dominated deformation, which shifts its intensity toward the formation of S-type texture.
An increase in the friction coefficient leads to a gradual decline in the Goss-to-Brass volume fraction ratio, which has been linked to lower fracture toughness and reduced resistance to crack initiation and propagation, as documented in earlier investigations [77]. As deformation progresses, the dominant texture gradually shifts from a combination of Copper, Goss, and S-type components toward Brass and S-type textures. This evolution pattern is consistent with the tendencies reported in the literature [78,79,80]. Overall, the changing volume fractions of the texture components highlight the intricate relationship between frictional conditions, plastic strain accumulation, and texture development in single-crystal copper subjected to the NLTE process.

6. Conclusions

In this study, explicit NLTE simulations of single-crystal copper with varying friction coefficients are performed to examine the influence of friction on deformation behavior. The results show that friction affects punch force, rigid-body rotation, shear strain, and microstructural evolution. Texture analysis indicates that increasing the mold–workpiece friction reduces fracture toughness, raises punch force, and promotes a more uniform plastic strain distribution after a single pass. Plastic slip primarily develops at the specimen periphery, while on the (11–1) plane, it is more pronounced at the center, where strain reversals occur during deformation. These reversals coincide with a reduction in the time derivative of stretch values between 3 and 3.5 s, corresponding to a transition toward rigid-body rotation. To minimize this effect, a revised NLTE die design aligns the ellipsoidal twist section with the principal axes of the deformed geometry to enhance stretch and suppress reversals. Comparison between experimental and CPFEM-predicted textures shows good qualitative agreement, with center and periphery elements rotating identically, indicating homogeneous deformation. Minor discrepancies remain, which can be reduced by refining the RVE mesh and lowering punch speed, although these adjustments increase computation time.

Author Contributions

All authors contributed to the study’s conception and design. Ü.Ş. performed the analysis. H.M. performed material preparation and data collection. Ü.Ş. wrote the first draft of the manuscript, and all authors commented on previous versions of the manuscript. T.Y. supervised the study and provided continuous guidance during the preparation of the manuscript. All authors have read and agreed to the published version of the manuscript.

Funding

This research received no external funding.

Data Availability Statement

The original contributions presented in the study are included in the article, further inquiries can be directed to the corresponding authors.

Conflicts of Interest

Author Ülke Şimşek was employed by the company Roketsan Missiles Industries. The author declares that the research was conducted in the absence of any commercial or financial relationships that could be construed as a potential conflict of interest.

References

  1. Burton, M.-T.S.; Hornbuckle, B.C.; Hammond, V.H.; Darling, K.A.; Chan, H.M.; Marvel, C.J.; Harmer, M.P. Enhanced Microstructural Stability and Hardness of Multi-layered Nanocrystalline Nickel Alloys. Met. Mater. Int. 2024, 55, 1338–1350. [Google Scholar] [CrossRef]
  2. Wang, Y.; Li, J.; Li, J.; Chen, S. On the strain delocalization mechanism of Cu/Nb nanolayered composites with amorphous interfacial layers. Int. J. Plast. 2024, 172, 103856. [Google Scholar] [CrossRef]
  3. Al-Abboodi, H.; Al-Bahrani, M.; Al-Tameemi, A.; Al-Baghdadi, S.; Al-Maamori, M. Prediction of Crack Propagation of Nano-Crystalline Coating Made from Fe-Based Amorphous Material. Crystals 2023, 13, 365. [Google Scholar] [CrossRef]
  4. Velilla-Díaz, W.; Zambrano, H.R. Crack Length Effect on the Fracture Behavior of Single-Crystals and Bi-Crystals of Aluminum. Nanomaterials 2021, 11, 2783. [Google Scholar] [CrossRef] [PubMed]
  5. Zhang, Z.; Huang, Q.; Zhou, H. High-entropy alloy nanocrystals with low-angle grain boundary for superb plastic deformability and recoverability. Int. J. Plast. 2023, 167, 103679. [Google Scholar] [CrossRef]
  6. Segal, V.M. Plastic working of metals by simple shear. Russ. Metall. 1981, 2, 99–105. [Google Scholar]
  7. Li, J.; Wang, X.; Zhang, Y.; Liu, Q.; Chen, X. Effect of Multi-Pass Equal-Channel Angular Pressing on the Mechanical and Corrosion Properties of TC4-0.55Fe Alloy. Crystals 2025, 15, 815. [Google Scholar] [CrossRef]
  8. Bridgman, P.W. On torsion combined with compression. J. Appl. Phys. 1943, 14, 274–283. [Google Scholar] [CrossRef]
  9. Kadirov, P.; Zhukova, Y.; Gunderov, D.; Antipina, M.; Teplyakova, T.; Tabachkova, N.; Baranova, A.; Gunderova, S.; Pustov, Y.; Prokoshkin, S. Effect of Accumulative High-Pressure Torsion on Structure and Electrochemical Behavior of Biodegradable Fe-30Mn-5Si (wt.%) Alloy. Crystals 2025, 15, 351. [Google Scholar] [CrossRef]
  10. Tsuji, N.; Saito, Y.; Utsunomiya, H.; Tanigawa, S. Ultra-fine grained bulk steel produced by accumulative roll-bonding (ARB) process. Scr. Mater. 1999, 40, 795–800. [Google Scholar] [CrossRef]
  11. Saito, Y.; Utsunomiya, H.; Tsuji, N.; Sakai, T. Novel ultra-high straining process for bulk materials—development of the accumulative roll-bonding (ARB) process. Scr. Mater. 1999, 47, 579–583. [Google Scholar] [CrossRef]
  12. Obara, C.; Mwema, F.M.; Keraita, J.N.; Shagwira, H.; Obiko, J.O. A multi-response optimization of the multi-directional forging process for aluminium 7075 alloy using grey-based taguchi method. Sn Appl. Sci. 2021, 3, 596. [Google Scholar] [CrossRef]
  13. Djavanroodi, F.; Ebrahimi, M.; Nayfeh, J.F. Tribological and mechanical investigation of multi-directional forged nickel. Sci. Rep. 2019, 9, 241. [Google Scholar] [CrossRef]
  14. Tian, P.; Wang, C.; Nie, K.; Li, Y.; Deng, K. Effect of Multi-Directional Forging on Microstructure and Mechanical Properties of Dual-Phase Mg-8Li-3Al-0.3Si Alloy. Materials 2025, 18, 1829. [Google Scholar] [CrossRef]
  15. Varyukhin, V.; Beygelzimer, Y.; Kulagin, R.; Prokofeva, O.; Reshetov, A. Twist Extrusion: Fundamentals and Applications. Mater. Sci. Forum 2011, 667-669, 31–37. [Google Scholar] [CrossRef]
  16. Beygelzimer, Y.; Prilepo, D.; Kulagin, R.; Grishaev, V.; Abramova, O.; Varyukhin, V.; Kulakov, M. Planar Twist Extrusion versus Twist Extrusion. J. Mater. Process. Technol. 2011, 211, 522–529. [Google Scholar] [CrossRef]
  17. Guan, B.; Xin, Y.; Huang, X.; Liu, C.; Wu, P.; Liu, Q. The mechanism for an orientation dependence of grain boundary strengthening in pure titanium. Int. J. Plast. 2022, 153, 103276. [Google Scholar] [CrossRef]
  18. Chen, T.; Yao, Y.G.; Cai, W.S.; Kang, L.M.; Ke, H.B.; Wen, H.M.; Wang, W.H.; Yang, C. Designing shell-layer-core architecture in Ti-based composites to achieve enhanced strength and plasticity. Int. J. Plast. 2023, 169, 103723. [Google Scholar] [CrossRef]
  19. Duan, Y.; Tang, L.; Xu, G.; Deng, Y.; Yin, Z. Microstructure and mechanical properties of 7005 aluminum alloy processed by room temperature ECAP and subsequent annealing. J. Alloys Compd. 2016, 664, 518–529. [Google Scholar] [CrossRef]
  20. Shen, J.; Gartnerova, V.; Kecskes, L.J.; Kondoh, K.; Jager, A.; Wei, Q. Residual stress and its effect on the mechanical properties of Y-doped Mg alloy fabricated via back-pressure assisted equal channel angular pressing (ECAP-BP). Mater. Sci. Eng. A 2016, 336, 110–117. [Google Scholar] [CrossRef]
  21. Latypov, M.I.; Beygelzimer, Y.; Kim, H.S. Comparative analysis of two twist-based SPD processes: Elliptical cross-section spiral equal-channel extrusion vs. twist Extrusion. Mater. Trans. 2013, 54, 1587–1591. [Google Scholar] [CrossRef]
  22. Valiev, R.; Langdon, T.G. Principles of equal-channel angular pressing as a processing tool for grain refinement. Prog. Mater. Sci. 2006, 51, 881–981. [Google Scholar] [CrossRef]
  23. Maulidi, M.; Miyamoto, H.; Yuasa, M. Grain Refinement of Pure Magnesium Using Nonlinear Twist Extrusion. Mater. Sci. Forum 2018, 939, 54–62. [Google Scholar] [CrossRef]
  24. Choi, H.-H.; Hwang, S.-M.; Kang, Y.; Kim, J.; Kang, B. Comparison of implicit and explicit finite-element methods for the hydroforming process of an automobile lower arm. Int. J. Adv. Manuf. Technol. 2002, 20, 407–413. [Google Scholar] [CrossRef]
  25. Yang, D.; Jung, D.; Song, I.; Yoo, D.; Lee, J. Comparative investigation into implicit, explicit, and iterative implicit/explicit schemes for the simulation of sheet-metal forming processes. J. Mater. Process. Technol. 1995, 50, 39–53. [Google Scholar] [CrossRef]
  26. Noels, L.; Stainier, L.; Ponthot, J.P. Combined implicit/explicit time-integration algorithms for the numerical simulation of sheet metal forming. J. Comput. Appl. Math. 2004, 168, 331–339. [Google Scholar] [CrossRef]
  27. Kutt, L.M.; Pifko, A.B.; Nardiello, J.A.; Papazian, J.M. Slow-dynamic finite element simulation of manufacturing processes. Comput. Struct. 1998, 66, 1–17. [Google Scholar] [CrossRef]
  28. Hu, X.; Wagoner, R.H.; Daehn, G.S.; Ghosh, S. Comparison of explicit and implicit finite element methods in the quasistatic simulation of uniaxial tension. Commun. Numer. Methods Eng. 1994, 10, 993–1003. [Google Scholar] [CrossRef]
  29. Prior, A.M. Applications of implicit and explicit finite element techniques to metal forming. J. Mater. Process. Technol. 1994, 45, 649–656. [Google Scholar] [CrossRef]
  30. Rust, W.; Schweizerhof, K. Finite element limit load analysis of thin-walled structures by ANSYS (implicit), LS-DYNA (explicit) and in combination. Thin-Walled Struct. 2003, 41, 227–244. [Google Scholar] [CrossRef]
  31. Gelin, J.; Boulmane, L.; Boisse, P. Quasi-static implicit and transient explicit analyses of sheet-metal forming using a C0 three-node shell element. J. Mater. Process. Technol. 1995, 50, 54–69. [Google Scholar] [CrossRef]
  32. Soltani, B.; Mattiasson, K.; Samuelsson, A. Implicit and dynamic explicit solutions of blade forging using the finite element method. J. Mater. Process. Technol. 1994, 45, 69–74. [Google Scholar] [CrossRef]
  33. Lindgren, L.; Edberg, J. Explicit versus implicit finite element formulation in simulation of rolling. J. Mater. Process. Technol. 1990, 24, 85–94. [Google Scholar] [CrossRef]
  34. Gavalas, E.E.; Pressas, I.S.; Papaefthymiou, S. Mesh sensitivity analysis on implicit and explicit method for rolling simulation. Int. J. Struct. Integr. 2018, 9, 465–474. [Google Scholar] [CrossRef]
  35. Hardie, C.; Long, D.J.; Demir, E.; Tarleton, E.; Dunne, F.P. A robust and efficient hybrid solver for crystal plasticity. Int. J. Plast. 2023, 170, 103773. [Google Scholar] [CrossRef]
  36. Rihaček, J.; Mrna, L. Comparison of implicit and explicit algorithms of finite element method for the numerical simulation of hydroforming process. MM Sci. J. 2016, 1, 1326–1331. [Google Scholar] [CrossRef]
  37. Taylor, L.; Cao, J.; Karafillis, A.P.; Boyce, M.C. Numerical simulations of sheet-metal forming. J. Mater. Process. Technol. 1995, 50, 168–179. [Google Scholar] [CrossRef]
  38. Sun, J.; Lee, K.; Lee, H. Comparison of implicit and explicit finite element methods for dynamic problems. J. Mater. Process. Technol. 2000, 105, 110–118. [Google Scholar] [CrossRef]
  39. Şimşek, Ü.; Çoğun, C.; Esen, Z. Effects of Electrolytic Copper and Copper Alloy Electrodes on Machining Performance in Electrical Discharge Machining (EDM). Mach. Sci. Technol. 2022, 26, 229–244. [Google Scholar] [CrossRef]
  40. Pantalé, O.; Mahendren, S.R.R.; Dalverny, O. Comparative Analysis of Finite Element Formulations for Simulating Hot Forming of Ti-6Al-4V Aerospace Components. Eng 2024, 5, 881–894. [Google Scholar] [CrossRef]
  41. Turk, T.; Liu, T.; Hung, C.H.; Billo, R.; Park, J.; Leu, M.C. In-situ thermographic monitoring and numerical simulations of laser-foil-printing additive manufacturing. Virtual Phys. Prototyp. 2024, 20, e2440609. [Google Scholar] [CrossRef]
  42. Zhu, H.; Wang, S.; Sheng, M.; Shao, B.; He, Y.; Liu, Z.; Zhou, G. Bridgman Method for Growing Metal Halide Single Crystals: A Review. Inorganics 2025, 13, 53. [Google Scholar] [CrossRef]
  43. Turk, T.; Dominguez, C.E.; Sutton, A.T.; Bernardin, J.D.; Park, J.; Leu, M.C. Spot pattern welding scanning strategy for sensor embedding and residual stress reduction in laser-foil-printing additive manufacturing. Rapid Prototyp. J. 2024, 31, 83–99. [Google Scholar] [CrossRef]
  44. Deng, G.Y.; Lu, C.; Tieu, A.K.; Su, L.H.; Huynh, N.N.; Liu, X.H. Crystal plasticity investigation of friction effect on texture evolution of Al single crystal during ECAP. J. Mater. Sci. 2010, 45, 4711–4717. [Google Scholar] [CrossRef]
  45. Yalçınkaya, T.; Şimşek, Ü.; Miyamoto, H.; Yuasa, M. Numerical Analysis of a New Nonlinear Twist Extrusion Process. Metals 2019, 9, 513. [Google Scholar] [CrossRef]
  46. Fang, N. A new quantitative sensitivity analysis of the flow stress of 18 engineering materials in machining. J. Eng. Mater. Technol. 2005, 127, 192–196. [Google Scholar] [CrossRef]
  47. Hill, R.; Rice, J.R. Constitutive analysis of elastic-plastic crystals at arbitrary strain. J. Mech. Phys. Solids 1972, 20, 401–413. [Google Scholar] [CrossRef]
  48. Asaro, R.J.; Rice, J.R. Strain localization in ductile single crystals. J. Mech. Phys. Solids 1977, 25, 309–338. [Google Scholar] [CrossRef]
  49. Lee, E.H. Elastic-Plastic Deformation at Finite Strains. J. Appl. Mech. 1969, 36, 1–6. [Google Scholar] [CrossRef]
  50. Abaqus Documentation. Solid (continuum) elements. In Theory Manual; Section 14.1.1; Abaqus: Johnston, RI, USA, 2023; pp. 1–2.
  51. Mandel, J. Plasticite Classique et Viscoplasticite; CISM International Centre for Mechanical Sciences; Springer: Berlin/Heidelberg, Germany, 1972. [Google Scholar]
  52. Bennett, K.; Regueiro, R.; Borja, R. Finite strain elastoplasticity considering the Eshelby stress for materials undergoing plastic volume change. Int. J. Plast. 2016, 77, 214–245. [Google Scholar] [CrossRef]
  53. Marin, E. On the Formulation of a Crystal Plasticity Model; Sanda National Laboratories: Albuquerque, NM, USA, 2006; Volume 16, pp. 1–62. [Google Scholar]
  54. Brannon, R.M. A Review of Useful Theorems Involving Proper Orthogonal Matrices Referenced to Three Dimensional Physical Space; Sandia National Laboratories: Albuquerque, NM, USA, 2002; Volume 1, pp. 1–190. [Google Scholar]
  55. Zhang, J.; Liu, Y.; Cheng, Y.; Wang, H.; Sha, A.; Duan, H. Modeling of creep in nickel-based superalloy based on microtwinning mechanism. Int. J. Plast. 2024, 174, 103916. [Google Scholar] [CrossRef]
  56. Hutchinson, J.W. Bounds and self-consistent estimates for creep of polycrystalline materials. Proc. R. Soc. Lond. Ser. A Math. Phys. Eng. Sci. 1976, 348, 101–127. [Google Scholar] [CrossRef]
  57. Şimşek, Ü.; Çoğun, C. An Investigation of the Performance of Equal Channel Angular Pressed Copper Electrodes in Electric Discharge Machining. Crystals 2025, 15, 849. [Google Scholar] [CrossRef]
  58. Kalidindi, S.; Bronkhorst, C.; Anand, L. Crystallographic texture evolution in bulk deformation processing of fcc metals. J. Mech. Phys. Solids 1992, 40, 537–569. [Google Scholar] [CrossRef]
  59. Balasubramanian, S.; Anand, L. Elasto-viscoplastic constitutive equations for polycrystalline fcc materials at low homologous temperatures. J. Mech. Phys. Solids 2002, 50, 101–126. [Google Scholar] [CrossRef]
  60. Bond, W.L. The mathematics of the physical properties of crystals. Bell Syst. Tech. J. 1943, 22, 1–72. [Google Scholar] [CrossRef]
  61. Cowin, S.C. Continuum Mechanics of Anisotropic Materials; Springer: Berlin/Heidelberg, Germany, 2013. [Google Scholar]
  62. Zienkiewicz, O.; Taylor, R.; Fox, D. Chapter 5-Geometrically Nonlinear Problems: Finite Deformation. In The Finite Element Method for Solid and Structural Mechanics, 7th ed.; Zienkiewicz, O., Taylor, R., Fox, D., Eds.; Butterworth-Heinemann: Oxford, UK, 2014; pp. 147–177. [Google Scholar]
  63. Simo, J.C.; Marsden, J.E. On the rotated stress tensor and the material version of the Doyle-Ericksen formula. Arch. Ration. Mech. Anal. 1984, 86, 213–231. [Google Scholar] [CrossRef]
  64. Dunne, F.; Petrinic, N. Introduction to Computational Plasticity, 2nd ed.; Oxford University Press: Oxford, UK, 2006. [Google Scholar]
  65. Takeuchi, T. Work hardening of copper single crystals with multiple glide orientations. Jpn. Inst. Met. Mater. 1975, 16, 629–640. [Google Scholar] [CrossRef]
  66. Kiener, D.; Grosinger, W.; Dehm, G.; Pippan, R. A Further Step towards an Understanding of Size-Dependent Crystal Plasticity: In Situ Tension Experiments of Miniaturized Single-Crystal Copper Samples. Acta Mater. 2008, 56, 580–592. [Google Scholar] [CrossRef]
  67. Şimşek, Ü.; Miyamoto, H.; Yalçınkaya, T. Crystal Plasticity Finite Element Analysis of Linear and Non-Linear Extrusion Processes. Mater. Res. Proc. 2023, 28, 553–562. [Google Scholar] [CrossRef]
  68. Tekoglu, C. Representative volume element calculations under constant stress triaxiality, lode parameter, and shear ratio. Int. J. Solids Struct. 2014, 51, 4544–4553. [Google Scholar] [CrossRef]
  69. Bharani, R.H. Single Crystal Growth of Constantan by Vertical Bridgman Method; Laboratory for Quantum Magnetism: Lausanne, Switzerland, 2011; Volume 1, pp. 1–30. [Google Scholar]
  70. Scheel, H.J.; Capper, P.; Rudolph, P. Crystal Growth Technology: Semiconductors and Dielectrics; John Wiley & Sons: Hoboken, NJ, USA, 2010; Volume 1, pp. 177–178. [Google Scholar]
  71. Şimşek, Ü. Crystal Plasticity Analysis of Severe Plastic Deformation Processes. Ph.D. Thesis, Middle East Technical University, Ankara, Turkey, 2024. [Google Scholar]
  72. Güler, B.; Şimşek, Ü.; Yalçınkaya, T.; Efe, M. Grain-scale investigations of deformation heterogeneities in aluminum alloys. Aip Conf. Proc. 2018, 1960, 170005. [Google Scholar] [CrossRef]
  73. Li, S.; Chen, W.; Kosimov, N.; Bhandari, K.S.; Jung, D. Reduction of Explicit Incremental Forming Simulation Time by Mass Scaling Parameters Adjusting and Symmetrical Setting. Int. J. Technol. Eng. Stud. 2021, 7, 27–34. [Google Scholar] [CrossRef]
  74. Şimşek, Ü.; Davut, K.; Miyamoto, H.; Yalçınkaya, T. Comparison of Linear and Nonlinear Twist Extrusion Processes with Crystal Plasticity Finite Element Analysis. Materials 2024, 17, 1139. [Google Scholar] [CrossRef] [PubMed]
  75. Guan, Y.; Chen, B.; Zou, J.; Britton, T.B.; Jiang, J.; Dunne, F.P.E. Crystal plasticity modelling and HR-DIC measurement of slip activation and strain localization in single and oligo-crystal Ni alloys under fatigue. Int. J. Plast. 2017, 88, 70–88. [Google Scholar] [CrossRef]
  76. Raabe, D.; Roters, F. Using texture components in crystal plasticity finite element simulations. Int. J. Plast. 2004, 20, 339–361. [Google Scholar] [CrossRef]
  77. Zhao, Q.; Liu, Z.; Huang, T.; Xia, P.; Li, F. Enhanced fracture toughness in an annealed Al-Cu-Mg alloy by increasing Goss/Brass texture ratio. Mater. Charact. 2016, 119, 47–54. [Google Scholar] [CrossRef]
  78. Brown, T.L.; Saldana, C.; Murthy, T.G.; Mann, J.B.; Guo, Y.; Allard, L.F.; King, A.H.; Compton, W.D.; Trumble, K.P.; Chandrasekar, S. A study of the interactive effects of strain, strain rate and temperature in severe plastic deformation of copper. Acta Mater. 2009, 57, 5491–5500. [Google Scholar] [CrossRef]
  79. Engler, O. Recrystallisation textures in copper-manganese alloys. Acta Mater. 2001, 49, 1237–1247. [Google Scholar] [CrossRef]
  80. Gurao, N.P.; Sethuraman, S.; Suwas, S. Effect of strain path change on the evolution of texture and microstructure during rolling of copper and nickel. Mater. Sci. Eng. A 2011, 528, 7739–7750. [Google Scholar] [CrossRef]
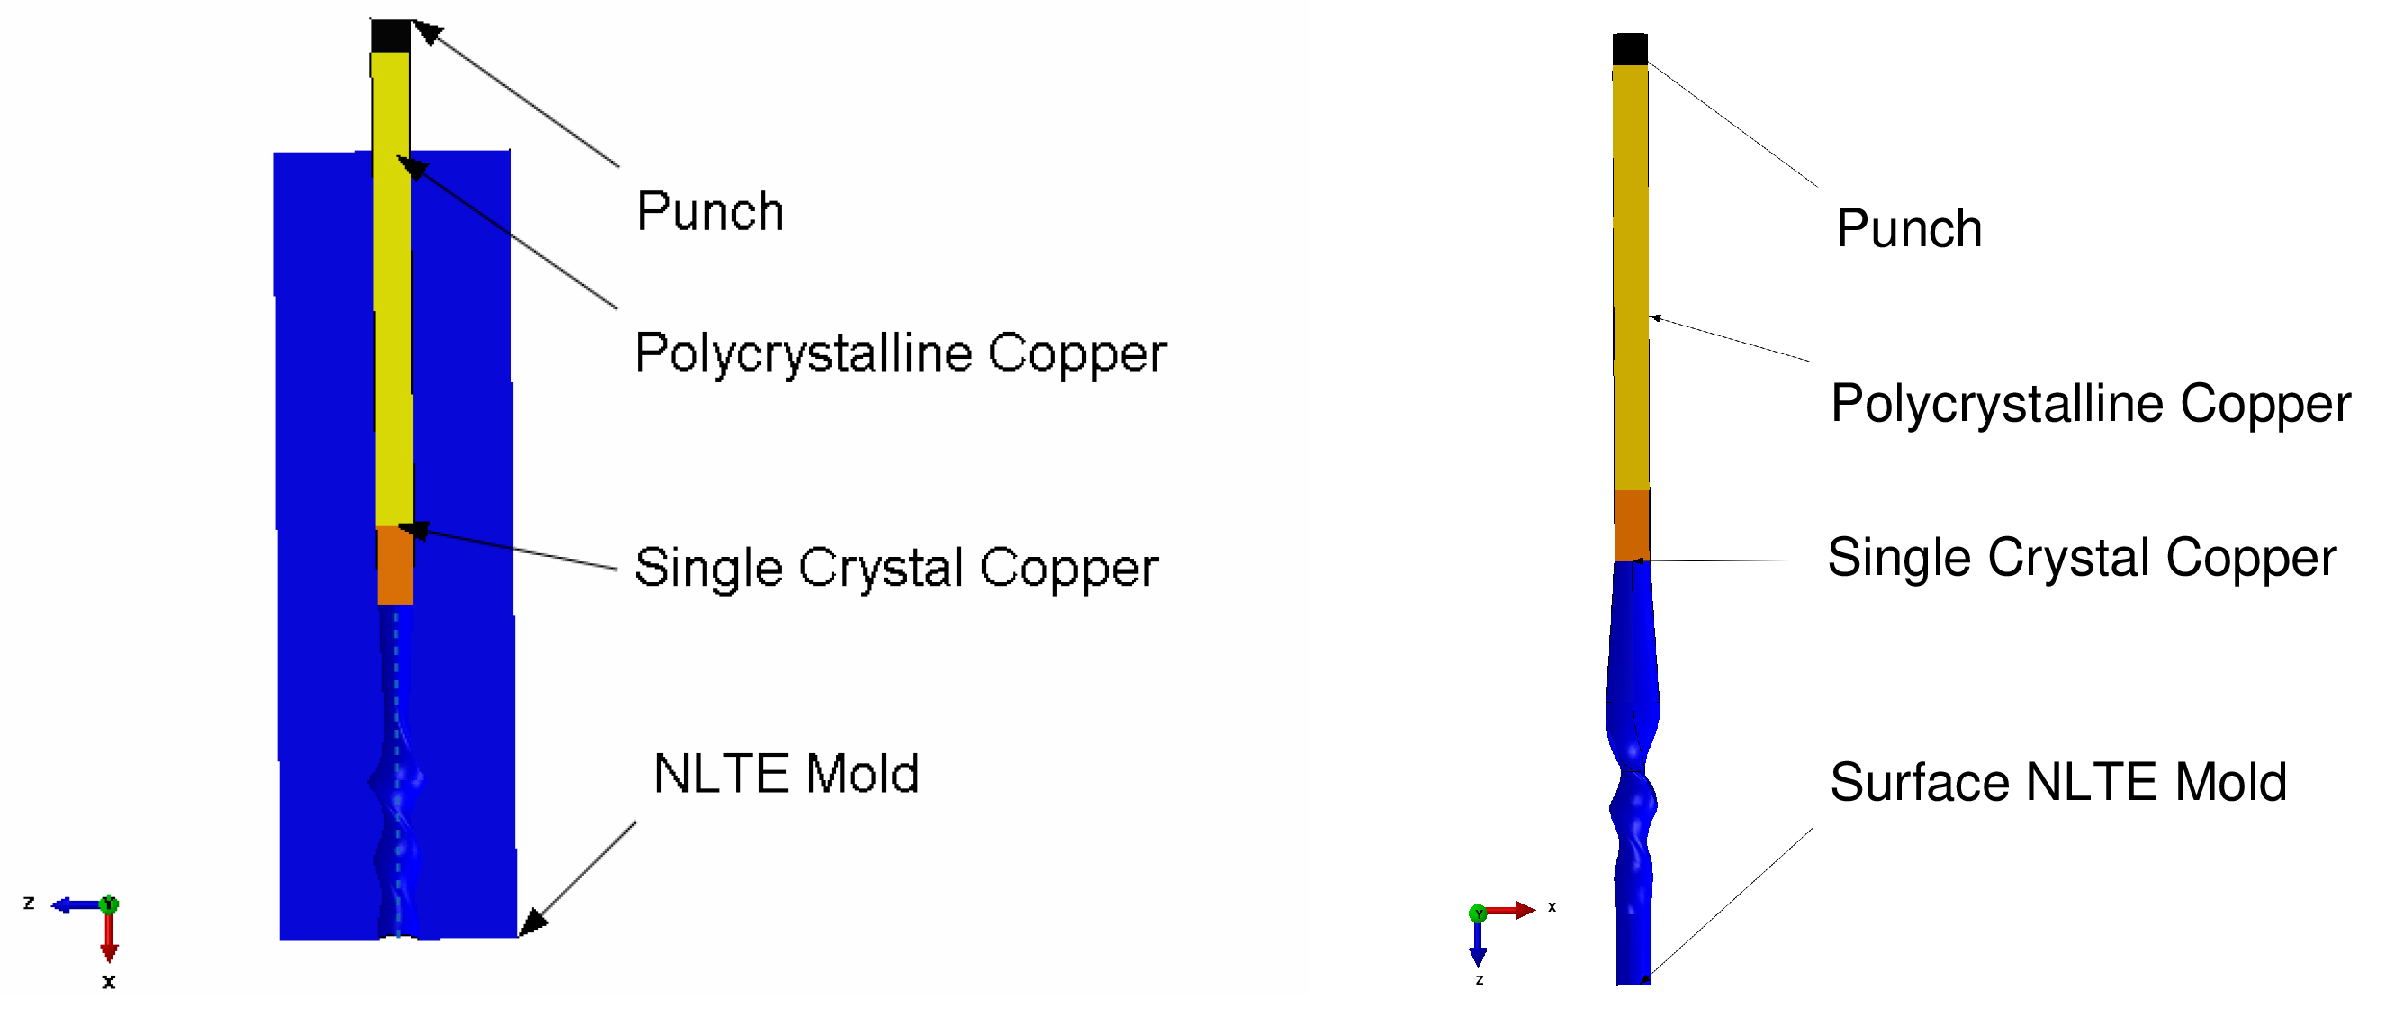
Figure 1. FEA model of NLTE process (Left) and extracted surface model (Right).
Crystals 15 00950 g001
Figure 2. Kinematics of elastic and plastic deformation of single crystals.
Crystals 15 00950 g002
Figure 3. Algorithm of explicit subroutine user-defined material (VUMAT).
Crystals 15 00950 g003
Figure 4. Comparison of the homogenized stress–strain curve with the experimental true stress–strain curve of polycrystal copper [67].
Crystals 15 00950 g004
Figure 5. Boundary conditions applied to the representative volume element (RVE) under axial loading for calibrating CPFEM parameters (left) and 500-grained calibration cube model (right).
Crystals 15 00950 g005
Figure 6. The schematic representation of single-crystal production using the Bridgman method (Left) and the resulting single copper crystal sample (Right).
Crystals 15 00950 g006
Figure 7. Picture of experimental NLTE process and experiment set up (a) Experimet picture after NLTE process, (b) Schematic of the NLTE experimental setup with specimens dimensions and (c) FEM model of experiment after NLTE simulations.
Crystals 15 00950 g007
Figure 8. The schematic representation of experimental procedures.
Crystals 15 00950 g008
Figure 9. Comparison of internal and kinetic energies according to the punch speed 25 mm/s (Left) and 50 mm/s (Right).
Crystals 15 00950 g009
Figure 10. Comparison of punch pressure with respect to friction coefficients ( μ = 0, μ = 0.01, μ = 0.05).
Crystals 15 00950 g010
Figure 11. Von Mises Stress (MPa) distribution on the undeformed view (Left) and section view (Right) for μ = 0.01 friction coefficient.
Crystals 15 00950 g011
Figure 12. Von Mises Stress (MPa) distribution on the undeformed view (Left) and section view (Right) for μ = 0.05 friction coefficient.
Crystals 15 00950 g012
Figure 13. Accumulated plastic strain distribution on undeformed view (Left) and section view (Right) for μ = 0.01 friction coefficient.
Crystals 15 00950 g013
Figure 14. Accumulated plastic strain distribution on undeformed view (Left) and section view (Right) for μ = 0.05 friction coefficient.
Crystals 15 00950 g014
Figure 15. Inspection sections (Left) and elements (Right) of specimen.
Crystals 15 00950 g015
Figure 16. Comparison of rigid body rotation of center and periphery elements concerning friction coefficients ( μ = 0, μ = 0.01, μ = 0.05).
Crystals 15 00950 g016
Figure 17. Plastic slip evolution through NLTE process time according to center element, periphery element, and friction coefficients.
Crystals 15 00950 g017
Figure 18. Main texture components predicted volume fractions after NLTE process according to friction coefficients μ = 0.01 (left) μ = 0.05 (right).
Crystals 15 00950 g018
Table 1. FEM mesh model parameters of simulated NLTE process.
ModelElement TypeElement FamilyElement NumberModel Type
NLTE MoldLinear Tri.-S3R2D Stress60,707Rigid
NLTE PunchExplicit-Hexa-C3D8R3D Stress864Rigid
NLTE SpecimenExplicit-Hexa-C3D8R3D Stress900Deformable (CP)
Table 2. Initial orientations and pole figure of single-crystal copper specimen.
Sample NameInitial Orientation Bunge Euler Angles
( φ 1   ϕ   φ 2 ) and Pole Figures of Initial Orientation
Distribution of [111] Symmetry Planes on
111 Pole Figures
Single copper crystal(110.2) (67.3) (203.5)
Crystals 15 00950 i001Crystals 15 00950 i002
Table 3. Homogenization-based identification of VUMAT parameters for single-crystal Cu.
C11C12C44τcrh0
168,000 MPa121,400 MPa75,400 MPa25 MPa147 MPa
gsat γ ˙ 0 mqa
143 MPa0.001 s−1171.41.75
Table 4. NLTE processes analysis time concerning different punch speeds.
FrameworkProcess SpeedCPU TimeEstimated Completion Time (Days)
VUMAT CP25 mm/s400 h:13 min:50 s17 days
VUMAT CP50 mm/s186 h:48 min:00 s8 days
VUMAT CP300 mm/s33 h:30 min:26 s2 days
Table 5. Main texture components for face-centered cubic (FCC) materials [76].
ComponentDirection φ 1   ϕ   φ 2 Pole Figures of Components
Cube[001]<100>(0) (0) (0)Crystals 15 00950 i003
Goss[011]<100>(0) (45) (0)Crystals 15 00950 i004
Brass[0 1 ¯ 1]<211>(35) (45) (0)Crystals 15 00950 i005
Copper[ 2 ¯ 11]<111>(90) (35) (45)Crystals 15 00950 i006
S[12 3 ¯ ]<634>(60) (32) (65)Crystals 15 00950 i007
Shear Texture[111]<110>(0) (54.74) (45)Crystals 15 00950 i008
Table 6. Experiment and CPFEM results of after NLTE process for one pass final orientations and pole figure of single-crystal copper specimen according to the friction coefficients μ = 0.01 and μ = 0.05.
Sample NameFinal Orientation Represented by Bunge
Euler Angles ( φ 1   ϕ   φ 2 ) and (111) (110) and (100) Pole Figures
Distribution of [111] Symmetry Planes on 111 Pole Figures
Center section experimental Pole Figure(145.183) (85.9) (232.031)
Crystals 15 00950 i009Crystals 15 00950 i010
Periphery section experimental Pole Figure(153.033) (82.3) (229.212)
Crystals 15 00950 i011Crystals 15 00950 i012
Center section FEM-based pole figure predictions μ = 0.01(103.849, 74.0036, 199.886)
Crystals 15 00950 i013Crystals 15 00950 i014
Periphery section FEM-based pole figure predictions μ = 0.01(106.725, 80.8892, 196.131)
Crystals 15 00950 i015Crystals 15 00950 i016
Center section FEM-based pole figure predictions μ = 0.05(101.811, 75.6, 239.707)
Crystals 15 00950 i017Crystals 15 00950 i018
periphery section FEM-based pole figure predictions μ = 0.05(107.428, 84.0542, 240.637)
Crystals 15 00950 i019Crystals 15 00950 i020
Table 7. Comparison of ODF ( 0 , 45 , 65 ) obtained by main face-centered cubic (FCC) texture components.
Sample NameODF Figures of FCC Components ( 0 , 45 , 65 )
Brass ODFCrystals 15 00950 i021
Copper ODFCrystals 15 00950 i022
Goss ODFCrystals 15 00950 i023
Cube ODFCrystals 15 00950 i024
S ODFCrystals 15 00950 i025
Shear ODFCrystals 15 00950 i026
Table 8. Experiment and CPFEM ODF results of after one pass NLTE process for single-crystal copper specimen according to the friction coefficients μ = 0.01 and μ = 0.05.
Sample NameODF Sections of φ 2 = 0 , 45 and 65 Comparing Experiments and Final Orientations
initial ODFCrystals 15 00950 i027
After NLTE process center section experimental ODFCrystals 15 00950 i028
After NLTE process periphery section experimental ODFCrystals 15 00950 i029
Center μ = 0.01 FEM-based ODF predictionsCrystals 15 00950 i030
Periphery μ = 0.01 FEM-based ODF predictionsCrystals 15 00950 i031
Center μ = 0.05 FEM-based ODF predictionsCrystals 15 00950 i032
Periphery μ = 0.05 FEM-based ODF predictionsCrystals 15 00950 i033
Disclaimer/Publisher’s Note: The statements, opinions and data contained in all publications are solely those of the individual author(s) and contributor(s) and not of MDPI and/or the editor(s). MDPI and/or the editor(s) disclaim responsibility for any injury to people or property resulting from any ideas, methods, instructions or products referred to in the content.