Abstract
Understanding the interactions between ionic liquid ions and lithium-metal surfaces is critical for designing safer and more efficient lithium metal batteries. In this work, we use density functional theory to investigate the electronic structure, binding energies, work-function shifts and interfacial charge redistribution of several ionic liquid ions, including FSI−, TFSI−, , , DFOB−, Pyr14+, and EMIM+, on a Li-metal anode (Lim). Absorption orientation-dependent effects are examined for each molecule. Specifically, differences in charge density and electron localization function analyses revealed unique patterns of electron accumulation and delocalization that highlighted specific atomic roles in interfacial bonding. Interfacial charge transfer is analyzed through Bader charges, revealing a moderate charge redistribution for the cations (EMIM+, Pyr14+), and a more significant charge uptake for the reactive anions (FSI−, TFSI−, DFOB−). Among cations, EMIM+ was determined to have the most interfacial stability, while Pyr14+ displayed mid-level reactivity. For the anions, varying tendencies for bond formation with lithium metal and potential fragmentation could be determined. Overall, these discoveries detail an atomistic analysis of ionic liquid to Lim interactions providing additional pathways for molecular design techniques to stabilize electrolytes performing not high-cost computational calculations.
1. Introduction
Lithium-metal batteries (LMB) are considered promising next-generation energy storage systems due to the exceptionally high theoretical specific capacity of lithium metal (3862 mAh g−1) [1,2], they use a lithium metal anode which possesses highly reactive chemistry and an extremely low electrochemical potential. As a result, its anode reacts easily with the electrolyte, initiating chemical interactions upon contact and further electrochemical reactions during charge and discharge, which lead to the formation of an initial SEI layer [3,4]. LMB also had an electrolyte, within the range of available electrolyte systems, ionic liquids (ILs) stand out as one of the most attractive options for achieving safer LMB [5].
Ionic liquids (ILs) are salts that remain in the liquid state and are widely investigated as electrolytes. Their physicochemical properties are strongly influenced by the cation size (tuned through alkyl substitution) and the specific ionic interactions within the system. In general, ILs exhibit desirable features such as negligible vapor pressure, high thermal stability, low toxicity, non-flammability, wide electrochemical windows, and relatively high ionic conductivity [6]. These characteristics make them promising alternatives to conventional flammable organic electrolytes [7]. In the context of lithium rechargeable batteries, ILs offer distinct advantages over conventional organic electrolytes, particularly their intrinsic non-flammability and superior electrochemical stability [8,9,10]. Furthermore, several studies have shown that IL-based electrolytes promote the formation of stable and robust interphases with lithium metal anodes, enhancing both safety and cycling performance [11]. Computational methods provide valuable insights into the behavior of these fluids at nano-scales, regime where direct experimental observation is particularly challenging [12,13,14,15]. Previous theoretical investigations have provided valuable insight into the interactions between ionic species and lithium metal surfaces. In particular, Valencia et al. [16] demonstrated that EMIM–BF4 adsorption induces strong charge redistribution and Li-surface deformation, consistent with the electronic effects analyzed in this work. More recently, Bouder et al. [17] combined DFT and AIMD simulations to study the decomposition of polymer electrolytes containing LiFSI, identifying preferred reduction pathways and the formation of LiF as a key SEI component. Complementarily, Horstmann et al. [18] presented a multiscale perspective linking such atomistic mechanisms to macroscopic strategies for stabilizing lithium morphology through interfacial design. These prior findings help frame the present analysis of ionic liquid adsorption on Li metal surfaces.
In this work we analyze several molecules due to their promising application in LMB. The bis(fluorosulfonyl)imide (FSI−) anion is regarded as a promising healing additive for lithium anodes, as it effectively passivates the metal by generating abundant inorganic species, such as LiF and Li3N, that contribute to restoring the SEI [19,20]. The bis(trifluoromethanesulfonyl)imide TFSI anion has a superior thermal and electrochemical stabilities compared to FSI [21,22,23,24], and in some experiments TFSI improved cycle performance compared to PF6 or FSI [25]. PF6 is a traditional and extensively studied anion to lithium batteries [26], but shows low thermal stability and easily undergoes hydrolysis, generating hydrogen fluoride that degrades the electrode–electrolyte interface and, in turn, impairs the cycling performance of the battery [27]. BF4 offers higher thermal and moisture stability than PF6, improving safety and durability, though its lower conductivity remains a drawback that can be mitigated with suitable additives or solvents [28]. DFOB is commercially available and has proven efficacy as a stabilizing additive in liquid electrolytes for lithium-ion batteries [29,30]. Pyr14 is an electrolyte cation with promising potential for next-generation LMB [31], owing to its excellent thermal stability and safety profile [32]. EMIM is another electrolyte cation, EMIM based ionic liquids are non-flammable and thermally stable up to at least 250 °C, thereby enhancing safety under extreme conditions [32,33], compared to other cations such as Pyr14, EMIM also exhibits superior compatibility with LiTFSI [31,32].
To elucidate the molecular-level factors governing interfacial stability, we systematically examine the adsorption of these cations and anions on a Li-metal (Lim) surface. Using multiple orientations for each molecule, we evaluate charge transfer, electron redistribution (Δρ), and electron localization function (ELF), allowing us to compare the reactivity and stabilization trends among different ionic species (Figure 1). Our analysis reveals that strongly reactive anions such as FSI, TFSI, and DFOB display pronounced and localized electron accumulation at the interface, potentially facilitating bond cleavage and surface reactions, whereas cations such as EMIM+ and Pyr14 interact more diffusely, with EMIM showing the greatest electronic stability. These insights highlight the critical role of both molecular identity and orientation in determining the interfacial behavior of ionic liquids, providing guidance for the rational selection and design of electrolytes in lithium-metal batteries.
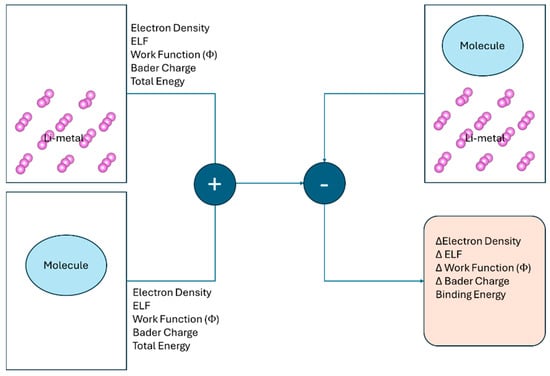
Figure 1.
Schematic illustration of the computational workflow used to investigate the interaction between electrolyte molecules and a Lim surface. First, the combined system consisting of the Lim slab and the adsorbed molecule is computed. Then, the isolated components (the clean Lim slab and the free molecule) are calculated separately.
2. Methodology
2.1. DFT
All ab initio calculations simulations are performed using Quantum Espresso (QE) program developed by P. Giannozzi et al. [34,35,36], under the Born−Oppenheimer approximation [37], The electronic structure was described using the Perdew−Burke−Ernzerhof (PBE) functional [38,39]. All simulation boxes are calculated using periodic boundary conditions (PBC) with a plane wave energy cutoff of 40 Ry and 27 k-points for the k-mesh within a projector-augmented wave approach (PAW) [40]. The initial molecule configurations were optimized with GAMESS [41]. Snapshots of the simulation box are obtained using the graphics program visual molecular dynamics (VMD) [42], the Open Visualization Tool (OVITO) designed for post-processing atomistic data [43], and the Visualization for Electronic and STructural Analysis (VESTA) package [44,45]. All simulations were performed in a periodic box of dimensions 10.28 × 10.28 × 35.04 Å3, containing a Lim slab of 36 atoms and a single molecule; in the present study, we examined seven different molecules (PF6, BF4, FSI, TFSI, DFOB, EMIM, and PYR14), optimizing multiple orientations of each molecule as it approached the Lim surface (Figure 2).
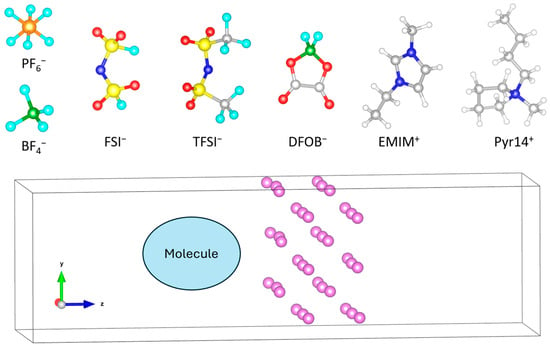
Figure 2.
Simulation setup showing a periodic box of dimensions 10.28 × 10.28 × 35.04 Å3, containing a Lim slab of 36 atoms and one molecule. Seven molecules (PF6, BF4, FSI, TFSI, DFOB, EMIM, and PYR14) were tested, with multiple orientations of each optimized as they approached the Lim surface.
2.2. Binding Energy
The binding energy between the Lim surface and the ionic liquid electrolyte was calculated from the total energies obtained after structural relaxations followed by a single point self-consistent field (SCF) calculations in QE. The binding energy was defined as:
where is the binding energy, is the total energy of the total relaxed Lim/electrolyte interphase, and are the total energies of the Lim and electrolyte subsystems in the same supercell, extracted from the fully relaxed interface geometry, rather than independently relaxed structures. A more negative binding energy indicates a stronger interaction.
2.3. Electron Charge Density
The electron charge density difference (Δρ) was computed from the charge densities obtained in the QE calculations. This quantity provides insight into the redistribution of electrons upon eventual interface formation. Regions of electron accumulation and depletion were visualized by subtracting the electron densities of the isolated Lim and electrolyte subsystems from that of the combined interphase. Accumulation indicates charge transfer toward the interphase, whereas depletion corresponds to electron loss.
2.4. Bader Charge Analysis
The charge distribution was analyzed using the Bader partitioning scheme of the electron density according to the zero-flux surfaces in the charge density [46]. The analysis was performed with the code developed by Henkelman et al. [47].
2.5. Electron Localization Function
The electron localization function (ELF) was computed from the charge densities obtained in the QE simulations. ELF is a dimensionless measure of electron localization: values close to 1 indicate strong localization (e.g., covalent bonds or lone pairs), whereas values near 0.5 correspond to delocalized, metallic-like states. Differences in ELF between Lim, the ionic liquid, and their interphase were analyzed to assess bonding and charge redistribution. The ELF difference is directly analogous to charge density difference maps, but instead of tracking charge accumulation/depletion, you track how localization vs. delocalization of electrons is modified upon bonding.
2.6. Work-Function Change
We use work-function changes to diagnose a potential electron transfer that might populate antibonding states and drive dissociation. For each calculation, molecule and Lim slab, we take the planar-averaged electrostatic potential along the z axis, Vads(z). Additionally, we run a single point calculation by removing the molecule to get the planar-averaged electrostatic potential of just the Lim slab along the z axis, VLi(z). For both cases, we read off the flat vacuum level far from adsorbate/Lim: Vvac,ads and Vvac,Li. Then, we compute both work functions as follows:
where and correspond to the Fermi energy level of the Lim and molecule + Lim samples, respectively. The work-function shift is then calculated as follows:
where a value of < 0 would indicate a charge accumulation on the vacuum/adsorbate side (metal → molecule donation) and a value of > 0 would indicate charge depletion on the vacuum side (molecule → metal donation).
3. Results
We quantify the interfacial charge transfer, binding energies, electron localization function (ELF), and electrostatic-potential analysis for a set of five counter-ions and two anions interacting with a Lim anode. For each molecule, we test multiple orientations given the different planes of symmetry of each molecule, allowing us to study orientation-dependent trends in adsorption strength and charge redistribution. These orientation scans reveal configurations that promote bond weakening and potential dissociation at the interface, thereby clarifying how molecular approach geometry governs stability and reaction propensity on Lim surface.
3.1. Hexafluorophosphate Anion ()
For PF6, given its symmetry, only one stable adsorption geometry is identified, in which atoms F2, F4, and F5 are located at bonding distance from the Lim surface. To gain insight into the interfacial electronic interactions, we first analyze the charge density difference maps (Δρ), which highlight the redistribution of electrons upon adsorption. In these maps, positive values (blue regions) indicate electron accumulation, whereas negative values (red regions) denote electron depletion. We observe pronounced electron accumulation between F2, F4, and F5 and the Li atoms, consistent with the formation of interfacial bonding interactions and enhanced local electron density near the adsorption sites (Figure 3a). The ΔELF reveals a pronounced negative value at the interphase, indicating that the fluorine–lithium interactions have a significant degree of electron delocalization, which may influence the interfacial stability. Notably, is known to dissociate on Lim surfaces, releasing LiF and phosphorus-containing fragments, in agreement with the electronic features observed here [48].
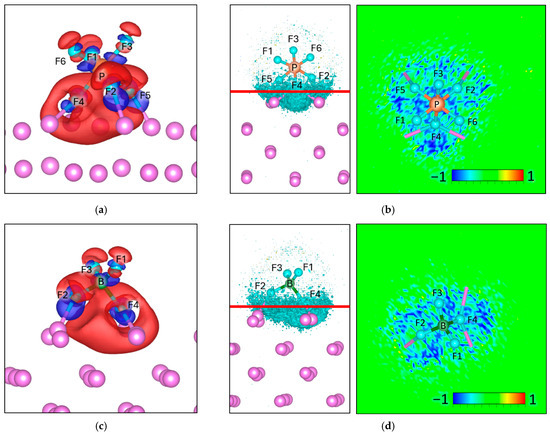
Figure 3.
Charge density difference (Δρ) maps for (a) and (c) , with corresponding electron localization function difference (ΔELF) maps for (b) , (d) , on a Lim slab. For charge density the negative values (Δρ < 0) are colored red and correspond to −0.002 e/volume, and the positive values (Δρ > 0) are colored blue and correspond to +0.002 e/volume. For ΔELF, the cyan surface on the left picture corresponds to a value of −0.8, and the red line corresponds to the plane from where the ΔELF 2D map is calculated.
Bader charge analysis is consistent with these observations, the net charge of decreases from −1.00 in isolation to −1.37 upon adsorption, corresponding to an interfacial charge transfer of −0.37 e. This excess charge is primarily localized on the fluorine atoms (Figure 3b) directly interacting with the Lim surface (Table 1).

Table 1.
Bader charge analysis of each atom in the PF6 molecule as a function of attack orientation on the Lim surface.
3.2. Tetrafluoroborate Anion ()
Similarly to , only has one adsorption geometry due to its symmetry. In the optimized adsorption geometry atoms F2 and F4 approach the Lim surface at bonding distance. The charge density difference maps (Δρ) reveal electron accumulation between these fluorine atoms and the Li sites, indicating the formation of interfacial bonding interactions and an increase in local electron density at the adsorption region (Figure 3c). The ΔELF shows a pronounced negative value at the interphase (Figure 3d), indicating strong fluorine–lithium interactions and significant electron delocalization, similar to the behavior observed for . These features suggest high reactivity at the Lim surface. Consistent with our results, previous studies have reported that readily dissociates in contact with Lim, producing LiF as a dominant decomposition product together with boron-containing species [49].
Bader charge analysis indicates that the net charge of decreases from −1.00 in isolation to −1.28 upon adsorption, corresponding to an interfacial charge transfer of −0.28 e. This additional charge is mainly accommodated by the fluorine atoms directly interacting with the Lim surface (Table 2).

Table 2.
Bader charge analysis of each atom in the BF4 molecule as a function of attack orientation on the Lim surface.
3.3. Bis(fluorosulfonyl)imide Anion (FSI)
As FSI approaches a Lim surface, it stabilizes into three optimized geometries near the metal surface, which we designate as the 3O Attack, 2O–F Attack, and 2F Attack orientations due to the atoms that are in direct contact with the Lim. In the 3O Attack configuration, a nearly uniform electron accumulation is observed along the three interfacial bonds, O2–Lim, O3–Lim, and O4–Lim. Correspondingly, regions of electron depletion are localized around the S atoms, consistent with charge withdrawal from the central group (Figure 4a). Regarding the ΔELF, the three O–Lim bonds exhibit similar surface area. As a result, no preferential bond weakening or dissociation pathway can be identified, since ΔELF is distributed nearly uniformly among the three oxygen–lithium interactions (Figure 4b).
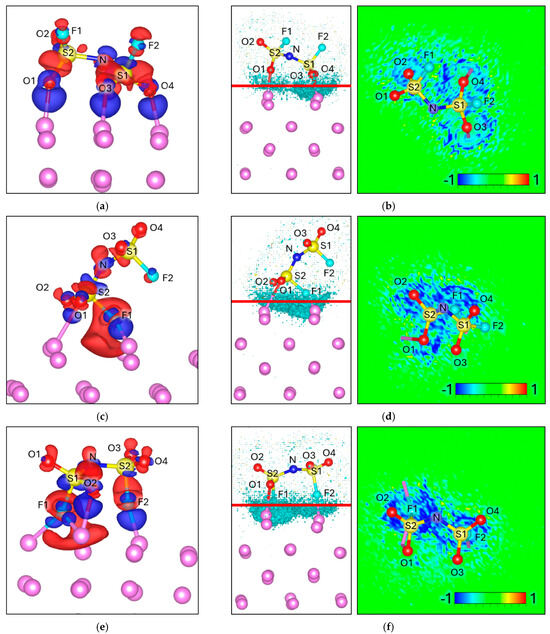
Figure 4.
Charge density difference (Δρ) maps for (a) 3O Attack, (c) 2O–F Attack, and (e) 2F Attack. Corresponding electron localization function difference (ΔELF) maps for (b) 3O Attack, (d) 2O-F Attack, and (f) 2F Attack. For charge density the negative values (Δρ < 0) are colored red and correspond to −0.002 e/volume, and the positive values (Δρ > 0) are colored blue and correspond to +0.002 e/volume. For ΔELF, the cyan surface on the left picture corresponds to a value of −0.8, and the red line corresponds to the plane from where the ΔELF 2D map is calculated.
In the 2O–F Attack geometry, the largest electron accumulation occurs at the F1–Lim bond, followed by a secondary accumulation at the O2–Lim bond. This suggests that fluorine plays a dominant role in the interfacial electron transfer under this configuration (Figure 4c). It is important to note that this analysis was not performed on the fully relaxed structure but on a geometry where the F–Li bond length was constrained below 1.8 Å, after which the system was considered dissociated. Under these conditions, fluorine is the atom that dissociates, while charge analysis shows that the sulfur atom is the actual source of charge redistribution. Similarly, he ΔELF also reveals a more pronounced negative value in the F1–Lim bond compared to the O2–Lim bond suggesting that the fluorine–lithium interaction experiences a greater degree of electron delocalization, which could influence its relative stability (Figure 4d).
In the 2F Attack configuration, the largest electron accumulation is observed at the F2–Lim bond, as well as at the O2–Lim bond. Additionally, the F1–Lim interaction exhibits a smaller electron accumulation, which is split into two distinct bonding regions, indicating a weaker and more delocalized interaction (Figure 4e). As in the 2O–F case, the interpretation is based on a constrained geometry with F–Li distances shorter than 1.8 Å. Beyond this threshold, the system is considered dissociated, with fluorine detaching and sulfur acting as the charge donor. The presence of a direct S–F bond in FSI facilitates this charge transfer and promotes F dissociation. In contrast, in TFSI the S atom is connected to F through an intermediate C (S–C–F), which hinders charge transfer from sulfur and prevents fluorine from dissociating as easily. Regarding the ΔELF (Figure 4f), in the 2F Attack configuration, is more localized in the F1–Lim bond. This effect is likely associated with the fact that F1 is forming two bonds with the Lim, in contrast to F2, which interacts through a single Li bond. The greater ΔELF difference at F1–Lim might highlight a stronger electron redistribution associated with its multiple bonding environment.
Bader charge analysis (Table 3) corroborates these observations. The total charge of FSI decreases from −1.00 in the isolated state to −1.31 in both the 3O and 2O–F configurations, and further to −1.40 in the 2F configuration, confirming significant interfacial charge transfer. The largest variations occur at the fluorine atoms: for example, F1 becomes much less negative upon adsorption, changing from −1.03 in isolation to −1.09 in the 3O configuration, and from −0.63 to −0.74 in the 2O–F orientation, and from −0.61 to −0.75 in the 2F orientation. F2 also shows systematic changes, decreasing from −1.04 in isolation to −1.06 in the 3O, −1.05 in the 2O–F, and −0.98 to −1.05 in the 2F configuration. In contrast, both sulfur atoms remain nearly unchanged: S1 is constant across all orientations, while S2 varies only slightly (–0.002 to −0.003 e in 3O and 2O–F, and a small increase of +0.016 e in 2F). These trends confirm that fluorine atoms, rather than sulfur, directly accommodate most of the redistributed charge at the Lim interface.

Table 3.
Bader charge analysis of each atom in the FSI molecule as a function of attack orientation on the Lim surface.
3.4. Bis(trifluoromethanesulfonyl)imide Anion (TFSI)
For TFSI, all optimized orientations exhibit strong interfacial interactions, as evidenced by the intense ΔELF signal localized at the Li–anion interface. In the FO Attack geometry, electron accumulation appears between the F1–Lim and O2–Lim bonds (Figure 5a), with the ELF more concentrated around O2 (Figure 5b). Bader charge analysis confirms this trend: O2 becomes more negative (−1.97 vs. −1.90 in isolation), while F1 shows a moderate charge decrease (−0.90 vs. −0.87), and the total charge of the anion increases to −1.19 (Table 4).
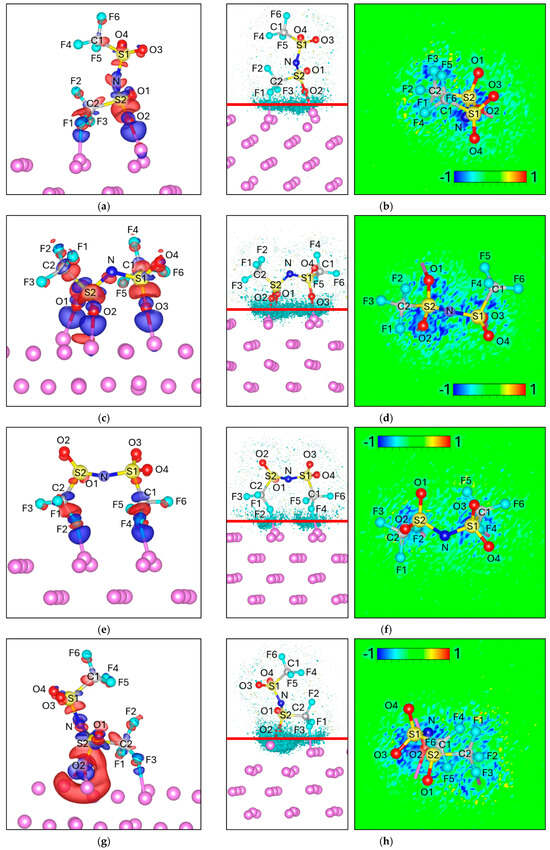
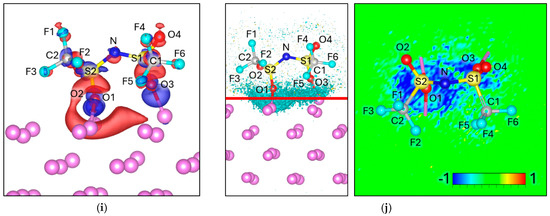
Figure 5.
Charge density difference (Δρ) maps for (a) FO Attack, (c) 3O Attack, (e) 2F Attack, (g) F-2O Attack, and (i) 2O Attack. Corresponding electron localization function difference (ΔELF) maps for (b) 3O Attack, (d) 2F Attack, (f) 2F Attack, and (h) F-2O Attack and (j) 2O Attack. For charge density the negative values (Δρ < 0) are colored red and correspond to −0.002 e/volume, and the positive values (Δρ > 0) are colored blue and correspond to +0.002 e/volume. For ΔELF, the cyan surface on the left picture corresponds to a value of −0.8, and the red line corresponds to the plane from where the ΔELF 2D map is calculated.

Table 4.
Bader charge analysis of each atom in the TFSI molecule as a function of attack orientation on the Lim surface.
In the 3O Attack configuration, the charge redistribution is more delocalized, with three equivalent O–Lim bonds (O1, O2, O3) showing uniform electron accumulation (Figure 5c). The ELF map reflects this symmetry, displaying an extended interfacial region without a preferential bond (Figure 5d). Consistent with this, Bader analysis shows similar negative shifts for O1–O3 (≈ −0.05 to −0.07 e each), and the total charge transfer is larger (−1.36 vs. −1.00).
In the 2F Attack, electron accumulation is localized between F2–Lim and F4–Lim (Figure 5e). However, the ELF is less intense and more diffuse than in the oxygen-based configurations (Figure 5f). This is in agreement with the charge analysis, where F2 (−0.86 vs. −0.81) and F4 (−0.90 vs. −0.89) become more negative, but the overall transfer is moderate (−1.21 total).
In the F–2O Attack, strong accumulation is observed at O2–Lim, accompanied by a smaller contribution from F3–Lim. The ELF is clearly localized at O2, while Δρ depletion regions (red) appear along S2–O2, suggesting bond weakening. This is reflected in the charge analysis: O2 becomes significantly more negative (−1.99 vs. −1.87), while S2 becomes slightly less positive (+5.00 vs. +5.02). The total charge reaches −1.31.
Finally, in the 2O Attack, electron accumulation is intense at O1–Lim and O3–Lim, with ΔELF values even stronger than in the 3O case. Notably, Δρ depletion is concentrated between S2–O1, pointing to a destabilization pathway. Bader analysis supports this picture: O1 and O3 both become substantially more negative (−1.98 vs. −1.91, and −1.96 vs. −1.92), while S1 and S2 are partially oxidized (+4.92 vs. +4.99 and +4.88 vs. +4.95, respectively). This configuration also shows the largest total charge transfer (−1.42 vs. −1.00).
Together, these results show that while fluorine atoms can contribute to interfacial bonding in certain orientations, oxygen atoms dominate the electron redistribution in TFSI. This contrasts with FSI, where direct S–F bonding facilitates fluorine dissociation; in TFSI, the intervening S–C–F motif hinders charge transfer from sulfur to fluorine, stabilizing the anion against dissociation at the Lim interface.
3.5. Difluoro(oxalato)borate Anion (DFOB)
When DFOB approaches the Lim surface, three distinct adsorption geometries are stabilized, which we designate as the 2F Attack, 2O Attack, and F2O2 Attack orientations. To probe the electronic interactions at the interface, we analyze both the electron redistribution and the Bader charge evolution upon adsorption.
In the 2F Attack configuration, the net charge of the anion decreases from −1.00 in isolation to −1.19 upon adsorption, corresponding to an interfacial charge transfer of −0.19 e. The Δρ maps show distinct electron accumulation between F1–Lim and F2–Lim (Figure 6a), indicating that both fluorine atoms act as primary anchoring sites to the Lim surface. Simultaneously, electron depletion is observed along the B–F1 and B–F2 bonds, reflecting charge withdrawal from these covalent linkages. Additionally, weaker contributions arise from the oxygen atoms within the oxalate groups. Overall, this redistribution suggests strong F-Li binding accompanied by partial weakening of the B–F bonds, but without evidence of complete fragmentation at the interface.
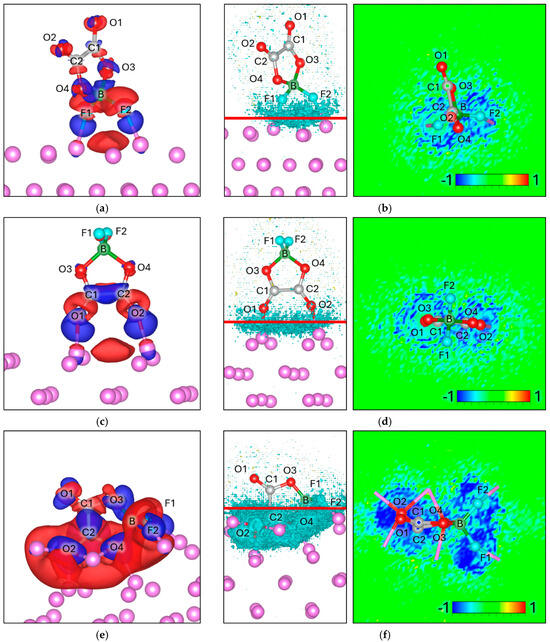
Figure 6.
Charge density difference (Δρ) maps for (a) 2F Attack, (c) 2O Attack, and (e) 2F–2O Attack. Corresponding electron localization function difference (ΔELF) maps for (b) 2F Attack, (d) 2O Attack, and (f) 2F–2O Attack. For charge density the negative values (Δρ < 0) are colored red and correspond to −0.002 e/volume, and the positive values (Δρ > 0) are colored blue and correspond to +0.002 e/volume. For ΔELF, the cyan surface on the left picture corresponds to a value of −0.8, and the red line corresponds to the plane from where the ΔELF 2D map is calculated.
In the 2O Attack configuration, the net charge of the anion decreases from −1.00 in isolation to −1.39 upon adsorption, corresponding to a transfer of −0.39 e. The redistribution is primarily localized on the interfacial oxygen atoms, which gain most of the additional negative charge. This indicates that oxygen plays the dominant role in interfacial charge transfer, in contrast to the 2F Attack case, where fluorine is the main acceptor. Charge density maps show electron accumulation at O1–Lim and O2–Lim contacts, depletion along C1–O1 and C2–O2 bonds, and an additional accumulation at the C1–C2 bond, suggesting redistribution of density lost from the C–O bonds (Figure 6c). Regarding the ΔELF, the 2O Attack shows a noticeably more delocalized distribution across multiple O–Li contacts (Figure 6d), suggesting a broader and more distributed bonding environment. By contrast, in the 2F Attack the ΔELF is tightly localized and centered at the F–Lim bonding region, indicating stronger but more localized electron accumulation (Figure 6b). These differences imply distinct bonding character: the 2F orientation favors concentrated F–Li interactions, whereas the 2O orientation produces a more distributed O–Lim environment that could promote alternative reaction pathways at the interface.
Notably the F2O2 Attack orientation leads to an intense charge transfer, decreasing to −3.15 e, given a transfer of −2.15 e from the Lim surface. This unusually high charge accumulation is reflected in the charge density (Figure 6e) and ΔELF maps (Figure 6f), both of which show very intense and extensive features, consistent with the magnitude of the electronic rearrangement. The redistribution is particularly pronounced on C2 and O4 atoms (Table 5). Such behavior suggests a highly reactive adsorption pathway, likely involving partial bond cleavage and the formation of new Lim–O or Lim–F interactions at the interface.

Table 5.
Bader charge analysis of each atom in the DFOB molecule as a function of attack orientation on the Lim surface.
Overall, Bader charge analysis demonstrates that while the 2F and 2O orientations exhibit moderate charge transfer, the F2O2 geometry is associated with extreme reactivity and destabilization. These results highlight the strong electron-accepting character of DFOB at Lim surfaces, with certain attack modes producing interfacial states far more reactive than those observed for or .
3.6. 1-Ethyl-3-methylimidazolium Cation (EMIM)
For EMIM+, four distinct adsorption geometries were evaluated. In all cases, the ΔELF maps display broad but diffuse electron accumulation at the EMIM–Lim interface, without clear localization on specific bonds. A weak depletion is observed around certain C–H groups oriented toward the surface, but the magnitude is minor compared to the strong interfacial features seen for the anions. Overall, the ΔELF analysis indicates the absence of bond cleavage or localized charge-driven destabilization, in sharp contrast with the anionic species (Figure 7).
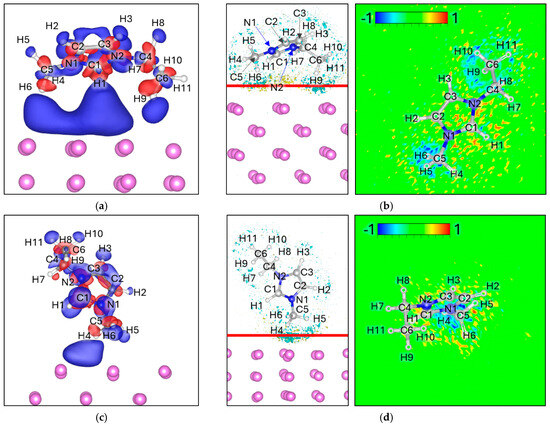
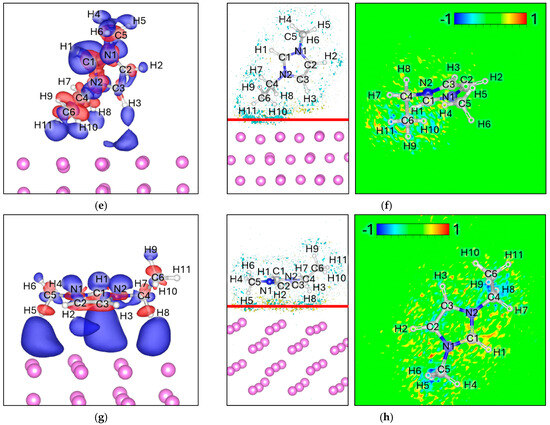
Figure 7.
Charge density difference (Δρ) maps for (a) 2H attack, (c) 3H attack, (e) 4H Attack, and (g) 6H Attack. Corresponding electron localization function difference (ΔELF) maps for (b) 2H Attack, (d) 3H Attack, (f) 4H Attack, and (h) 6H Attack. For charge density the negative values (Δρ < 0) are colored red and correspond to −0.0005 e/volume, and the positive values (Δρ > 0) are colored blue and correspond to +0.0005 e/volume. For ΔELF, the cyan surface on the left picture corresponds to a value of −0.8, the yellow surface corresponds to a value of 0.8, and the red line corresponds to the plane from where the ΔELF 2D map is calculated.
Bader charge analysis indicates a noticeable charge redistribution: the net charge of EMIM+ decreases from +1.00 in isolation to values between +0.45 and +0.53 upon adsorption (Table 6). This partial charge neutralization suggests that, while the cation remains structurally intact, it undergoes significant electronic stabilization at the Lim surface.

Table 6.
Bader charge analysis of each atom in the EMIM molecule as a function of attack orientation on the Lim surface.
3.7. N-Butyl-N-methylpyrrolidinium (Pyr14)
When Pyr14 approaches the Lim surface, four distinct adsorption geometries are stabilized, which we designate as: 4H Attack, 2H Attack, 3H Attack, and 5H Attack orientations. To probe the electronic interactions at the interface, we analyze both the electron redistribution and the Bader charge evolution upon adsorption.
The Δρ maps show electron accumulation (blue) spread broadly over the Lim surface, without being strongly localized on any specific atom or bond, indicating diffuse interfacial charge redistribution (Figure 8a,c,e,g). In contrast, the ΔELF maps reveal modest electron delocalization concentrated near the hydrogen atoms closest to the Li surface (Figure 8b,d,f,h); H2, H5, H9, H11 in 4H Attack; H16, H19 in 2H Attack; H3, H6, H7 in 3H Attack; and H8, H9, H10, H18, H20 in 5H Attack; reflecting weak but discernible bonding interactions. Overall, the ΔELF intensity is moderate: larger than in EMIM+ but smaller than in strongly reactive anions such as DFOB, TFSI, or FSI, and not strongly concentrated on any specific bond or atom, reflecting the overall delocalized interfacial interactions. Bader charge analysis indicates that the net charge of Pyr14 decreases from +1.00 in isolation to values between +0.47 and +0.55 upon adsorption (Table 7). This partial charge neutralization suggests that, while the cation remains structurally intact, it undergoes significant electronic stabilization at the Lim surface without evidence of bond cleavage or chemical fragmentation.
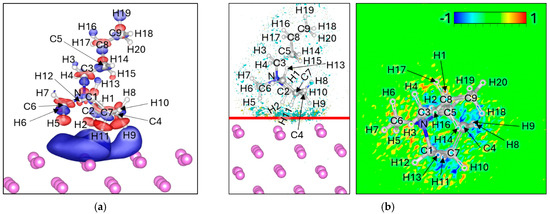
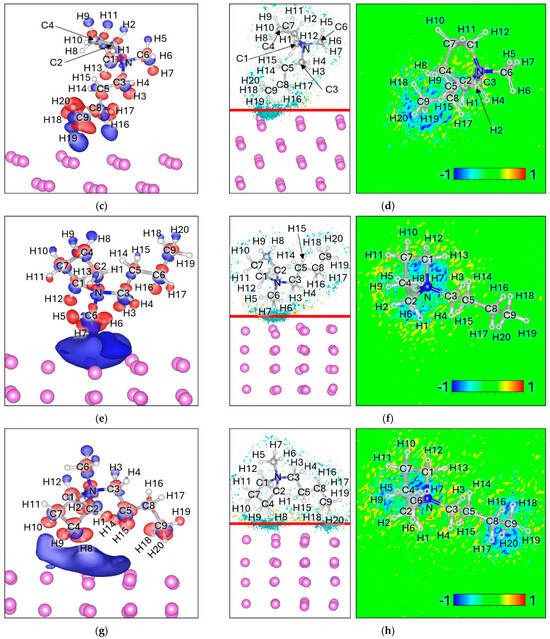
Figure 8.
Charge density difference (Δρ) maps for (a) 4H Attack, (c) 2H Attack, (e) 3H attack, and (g) 5H Attack. Corresponding electron localization function difference (ΔELF) maps for (b) 4H Attack, (d) 2H Attack, (f) 3H attack, and (h) 5H Attack. For charge density the negative values (Δρ < 0) are colored red and correspond to −0.0005 e/volume, and the positive values (Δρ > 0) are colored blue and correspond to +0.0005 e/volume. For ΔELF, the cyan surface on the left picture corresponds to a value of −0.8, the yellow surface corresponds to a value of 0.8, and the red line corresponds to the plane from where the ΔELF 2D map is calculated.

Table 7.
Bader charge analysis of each atom in the Pyr14 molecule as a function of attack orientations on the Lim surface.
Overall, Pyr14 exhibits moderate, distributed interfacial interactions: the cation is stabilized on the Lim surface via diffuse electrostatic interactions, with minor localized charge depletion at hydrogens near the interface, and no signs of reactive decomposition. This behavior places Pyr14 between EMIM+ and strongly reactive anions in terms of interfacial electron redistribution and ELF intensity, reflecting its relative stability at Lim interfaces.
3.8. Adsorption Metrics Analysis
For and , both known to decompose in contact with Lim surface, the calculated adsorption metrics are consistent with activated molecular precursors to dissociation. The 3F Attack orientations bind strongly (2.15 eV for and 2.35 eV for ) and induce large work-function decreases (−2.39 eV for and −2.41 eV for ), evidencing substantial interfacial electronic coupling. Net electron uptake by the anions is appreciable, showing a charge transfer (−0.371 e for and −0.282 e for ), which points to stronger population of anti-bonding states on P–F and B–F, enhancing driving force for Li–F formation and subsequent fragmentation. Taken together, the strong adsorption, significant ΔΦ shifts, and orientation that places F directly over Li are all consistent with facile, kinetically accessible dissociation on the highly reducing Li surface.
For the FSI, the calculated binding energies (1.38 to 2.09 eV) and modest charge transfer values (0.31 to 0.40 e) suggest that the FSI initially adsorbs in a molecular form but becomes electronically activated upon interaction with Lim surface. In particular, the 2F Attack orientation shows the highest charge transfer, consistent with the weakening of S–F bonds and an increased tendency toward dissociation among the three optimized orientation. Additionally, the similar ΔΦ values (~−1.86 eV) across all orientations indicate that a significant electron redistribution occurs at the interface facilitating bond cleavage.
For the TFSI, the binding energies vary notably among orientations, ranging from 0.62 eV for the 2F Attack to 2.09 eV for the 3O Attack, indicating that the nature of adsorption interaction highly depends on the orientation. The strong adsorption observed for the 3O Attack (2.09 eV) and 2O Attack (1.91 eV) orientations, coupled with significant charge transfer values (−0.358 e and −0.419 e, respectively), suggests strong electronic coupling and substantial charge redistribution at the interface with the Lim surface. The molecular charge in these configurations becomes markedly more negative compared to others, reflecting enhanced electron uptake from the Lim surface and weakening S–O bonds. Additionally, the work function decreases are pronounced (ΔΦ = −2.07 eV), especially for the strongly bound configurations, supporting the idea of considerable interfacial electronic interaction.
For DFOB, the 2F Attack and 2O Attack orientations exhibit moderate binding (1.47 eV and 2.02 eV) and limited electron transfer (Δq ≈ −0.39 to −0.19 e), consistent with molecular adsorption that is electronically activated but largely intact. In sharp contrast, the 2F–2O configuration shows an exceptionally large binding energy (7.43 eV), and a large electron transfer (Δq = −2.154 e), which are insights of bond cleavage and formation of interfacial Li–X bonds (e.g., LiF and Li–O). The similar ΔΦ values across orientations (−2.15 to −2.29 eV) indicate a consistently strong interfacial electronic coupling, but the magnitude of binding and charge transfer uniquely flags 2F–2O as the most reactive pathway, likely corresponding to spontaneous or low-barrier fragmentation of DFOB upon contact with Lim surface.
For EMIM on Li metal, all the orientations (2H, 3H, 4H, 6H) indicate no dissociation showing the stability of this cation at Lim surfaces. The binding energies are moderate and narrowly distributed (1.9 to 2.23 eV), with 6H and 2H only slightly stronger than 3H and 4H Attacks orientations, indicating orientation-dependent but comparable weak chemisorption. Charge transfer is uniformly about 0.5 e from the surface to the cation (−0.47 to −0.553 e), sufficient to polarize the interface, as observed from the electron density analysis showed in previous sections, but not an indicative of bond cleavage. The positive work-function shifts (ΔΦ ≈ 1.83 to 2.52 eV) indicate an electron withdrawal from the metal surface and the formation of a stable interfacial dipole typical of intact molecular adsorption. The absence of any outlier in binding, charge transfer, or ΔΦ across orientations supports the conclusion that EMIM remains intact on Li, with the 6H (and closely 2H) pose providing the most favorable, but still non-dissociative, interaction.
Similarly, for Pyr14, all orientations (4H, 2H, 3H, 5H) are consistent with molecular, non-dissociative adsorption. Binding energies are moderate (1.90 to 2.24 eV), charge transfer is limited and similar across orientations (Δq ≈ −0.53 to −0.46 e), and the work-function shifts are positive along all orientations (+1.28 to +2.23 eV), indicating electron withdrawal and an interfacial dipole typical of intact cation adsorption rather than bond cleavage. Among them, 5H is marginally the most favorable, but still firmly in the non-dissociative regime; any decomposition would likely require an external driving force, such an electric field during battery charging conditions, or a defect-assisted pathway (Table 8).

Table 8.
Calculated adsorption properties of five anions and two cations on a Lim surface for multiple molecular orientations. For each configuration, the total slab–molecule energy, binding energy, net molecular charge, charge transfer, and change in work function (ΔΦ) are reported.
Orientation of adsorption significantly influences binding energies and electron redistribution. Anions generally show orientation-dependent binding and variable charge transfer, with DFOB− exhibiting the largest variations, indicating strong interfacial interactions and potential bond activation. Cations, such as EMIM+, remain largely unaffected across orientations, reflecting their structural stability. ΔELF and Δρ analyses highlight the atoms actively involved in interfacial bonding. Reactive anions (F, O, S centers) show localized electron accumulation and ELF peaks at these sites, indicating Li–X interactions and potential bond cleavage. Cations (EMIM+, Pyr14+) exhibit delocalized ELF distributions with minor localization near interfacial hydrogen atoms, consistent with stable adsorption without dissociation. The observed differences in electron uptake between anions and cations can be rationalized in terms of their electronic structure. Reactive anions such as PF6−, BF4−, FSI−, TFSI−, and DFOB− possess multiple electronegative centers (F, O, S) and accessible antibonding orbitals that readily accept electrons from the Lim surface. This results in significant charge transfer, as quantified by Bader analysis: for instance, PF6− and BF4− exhibit charge transfers of −0.371 e and −0.282 e, respectively, while DFOB− in the 2F–2O configuration reaches −2.154 e, consistent with dissociative chemisorption. By contrast, cations such as EMIM+ and Pyr14+ lack such reducible centers; their positive charge is delocalized over the molecular framework, leading to moderate and distributed charge neutralization (~0.47–0.55 e) without bond cleavage. These observations directly explain why anions act as reactive electron acceptors at the interface, whereas cations remain structurally intact.
4. Conclusions
The present work demonstrates that simple, low-computationally cost atomistic simulations can provide valuable qualitative and quantitative insights into the dissociation behavior of electrolyte components at reactive Lim interfaces, without the need for computationally expensive ab initio molecular dynamics (AIMD) simulations. By employing a slab–molecule model and evaluating key interfacial descriptors, such as electron density difference, electron localization function difference, binding energy, charge transfer, and work-function shifts, across pre-optimized molecular orientations, we can get insights of potential bond activation or cleavage upon contact with Lim.
The results show clear trends that align with established experimental behaviors. Concerning, and , both of which decompose rapidly on Lim, the significant binding energies, large negative shifts in work-function, and significant charge transfer all correspond to activated precursor states that assist in bond cleavage and the formation of LiF. Similarly, FSI and TFSI highlight the reactivity that depends upon orientation: although both anions explore molecular adsorption initially, energetically preferable configurations with stronger binding and larger electronic uptake signify S–F or S–O bond weakening and thus propensity to dissociate. Furthermore, DFOB shows the first distinct reactivity signature, as the 2F–2O orientation features significant binding energy and charge transfer, explicitly indicating dissociative chemisorption and production of Li–F and Li–O interfacial species.
Conversely, the cations EMIM and Pyr14 do not exhibit any indication of decomposition. Both bind with comparable energies and undergo partial charge neutralization, yet their ELF responses differ: EMIM displays only diffuse accumulation consistent with higher stability, whereas Pyr14 shows slightly more localized features near interfacial hydrogens. In all cases, the work-function shifts are positive, indicative of electron withdrawal and the formation of stable interfacial dipoles rather than bond cleavage, consistent with the electrochemical stability of these cations against Li metal.
Anions exhibiting strong Li–F or Li–O coordination, such as PF6−, BF4−, FSI−, and DFOB−, show significant charge transfer and localized electron accumulation at the interface, leading to partial bond cleavage and the formation of LiF-rich layers. These reactions contribute to the initial stabilization of the Li surface through the development of an inorganic SEI. However, excessive reactivity, as seen in PF6− and BF4−, may promote further decomposition and structural inhomogeneity in the interphase. In contrast, TFSI− shows a more moderate interaction, maintaining interfacial integrity while still contributing to passivation through controlled Li–F bond formation. Overall, the optimal anion reactivity lies between these extremes, sufficient to produce a uniform, LiF-enriched SEI without driving uncontrolled degradation.
Overall, this work demonstrates how a simple slab-based simulation platform, when combined with well-chosen electronic and energetic descriptors, can capture and rationalize the interfacial reactivity trends associated with these electrolyte ions. This provides a computationally efficient screening platform to evaluate probable electrolyte stability and inform design for next-generation designs for Lim battery electrolytes.
As future work, the application of external perturbations such as an electric field could be introduced to emulate charging conditions and investigate how these conditions might trigger new dissociation pathways or alter reaction mechanisms. Additionally, we could build a better database by testing more molecules and use machine learning approaches trained to classify aqueous electrolyte components from their descriptor space. This automation would allow predictors to determine whether dissociative tendencies box important homolytic or heterolytic trends facilitating the actionable rational design of new stable high performance electrolyte systems.
Author Contributions
Conceptualization, L.A.S.; methodology, L.A.S.; software, L.A.S.; validation, D.V.-L. and J.Q.; formal analysis, L.A.S.; investigation, L.A.S.; data curation, L.A.S.; writing—original draft preparation, L.A.S.; writing—review and editing, D.E.G.-A., D.V.-L. and J.Q.; visualization, D.E.G.-A.; supervision, D.V.-L. and J.Q.; project administration, L.A.S. All authors have read and agreed to the published version of the manuscript.
Funding
This research received no external funding.
Data Availability Statement
The data that support the findings of this study are available from the corresponding author upon reasonable request due to privacy.
Conflicts of Interest
The authors declare no conflict of interest.
References
- Galvez-Aranda, D.E.; Seminario, J.M. Simulations of a LiF solid electrolyte interphase cracking on silicon anodes using molecular dynamics. J. Electrochem. Soc. 2018, 165, A717. [Google Scholar] [CrossRef]
- Selis, L.A.; Seminario, J.M. Dendrite formation in silicon anodes of lithium-ion batteries. RSC Adv. 2018, 8, 5255–5267. [Google Scholar] [CrossRef]
- Wu, D.; He, J.; Liu, J.; Wu, M.; Qi, S.; Wang, H.; Huang, J.; Li, F.; Tang, D.; Ma, J. Li2CO3/LiF-rich heterostructured solid electrolyte interphase with superior lithiophilic and Li+-transferred characteristics via adjusting electrolyte additives. Adv. Energy Mater. 2022, 12, 2200337. [Google Scholar] [CrossRef]
- Selis, L.A.; Seminario, J.M. Dendrite formation in Li-metal anodes: An atomistic molecular dynamics study. RSC Adv. 2019, 9, 27835–27848. [Google Scholar] [CrossRef]
- Zou, W.; Zhang, J.; Liu, M.; Li, J.; Ren, Z.; Zhao, W.; Zhang, Y.; Shen, Y.; Tang, Y. Anion-reinforced solvating ionic liquid electrolytes enabling stable high-nickel cathode in lithium-metal batteries. Adv. Mater. 2024, 36, 2400537. [Google Scholar] [CrossRef]
- Das, S.; Manna, S.S.; Pathak, B. Recent trends in electrode and electrolyte design for aluminum batteries. ACS Omega 2020, 6, 1043–1053. [Google Scholar] [CrossRef] [PubMed]
- Manna, S.S.; Pathak, B. Screening of ionic liquid-based electrolytes for Al dual-ion batteries: Thermodynamic cycle and combined MD-DFT approaches. J. Phys. Chem. C 2023, 127, 8913–8924. [Google Scholar] [CrossRef]
- Lux, S.F.; Schmuck, M.; Jeong, S.; Passerini, S.; Winter, M.; Balducci, A. Li-ion anodes in air-stable and hydrophobic ionic liquid-based electrolyte for safer and greener batteries. Int. J. Energy Res. 2010, 34, 97–106. [Google Scholar] [CrossRef]
- Kim, G.T.; Jeong, S.S.; Xue, M.Z.; Balducci, A.; Winter, M.; Passerini, S.; Alessandrini, F.; Appetecchi, G.B. Development of ionic liquid-based lithium battery prototypes. J. Power Sources 2012, 199, 239–246. [Google Scholar] [CrossRef]
- Appetecchi, G.B.; Kim, G.T.; Montanino, M.; Carewska, M.; Marcilla, R.; Mecerreyes, D.; De Meatza, I. Ternary polymer electrolytes containing pyrrolidinium-based polymeric ionic liquids for lithium batteries. J. Power Sources 2010, 195, 3668–3675. [Google Scholar] [CrossRef]
- Kim, H.; Ding, Y.; Kohl, P.A. LiSICON—Ionic liquid electrolyte for lithium ion battery. J. Power Sources 2012, 198, 281–286. [Google Scholar] [CrossRef]
- Stoffel, T.D.; Haskins, J.B.; Lawson, J.W.; Markutsya, S. Coarse-grained dynamically accurate simulations of ionic liquids: [pyr14][TFSI] and [EMIM][BF4]. J. Phys. Chem. B 2022, 126, 1819–1829. [Google Scholar] [CrossRef]
- Khalid, M.; Zafar, M.; Hussain, S.; Asghar, M.A.; Khera, R.A.; Imran, M.; Abookleesh, F.L.; Akram, M.Y.; Ullah, A. Influence of End-Capped Modifications in the Nonlinear Optical Amplitude of Nonfullerene-Based Chromophores with a D−π–A Architecture: A DFT/TDDFT Study. ACS Omega 2022, 7, 23532–23548. [Google Scholar]
- Mehboob, M.Y.; Khan, M.U.; Hussain, R.; Khalid, M.; Yaqoob, J.; Rehman, R.; Siddique, M.B.A.; Alam, M.M.; Imran, M.; Ayub, K. First example of vinylbenzene based small photovoltaic molecules: Towards the development of efficient D-π-A configured optoelectronic materials for bulk heterojunction solar cells. Phys. B Condens. Matter 2022, 633, 413769. [Google Scholar] [CrossRef]
- Khalid, M.; Shafiq, I.; Umm-e-Hani; Mahmood, K.; Hussain, R.; Rehman, M.F.U.; Assiri, M.A.; Imran, M.; Akram, M.S. Effect of different end-capped donor moieties on non-fullerenes based non-covalently fused-ring derivatives for achieving high-performance NLO properties. Sci. Rep. 2023, 13, 1395. [Google Scholar] [CrossRef] [PubMed]
- Valencia, H.; Kohyama, M.; Tanaka, S.; Matsumoto, H. Ab initio study of EMIM-BF4 molecule adsorption on Li surfaces as a model for ionic liquid/Li interfaces in Li-ion batteries. Phys. Rev. B 2008, 78, 205402. [Google Scholar] [CrossRef]
- Bouder, G.; Bouhani, H.; Martinez, H.; Carbonniere, P. Atomistic Insights into the Decomposition of Solid Polymer Electrolyte Molecules on Lithium Metal Anode: A Combined DFT and AIMD Study. J. Phys. Chem. C 2025, 129, 8602–8613. [Google Scholar] [CrossRef]
- Horstmann, B.; Shi, J.; Amine, R.; Werres, M.; He, X.; Jia, H.; Hausen, F.; Cekic-Laskovic, I.; Wiemers-Meyer, S.; Lopez, J.; et al. Strategies towards enabling lithium metal in batteries: Interphases and electrodes. Energy Environ. Sci. 2021, 14, 5289–5314. [Google Scholar] [CrossRef]
- Qin, Y.; Wang, H.; Zhou, J.; Li, R.; Jiang, C.; Wan, Y.; Wang, X.; Chen, Z.; Wang, X.; Liu, Y. Binding FSI− to Construct a Self-Healing SEI Film for Li-Metal Batteries by In situ Crosslinking Vinyl Ionic Liquid. Angew. Chem. 2024, 136, e202402456. [Google Scholar] [CrossRef]
- Galvez-Aranda, D.E.; Seminario, J.M. Li-metal anode in dilute electrolyte LiFSI/TMP: Electrochemical stability using ab initio molecular dynamics. J. Phys. Chem. C 2020, 124, 21919–21934. [Google Scholar] [CrossRef]
- Kerner, M.; Plylahan, N.; Scheers, J.; Johansson, P. Ionic liquid based lithium battery electrolytes: Fundamental benefits of utilising both TFSI and FSI anions? Phys. Chem. Chem. Phys. 2015, 17, 19569–19581. [Google Scholar] [CrossRef]
- Plylahan, N.; Kerner, M.; Lim, D.-H.; Matic, A.; Johansson, P. Ionic liquid and hybrid ionic liquid/organic electrolytes for high temperature lithium-ion battery application. Electrochim. Acta 2016, 216, 24–34. [Google Scholar] [CrossRef]
- Yuan, L.; Raza, A.; Kyritsis, D.; Zeng, H.; Zhang, T. Counterintuitive Isomerization of TFSI− and TFSI−—Cation Correlated Isomerization: Insights into the Low Melting Points of TFSI−-Based Ionic Liquids. J. Phys. Chem. B 2024, 128, 10492–10505. [Google Scholar] [CrossRef] [PubMed]
- Galvez-Aranda, D.E.; Seminario, J.M. Solid Electrolyte Interphase Formation at the Ionic Liquid Electrolyte—Lithium-Metal Interface Using an Ab Initio Molecular Dynamics Approach. J. Electrochem. Soc. 2024, 171, 030521. [Google Scholar] [CrossRef]
- Wood, K.N.; Kazyak, E.; Chadwick, A.F.; Chen, K.-H.; Zhang, J.-G.; Thornton, K.; Dasgupta, N.P. Dendrites and pits: Untangling the complex behavior of lithium metal anodes through operando video microscopy. ACS Cent. Sci. 2016, 2, 790–801. [Google Scholar] [CrossRef]
- Galvez-Aranda, D.E.; Seminario, J.M. Li-metal anode in a conventional Li-ion battery electrolyte: Solid electrolyte interphase formation using ab initio molecular dynamics. J. Electrochem. Soc. 2022, 169, 030502. [Google Scholar] [CrossRef]
- Pan, Y.; Yu, H.; Zhang, Y.; Wang, Z.; Wang, S.; Li, C.; Ma, Y.; Shi, X.; Zhang, H.; Song, D. In-depth exploration of the effect mechanisms of various lithium salt anions in solid-state and liquid lithium metal batteries. J. Mater. Chem. A 2024, 12, 16447–16456. [Google Scholar] [CrossRef]
- Meierl, J.; Krossing, I. Conductivity Improvement of LiBF4 Containing Electrolyte for Enhanced Application in Lithium-Ion Batteries. In Proceedings of the Electrochemical Society Meeting Abstracts 244, Gothenburg, Sweden, 8–12 October 2023; The Electrochemical Society, Inc.: Pennington, NJ, USA, 2023; p. 3081. [Google Scholar]
- Liu, X.; Zhao, J.; Dong, H.; Zhang, L.; Zhang, H.; Gao, Y.; Zhou, X.; Zhang, L.; Li, L.; Liu, Y. Sodium Difluoro (oxalato) borate Additive-Induced Robust SEI and CEI Layers Enable Dendrite-Free and Long-Cycling Sodium-Ion Batteries. Adv. Funct. Mater. 2024, 34, 2402310. [Google Scholar] [CrossRef]
- Kang, Z.; Chang, H.; Zhang, S.; Zhong, J.; Costa, C.M.; Lanceros-Mendez, S.; Liu, Y.; Zhang, L.; Wang, J.-Q. Lithium difluoro (oxalato) borate additive stabilizes interfaces and boosts performance in poly (ionic liquid) s solid-state lithium-metal batteries. Chem. Eng. J. 2025, 520, 165761. [Google Scholar] [CrossRef]
- Zhu, C.; Ning, Y.; Jiang, Y.; Li, G.; Pan, Q. Double-network polymer electrolytes with ionic liquids for lithium metal batteries. Polymers 2022, 14, 3435. [Google Scholar] [CrossRef]
- Ai, C.; Shu, Y.; Zhao, Z.; Guo, H.; Chen, S.; Yi, Q. Advances in the Application of Ionic Liquids in PEO-based Lithium Ion Solid-State Electrolytes: From A View of Fillers. J. Mater. Chem. A 2025, 13, 13632–13656. [Google Scholar] [CrossRef]
- Sun, H.; Zhu, G.; Zhu, Y.; Lin, M.C.; Chen, H.; Li, Y.Y.; Hung, W.H.; Zhou, B.; Wang, X.; Bai, Y. High-safety and high-energy-density lithium metal batteries in a novel ionic-liquid electrolyte. Adv. Mater. 2020, 32, 2001741. [Google Scholar] [CrossRef]
- Giannozzi, P.; Baseggio, O.; Bonfà, P.; Brunato, D.; Car, R.; Carnimeo, I.; Cavazzoni, C.; De Gironcoli, S.; Delugas, P.; Ruffino, F.F. Quantum ESPRESSO toward the exascale. J. Chem. Phys. 2020, 152, 154105. [Google Scholar] [CrossRef]
- Giannozzi, P.; Andreussi, O.; Brumme, T.; Bunau, O.; Nardelli, M.B.; Calandra, M.; Car, R.; Cavazzoni, C.; Ceresoli, D.; Cococcioni, M. Advanced capabilities for materials modelling with Quantum ESPRESSO. J. Phys. Condens. Matter 2017, 29, 465901. [Google Scholar] [CrossRef] [PubMed]
- Giannozzi, P.; Baroni, S.; Bonini, N.; Calandra, M.; Car, R.; Cavazzoni, C.; Ceresoli, D.; Chiarotti, G.L.; Cococcioni, M.; Dabo, I. QUANTUM ESPRESSO: A modular and open-source software project for quantumsimulations of materials. J. Phys. Condens. Matter 2009, 21, 395502. [Google Scholar] [CrossRef] [PubMed]
- Combes, J.; Duclos, P.; Seiler, R. The Born-Oppenheimer Approximation; Rigorous, A., Molecular, P., Eds.; Wightman and Velo: Plenum, NY, USA, 1981. [Google Scholar]
- Ropo, M.; Kokko, K.; Vitos, L. Assessing the Perdew-Burke-Ernzerhof exchange-correlation density functional revised for metallic bulk and surface systems. Phys. Rev. B—Condens. Matter Mater. Phys. 2008, 77, 195445. [Google Scholar] [CrossRef]
- Perdew, J.P.; Burke, K.; Ernzerhof, M. Generalized gradient approximation made simple. Phys. Rev. Lett. 1996, 77, 3865. [Google Scholar] [CrossRef]
- Blöchl, P.E. Projector augmented-wave method. Phys. Rev. B 1994, 50, 17953. [Google Scholar] [CrossRef]
- Barca, G.M.; Bertoni, C.; Carrington, L.; Datta, D.; De Silva, N.; Deustua, J.E.; Fedorov, D.G.; Gour, J.R.; Gunina, A.O.; Guidez, E. Recent developments in the general atomic and molecular electronic structure system. J. Chem. Phys. 2020, 152, 154102. [Google Scholar] [CrossRef]
- Humphrey, W.; Dalke, A.; Schulten, K. VMD: Visual molecular dynamics. J. Mol. Graph. 1996, 14, 33–38. [Google Scholar] [CrossRef]
- Stukowski, A. Visualization and analysis of atomistic simulation data with OVITO–the Open Visualization Tool. Model. Simul. Mater. Sci. Eng. 2009, 18, 015012. [Google Scholar] [CrossRef]
- Momma, K.; Izumi, F. VESTA: A three-dimensional visualization system for electronic and structural analysis. Appl. Crystallogr. 2008, 41, 653–658. [Google Scholar] [CrossRef]
- Momma, K.; Izumi, F. VESTA 3 for three-dimensional visualization of crystal, volumetric and morphology data. Appl. Crystallogr. 2011, 44, 1272–1276. [Google Scholar] [CrossRef]
- Tang, W.; Sanville, E.; Henkelman, G. A grid-based Bader analysis algorithm without lattice bias. J. Phys. Condens. Matter 2009, 21, 084204. [Google Scholar] [CrossRef]
- Henkelman, G.; Arnaldsson, A.; Jónsson, H. A fast and robust algorithm for Bader decomposition of charge density. Comput. Mater. Sci. 2006, 36, 354–360. [Google Scholar] [CrossRef]
- Parimalam, B.S.; MacIntosh, A.D.; Kadam, R.; Lucht, B.L. Decomposition reactions of anode solid electrolyte interphase (SEI) components with LiPF6. J. Phys. Chem. C 2017, 121, 22733–22738. [Google Scholar] [CrossRef]
- Parimalam, B.S.; Lucht, B.L. Reduction reactions of electrolyte salts for lithium ion batteries: LiPF6, LiBF4, LiDFOB, LiBOB, and LiTFSI. J. Electrochem. Soc. 2018, 165, A251. [Google Scholar] [CrossRef]
Disclaimer/Publisher’s Note: The statements, opinions and data contained in all publications are solely those of the individual author(s) and contributor(s) and not of MDPI and/or the editor(s). MDPI and/or the editor(s) disclaim responsibility for any injury to people or property resulting from any ideas, methods, instructions or products referred to in the content. |
© 2025 by the authors. Licensee MDPI, Basel, Switzerland. This article is an open access article distributed under the terms and conditions of the Creative Commons Attribution (CC BY) license (https://creativecommons.org/licenses/by/4.0/).