Article

Influence of the Etching Material Deposition Rate and Annealing Time on Nanohole Morphology Etched into InP/In0.52Al0.48As Layers via Local Droplet Epitaxy

1
Department of Physics, Paderborn University, Warburger Str. 100, 33098 Paderborn, Germany
2
Institute for Photonic Quantum Systems (PhoQS), Paderborn University, 33098 Paderborn, Germany
3
Center for Optoelectronics and Photonics Paderborn (CeOPP), Paderborn University, 33098 Paderborn, Germany
*
Authors to whom correspondence should be addressed.
Crystals 2025, 15(11), 913; https://doi.org/10.3390/cryst15110913
Submission received: 29 September 2025 / Revised: 16 October 2025 / Accepted: 21 October 2025 / Published: 23 October 2025
(This article belongs to the Section Inorganic Crystalline Materials)

Abstract

Local droplet etching and subsequent refilling enables the fabrication of highly symmetric quantum dots with low fine structure splitting, suitable for generating polarization entangled photons. While well established in GaAs/AlxGa1−xAs, this approach does not yield emission in the telecom bands required for low loss fiber-based quantum communication. To achieve emission at 1.55 μm, local droplet etching must be adapted to alternative material platforms such as InP. Here, we systematically investigate how the etching material deposition rate and etching time influence nanohole morphology in In0.52Al0.48As layers lattice-matched to InP. In the first experiment, InAl was deposited at fluxes of 0.2–4.0 Å s−1 at T e t c h   =   350   ° C and 460 °C. Lower fluxes produced nanoholes with lower density and larger ring diameters, indicating fewer and larger initial droplets, consistent with scaling theory. The average nanohole diameter decreased monotonically with increasing flux, whereas the average depth showed no clear dependence on flux. In the second experiment, etching times of 30–600 s were tested for InAl, In, and Al droplets. Average nanohole diameters remained constant for Al across all etching times, but decreased for In and InAl with increasing etching time, suggesting sidewall redeposition during etching. For all droplet types, depths peaked at intermediate times and decreased for prolonged etching, consistent with material diffusion into the nanohole after droplet consumption.

1. Introduction

Emerging quantum technologies rely on the efficient generation, transmission, and reception of single photons for information exchange between individual devices, e.g., quantum key distribution [1]. Semiconductor quantum dots (QDs) are prime candidates for high-quality photon sources, offering on-demand single photons and polarization entangled photon pair generation [2,3]. Among the established QD fabrication techniques, local droplet etching (LDE) has proven especially promising. GaAs/AlxGa1−xAs QDs produced by LDE have been shown to produce entangled photon pairs with very high fidelity [4,5,6] and photons able to be interfaced with Rb vapor as quantum memory [7]. They are at the moment the gold standard regarding generation of polarization entangled photon pairs.
However, due to the band gap energies of GaAs and AlAs, GaAs/AlxGa1−xAs QDs cannot yield emission in the telecom bands, where optical fiber attenuation is minimal. To realize LDE QD sources operating in the telecom C-band (∼1.55 μm), LDE must be adapted to alternative material platforms, such as GaSb [8] or InP [9]. Recently, we demonstrated LDE QD fabrication employing InP/In0.52Al0.48As/InxGa1−xAs and investigated several parameters influencing nanohole etching in this system [9,10].
In the present work, we extend this investigation through two experimental studies to analyze the nanohole etching process. In the first series, we examined the effect of the etching material deposition rate by varying the In0.52Al0.48 (abbreviated to InAl) deposition rate between F I n A l   =   0.2 and 4.0   Å   s −1 at two etching temperatures ( T e t c h   =   350   ° C and 460 °C) for a fixed InAl amount of θ I n A l   =   1.4 ML . In the second series, we studied the influence of the etching time ( t e t c h   =   30 600   s ) for nanoholes created from InAl, In, and Al droplets at T e t c h   =   435   ° C .

2. Experimental Details

All samples utilized in this study were grown on InP (100) wafers using a III–V solid source molecular beam epitaxy (MBE) system Octoplus 500 by Dr. Eberl MBE-Komponenten GmbH, Weil der Stadt, Germany. The MBE system is equipped with effusion cells as sources for group III materials and a valved arsenic (As) cracker source to ensure precise control over the arsenic flux and enabling growth under tetrameric arsenic (As4) or dimeric arsenic (As2) conditions. The substrate temperature was measured by using band-edge thermometry, implemented via a BandiT system [11]. For sample preparation, the wafers were initially heated to 540 °C under an As2 flux of p A s 2   =   2 × 10⁻⁵ mbar for deoxidation. While this leads to the formation of a monolayer thin InAs layer, due to the exchange of P and As atoms, it has been shown that the crystal structure is retained between InP substrate and In0.52Al0.48As layers grown directly after removing the native oxide under excessive As pressure [12]. Following this step, the temperature was decreased to 505   ° C , and a 100   n m In0.52Al0.48As layer, lattice-matched to the InP substrate, was grown. The substrate was then cooled to the etching temperature T e t c h and the As valve opening was reduced to provide an As2 flux of p A s 2   =   2   ×   10−7 mbar, which was measured prior to each run using a beam flux monitor (BFM).
For the etching time experiments, the etching temperature was set to T e t c h   =   435   ° C , an etching temperature known to produce nanoholes with good in-plane symmetry and a suitable depth for QD formation [10]. A nominal coverage of θ   =   1.4 ML InAl, In, or Al, respectively, was deposited within 2   s for InAl and 4   s for In as well as Al, respectively. The deposition times correspond to the growth time required to grow 1.4 ML of In0.52Al0.48As, InAs, or AlAs, respectively. This was followed by an etching step, i.e., a break at T e t c h and the reduced As flux of p A s 2   =   2 × 10⁻⁷ mbar, with a varying duration of t e t c h   =   30 600   s . To terminate etching, the As2 flux was raised to p A s 2 = 2 × 10⁻⁵ mbar and 4 ML of In0.52Al0.48As were deposited to conserve the etched nanoholes, as described in Ref. [10]. The samples were then reheated to 505 °C—as this is the temperature we would utilize for nanohole filling in quantum dot fabrication experiments—before cooling to 200   ° C .
For the etching material deposition rate study, θ I n A l   =   1.4 ML InAl were deposited over 20, 6.7, 2 or 1   s , corresponding to an InAl flux range from F I n A l   =   0.2 to F I n A l   =   4.0   Å   s −1, at T e t c h   =   350 or 460   ° C , respectively, followed by an etching step of t e t c h   =   180   s . In this series, the As2 flux was not increased to stop the etching process, because the conservation of the nanoholes with In0.52Al0.48As deposition rates other than 2   Å   s −1 has not yet been tested and the In0.52Al0.48As layer deposition would have been done with the same cell as the droplet deposition. For that reason, all samples were cooled with 30   ° C / min to 200   ° C under an As2 flux of p A s 2 =   2   × 10−7 mbar. The etching probably continued during this cooldown to some extent, especially for the T e t c h   =   460   ° C samples.
Finally, all samples were removed from the MBE system and analyzed ex situ. We utilized high-resolution X-ray diffractometry (HRXRD) to confirm the composition of the In0.52Al0.48As layers (see Supplementary Material for an example) and atomic force microscopy (AFM) to measure the produced nanohole structures. For HRXRD, we used a SmartLab with a 9 kW rotating copper anode by Rigaku Corporation, Tokyo, Japan and for AFM a DIMENSION icon XR from Bruker Corporation, Billerica, USA, which was operated in tapping mode. For each sample, n   =   20 nanoholes were analyzed by measuring the depth h, ring height a, nanohole diameter d, and ring-hole structure diameter r. h was measured from the lowest point in the nanohole to the In0.52Al0.48As surface level, a from the surface level to the tip of the ring, and d and r with the surface level as a reference point. A sketch illustrating the individual dimensions is depicted in Figure 1i.

3. Results

3.1. Etching Material Deposition Rate

The etching material deposition rate strongly influenced the overall in-plane size of the resulting ring-hole structure as well as the nanohole diameters. Figure 1a shows the average nanohole diameters along the [ 011 ] and [ 0 1 ¯ 1 ] crystallographic directions as a function of the employed etching material deposition rate. For both tested etching temperatures, there was a clear dependence of the diameters on the deposition rate, with the diameters decreasing with increasing deposition rate. For example, at T e t c h   =   350   ° C , the diameters were d [ 011 ]   =   159 ± 13   n m and d [ 0 1 ¯ 1 ]   =   117 ± 14   n m for a flux of F   =   0.2   Å   s −1. Increasing the deposition rate by a factor of 10 to 2.0   Å   s −1 resulted in a halving of the diameters with d [ 011 ]   =   83 ± 6   n m and d [ 0 1 ¯ 1 ]   =   68 ± 4   n m . At T e t c h   =   460   ° C , the respective values decreased from d [ 011 ]   =   376 ± 30   n m and d [ 0 1 ¯ 1 ]   =   295 ± 38   n m at F   =   0.2   Å   s −1 to d [ 011 ]   =   201 ± 19   n m and d [ 0 1 ¯ 1 ]   =   165 ± 15   n m at 2 Å s−1. A similar trend was observed for the overall ring-hole structure, as can be seen in Figure 1b, where the average diameters r of the whole structure along the [ 011 ] and [ 0 1 ¯ 1 ] directions are plotted as a function of the employed deposition rate.
We think this behavior reflects the size of droplets formed during deposition: higher deposition rates produce smaller droplets with higher density. As discussed in the literature, the droplet volume is dependent on the total deposition amount θ , the droplet density n, and the deposition material consumed for wetting the initially As terminated surface layer θ w [13]. The number of atoms per droplet μ can be approximated by μ ( θ θ w ) / n and the overall droplet volume V with V μ ( V M / N A ) with the volume of mol of droplet material V M and the Avogadro constant N A [13]. Based on scaling theory [14], we assume that the density n depends on the deposition flux F (as well as θ , the diffusion coefficient D, and material-specific constants z and p) n θ 1 z ( F / D ) p . This means that n should show a proportional and V (and the droplet diameter) an anti-proportional dependence on the Flux F:
n     F ,
V     1 F .
Equations (1) and (2) are consistent with our experimental observations: With an increased flux, we observed a linear increase in the density of the nanoholes on the surface (see Ref. [15] for details), and the decrease in ring-hole structure diameter indicates a smaller initial droplet volume. This assumption is also supported by ring height a measurements: for T e t c h   =   460   ° C , the average height decreases from a   =   ( 23   ±   6 )   n m at F   =   0.2   Å   s −1 to a   =   ( 11   ±   6 )   n m at F   =   4.0   Å   s −1.
In contrast to diameter, nanohole depth did not scale straightforwardly with the etching material deposition rate. Figure 1c shows the average nanohole depth h as a function of the deposition rate for the two tested etching temperatures. For both etching temperatures, we have observed similar behaviors in the change of the depth: h first increased from F   =   0.2 to 0.6   Å   s −1, then decreased at F   =   2.0   Å   s −1, and increased again at F   =   4.0   Å   s −1. This non-monotonic behavior is unexpected if depth were solely determined by droplet size. Here we see that both temperatures show a similar trend that is only offset by the temperature dependency, where higher temperatures lead to deeper nanoholes [10]. The observed non-monotonic behavior cannot be explained only by statistical variation, since, especially at the lower temperature of T e t c h   =   350   ° C , the nanohole depth variation for a given deposition rate is quite small. The reason for this non-monotonic behavior is not yet understood.
For the T e t c h   =   460   ° C , we observed at F   =   0.2   Å   s −1 and F   =   0.6   Å   s −1 the formation of two different type of holes, which led to the significant deviation from the average depth seen at these data points. Figure 1d,e show selected AFM scans from the T e t c h   =   460   ° C , F   =   0.6   Å   s −1 set, which depict two nanoholes that represent these two types. The first type, as shown in Figure 1d, were deeper nanoholes with a rounded bottom and the deepest point in—or close to—the center. The other type, as shown in Figure 1e, were nanoholes that were a bit shallower, but their main attribute was that they were quite flat at the bottom. Measurements by scanning electron microscopy (SEM) confirmed that these two types of nanostructures are not formed due to In and Al separation (see [16]). The shallower nanoholes resemble early-stage etch morphologies and may have resulted from insufficient etching time relative to the available liquid etchant volume.
We further investigated the symmetry properties of the etched structures by analyzing the diameter ratios of nanoholes and ring-hole structures. Figure 1f depicts the average diameter ratio of nanoholes ( d [ 011 ] / d [ 0 1 ¯ 1 ] ) and ring-hole structures ( r [ 011 ] / r [ 0 1 ¯ 1 ] ) as a function of the etching material deposition rate for both tested etching temperatures. T e t c h   =   350   ° C , F   =   4   Å   s −1 showed the average ratio closest to the optimum value of 1 for the ring-hole structure with r [ 011 ] / r [ 0 1 ¯ 1 ]   =   1.01 ± 0.05 , and 12 of the 20 measured structures showed a ratio that was within ( 1.00 ± 0.03 ). The rings tended to be slightly elongated, but there was no clear preference for a crystallographic direction at this temperature. However, we saw that increasing the temperature to T e t c h   =   460   ° C led to a clear change of the ring-hole structure. At T e t c h   =   460   ° C , F   =   4   Å   s −1 only 3 of the 20 measured structures were within a ratio of ( 1.00 ± 0.03 ), and the other 17 were all elongated in the [ 011 ] direction. We assume that this is due to a strong asymmetry of the adatom agglomeration during the initial droplet formation, either due to an imbalance of diffusion or atomistic incorporation along the [ 011 ] and [ 0 1 ¯ 1 ] directions activated by an increase in temperature during droplet deposition [15]. For the overall nanohole diameter, we observed the reverse effect. The elongation of the nanoholes decreased with increasing T e t c h , which we attribute to a temperature dependence on the etching speed of the crystallographic facets [17]. While there was a clear temperature dependence on the nanohole and ring structure elongation, this was not the case for the flux at the tested parameters. While there is some variation in the values between samples, a general trend was not discernible.
To test the viability of the etched nanoholes as bases for symmetric QDs we measured the hole diameters s at 10   n m and 30   n m measured above the lowest point of the nanohole for T e t c h   =   350   ° C and T e t c h   =   460   ° C , respectively (see Figure 1g). For fluxes between 0.2 and 2 Å s−1 at T e t c h   =   350   ° C , the diameter showed strong elongation even for only 10   n m of potential filling. This improved significantly for the F   =   4   Å   s −1 set with an average ratio of ( 1.12 ± 0.06 ), but 18 of the 20 nanoholes showed diameter ratios of more than 1.05. As such, the parameters of the T e t c h   =   350   ° C set are not a good choice for symmetric QD fabrication. However, nanoholes etched at higher temperatures exhibit better symmetric properties. Here, the samples of T e t c h   =   460   ° C with F   =   2 and 4   Å   s −1 exhibit favorable symmetry for filling up to 30 n m . For both samples, 12 of the 20 measured nanoholes had a diameter ratio below 1.05, where the F   =   4   Å   s −1 sample exhibited lower diameters overall ( F   =   2   Å   s −1: d [ 011 ] , 30   n m   =   ( 66   ±   6 )   n m , d [ 0 1 ¯ 1 ] , 30   n m   =   ( 64   ±   6 )   n m ; F   =   4   Å   s −1: d [ 011 ] , 30   n m   =   ( 47   ±   4 )   n m , d [ 0 1 ¯ 1 ] , 30   n m   =   ( 47   ±   5 )   n m ). A selected line scan from the T e t c h   =   460   ° C with F   =   2   Å   s −1 is shown in Figure 1h.
In-plane symmetry and the overall size of QDs strongly influence their optical properties [5,18,19]. As such, we conclude that the material flux during droplet deposition is an important parameter to control the droplet size and the resulting nanohole morphology, when aiming for nanoholes as excellent bases for highly symmetric QDs.

3.2. Etching Time

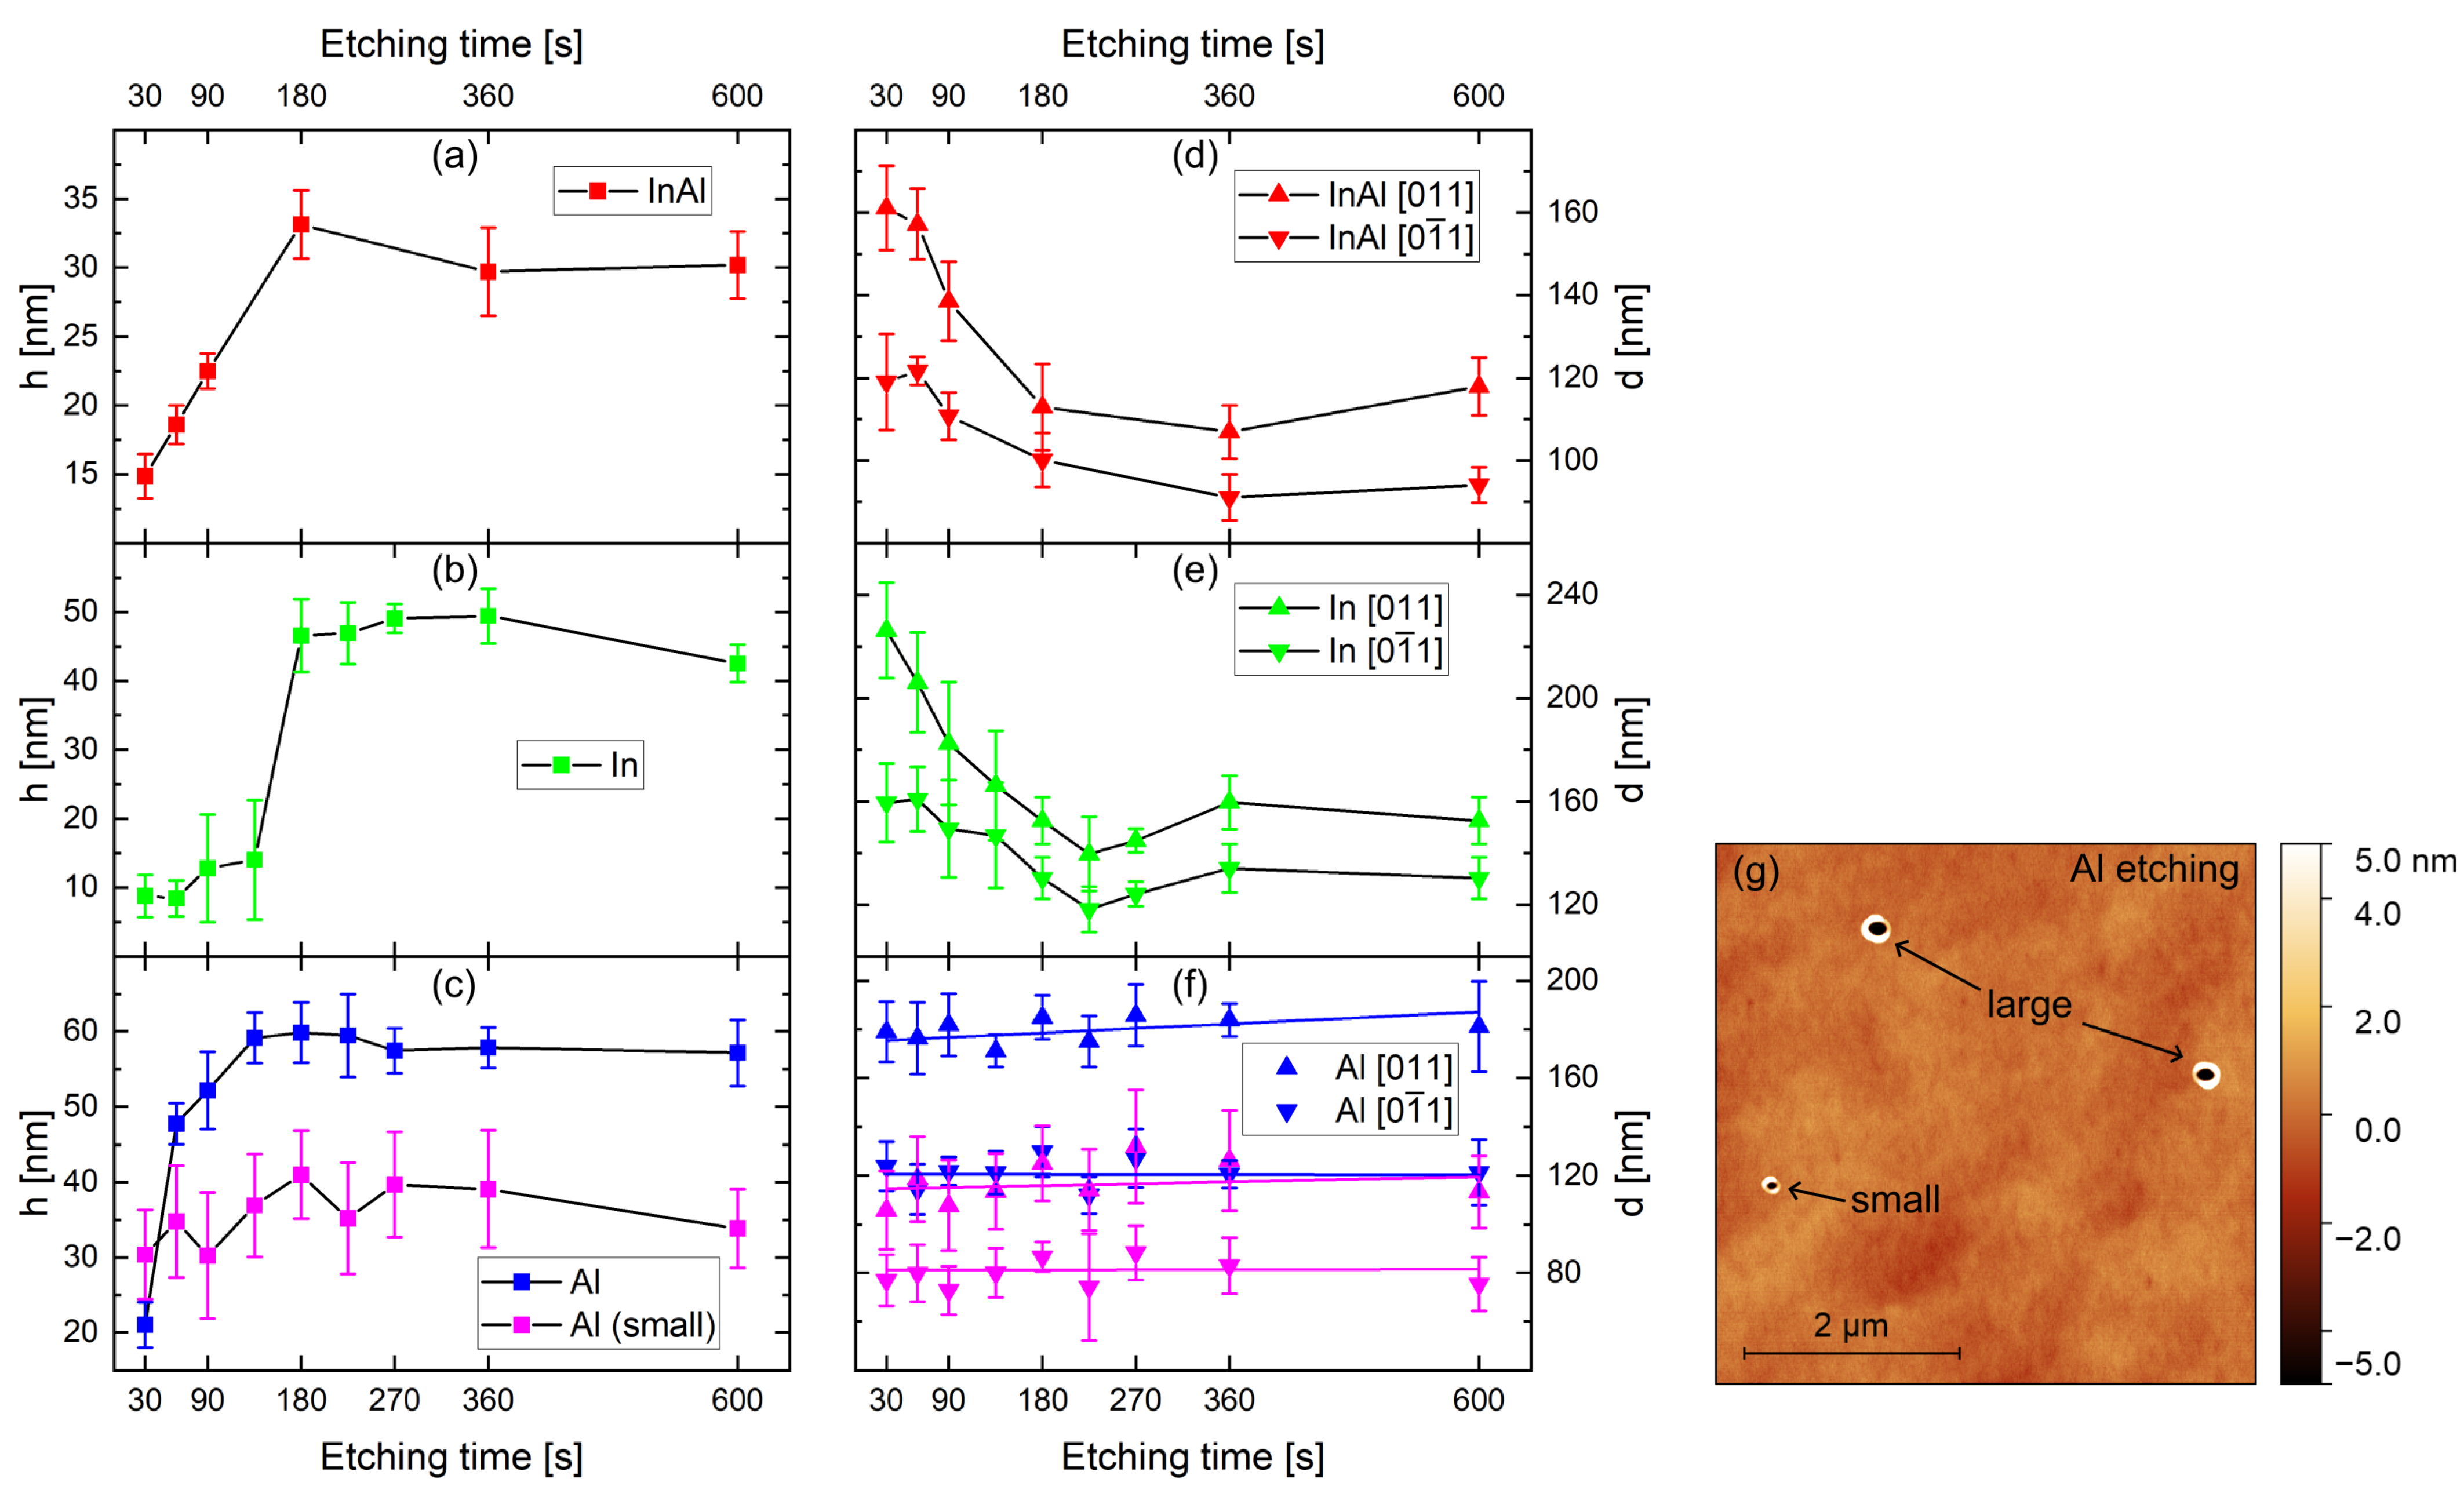
Figure 2a–c presents the etching depth h as a function of the etching time t e t c h for samples etched with InAl, In, and Al, respectively. For the InAl droplet series, h increased approximately from t e t c h   =   30 to 180 s, reaching a maximum at t e t c h   =   180   s with h   =   33.2 ± 2.5   n m . For longer etching times, h decreased slightly reaching a plateau by t e t c h   =   360   s , as there was no significant change when compared to the longest tested etching time of t e t c h   =   600   s .
The In etching series exhibited a similar trend at longer etching times: h peaked between t e t c h   =   270 and 360   s at ( 49.1   ±   2.1 )   n m and ( 49.4   ±   4.0 )  nm, respectively, followed by a decline in depth at t e t c h   =   600   s . However, the initial evolution differed from the InAl case. For t e t c h   =   30 to 135   s , the majority of nanoholes were shallow and exhibited flat bottoms. With increasing t e t c h , the fraction of “proper” nanoholes—defined here as those with a rounded bottom—increased, reflected in the greater scatter of the data at t e t c h   =   90 and 135   s . After that, h increased quickly at t e t c h   =   180   s , and the shallow and flat nanoholes vanished. The sudden increase in h at t e t c h   =   180   s was then followed by slower etching until t e t c h   =   270   s .
For the series with Al droplets, we observed the formation of two types of nanoholes at the selected fabrication parameters for all samples, as can be seen in the AFM scan in Figure 2g. The size difference in the structures indicates the formation of droplets with bimodal size distributions, and we separated the nanoholes by their ring-hole structure diameters into sets of small (ring-hole diameter r [ 011 ] 250   n m ) and large nanoholes (ring-hole diameter r [ 011 ] 280   n m ) . The amount of larger nanoholes was about double that of the smaller ones, and statistical analyses performed for each set separately and both sets combined yielded the same overall trends. For large nanoholes, h increased rapidly up to t e t c h   =   60   s , then more gradually until t e t c h   =   135   s , reaching a plateau at h   =   ( 59.1   ±   3.4 )   n m that persisted until t e t c h   =   225   s ( h   =   ( 59.5   ±   5.6 )   n m ). Thereafter, the depth decreased for longer etching times—like with InAl and In droplets—and plateaus up to the longest tested etching time of t e t c h   =   600   s .
For the set of small Al nanoholes, the average depth was h   =   30.4 ± 6.0   n m at the smallest tested etching time t e t c h   =   30   s , indicating a higher initial etching rate than for large set of nanoholes. However, subsequently h did not increase as much, likely due to the smaller initial droplet volume. The depth peaked between t e t c h   =   180 and 360   s , before decreasing at t e t c h   =   600   s .
Figure 2d–f show the average nanohole diameters along the [ 011 ] and [ 0 1 ¯ 1 ] crystallographic directions as a function of the etching time t e t c h for InAl, In, and Al droplets, respectively. In all cases, the nanoholes showed an elongation in the [ 011 ] direction, consistent with our previous observations [9,10], which is very likely linked to a difference in etching speeds for different crystalline facets [17]. For InAl droplets, the diameter in both directions decreased with increasing etching time, reaching a minimum at t e t c h   =   360   s . For even longer etching times, the diameter appears to be slightly increasing again.
In etching exhibited a qualitatively similar trend. The values for the nanohole diameters decreased to a minimum at t e t c h   =   225   s , followed by a gradual increase for longer etching durations.
In contrast, nanoholes formed from Al droplets showed no statistically significant diameter variation over the entire investigated etching time range ( t e t c h   =   30 600   s ). There are some statistical fluctuations in the average diameters sample-to-sample, but overall there is no indication of a systematic trend.

4. Discussion

To interpret the results from testing the influence of etching time, we first recall the established framework of droplet etching in III–V semiconductors [20,21,22]. The process can be divided into two distinct phases.

4.1. Phase I—Drilling and Excavation

During this first phase, the liquid group III droplet dissolves the underlying semiconductor, effectively “drilling” into the surface. As atoms from the substrate diffuse into the droplet, due to the As gradient between droplet and semiconductor layer, and the layer below the droplet “liquifies.” The outer shell of the droplet crystallizes with the As present in the droplet, resulting in the ring-like structure surrounding the nanohole [21]. Simultaneously, group III atoms from the droplet diffuse outward over the semiconductor surface, while group III species on the surface diffuse inward into the droplet. The residual arsenic pressure regulates this exchange, since adsorbed arsenic rapidly crystallizes surface group III atoms, immobilizing them [22]. Phase I ends when the droplet is fully consumed and the etch process stops [20].

4.2. Phase II—Refilling

Once the droplet is gone, the hole has reached its maximum depth, and material diffusion from the nanohole towards the surrounding surface ceases. However, adatoms from the surrounding surface can still diffuse into the nanohole, gradually refilling it [20]. This leads to a measurable reduction in depth for extended etching times—a feature observed here for all three droplet types under the employed conditions.

4.3. Al Droplets

The initial evolution of nanoholes produced by Al droplets on InAlAs parallels that of Ga droplets on GaAs [23]: holes first appear shallow with flat bottoms, then deepen and develop a rounded profile (Figure 3a). The in-plane diameter remains essentially constant for all t e t c h investigated (30– 600   s ), implying strong dependence on initial droplet size and negligible lateral material redistribution during etching. For holes formed from larger Al droplets (classified earlier by ring diameter), drilling is rapid during the first 60   s and then slows, ceasing around t e t c h   =   135   s . For holes from smaller droplets, the depth is already h   =   ( 30.4   ±   6.0 )   n m at the shortest etching time measured and increases only modestly to h   =   ( 41.0   ±   5.8 )   n m at t e t c h   =   180   s . This indicates that, for Al droplets, most excavation occurs early during the etching process.

4.4. In and InAl Droplets

In contrast, nanoholes from In droplets show little change in depth during the first 60 s, despite also having flat bottoms initially (Figure 3b). Between t e t c h   =   90   s and 180 s, the flat-bottomed holes rapidly transform into deeper, rounded ones, indicating a sudden increase in drilling rate. The depth then remains nearly constant thereafter, consistent with entry into Phase II. Notably, we observe a simultaneous reduction in in plane diameter in both [ 011 ] and [ 0 1 ¯ 1 ] directions, along with changes in the inner wall morphology. The InAl droplets exhibit similar diameter reduction trends to In droplets, along with comparable changes in wall morphology.
The decrease in nanohole diameter for In- and InAl-derived holes suggests that, unlike in the Ga-on-GaAs system [22,23], not all dissolved substrate material diffuses radially outward onto the semiconductor surface. Instead, part of it appears to redeposit on the inner sidewalls, effectively narrowing the hole. Why this behavior occurs only when In is present in the droplet remains unclear, but it may be related to differences in surface diffusion kinetics, binding energies, or facet-specific reconstruction behavior in In-containing alloys. This might indicate strong differences in the composition of the sidewalls inside the nanoholes depending on the chosen etchant. For QD fabrication, this would result in differences in confinement, even if etching parameters were adjusted to generate nanoholes with the same shape for different etchants. Incorporation of the Al etchant into the sidewalls of nanoholes etched into AlyGa1−xAs has been recently demonstrated leading to asymmetries in the resulting QDs influencing the excitonic fine structure splitting [19]. Thus, future studies should investigate the sidewall composition of droplet-etched nanoholes in In0.52Al0.48As layers, to optimize 1.55 μm QD fabrication, as well as to better understand the droplet etching process on InxAl1−xAs layers.

5. Summary

We investigated the morphology of nanoholes formed by local droplet etching on In0.52Al0.48As for etching times ranging from 30 to 600 s. Three droplet compositions—InAl, In, and Al—were studied, revealing marked differences in etching behaviour.
For Al-etched nanoholes, the average in-plane diameters remained constant across all etching times, consistent with earlier observations for Ga droplet etching on GaAs [23]. In contrast, both InAl- and In-etched nanoholes exhibited a pronounced decrease in diameter with increasing etching time. We attribute this reduction to redeposition of etched material onto the nanohole sidewalls during outward diffusion, effectively narrowing the in-plane opening.
Across all droplet types, the etching depth increased to a maximum at intermediate etching times t e t c h and decreased for prolonged etching. This behavior mirrors that reported for Ga droplets on GaAs and is likely caused by material diffusion from the surrounding semiconductor surface into the nanohole after droplet consumption [20].
We further examined the influence of etching material deposition rate for InAl at deposition rates F I n A l   =   0.2 4.0  Å s−1 at two etching temperatures, T e t c h   =   350   ° C and 460   ° C . As predicted by scaling theory [14], lower growth rates produced larger droplets with lower surface density, and the resulting nanohole and ring structure diameter decreased systematically with increasing deposition flux. Unexpectedly, etching depth did not exhibit a simple correlation with the droplet deposition rate, suggesting that additional factors such as the fixed etching time might have impacted the results.

Supplementary Materials

The following supporting information can be downloaded at https://www.mdpi.com/article/10.3390/cryst15110913/s1, Figure S1: Exemplary HRXRD ω 2 θ -scan of InAlAs on InP.

Author Contributions

Conceptualization, D.R.; validation, D.D.; formal analysis, D.D.; investigation, D.D.; data curation, D.D.; writing—original draft preparation, D.D.; writing—review and editing, D.R.; visualization, D.D.; supervision, D.R.; project administration, D.R.; funding acquisition, D.R. All authors have read and agreed to the published version of the manuscript.

Funding

The authors acknowledge the funding by the the Deutsche Forschungsgemeinschaft (DFG, German Research Foundation)—SFB-Geschäftszeichen TRR142/3-2022—Projektnummer 231447078.

Data Availability Statement

The data supporting this study’s findings are available from the corresponding author upon reasonable request.

Conflicts of Interest

The authors have no conflicts to disclose.

Abbreviations

The following abbreviations are used in this manuscript:
LDELocal droplet etching
QDQuantum dot
MBEMolecular beam epitaxy
AFMAtomic force microscopy
HRXRDHigh-resolution X-ray diffractometry
SEMScanning electron microscopy
GaGallium
AsArsenic
InIndium
AlAluminum
PPhosphor

References

  1. Jiang, L.; Taylor, J.M.; Nemoto, K.; Munro, W.J.; Van Meter, R.; Lukin, M.D. Quantum repeater with encoding. Phys. Rev. A 2009, 79, 032325. [Google Scholar] [CrossRef]
  2. Senellart, P.; Solomon, G.; White, A. High-performance semiconductor quantum-dot single-photon sources. Nat. Nanotechnol. 2017, 12, 1026–1039. [Google Scholar] [CrossRef]
  3. Basso Basset, F.; Valeri, M.; Roccia, E.; Muredda, V.; Poderini, D.; Neuwirth, J.; Spagnolo, N.; Rota, M.B.; Carvacho, G.; Sciarrino, F.; et al. Quantum key distribution with entangled photons generated on demand by a quantum dot. Sci. Adv. 2021, 7, eabe6379. [Google Scholar] [CrossRef]
  4. Hopfmann, C.; Nie, W.; Sharma, N.L.; Weigelt, C.; Ding, F.; Schmidt, O.G. Maximally entangled and gigahertz-clocked on-demand photon pair source. Phys. Rev. B 2021, 103, 075413. [Google Scholar] [CrossRef]
  5. da Silva, S.F.C.; Undeutsch, G.; Lehner, B.; Manna, S.; Krieger, T.M.; Reindl, M.; Schimpf, C.; Trotta, R.; Rastelli, A. GaAs quantum dots grown by droplet etching epitaxy as quantum light sources. Appl. Phys. Lett. 2021, 119, 120502. [Google Scholar] [CrossRef]
  6. Huber, D.; Reindl, M.; Huo, Y.; Huang, H.; Wildmann, J.S.; Schmidt, O.G.; Rastelli, A.; Trotta, R. Highly indistinguishable and strongly entangled photons from symmetric GaAs quantum dots. Nat. Commun. 2017, 8, 15506. [Google Scholar] [CrossRef]
  7. Keil, R.; Zopf, M.; Chen, Y.; Höfer, B.; Zhang, J.; Ding, F.; Schmidt, O.G. Solid-state ensemble of highly entangled photon sources at rubidium atomic transitions. Nat. Commun. 2017, 8, 15501. [Google Scholar] [CrossRef] [PubMed]
  8. Hilska, J.; Chellu, A.; Hakkarainen, T. Nanohole Etching in AlGaSb with Gallium Droplets. Cryst. Growth Des. 2021, 21, 1917–1923. [Google Scholar] [CrossRef]
  9. Deutsch, D.; Buchholz, C.; Zolatanosha, V.; Jöns, K.D.; Reuter, D. Telecom C-band photon emission from (In, Ga)As quantum dots generated by filling nanoholes in In0.52Al0.48As layers. AIP Adv. 2023, 13, 055009. [Google Scholar] [CrossRef]
  10. Deutsch, D.; Zolatanosha, V.; Reuter, D. Local droplet etching with In, Al and InAl in In0.52Al0.48As layers for generation of quantum dots emitting in the optical C-band. J. Cryst. Growth 2025, 668, 128247. [Google Scholar] [CrossRef]
  11. K-Space Associates, Inc. Available online: https://k-space.com/product/bandit/ (accessed on 10 September 2025).
  12. Galiev, G.B.; Vasiliev, A.L.; Imamov, R.M.; Klimov, E.A.; Maltsev, P.P.; Pushkarev, S.S.; Presniakov, M.Y.; Trunkin, I.N. Structural and electrical properties of InAlAs/InGaAs/InAlAs HEMT heterostructures on InP substrates with InAs inserts in quantum well. Crystallogr. Rep. 2014, 59, 900–907. [Google Scholar] [CrossRef]
  13. Heyn, C.; Sonnenberg, D.; Hansen, W. Local Droplet Etching: Self-assembled Nanoholes for Quantum Dots and Nanopillars. In Nanodroplets; Springer: New York, NY, USA, 2013; pp. 363–384. [Google Scholar] [CrossRef]
  14. Venables, J.A.; Spiller, G.D.T.; Hanbucken, M. Nucleation and growth of thin films. Rep. Prog. Phys. 1984, 47, 399–459. [Google Scholar] [CrossRef]
  15. Auler, N.; Deutsch, D.; Reuter, D. Statistical Analysis of the Spatial Distribution of InAl Droplet-Etched Nanoholes in In0.52Al0.48As Layers. Crystals 2025, 15, 770. [Google Scholar] [CrossRef]
  16. Cao, X.; Zhang, Y.; Ma, C.; Wang, Y.; Brechtken, B.; Haug, R.J.; Rugeramigabo, E.P.; Zopf, M.; Ding, F. Local droplet etching on InAlAs/InP surfaces with InAl droplets. AIP Adv. 2022, 12, 055302. [Google Scholar] [CrossRef]
  17. Vonk, V.; Slobodskyy, T.; Keller, T.F.; Richard, M.I.; Fernández, S.; Schulli, T.; Heyn, C.; Hansen, W.; Stierle, A. Faceting of local droplet-etched nanoholes in AlGaAs. Phys. Rev. Mater. 2018, 2, 106001. [Google Scholar] [CrossRef]
  18. Huo, Y.H.; Witek, B.J.; Kumar, S.; Cardenas, J.R.; Zhang, J.X.; Akopian, N.; Singh, R.; Zallo, E.; Grifone, R.; Kriegner, D.; et al. A light-hole exciton in a quantum dot. Nat. Phys. 2013, 10, 46–51. [Google Scholar] [CrossRef]
  19. Zhang, Y.; Grünewald, L.; Cao, X.; Abdelbarey, D.; Zheng, X.; Rugeramigabo, E.P.; Verbeeck, J.; Zopf, M.; Ding, F. Unveiling the 3D Morphology of Epitaxial GaAs/AlGaAs Quantum Dots. Nano Lett. 2024, 24, 10106–10113. [Google Scholar] [CrossRef]
  20. Fuster, D.; González, Y.; González, L. Fundamental role of arsenic flux in nanohole formation by Ga droplet etching on GaAs(001). Nanoscale Res. Lett. 2014, 9, 309. [Google Scholar] [CrossRef]
  21. Heyn, C. Kinetic model of local droplet etching. Phys. Rev. B 2011, 83, 165302. [Google Scholar] [CrossRef]
  22. Heyn, C.; Bartsch, T.; Sanguinetti, S.; Jesson, D.; Hansen, W. Dynamics of mass transport during nanohole drilling by local droplet etching. Nanoscale Res. Lett. 2015, 10, 67. [Google Scholar] [CrossRef] [PubMed]
  23. Li, X.; Wu, J.; Wang, Z.M.; Liang, B.; Lee, J.; Kim, E.S.; Salamo, G.J. Origin of nanohole formation by etching based on droplet epitaxy. Nanoscale 2014, 6, 2675. [Google Scholar] [CrossRef] [PubMed]
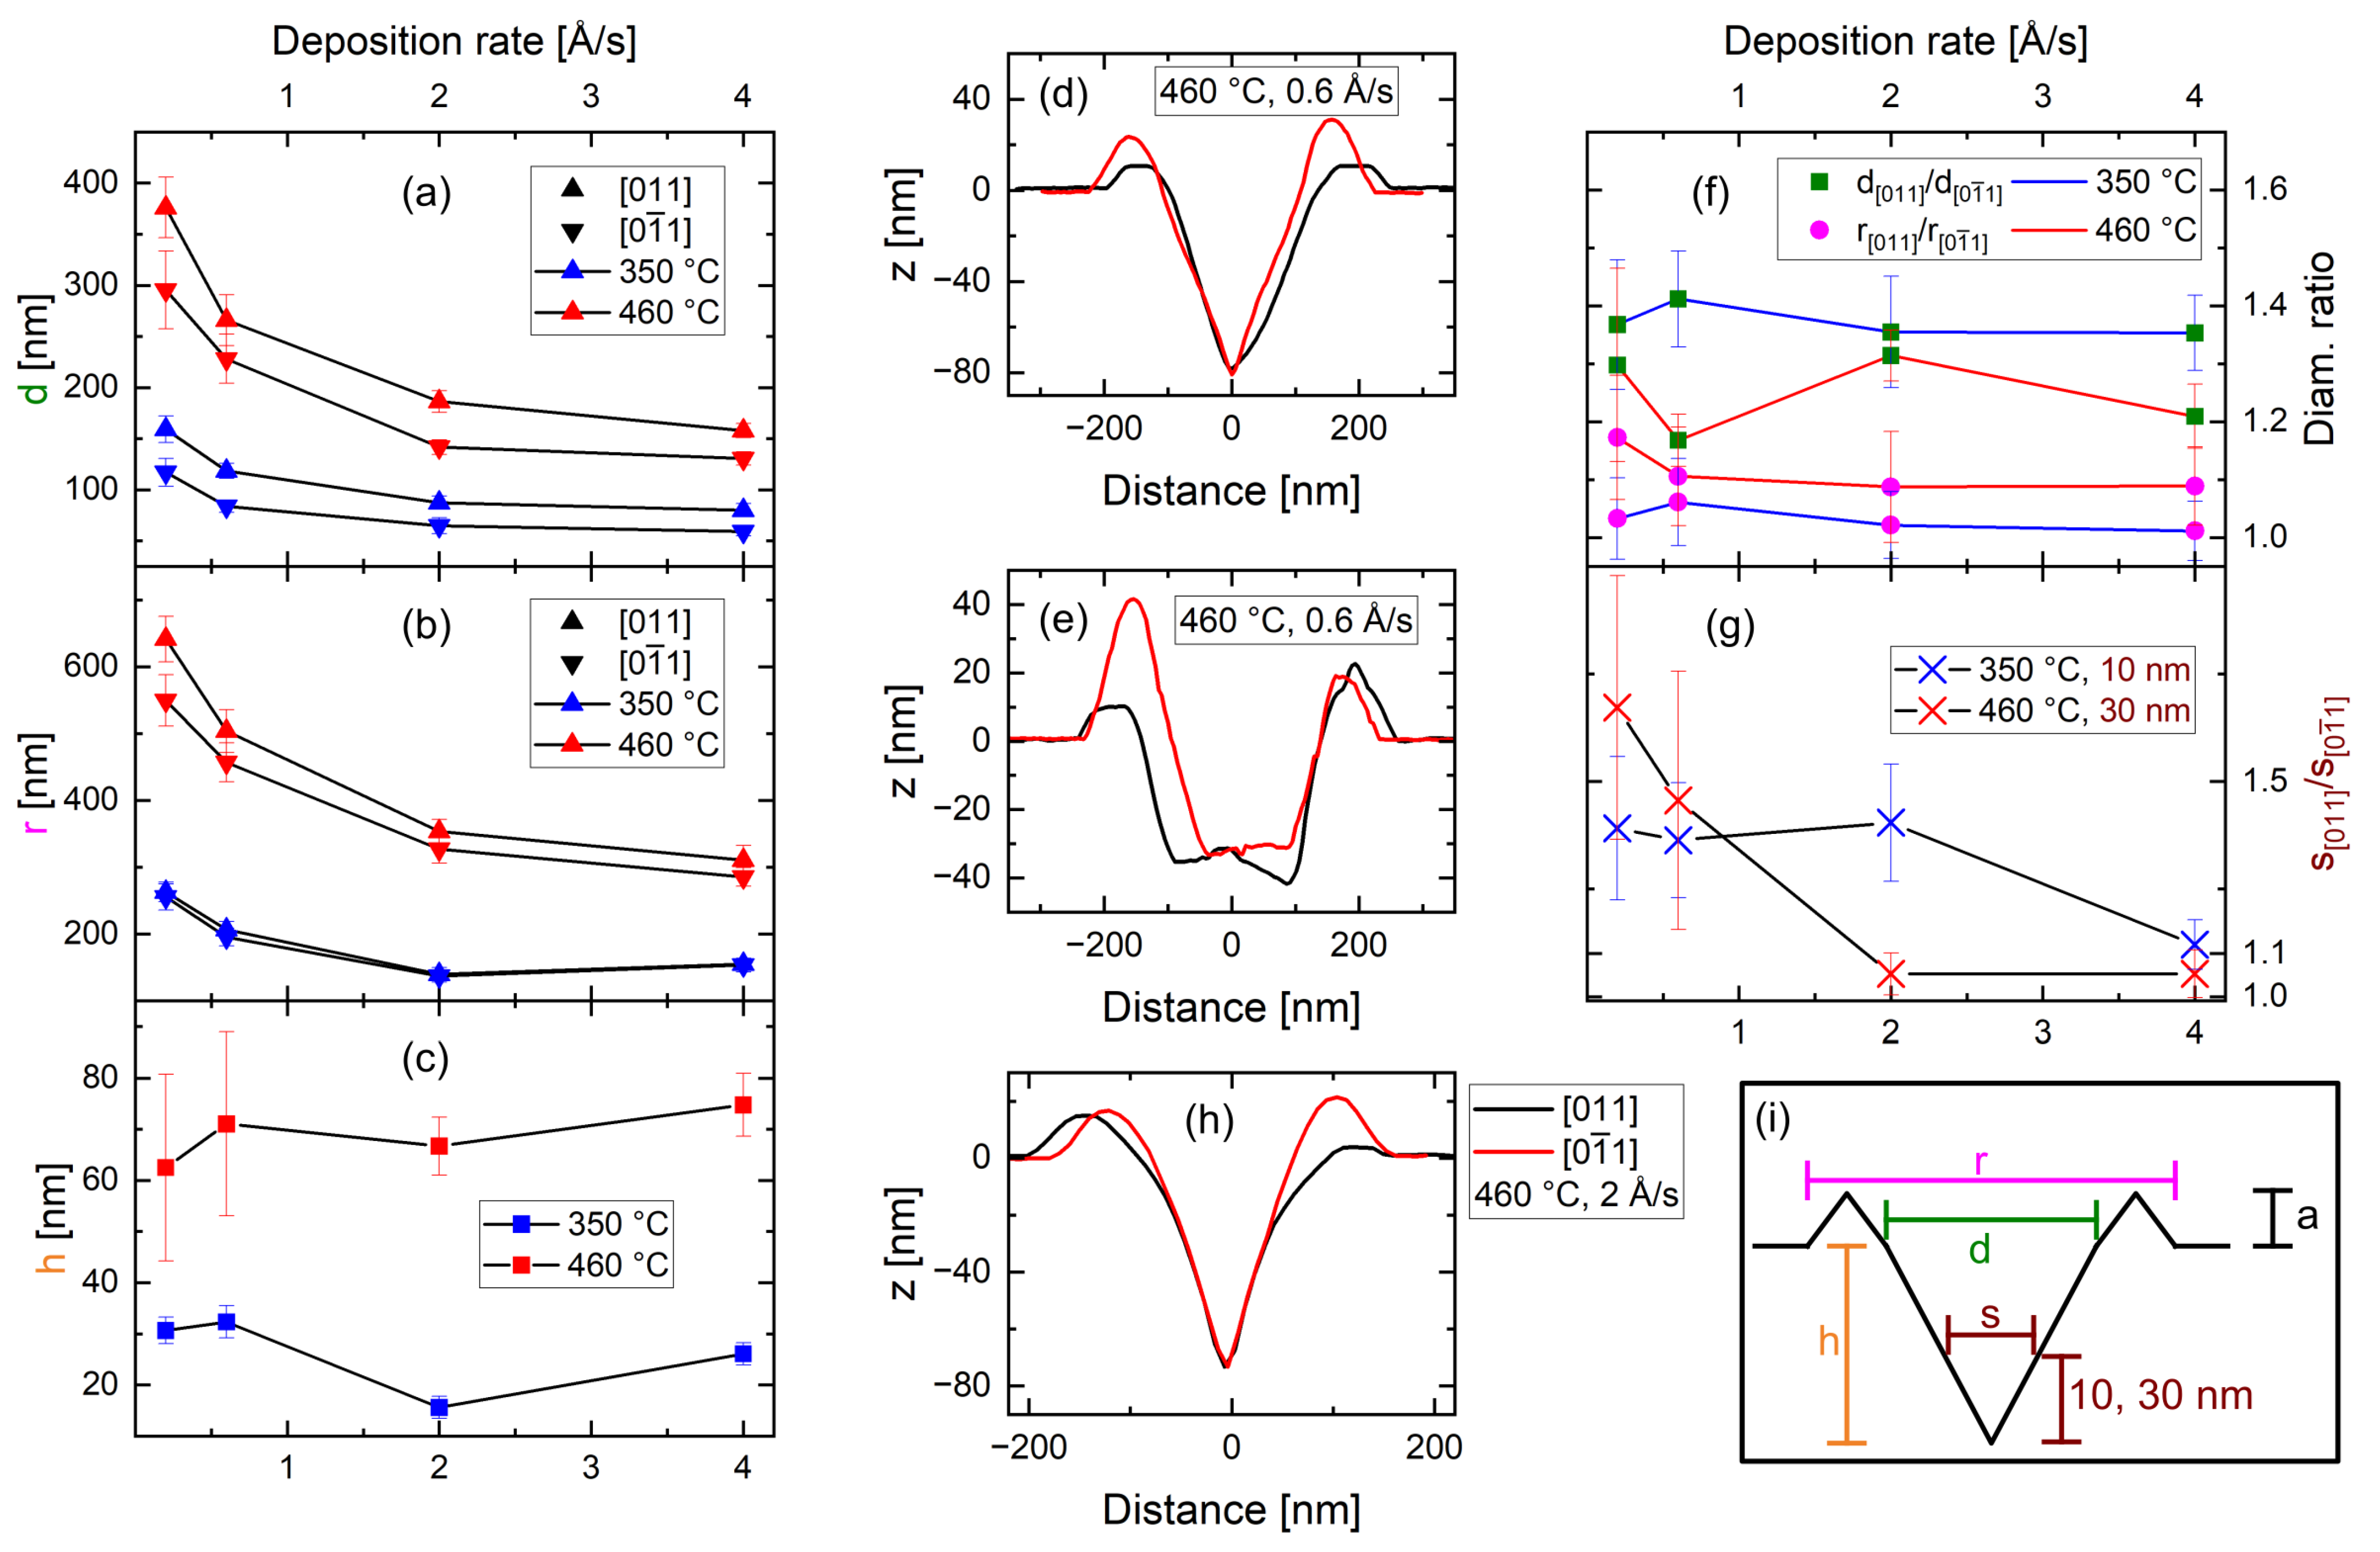
Figure 1. (ac) Average nanohole diameter d, ring diameter r, and nanohole depth h, respectively, as a function of the InAl deposition rate for samples etched at T e t c h   =   350   ° C and T e t c h   =   460   ° C , respectively. (d,e) Exemplary AFM line scans along [ 011 ] and [ 0 1 ¯ 1 ] (see legend in (h)) for the two types of nanoholes formed at T e t c h   =   460   ° C , F I n A l   =   0.2 , and 0.6   Å   s −1. (f) Average diameter ratio d [ 011 ] / d [ 0 1 ¯ 1 ] for the nanohole and r [ 011 ] / r [ 0 1 ¯ 1 ] for the ring-hole structure, respectively (see (i) for the exact definition of the dimensions). (g) Average diameter ratio s [ 011 ] / s [ 0 1 ¯ 1 ] in the nanoholes measured at 10   n m and 30   n m from the bottom of the hole for the T e t c h   =   350   ° C and T e t c h   =   460   ° C samples, respectively. (h) Exemplary AFM line scans along [ 011 ] and [ 0 1 ¯ 1 ] for a single nanohole from T e t c h   =   460   ° C , F   =   2   Å   s −1. (i) Illustration of the dimensions determined from AFM images on individual nanohole structures. n   =   20 nanohole structures were measured for every sample.
Crystals 15 00913 g001
Figure 2. (ac) Average lateral etching depth as a function of the etching time for InAl-, In-, and Al-etched nanoholes, respectively. Al etching produced two distinct types of nanoholes, which were separated by their ring diameter into two separate statistical sets. (df) Average nanohole diameters along the [ 011 ] and [ 0 1 ¯ 1 ] crystallographic directions as a function of the etching time for InAl-, In-, and Al-etched nanoholes, respectively. (g) Examplary AFM image of a sample etched with Al for t e t c h   =   30   s , showing the bimodal distribution of nanoholes on the Al-etched samples.
Crystals 15 00913 g002
Figure 3. (a,b) Line scans along [ 011 ] of selected nanoholes from Al and In etching, respectively. The nanoholes are chosen to represent the statistical average from their respective measurement set.
Crystals 15 00913 g003
Disclaimer/Publisher’s Note: The statements, opinions and data contained in all publications are solely those of the individual author(s) and contributor(s) and not of MDPI and/or the editor(s). MDPI and/or the editor(s) disclaim responsibility for any injury to people or property resulting from any ideas, methods, instructions or products referred to in the content.