Article

X-Ray Crystallography, Hirshfeld Surface Analysis, and Molecular Docking Studies of Two Sulfonamide Derivatives

by
José Luis Madrigal-Angulo
1,
Nancy E. Magaña-Vergara
2,
Juan Saulo González-González
3,
José Martín Santiago-Quintana
4,
Efrén V. García-Báez
4,
Itzia I. Padilla-Martínez
4,* and
Francisco J. Martínez-Martínez
1,*
1
Facultad de Ciencias Químicas, Universidad de Colima, Km 9 Carretera Coquimatlán-Colima, Coquimatlán 28400, Mexico
2
Secretaria de Ciencia, Humanidades, Tecnología e Innovación—Facultad de Ciencias Químicas, Universidad de Colima, Km 9 Carretera Coquimatlán-Colima, Coquimatlán 28400, Mexico
3
Instituto de Farmacobiología, Universidad de la Cañada, Carretera Teotitlán-San Antonio Nanahuatipán, km 1.7 s/n, Teotitlán de Flores Magón, Oaxaca 68540, Mexico
4
Laboratorio de Química Supramoleculary Nanociencias, Unidad Profesional Interdisciplinaria de Biotecnología, Instituto Politécnico Nacional, Av. Acueducto s/n Barrio la Laguna Ticomán, Ciudad de México 07340, Mexico
*
Authors to whom correspondence should be addressed.
Crystals 2025, 15(10), 854; https://doi.org/10.3390/cryst15100854
Submission received: 27 August 2025 / Revised: 18 September 2025 / Accepted: 24 September 2025 / Published: 30 September 2025
(This article belongs to the Section Inorganic Crystalline Materials)

Abstract

This work reports the crystallographic study of two benzenesulfonamides, 1 ((E)-N-benzyl-3-((benzylimino)methyl)-4-hydroxybenzenesulfonamide) and 2 (N-benzyl-3-(3-(N-benzylsulfamoyl)-2-oxo-2H-chromene-6-sulfonamide). These compounds share structural features with belinostat, an FDA-approved histone deacetylase (HDAC) inhibitor used in the treatment of peripheral T-cell lymphoma. Compound 1 contains one sulfonamide group, meanwhile compound 2 contains two sulfonamide moieties and presents four independent molecules in its unit cell. The crystal packing of 1 and 2 is mainly governed by N–H···O=S hydrogen bonding interactions. π → π* and n → π* stacking interactions also contribute to the molecular assembly. Hirshfeld surface (HS) analysis was carried out to further examine the intermolecular interactions of compounds 1 and 2, revealing that N–H∙∙∙O and C–H∙∙∙O hydrogen bonding interactions, along with O∙∙∙H/H∙∙∙O interactions, are the strongest contributors to the individual surfaces. Interaction energy analysis was also performed to evaluate the relative strength and nature of the intermolecular contacts. Additionally, molecular docking studies of compounds 1 and 2 were performed on the crystal structure of the enzyme HDAC2, an enzyme overexpressed in several cancers, particularly breast cancer. The results revealed that both compounds exhibit a binding mode and binding energies similar to those of belinostat, suggesting their potential as novel therapeutic agents.

1. Introduction

Sulfonamides are a privileged class of compounds with a broad spectrum of pharmacological activities, including antibacterial, anti-inflammatory, hypoglycemic, and antiproliferative effects, among others [1]. Their activity arises from their ability to form hydrogen bonds as both acceptors and donors, enabling interactions with diverse pharmacological targets [2].
Coumarin sulfonamide derivatives have demonstrated various biological activities such as antimicrobial, antiviral, antifungal and anticancer [3]. Compounds 1 ((E)-N-benzyl-3-((benzylimino)methyl)-4-hydroxybenzenesulfonamide) and 2 (N-benzyl-3-(3-(N-benzylsulfamoyl)-2-oxo-2H-chromene-6-sulfonamide) are benzenesulfonamides, synthesized from a coumarin scaffold (Scheme 1). In compound 1, an imine was formed following the opening of the lactone heterocycle, whereas compound 2, retaining the 3-benzoylcoumarin scaffold, features a double sulfonamide moiety. Their synthesis has been reported elsewhere [4]. Compounds 1 and 2 are structurally related to the commercially available drug belinostat (Figure 1), a histone deacetylase (HDAC) inhibitor used in the treatment of peripheral T-cell lymphoma [5]. Both compounds exhibited in vitro antiproliferative activity comparable to that of cisplatin, doxorubicin, and belinostat over MCF-7 and MDA-MB-231 breast cancer cell lines [4].
The crystal structure of belinostat has already been reported, with various studies describing its crystalline forms, solvates, and co-crystals. The patent WO2018020406A1 describes two crystalline forms of belinostat: an acetone solvate and Form I, an anhydrous crystalline form [6]. The preparation of eight belinostat solvates with hydrogen-bond acceptor-type solvents, of which six crystal structures were determined by single-crystal X-ray diffraction, was reported [7]. Furthermore, four belinostat co-crystals with the coformers isonicotinamide, isoniazid, theophylline, and L-proline were obtained [8]. These reports allow us to compare the structural features in the crystal packing between belinostat and compounds 1 and 2.
In this work, we report the crystallographic study, Hirshfeld surface (HS) analysis, and interaction energy analysis of two sulfonamide derivatives. Molecular docking studies were also performed to predict the possible binding modes of compounds 1 and 2 within the HDAC2 active site.

2. Materials and Methods

2.1. Substances and Equipment

All compounds were used as received from Sigma-Aldrich. All reactions were monitored by TLC. The 1H and 13C were recorded on a Bruker Ultrashield plus 400 MHz instrument (400 and 100 MHz, respectively) using DMSO-d6 and acetone-d6 as solvents and TMS as reference. Chemical shifts (δ) are given in parts per million and signal multiplicities are expressed as s (singlet), d (doublet), t (triplet), q (quartet), m (multiplet), and br (broad singlet). IR spectra were collected using a Varian 3100 FT-IR EXCALIBUR series spectrophotometer (Varian Inc., California, USA). Melting points were measured on an Electrothermal Mel-Temp 1201D apparatus (Electro Thermal, California, USA).

2.2. Synthesis of Compounds

Compounds 1 and 2 were prepared as reported [4] and purified by column chromatography using hexane: ethyl acetate mobile phases in ratios of 5:5 and 2:8, respectively. Slow evaporation of the mixture provided suitable colorless crystals of compound 2. Recrystallization from dichloromethane yielded suitable yellow needle-shaped crystals of compound 1.

2.3. Single Crystal X-Ray Diffraction

The crystallographic data have been deposited in the Cambridge Crystallographic Data Centre as supplementary publication numbers CCDC 1 (2384467), 2 (2385727). Single crystal X-ray diffraction data of molecules 1 and 2 were collected on a Bruker AXS D8 Quest diffractometer with Mo radiation (Kα, λ = 0.71073 Å) at 293.15 (2) K. SAINT V8.34A (Bruker, Mexico S.A de C.V, Mexico) [9,10,11], SORTAV (University of Glasgow, Glasgow, UK) [12], and WinGX Version 2023.1 (University of Glasgow, Glasgow, UK) [13] software were used to perform the cell refinement and data reduction of 1 and 2. The structure was solved by SHELXT version 2014/4 (University of Göttingen, Göttingen, Germany). SHELX2014 program [14] was used to perform the final refinement by full-matrix least-squares methods. All heavy atoms (C, O, and Cl) were anisotropically refined. Hydrogen atoms on C were geometrically positioned and treated as riding atoms or directly with C–H 0.95–0.99 Å, and Uiso(H) = 1.2 eq(C) or 1.5 eq(C). The visualization, molecular graphics, and analysis of crystal structures were performed with Platon version 2008 (Utrecht University, Utrecht, Netherlands) [15] and Mercury version 2.0 (Cambridge Crystallographic Data Centre, Cambridge, UK) [16] software.

2.4. Hirshfeld Surfaces, Interaction Energies, and Energy Framework Diagrams Calculations

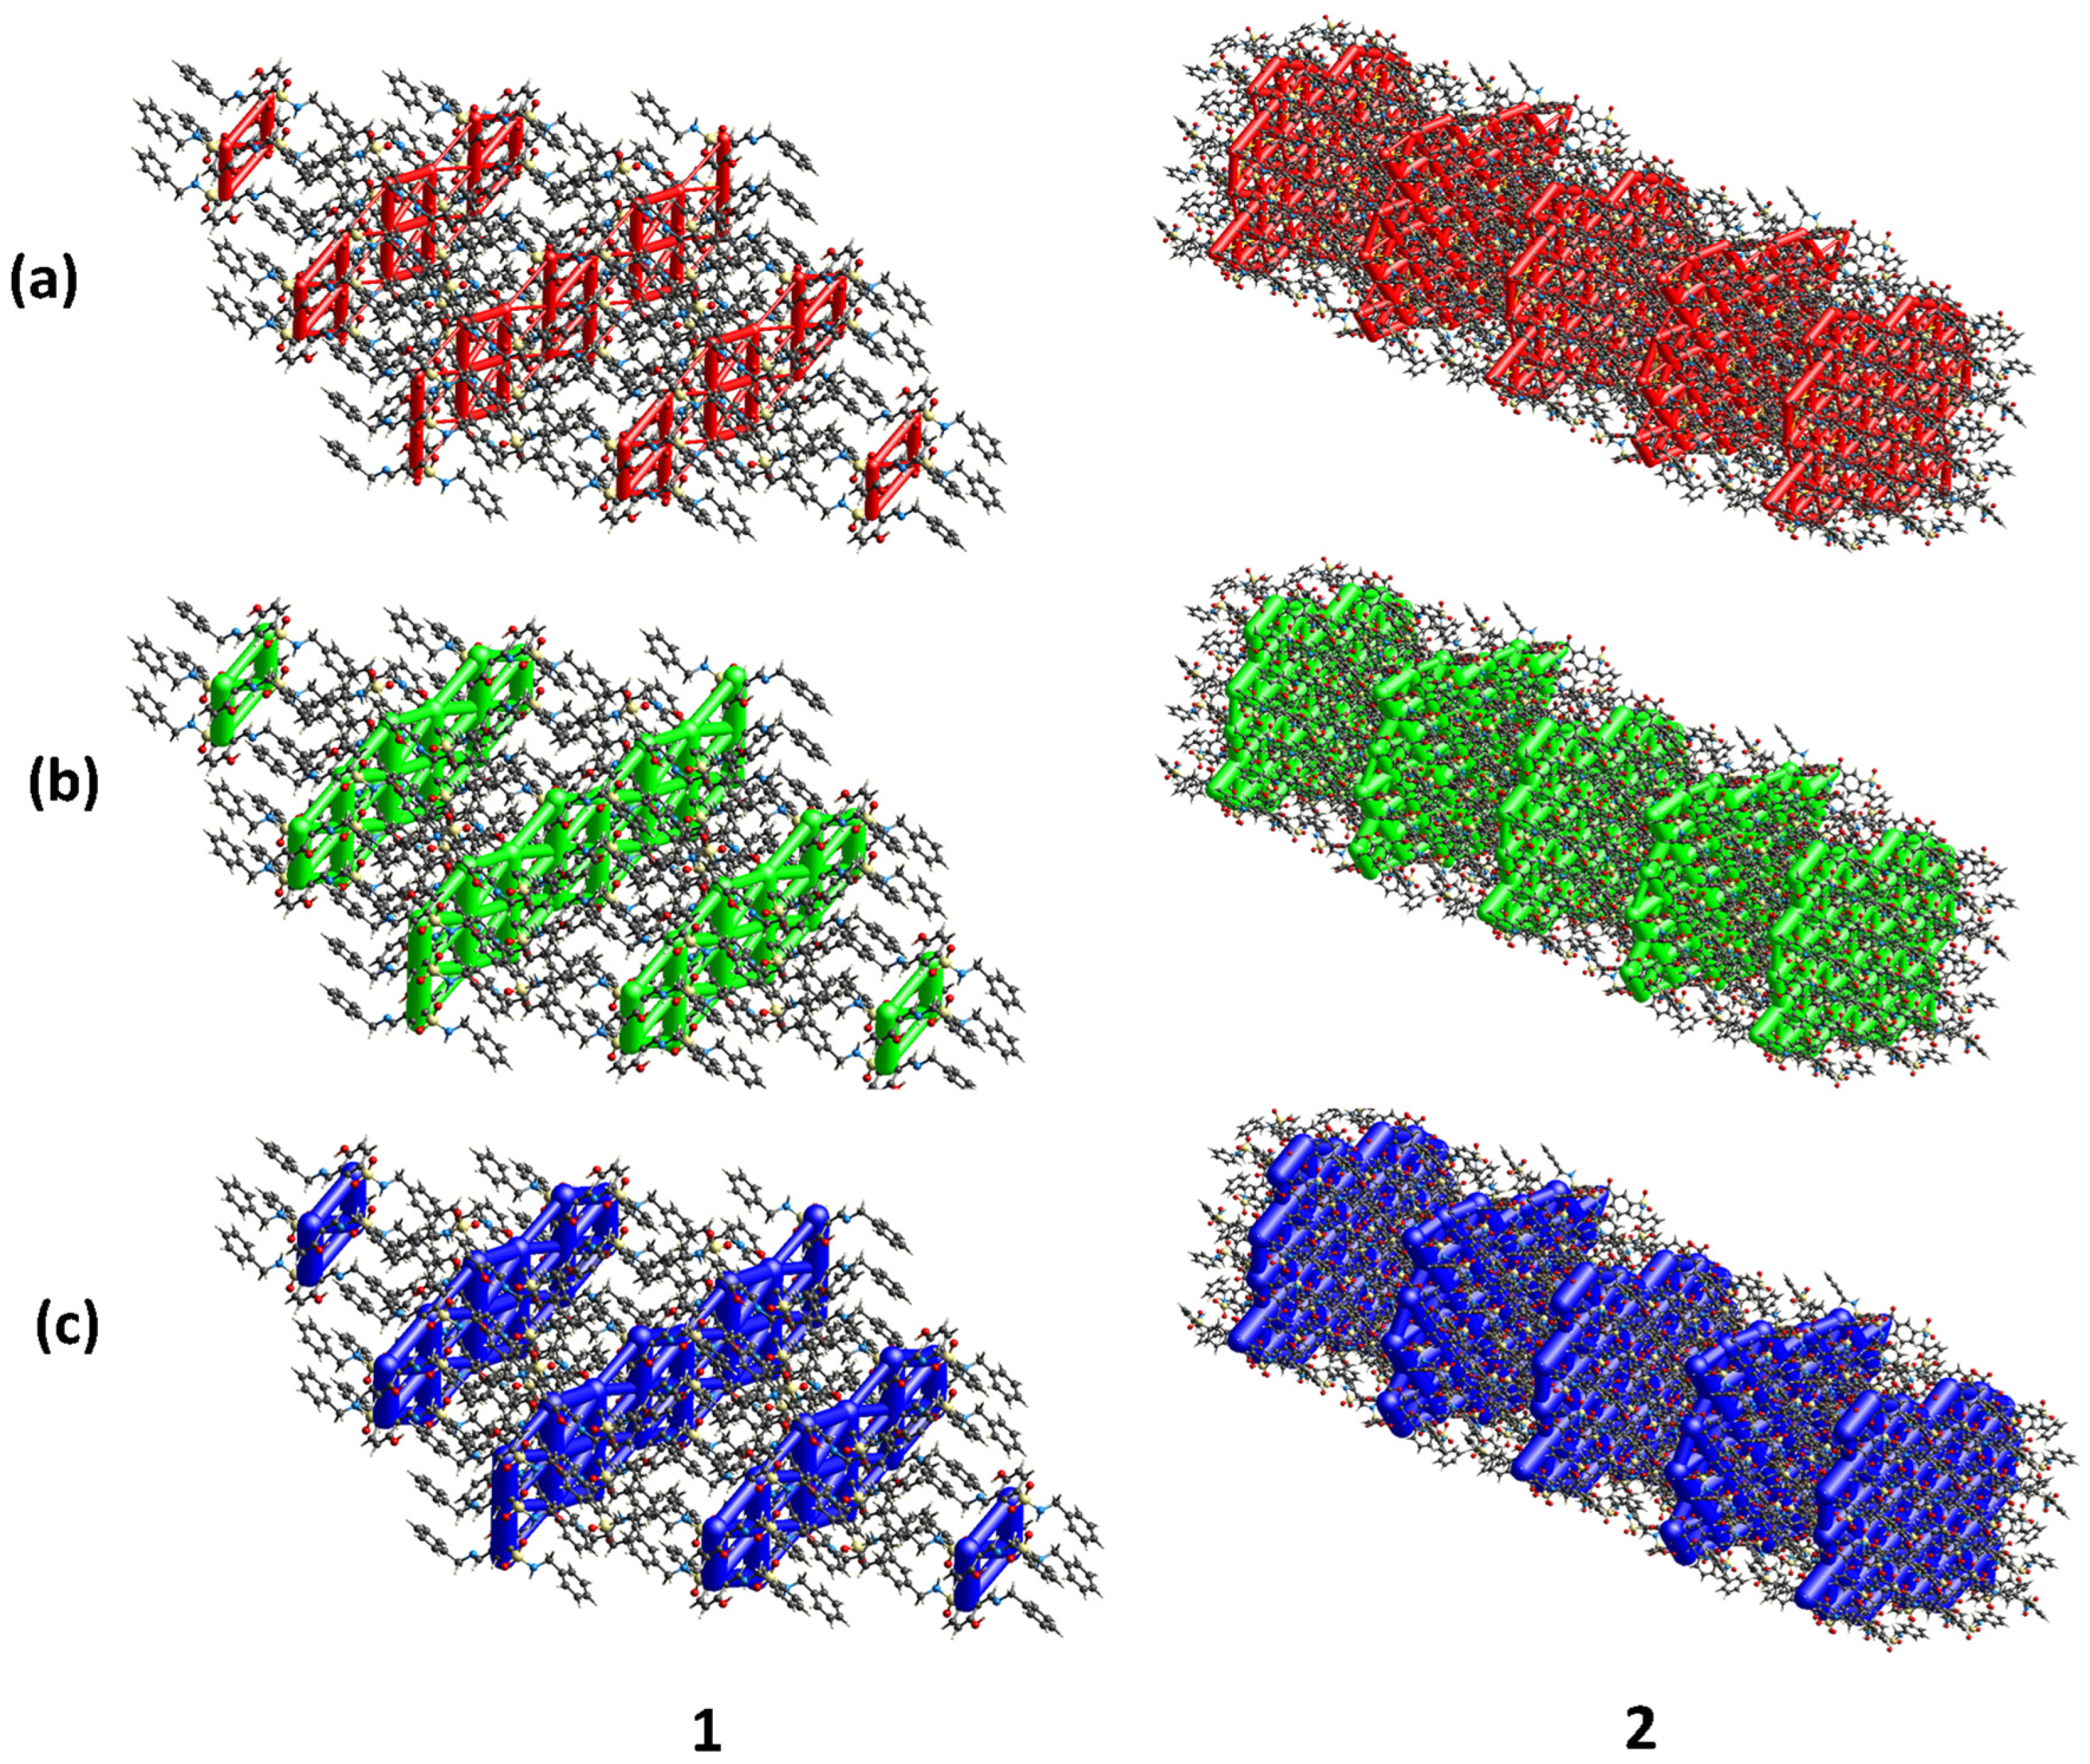
These calculations were performed with CrystalExplorer 21.5 software [17]. The Hirshfeld surfaces (HSs) were mapped as reported [18]. The Hirshfeld surfaces (HSs) [19], intermolecular interactions, and their reciprocal fingerprints [18,20] were determined as reported [21]. The energy components were calculated using the Gaussian 09 software [22] at the B3LYP/6-31G (d,p) theory, after applying the scale factors [23], the % contribution of the individual components to the stabilization energy was calculated. The energy distribution in the crystal network was depicted as frameworks [20,24] of Eelect, Edisp, and Etot in a 23 unit cells, and a 5.0 Å radius, with a tube size of 150 kJ mol−1, and a cut-off value of 10 kJ mol−1.

2.5. Molecular Docking Modeling

The structure of HDAC2 was obtained from the Protein Data Bank using accession code 4LXZ [25]. All water molecules and co-crystallized ligands were removed from the crystallographic structure. The grid box was centered on the co-crystallized ligand vorinostat (x = 19.3, y = −18.2, z = −1.1) with dimensions of 20 × 20 × 20 Å (x, y, z) within the HDAC2 active site. In all simulations, the ligands were flexible, while the protein remained static. Protein-ligand interaction diagrams in both 2D and 3D were generated using Discovery Studio Visualizer 2021 [26]. Validation of the protocol was carried out with AutoDock Vina in UCSF Chimera 1.16 [27] by redocking the co-crystallized ligand vorinostat. The 3D structures of compounds 1 and 2 were built using Maestro 13.3 [28] and docked into the active site of HDAC2 (4LXZ) using the previously defined grid box centered on the crystallographic coordinates of vorinostat.

3. Results and Discussions

3.1. Single Crystal X-Ray Diffraction Analysis

3.1.1. Molecular Structure of Compounds 1 and 2

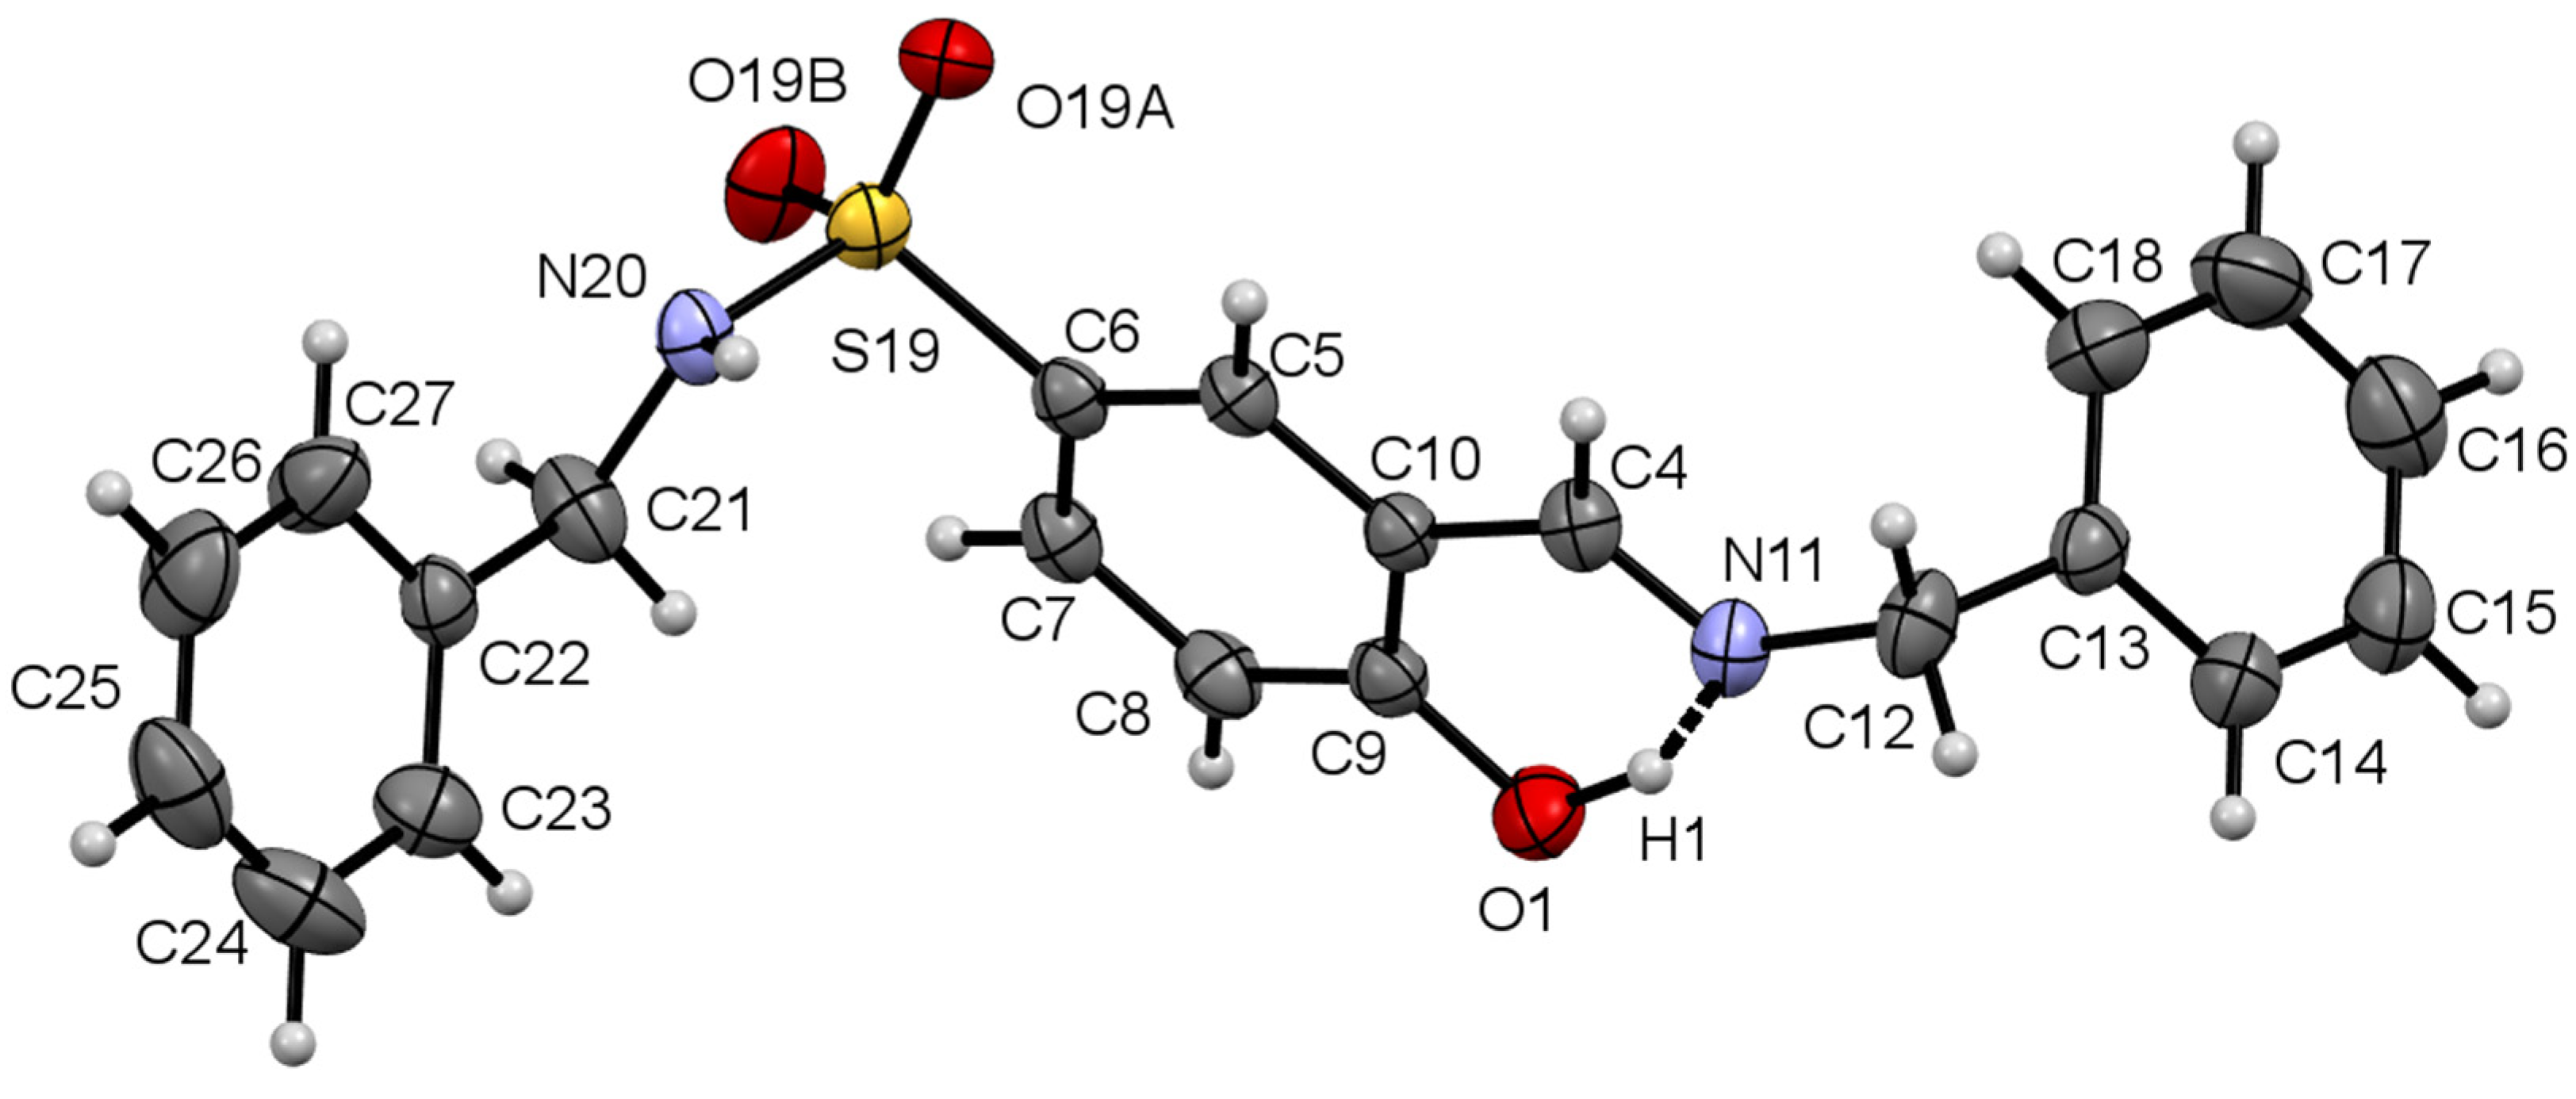
Relevant crystallographic data of 1 and 2 are listed in Table 1. Compound 1 only showed a single independent molecule; meanwhile, four crystallographically independent molecules were found in the unit cell of compound 2 (labeled as 2A, 2B, 2C, and 2D). The ORTEP diagrams of compounds 1 and a representative independent molecule of 2 (2A) are shown in Figure 2 and Figure 3, respectively. The ORTEP diagrams of the remaining independent molecules are provided in the Supplementary Material (Figure S3). Compound 1 crystallizes in the monoclinic crystal system and P21/n space group with four molecules in the unit cell. This molecule presents a syn conformation between the imine C=N and the phenolic O–H groups. This molecule presents an E conformation about the C=N bond, stabilized by an intramolecular S(6) (six-membered) hydrogen bonding interaction between the OH group and the imine nitrogen: O1–H1…N11. This intramolecular interaction keeps the imine C=N group in the same plane as the central aromatic ring, with a torsion angle for C9–C10–C4–N11 of 0.9(5)°.
Selected bond lengths and torsion angles of compounds 1 and 2 (average values of 2A, 2B, 2C, and 2D) are listed in Table 2. The complete data can be found in the Supplementary Material (Tables S1–S15). The bond lengths C4=N11 and S19=O19A in compound 1 [1.275(5) and 1.435(2) Å, respectively], and C2=O2, C3=C4, C11=O11, and S18=O18A in compound 2 [1.204(7), 1.340(8), 1.204(8), and 1.438(5) Å, respectively], indicate double-bond character. The single C–S, S–N, and N–C bond lengths are in the ranges of 1.752(3)–1.766(5) Å, 1.605(4)–1.614(3) Å, and 1.466(5)–1.447(7) Å, respectively. These values are comparable to those reported for similar molecules [29,30,31,32,33].
Compound 2 crystallizes in the monoclinic space group Cc with four independent molecules in the unit cell. These four molecules are arranged in two pairs, where each pair is interlinked by N–H···O=S and C–H···O=C intermolecular hydrogen bonds (Figure S1). The superposition of the four independent molecules is shown in Figure S2. The exocyclic and lactone carbonyls present an anti conformation with respect to each other. The 2H-chromene ring system is planar (O1–C9–C10–C4: 1.025(7)°). The benzoyl moiety is almost perpendicular to the coumarin mean plane (C4–C3–C11–O11: −96.975(8)°). Similarly, both sulfonamide moieties are almost perpendicular to the aromatic rings (C5–C6–S27–N28: 98.275(4)°, C13–C14–S18–N19: 94.375(4)°). In the independent molecules 2A, 2C, and 2D, two intramolecular hydrogen bonds C13X–H13X…O18Y and C15X–H15X…O18Y (X = A, C, D, Y = A–B, E–H) define an  S 2 2 (8)[S(5)S(5)] pattern (Figure 3 and Figure S3). In 2C, the intramolecular hydrogen bonds C5C–H5C…O27E and C7C–H7C…O27F define the same pattern. The intramolecular three-center hydrogen bond O18B…H13B…O18C in 2C leads to an almost completely planar arrangement in the structure (C13B–C12B–C11B–O11B: 1.3(16)°).
It is worth making a brief comparison between compounds 1 and 2 and belinostat. Like compound 2, three of the six crystal structures of belinostat crystallize in the monoclinic crystal system and the P21/c space group [7]. In compound 2, the C3=C4 double bond is coplanar with the aromatic ring (C3–C4–C10–C9: 0.62(7)°). In contrast, in belinostat, the semiflexible nature of the molecule allows torsion angles relative to the central aromatic ring to vary from −179.15(18)° to 17.8(14)°. Compound 1, on the other hand, features an imine instead of the α,β-unsaturated system, which remains coplanar with the central aromatic ring (C9–C10–C4–N11: 0.9(5)°) due to an intramolecular hydrogen-bonding interaction. In the sulfonamide region, compounds 1 and 2 feature a benzyl moiety with an additional methylene group compared to belinostat, providing greater conformational flexibility.

3.1.2. Crystal Packing of Compounds 1 and 2

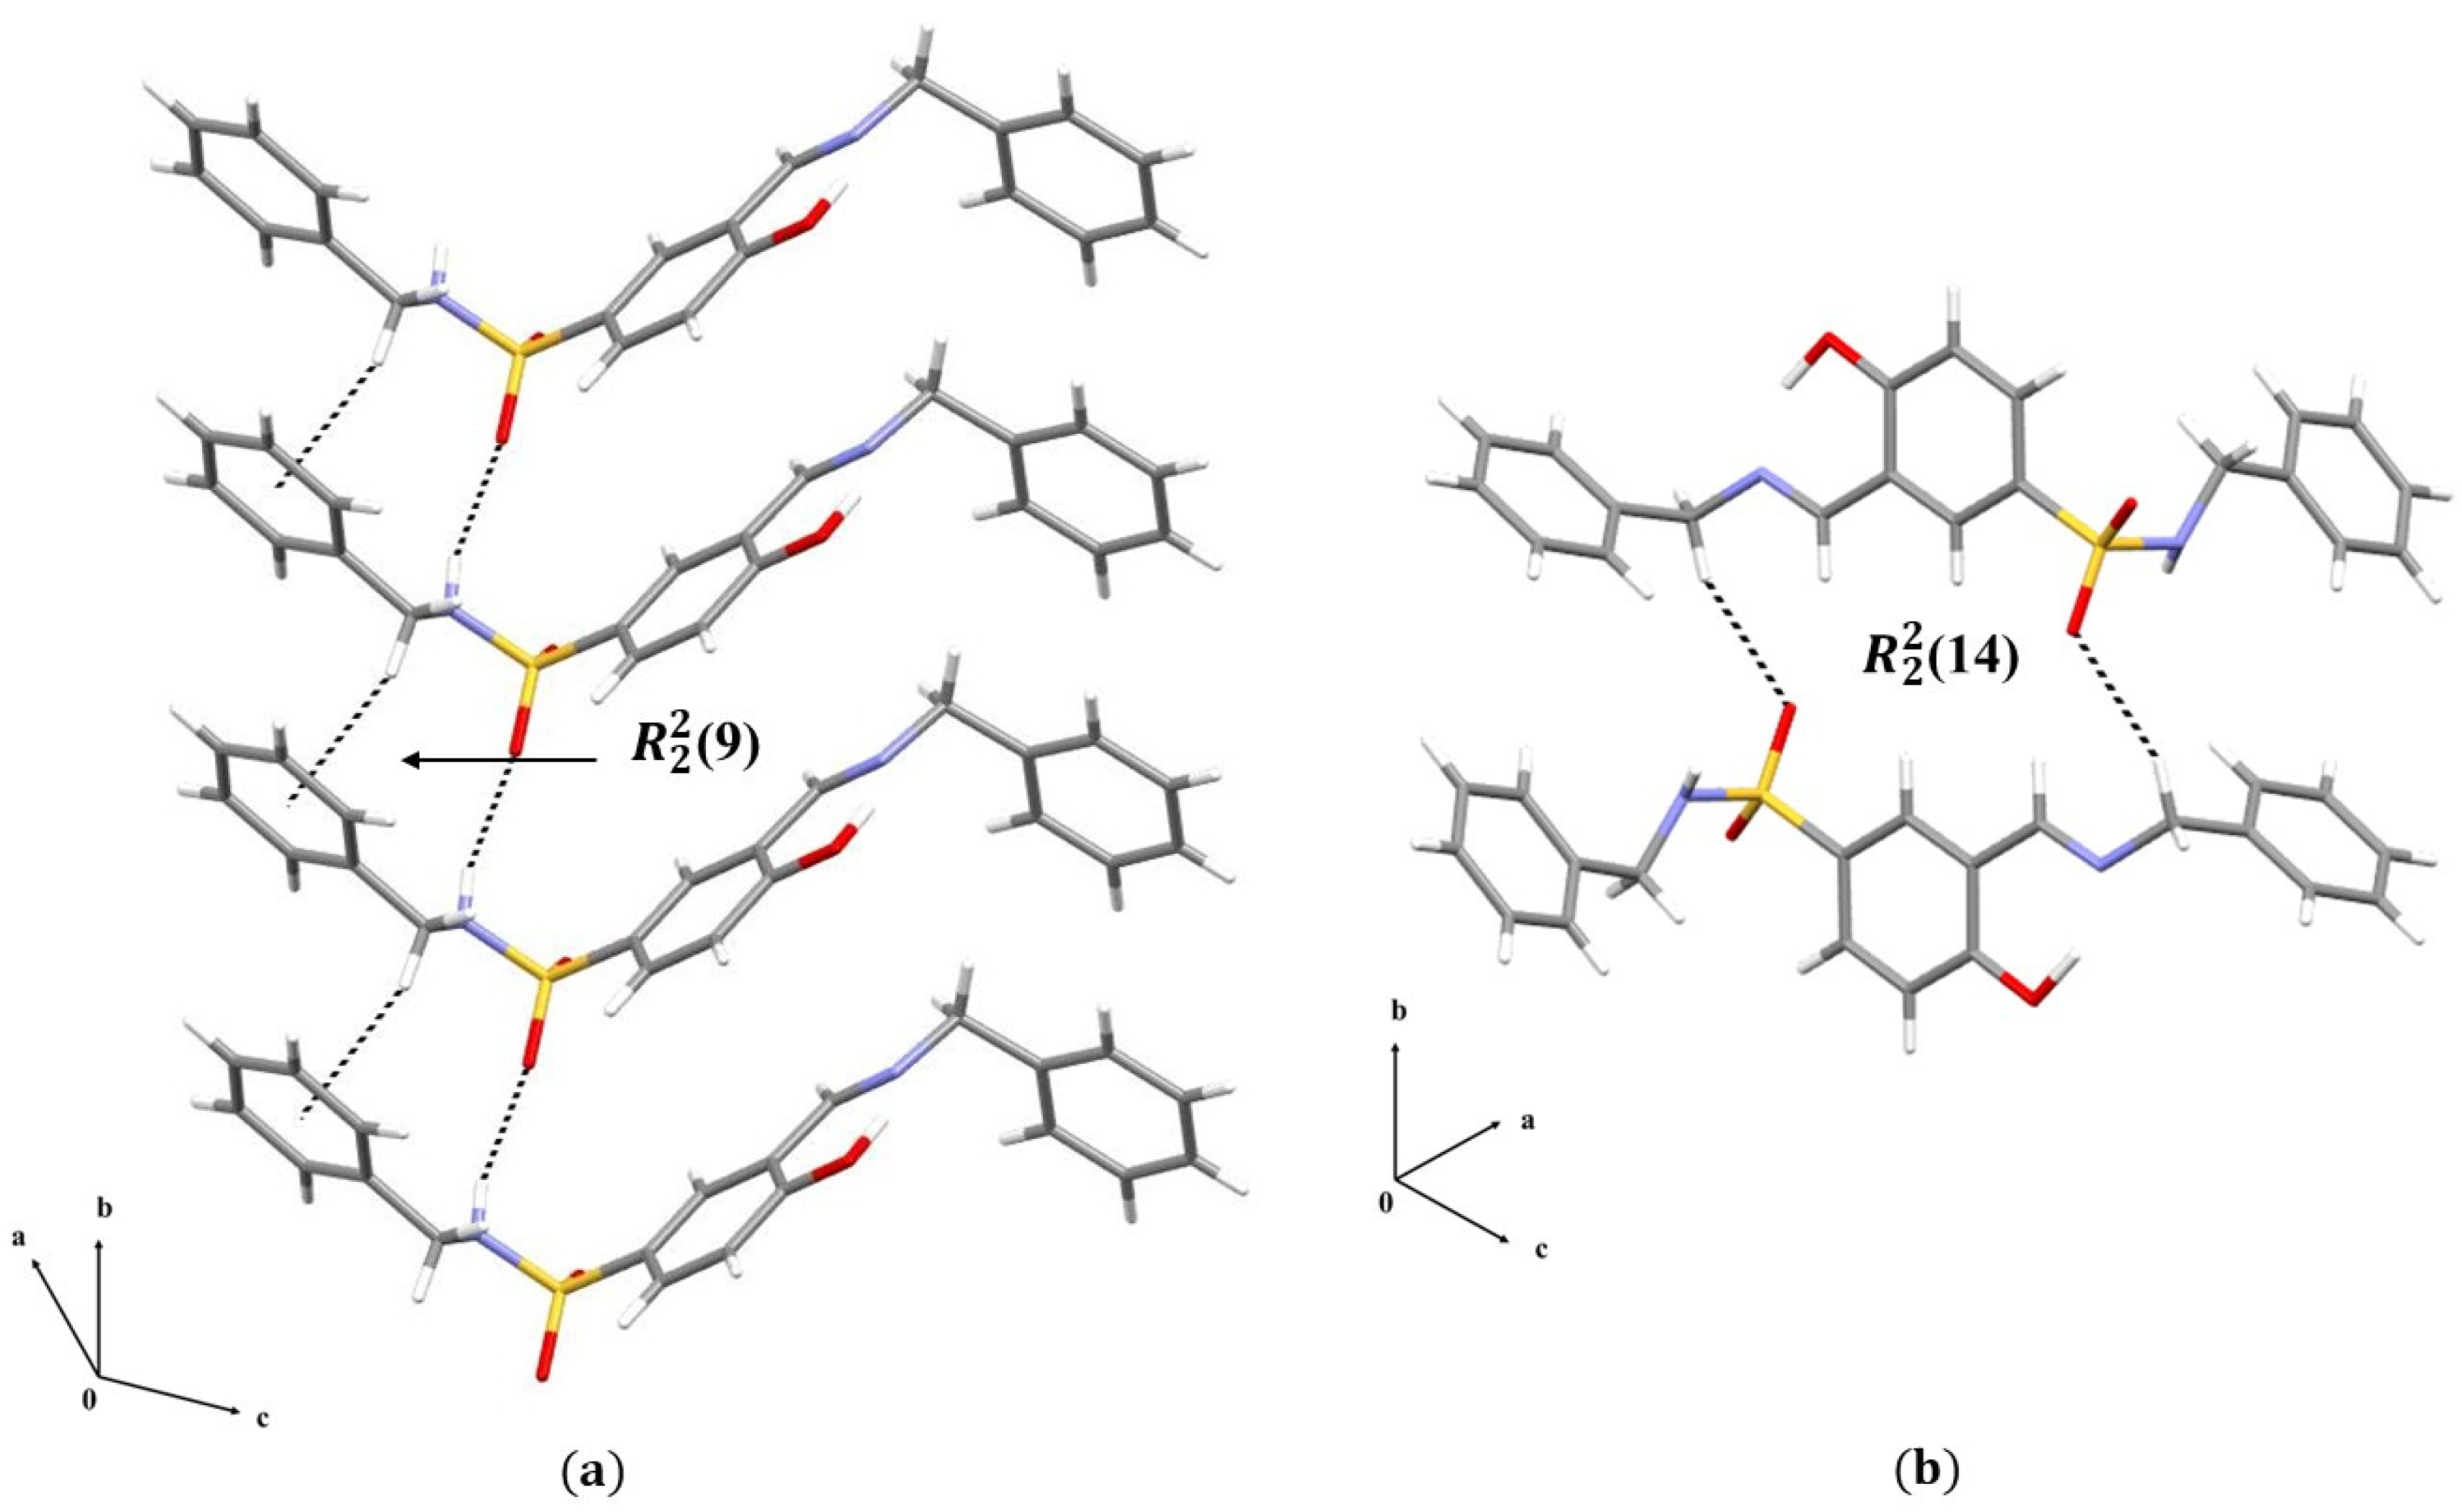
The intermolecular hydrogen bonding interactions and their geometric parameters are listed in Table 3. The supramolecular structure of 1 is defined by N20–H20···O19B interactions, which form C(4) chains in a similar way to the crystal structure of belinostat [34] and the 4-methyl-N-(4-methyl-benz-yl)benzene-sulfonamide [35]. This motif propagates along the b axis, forming a ribbon-like structure (Figure 4a). This network is also stabilized by C–H…π interactions, C21–H21B…Cg(3) (C22–C27), with a C…π distance of 3.715(4) Å, which also propagates along the b axis. The N20–H20···O19B and C21—H21B…Cg(3) interactions assemble as an R22(9) ring motif. The third dimension is provided by the self-complementary C12–H12…O19A interaction, which forms an R22(14) ring motif and centrosymmetric dimers running in the ac plane (Figure 4b).
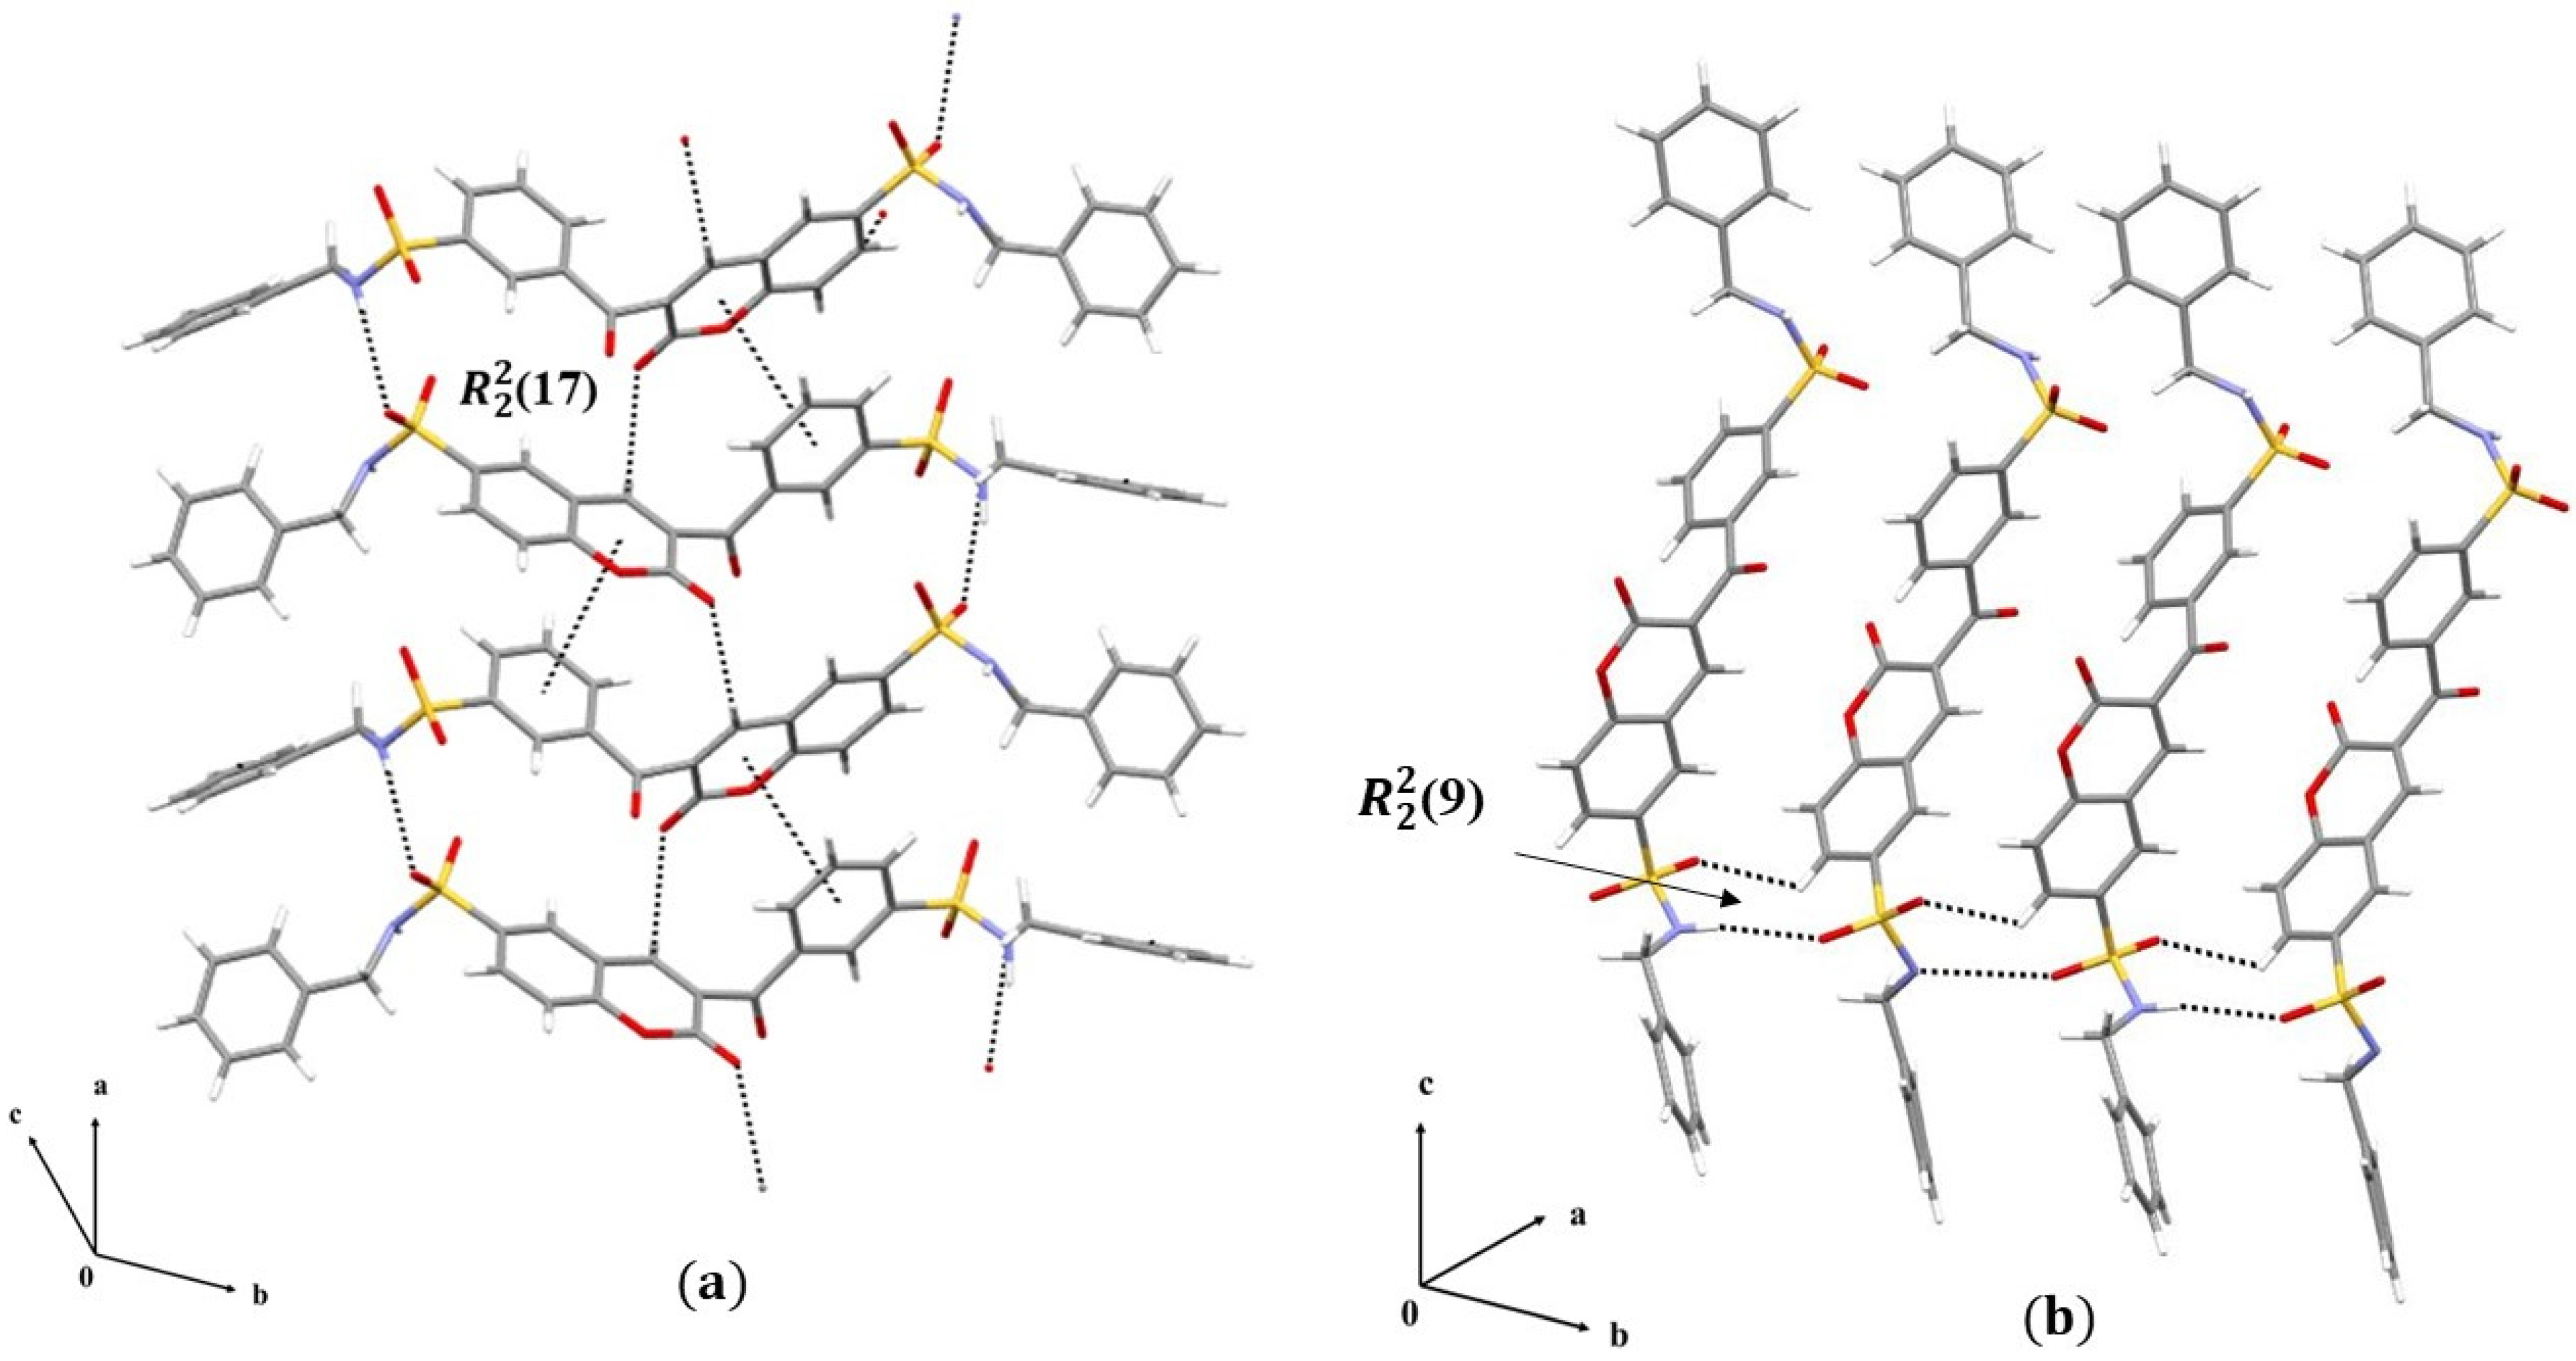
The four independent molecules (2A, 2B, 2C, and 2D) exhibit the same four hydrogen bonds (Table 3). The supramolecular structure of 2 (Figure 5) is given by N19X–H19X….O27Y (X = A–D, Y = A–H) interactions arranged in a head-to-tail orientation, forming C(14) chains and a ribbon-like structure that propagates along the a axis (Figure 5a). This association is complemented by C4X–H4X….O2X interactions, which form C(5) chains that also propagate along the a axis. N19X–H19X….O27Y and C4X–H4X….O2X interactions assemble as an R22(17) ring motif. Additionally, the lactone ring Cg(1) (O1, C2, C3, C4, C9, C10) and the phenyl ring Cg(3) (C12–C17) are interacting through parallel displaced π….π interactions with intercentroid distances from 4.051 to 4.073 Å, which are consistent with those previously reported in the literature for very weak π…π interactions [36,37,38,39]. On the other hand, N28X–H28X…O27Y and C7X–H7X…O27Y interactions propagate along the ab plane (Figure 5b), forming an R22(9) ring motif. In these interactions, the molecules are arranged in a head-to-head manner. It is worth noting that, although compound 2 bears two nearly identical sulfonamide moieties, the N28X–H28X…O27Y hydrogen bond is significantly weaker than the N19X–H19X…O27Y interaction (see Table 3 for details).

3.2. Hirshfeld Surface (HS) Analysis

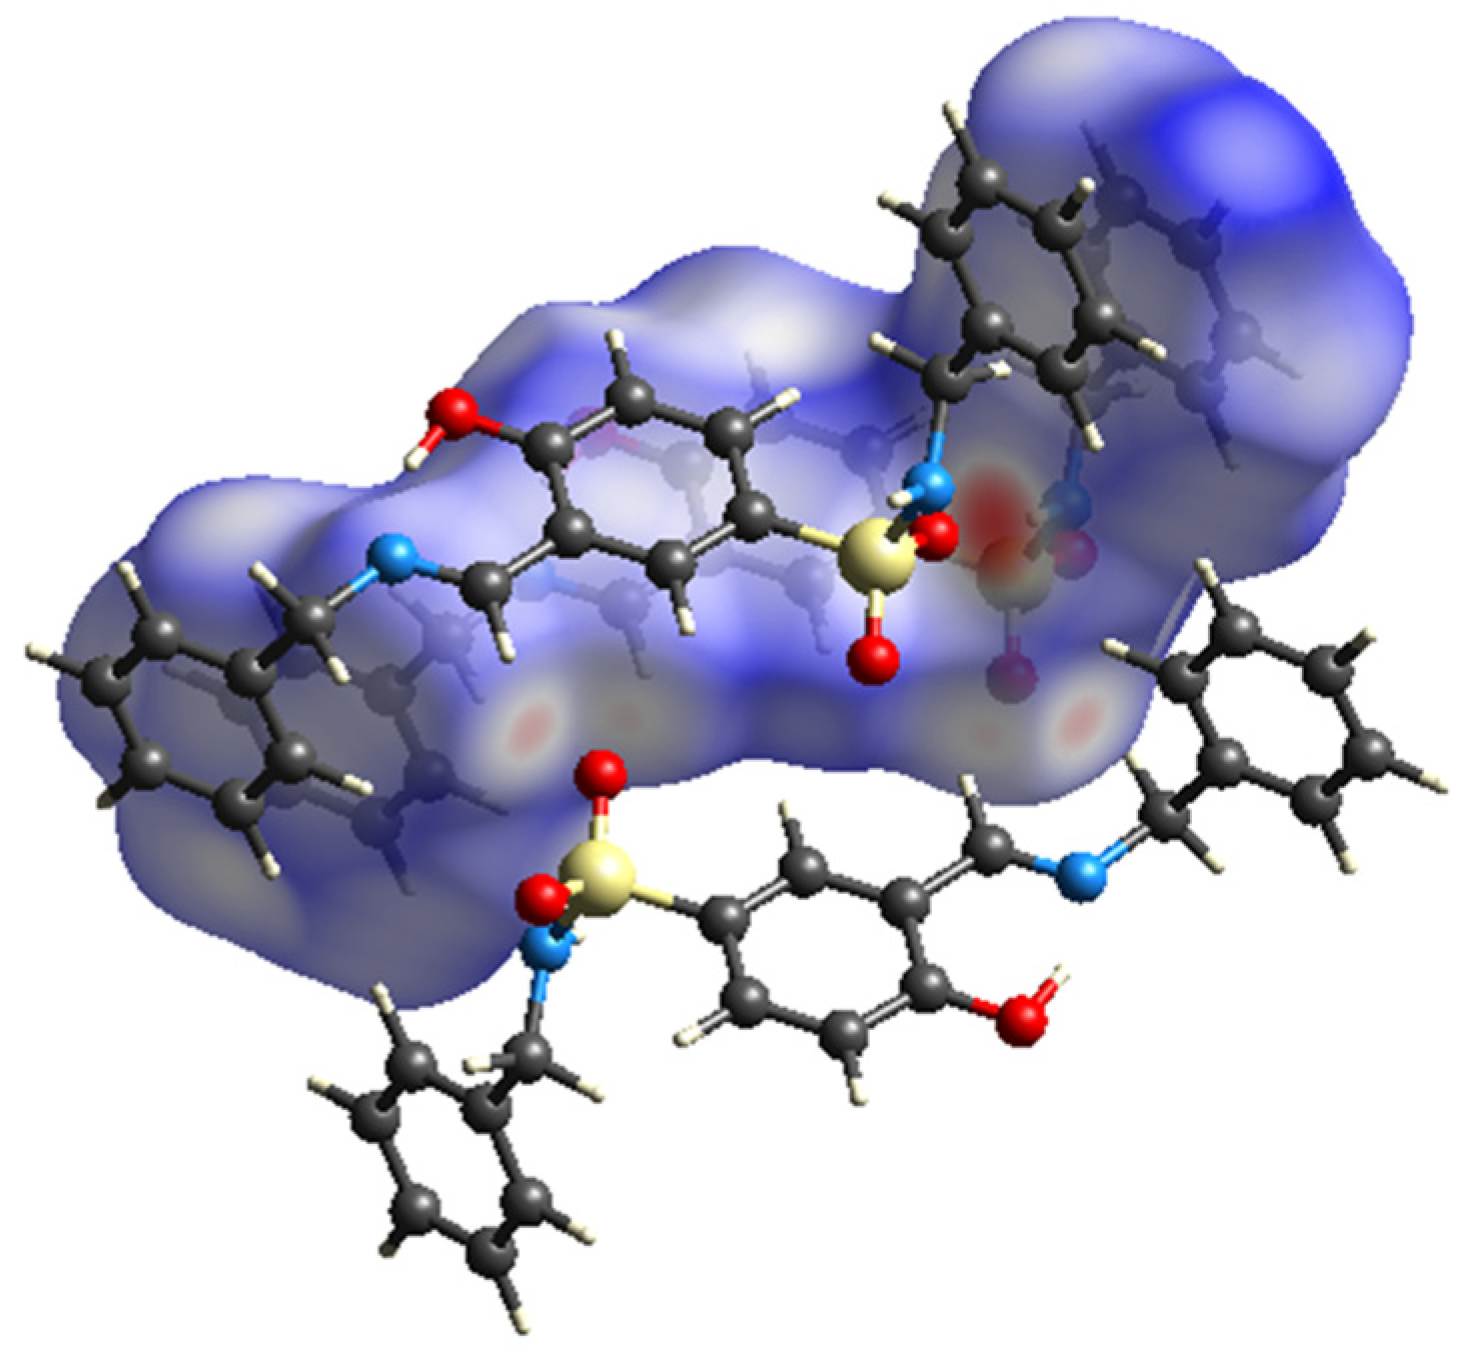
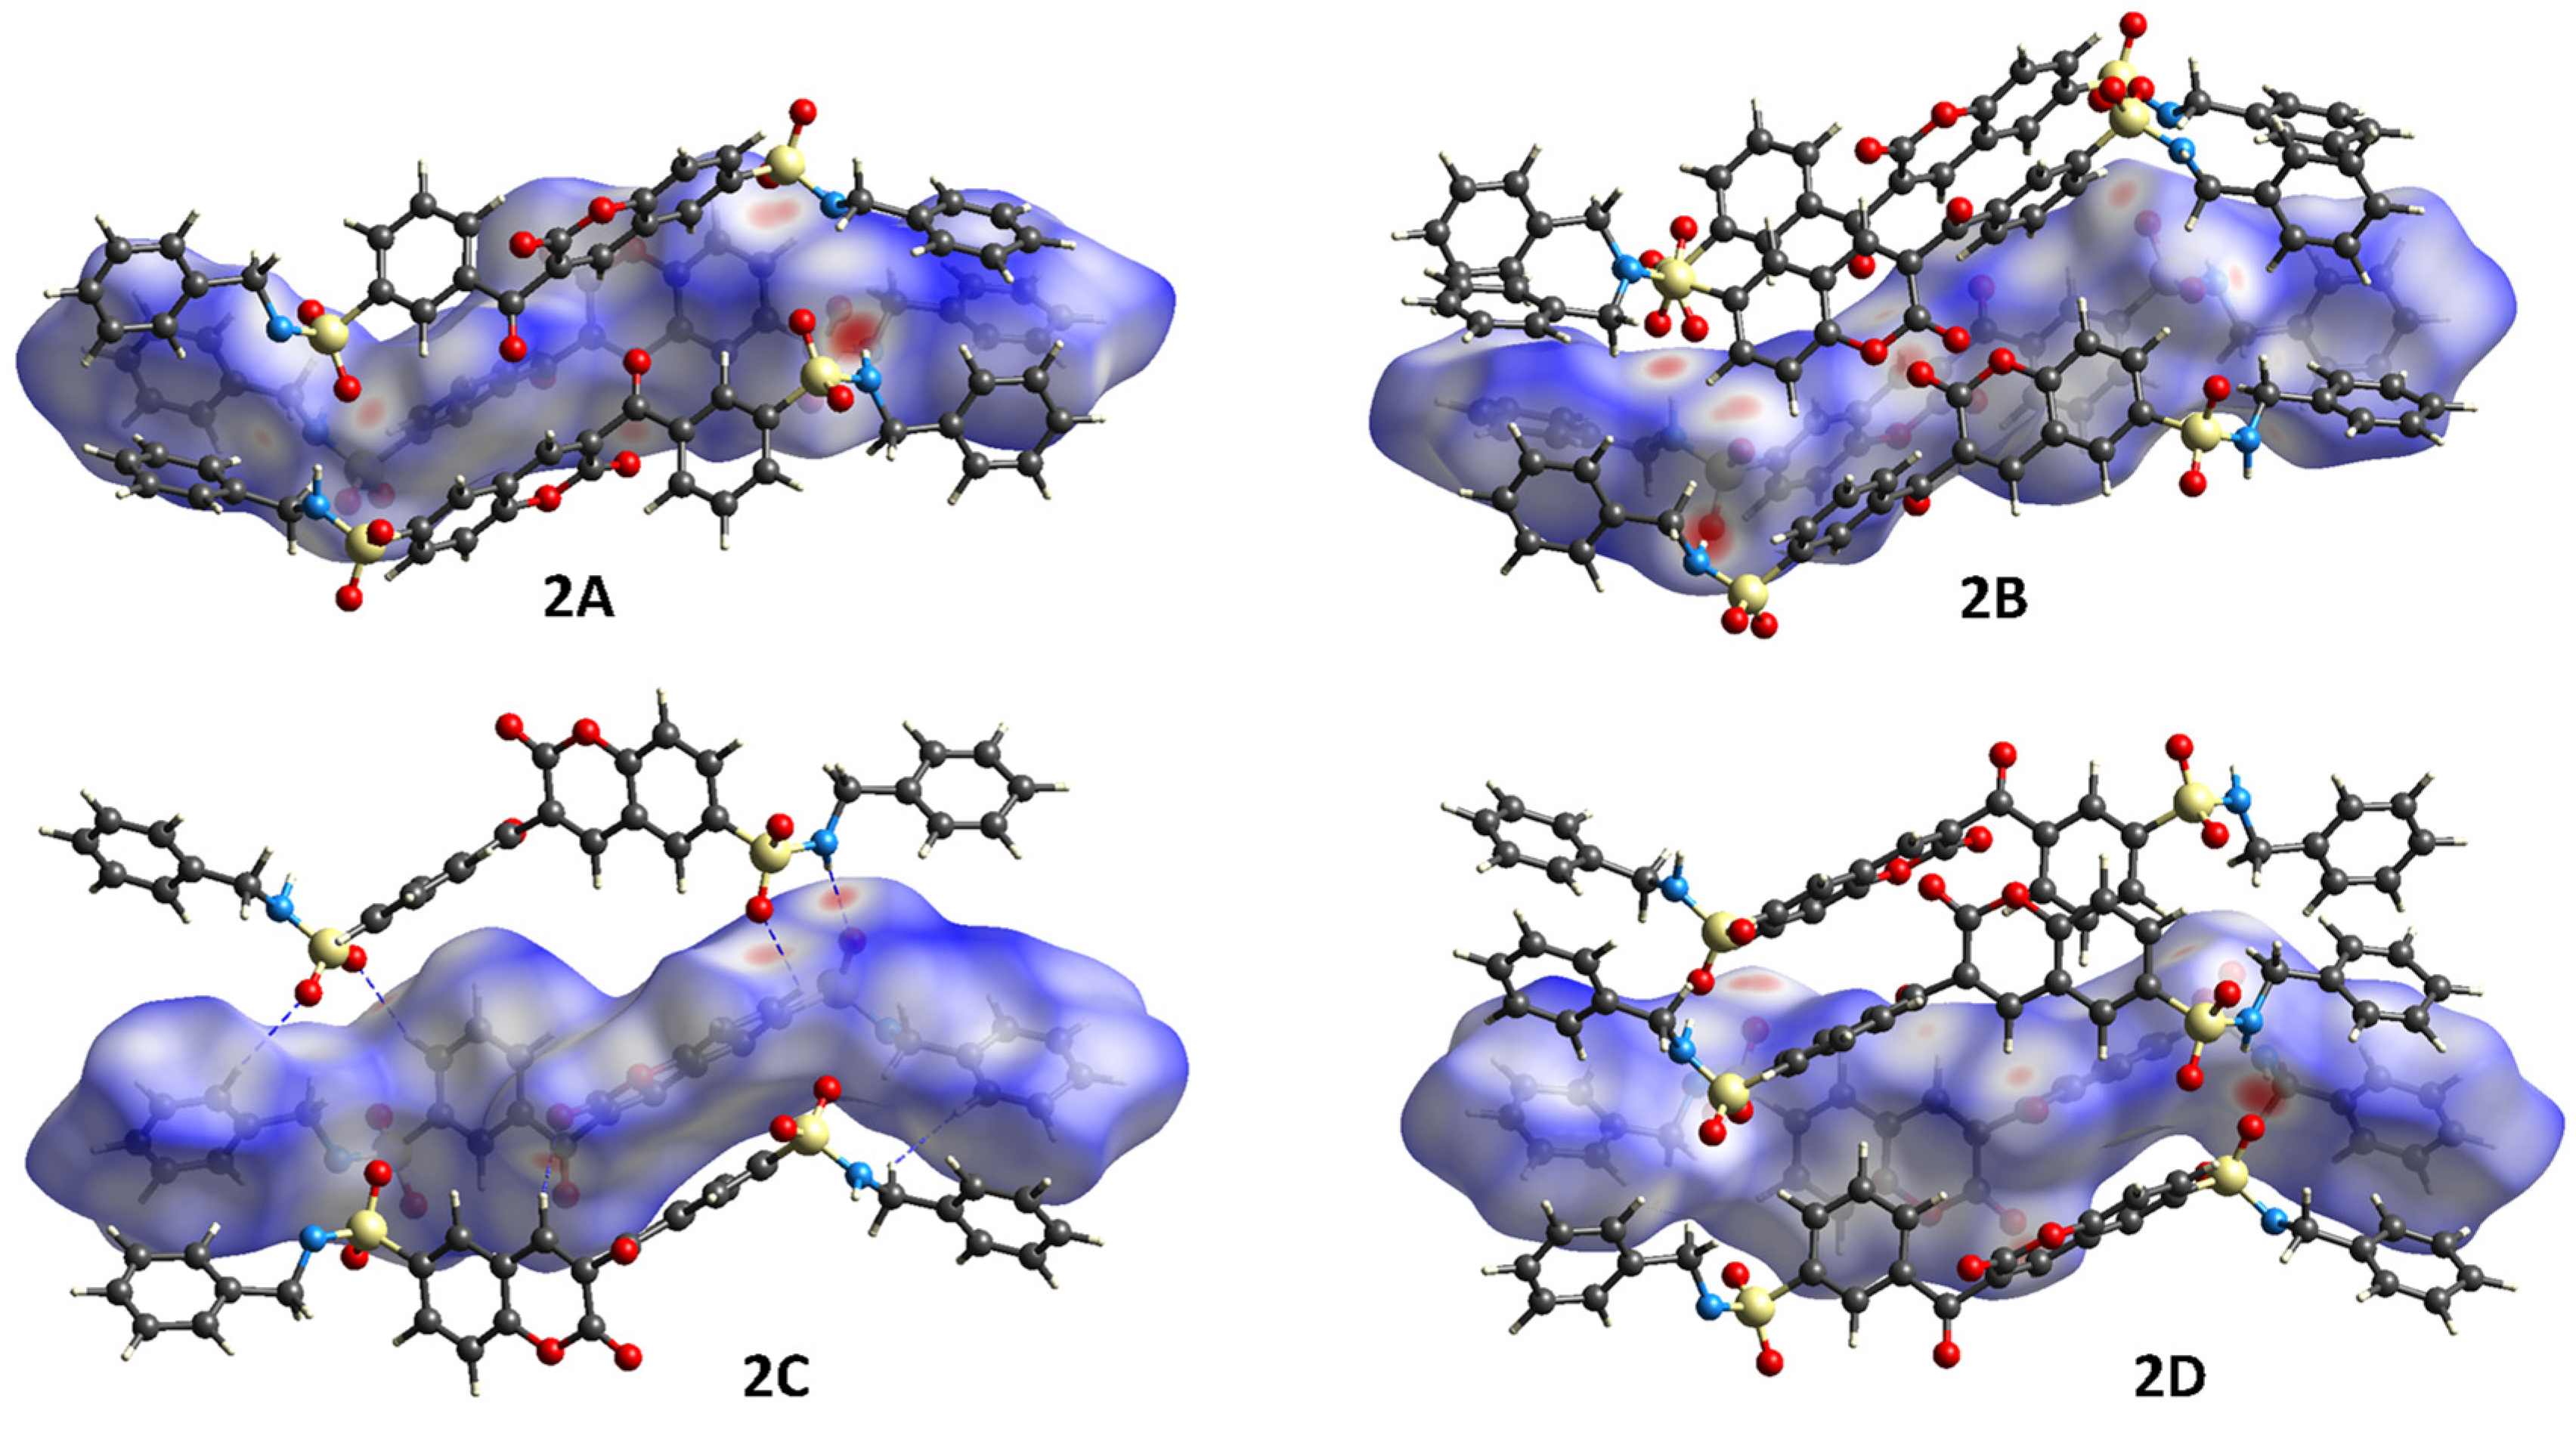
The Hirshfeld surfaces (HSs) of compounds 1 and 2 are shown in Figure 6 and Figure 7. Distances shorter than the sum of the vdw radii are depicted as red areas in the HSs. The observed red bright spots correspond to N–H∙∙∙O and soft C–H∙∙∙O hydrogen bonding, O∙∙∙H/H∙∙∙O interactions (20.7%, 1; 33.9 ± 0.3%, 2), which are the strongest contributors to the individual surfaces. The C–H∙∙∙π, H∙∙∙C/C∙∙∙H contacts (24.9%, 1; 24.9 ± 0.3%, 2), are the second largest contributor to the individual surfaces of 1 and 2. Whereas the H∙∙∙H contacts (48.5%, 1; 33.7 ± 0.5%, 2) are the largest contribution interactions to the individual surfaces. In Figure 8, the contributions of the most significant interactions (%) are depicted.

3.3. Interaction Energies

The molecules of compound 1 are connected through the interactions N20–H20···O19B and C21–H21B···Cg(3) to form an infinite chain that propagates along the [0 1 0] direction. The total energy (Etot) for this set of interactions is 71.0 kJ mol−1, with the stabilizing component being 1.7 times more dispersive than electrostatic, featuring a %Edisp of 58.9. Calculated interaction energies and %Ecomp contributions to stabilization energy for selected HBs and close contacts in compounds 1 and 2 are listed in Table 4.
The second dimension is given by the interactions C12–H12B···O19A and C4–H4···O19A, which create a dimer. This set of interactions is the weakest, with an Etot of 51.7 kJ mol−1. The stabilizing energy associated with this set is 1.5 times more dispersive than electrostatic, with a %Edisp of 52.5.
The four independent molecules of compound 2 are paired to develop alternating 2A∙∙∙2D and 2B∙∙∙2C parallel infinite ribbons, along the [2 2 1] direction, through N19X–H19X∙∙∙O27Y, C4X–H4X∙∙∙O2X (X = A–D, Y = B, D, F, G) and, in the case of the 2A∙∙∙2D ribbons, also through C11X–O11X∙∙∙Cg(n) (X = A, D, n = 2, 17) interactions. The combination of hydrogen bonding and n → π interactions, which develops the first dimension, is the strongest, with Etot in the 112.8–108.2 kJ mol−1 range. The nature of the stabilization energy involved in this set of interactions is 1.5 times more dispersive than electrostatic, with %Edisp in the 56.2–53.5 range. Furthermore, the 2A∙∙∙2D and 2B∙∙∙2C ribbons are perpendicularly linked together through 2A∙∙∙2B and 2C∙∙∙2D interactions. The second dimension is developed along the [3 4 1] direction, through C2X–O2X∙∙∙Cg(n) (X = A–D, n = 1, 6, 11, 16), C8X–H8X∙∙∙Cg(n) (X = A–D, n = 3, 8, 13, 18) and, in the case of 2C∙∙∙2D, additionally by antiparallel carbonyl-carbonyl interactions [40]. This arrangement of n → π and C–H∙∙∙π interactions is in the 99.5–95.8 kJ mol−1 range of total energy, whose stabilization component is 1.2 times more dispersive than electrostatic, with %Edisp in the 52.3–50.3 range. Finally, the third dimension is governed by N28X–H28X∙∙∙O27Y (X = A–D, Y = B, D, F, G), C7X–H7X∙∙∙O27Y (X = A–D, Y = A, C, H, E) and C15X–H15X∙∙∙ O18Y (X = A–D, Y = A, C, E, G) interactions along the [3 3 1] direction. This set of hydrogen bonding interactions is the weakest, with Etot in the 75.2–74.4 kJ mol−1 range. The stabilization energy associated with this assembly is 0.93 times less dispersive than electrostatic, with %Edisp in the 44.8–42.1% range.
Compound 2 has two N-benzylbenzenesulfonamide groups, (O18)2S18N19H19 and (O27)2S27N28H28, which are linked to the PhCO and the benzofused-coumarin rings, respectively. It is worth noting that N19H19 acts as a better hydrogen bonding donor than N28H28, contributing to the development of the 1D and 3D, respectively. In addition, there is also a differentiated acceptor capability between the S27O27 and S18O18; only the first sulfonamide participates as a sulfonamide hydrogen bonding acceptor. Furthermore, the S18O18, C2O2, and C11O11 behave as soft HB-acceptors, participating as such in C–H∙∙∙O interactions, and both carbonyls also in n → π interactions, developing the 2D.

3.4. Energy Framework Diagrams

In Figure 9, the energy framework diagrams for Eele (red), Edis (green), and Etot (blue) for a cluster of nearest-neighbor molecules are shown. Cylinders joining the centroids of molecules represent the energies between molecular pairs; the cylinder radius is proportional to the magnitude of the interaction energy.
The Edis component over the Eelec component mainly dominates the energy framework of 1. In contrast, both Edis and Eelec components are almost equally contributing to the energy framework of 2.

3.5. Molecular Docking

The overexpression of HDAC2 has been correlated with various types of cancer, including breast cancer [41,42,43]; therefore, it was selected as a docking target. Molecular docking was performed with sulfonamides 1 and 2 to determine their possible interaction mode within the crystallographic structure of HDAC2 (PDB ID: 4LXZ). The method was validated by reproducing the experimental binding of vorinostat, the co-crystallized ligand. Our methodology reproduced the experimental binding mode of vorinostat with an RMSD of 1.63 Å (Figure S4).
The molecular docking studies of 1 and 2 showed that both ligands reached the catalytic binding site of HDAC2, displaying favorable bindings. The molecular docking study of belinostat was performed as a reference compound. Free binding energies ΔG (kJ/mol) are listed in Table 5. ΔG values of 1 and 2 are close to the value obtained for belinostat.
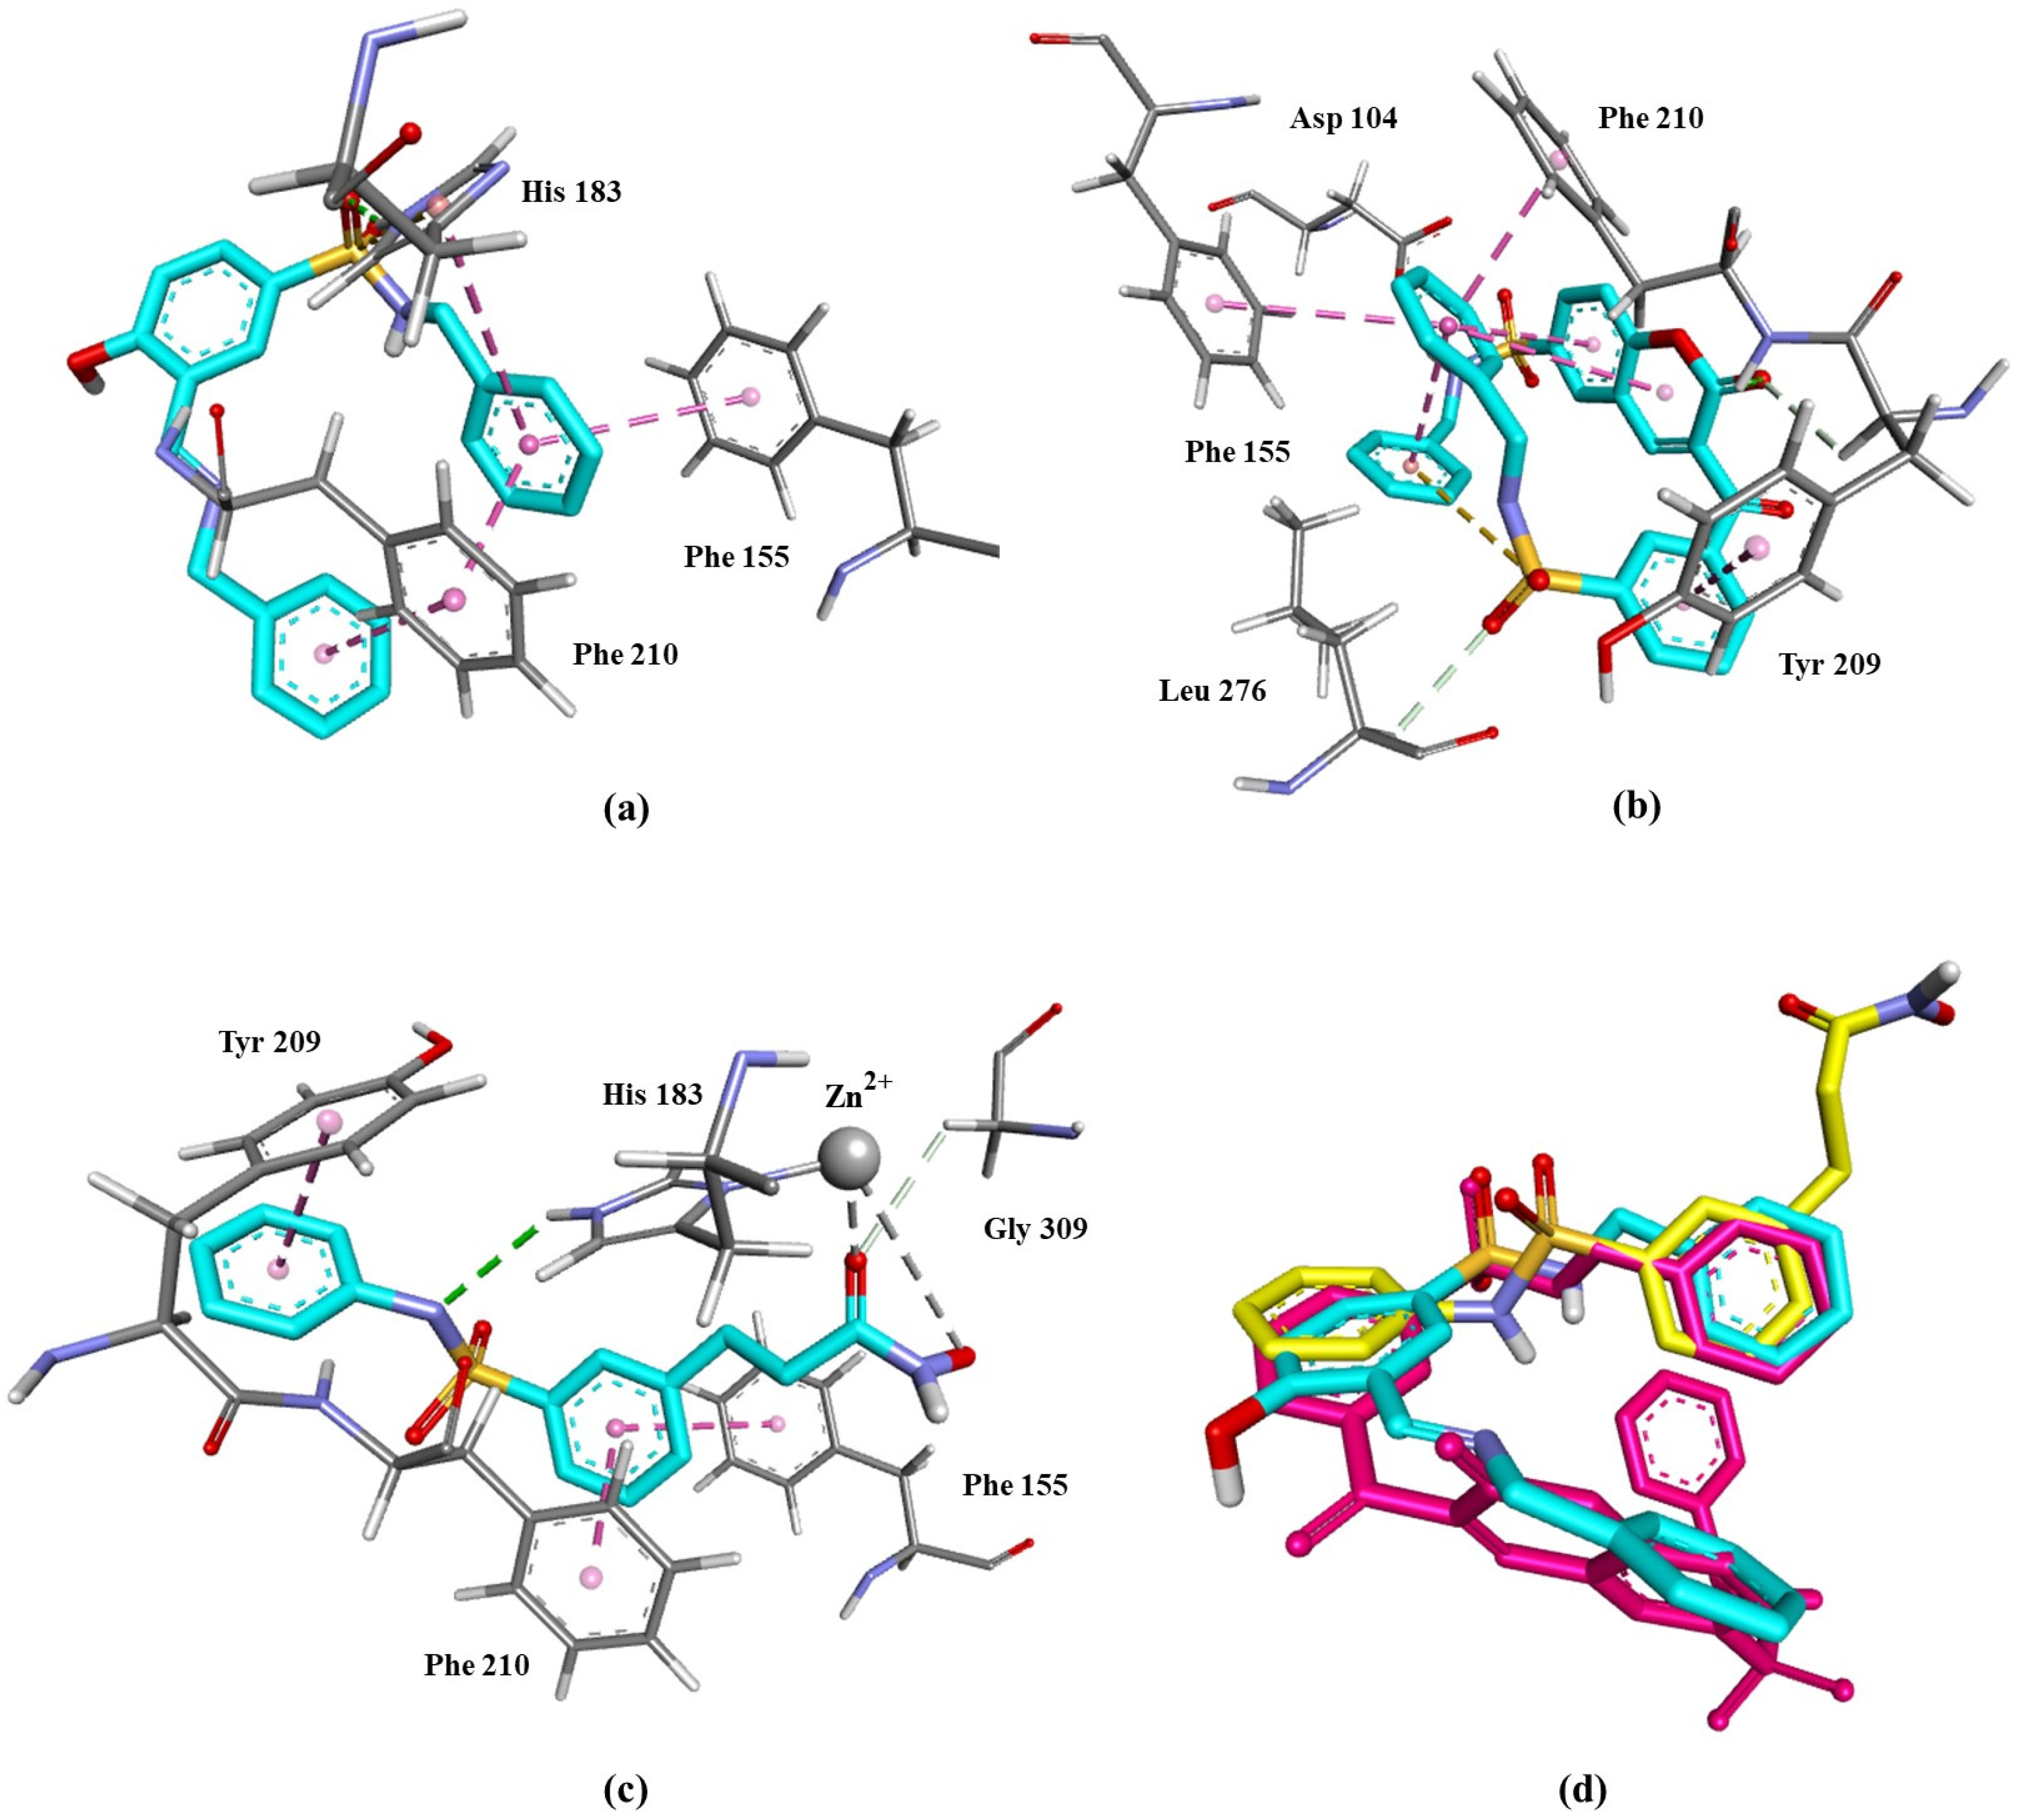
Compounds 1, 2, and belinostat all interact with the conserved Phe 155 and Phe 210 through parallel π–π interactions (Figure 10). Additionally, compound 1 interacts with His183, while compound 2 interacts with Leu 276 and Asp104 through hydrogen bonds. Both compound 2 and belinostat display parallel π–π interactions with Tyr 209. These interactions have been reported for other HDAC2 inhibitors [44,45,46]. As shown in Figure 10c, belinostat coordinates with the zinc ion in a bidentate manner, forming a five-membered chelate complex. Compounds 1 and 2 do not coordinate with the zinc ion; this is explained by the absence of the hydroxamate group. Molecular docking also shows that 1, 2, and belinostat have similar binding modes, allowing them to fit within the binding site similarly (Figure 10d). However, while belinostat penetrates deeply into the catalytic cavity of HDAC2 via its alkenyl hydroxamic acid group, compounds 1 and 2 show limited penetration. This is likely due to their rigid structures, which lack flexible linkers, and their large sizes relative to the narrow tunnel of HDAC2.
Finally, a brief comparison between the X-ray structures and the docking poses is worthwhile. The binding pose of 1 still adopts the E conformation around the C=N bond, although in this case, the conformation between the C=N bond and the phenolic O–H group is anti. The docking pose of 2 retains the anti conformation between the exocyclic and lactone carbonyl groups. Interestingly, in this docking pose, both benzylic fragments located at opposite ends of the molecule, adopt a folded conformation that brings them into close proximity to each other.

4. Conclusions

The crystallographic analysis reveals that compounds 1 and 2 maintain structural features similar to belinostat, while introducing modifications, such as the imine in compound 1 and the rigid α,β-unsaturated coumarin system in compound 2, as well as the additional methylene in the sulfonamide region, that enhance conformational flexibility, which may influence crystal packing and molecular interactions.
The assembly of sulfonamides 1 and 2 is primarily governed by intermolecular hydrogen bonding interactions. In both structures, the hydrogen bond formed between the N–H and the sulfonyl oxygen (N8–H8···O7B and N19X–H19X···O27Y, respectively) represents the strongest interaction, giving rise to a ribbon-like arrangement. Additionally, in compound 1, the self-complementary C12–H12···O19A interaction leads to the formation of centrosymmetric dimers, whereas in compound 2, which contains a second sulfonamide moiety, the N28X–H28X···O27Y hydrogen bond is observed, whose contribution is weaker compared to the main N19X–H19X···O27Y interaction.
The Hirshfeld surface analysis revealed that N–H···O and C–H···O hydrogen bonds, along with O···H/H···O contacts, are the strongest intermolecular interactions in both compounds, contributing 20.7% in compound 1 and 33.9 ± 0.3% in compound 2 to their respective surfaces, thus playing a significant role in their crystal packing, whereas the H∙∙∙H contacts are the largest contribution interactions to the individual surfaces.
The energetic analysis of the crystal packing revealed that, in compound 1, N–H···O and C–H···π interactions form one-dimensional chains with a total energy of 71.0 kJ mol−1, with dispersion being the dominant stabilizing force. In compound 2, the interactions forming the parallel ribbons 2A···2D and 2B···2C are the strongest, reaching up to 112.8 kJ mol−1, and involve N–H···O, C–H···O, and n → π contacts.
Finally, molecular docking showed that both compounds, 1 and 2, are able to fit into and interact with the catalytic site of HDAC2 mainly through π–π interactions and with a binding mode very similar to that of belinostat.
These findings highlight the potential of compounds 1 and 2 as structural analogs of belinostat with promising interactions at the HDAC catalytic site. Based on their previously demonstrated in vitro antiproliferative activity, further studies should focus on in vivo evaluations and broader structure–activity relationship studies with additional derivatives. Moreover, in silico dynamic simulations and ADMET evaluations could help address possible limitations such as selectivity and solubility, thereby providing a clearer perspective on their viability as potential compounds for anticancer therapy.

Supplementary Materials

The following supporting information can be downloaded at: https://www.mdpi.com/article/10.3390/cryst15100854/s1, Tables S1–S15: Bond lengths, bond angles, and torsion angles of compounds 1 and 2. Figure S1. Unit cell of 2 with four independent molecules labeled as 2A, 2B, 2C and 2D. Each pair is interlinked by intermolecular hydrogen bonds: 2A with 2C, and 2B with 2D. Figure S2. ORTEP diagrams of independent molecules: (a) 2B, (b) 2C, and (c) 2D. Ellipsoids are drawn at the 30% probability level. Figure S3. Superposition of the four independent molecules of compound 2 in the asymmetric unit. Molecule 2A is colored yellow, molecule 2B green, molecule 2C red, and molecule 2D blue. Figure S4. Superimposition of vorinostat molecules: cocrystallized (blue) and docked (yellow) within the HDAC2 active site for validation purposes.

Author Contributions

Conceptualization, funding acquisition, validation, supervision, review and editing: F.J.M.-M. and I.I.P.-M.; methodology, data curation and formal analysis: J.L.M.-A., N.E.M.-V., J.S.G.-G. and J.M.S.-Q.; writing—original draft: J.L.M.-A. and J.S.G.-G.; validation and formal analysis: E.V.G.-B. All authors have read and agreed to the published version of the manuscript.

Funding

The present study was supported by SIP-IPN (grants 20250238 and 20250681) and Universidad de Colima.

Data Availability Statement

The original contributions presented in this study are included in the article. Further inquiries can be directed to the corresponding author.

Conflicts of Interest

The authors declare no conflicts of interest.

References

  1. Mondal, S.; Malakar, S. Synthesis of Sulfonamide and Their Synthetic and Therapeutic Applications: Recent Advances. Tetrahedron 2020, 76, 131662. [Google Scholar] [CrossRef]
  2. Adsmond, D.A.; Grant, D.J. Hydrogen Bonding in Sulfonamides. J. Pharm. Sci. 2001, 90, 2058–2077. [Google Scholar] [CrossRef]
  3. Irfan, A.; Rubab, L.; Rehman, M.U.; Anjum, R.; Ullah, S.; Marjana, M.; Qadeer, S.; Sana, S. Coumarin Sulfonamide Derivatives: An Emerging Class of Therapeutic Agents. Heterocycl. Commun. 2020, 26, 46–59. [Google Scholar] [CrossRef]
  4. Madrigal-Angulo, J.L.; Hernández-Fuentes, G.A.; Parra-Delgado, H.; Olvera-Valdéz, M.; Padilla-Martínez, I.I.; Cabrera-Licona, A.; Espinosa-Gil, A.S.; Delgado-Enciso, I.; Martínez-Martínez, F.J. Design, Synthesis, Biological and in Silico Evaluation of 3-carboxy-coumarin Sulfonamides as Potential Antiproliferative Agents Targeting HDAC6. Biomed. Rep. 2024, 22, 6. [Google Scholar] [CrossRef] [PubMed]
  5. Campbell, P.; Thomas, C.M. Belinostat for the Treatment of Relapsed or Refractory Peripheral T-Cell Lymphoma. J. Oncol. Pharm. Pract. 2017, 23, 143–147. [Google Scholar] [CrossRef]
  6. Pullagurla, M.R.; Valsan, N.K.; Pitta, B.R.; Rangisetty, J.B. Novel Process for the Preparation of Belinostat. U.S. Patent US 2019/0256459 A1, 22 August 2019. [Google Scholar]
  7. Li, Z.; Ouyang, R.; Shi, P.; Du, S.; Gong, J.; Wu, S. Rationalizing the Formation of Belinostat Solvates with Experimental Screening and Computational Predictions. Cryst. Growth Des. 2021, 21, 4986–4996. [Google Scholar] [CrossRef]
  8. Li, Z.; Ouyang, R.; Cao, Y.; Han, D.; Wu, S.; Gong, J. Solubility Enhancement of Anticancer Drug Belinostat via the Co-Crystallization Strategy: Synthesis, Characterization, and Antitumor Activity In Vitro Evaluation. Cryst. Growth Des. 2023, 23, 792–800. [Google Scholar] [CrossRef]
  9. Bruker APEX2, Version 2012.10-0; Bruker AXS, Inc.: Madison, WI, USA, 2012.
  10. SAINT, Version 8.27B; Bruker AXS, Inc.: Madison, WI, USA, 2012.
  11. SADABS, Version 8.27B; Bruker AXS, Inc.: Madison, WI, USA, 2012.
  12. Blessing, R.H. An Empirical Correction for Absorption Anisotropy. Acta Crystallogr. A 1995, 51 Pt 1, 33–38. [Google Scholar] [CrossRef]
  13. Farrugia, L.J. WinGX and ORTEP for Windows: An Update. J. Appl. Crystallogr. 2012, 45, 849–854. [Google Scholar] [CrossRef]
  14. Sheldrick, G.M. A Short History of SHELX. Acta Crystallogr. A 2008, 64, 112–122. [Google Scholar] [CrossRef]
  15. Spek, A.L. Structure Validation in Chemical Crystallography. Acta Crystallogr. D Biol. Crystallogr. 2009, 65, 148–155. [Google Scholar] [CrossRef] [PubMed]
  16. Macrae, C.F.; Bruno, I.J.; Chisholm, J.A.; Edgington, P.R.; McCabe, P.; Pidcock, E.; Rodriguez-Monge, L.; Taylor, R.; van de Streek, J.; Wood, P.A. Mercury CSD 2.0—New Features for the Visualization and Investigation of Crystal Structures. J. Appl. Crystallogr. 2008, 41, 466–470. [Google Scholar] [CrossRef]
  17. Spackman, P.R.; Turner, M.J.; McKinnon, J.J.; Wolff, S.K.; Grimwood, D.J.; Jayatilaka, D.; Spackman, M.A. CrystalExplorer: A Program for Hirshfeld Surface Analysis, Visualization and Quantitative Analysis of Molecular Crystals. J. Appl. Crystallogr. 2021, 54, 1006–1011. [Google Scholar] [CrossRef]
  18. McKinnon, J.J.; Jayatilaka, D.; Spackman, M.A. Towards Quantitative Analysis of Intermolecular Interactions with Hirshfeld Surfaces. Chem. Commun. 2007, 37, 3814–3816. [Google Scholar] [CrossRef]
  19. Spackman, M.A.; Jayatilaka, D. Hirshfeld Surface Analysis. CrystEngComm 2009, 11, 19–32. [Google Scholar] [CrossRef]
  20. Spackman, M.A.; McKinnon, J.J. Fingerprinting Intermolecular Interactions in Molecular Crystals. CrystEngComm 2002, 4, 378–392. [Google Scholar] [CrossRef]
  21. Morales-Santana, M.; Chong, S.; Santiago-Quintana, J.M.; Martínez-Martínez, F.; García-Báez, E.; Cruz, A.; Rojas-Lima, S.; Padilla-Martínez, I. Microcrystalline Solid–Solid Transformations of Conformationally-Responsive Solvates, Desolvates and a Salt of N, N′-(1,4-Phenylene)Dioxalamic Acid: The Energetics of Hydrogen Bonding and n/π → Π* Interactions. CrystEngComm 2024, 24, 1017–1034. [Google Scholar] [CrossRef]
  22. Frisch, M.J.; Trucks, G.W.; Schlegel, H.B.; Scuseria, G.E.; Robb, M.A.; Cheeseman, J.R.; Scalmani, G.; Barone, V.; Mennucci, B.; Petersson, G.A.; et al. Gaussian 09, Revision, A.02; Gaussian, Inc.: Wallingford, CT, USA, 2009.
  23. Mackenzie, C.F.; Spackman, P.R.; Jayatilaka, D.; Spackman, M.A. CrystalExplorer Model Energies and Energy Frameworks: Extension to Metal Coordination Compounds, Organic Salts, Solvates and Open-Shell Systems. IUCrJ 2017, 4, 575–587. [Google Scholar] [CrossRef]
  24. Turner, M.J.; Thomas, S.P.; Shi, M.W.; Jayatilaka, D.; Spackman, M.A. Energy Frameworks: Insights into Interaction Anisotropy and the Mechanical Properties of Molecular Crystals. Chem. Commun. 2015, 51, 3735–3738. [Google Scholar] [CrossRef]
  25. Lauffer, B.E.; Mintzer, R.; Fong, R.; Mukund, S.; Tam, C.; Zilberleyb, I.; Flicke, B.; Ritscher, A.; Fedorowicz, G.; Vallero, R.; et al. Histone Deacetylase (HDAC) Inhibitor Kinetic Rate Constants Correlate with Cellular Histone Acetylation but Not Transcription and Cell Viability. J. Biol. Chem. 2013, 288, 26926–26943. [Google Scholar] [CrossRef] [PubMed]
  26. Dassault Systèmes. BIOVIA Discovery Studio Visualizer 2021; Dassault Systèmes: Paris, France, 2025; Available online: https://www.3ds.com/products/biovia (accessed on 25 February 2025).
  27. Pettersen, E.F.; Goddard, T.D.; Huang, C.C.; Couch, G.S.; Greenblatt, D.M.; Meng, E.C.; Ferrin, T.E. UCSF Chimera—A Visualization System for Exploratory Research and Analysis. J. Comput. Chem. 2004, 25, 1605–1612. [Google Scholar] [CrossRef]
  28. Schrodinger, L. Maestro, Version 13.3; Schodinger Release 2025-1; Schrodinger: New York, NY, USA, 2025. Available online: https://www.schrodinger.com (accessed on 25 February 2025).
  29. Ortegon-Reyna, D.; Garcias-Morales, C.; García-Báez, E.V.; Ariza-Castolo, A.; Martínez-Martínez, F.J. (E)-4-Hydroxy-2-{[(2-Phenylethyl)Iminiumyl]Methyl}phenolate. Acta Crystallogr. E Struct. Rep. Online 2012, 68, o2075. [Google Scholar] [CrossRef]
  30. Santos-Contreras, R.J.; Martínez-Martínez, F.J.; Mancilla-Margalli, N.A.; Peraza-Campos, A.L.; Morín-Sánchez, L.M.; García-Báez, E.V.; Padilla-Martínez, I.I. Competition between OH⋯O and Multiple Halogen–Dipole Interactions on the Formation of Intramolecular Three-Centred Hydrogen Bond in 3-Acyl Coumarins. CrystEngComm 2009, 11, 1451–1461. [Google Scholar] [CrossRef]
  31. Sunil Kumar, A.; Kudva, J.; Lahtinen, M.; Peuronen, A.; Sadashiva, R.; Naral, D. Synthesis, Characterization, Crystal Structures and Biological Screening of 4-Amino Quinazoline Sulfonamide Derivatives. J. Mol. Struct. 2019, 1190, 29–36. [Google Scholar] [CrossRef]
  32. Danish, M.; Bibi, A.; Gilani, K.; Raza, M.A.; Ashfaq, M.; Arshad, M.N.; Asiri, A.M.; Ayub, K. Antiradical, Antimicrobial and Enzyme Inhibition Evaluation of Sulfonamide Derived Esters; Synthesis, X-Ray Analysis and DFT Studies. J. Mol. Struct. 2019, 1175, 379–388. [Google Scholar] [CrossRef]
  33. Özbek, N.; Özdemir, Ü.Ö.; Altun, A.F.; Şahin, E. Sulfonamide-Derived Hydrazone Compounds and Their Pd (II) Complexes: Synthesis, Spectroscopic Characterization, X-Ray Structure Determination, in Vitro Antibacterial Activity and Computational Studies. J. Mol. Struct. 2019, 1196, 707–719. [Google Scholar] [CrossRef]
  34. Male, S.R.; Upadhyay, S.; Sharma, S.K.; Acharya, H.; Singh, G.; Lahiri, S.; Cabri, W. Polymorphic Forms of Belinostat and Processes for Preparation Thereof. WO 2018020406 A1, 1 February 2018. [Google Scholar]
  35. Stenfors, B.A.; Staples, R.J.; Biros, S.M.; Ngassa, F.N. Crystal Structure of 4-Methyl-N-(4-Methyl benz yl)Benzene sulfonamide. Acta Crystallogr. E 2020, 76, 235–238. [Google Scholar] [CrossRef] [PubMed]
  36. Prohens, R.; Portell, A.; Font-Bardia, M.; Bauzá, A.; Frontera, A. Experimental and Theoretical Study of Aromaticity Effects in the Solid State Architecture on Squaric Acid Derivatives. Cryst. Growth Des. 2014, 14, 2578–2587. [Google Scholar] [CrossRef]
  37. García-Báez, E.V.; Martínez-Martínez, F.J.; Höpfl, H.; Padilla-Martínez, I.I. π-Stacking Interactions and CH···X (X = O, Aryl) Hydrogen Bonding as Directing Features of the Supramolecular Self-Association in 3-Carboxy and 3-Amido Coumarin Derivatives. Cryst. Growth Des. 2003, 3, 35–45. [Google Scholar] [CrossRef]
  38. Malathy Sony, S.M.; Ponnuswamy, M.N. Nature of π-Interactions in Nitrogen-Containing Heterocyclic Systems: A Structural Database Analysis. Cryst. Growth Des. 2006, 6, 736–742. [Google Scholar] [CrossRef]
  39. Zhang, Y.; Yang, J.; Yang, Y.; Guo, J.; Ma, J.-F. Syntheses, Structures, and Luminescent Properties of a Series of Coordination Compounds Based on (4-Carboxylphenyl) (4-(2′-Carboxylphenyl)Benzyl) Ether and Different N-Donor Ligands. Cryst. Growth Des. 2012, 12, 4060–4071. [Google Scholar] [CrossRef]
  40. Allen, F.H.; Baalham, C.A.; Lommerse, J.P.M.; Raithby, P.R. Carbonyl-Carbonyl Interactions Can Be Competitive with Hydrogen Bonds. Acta Crystallogr. Sect. B 1998, 54, 320–329. [Google Scholar] [CrossRef]
  41. Shan, W.; Jiang, Y.; Yu, H.; Huang, Q.; Liu, L.; Guo, X.; Li, L.; Zhang, K.; Yang, Z. HDAC2 Overexpression Correlates with Aggressive Clinicopathological Features and DNA-Damage Response Pathway of Breast Cancer. Am. J. Cancer Res. 2017, 7, 1213. [Google Scholar]
  42. Zhao, H.; Yu, Z.; Zhao, L.; He, M.; Ren, J.; Wu, H.; Chen, Q.; Yao, W.; Wei, M. HDAC2 Overexpression Is a Poor Prognostic Factor of Breast Cancer Patients with Increased Multidrug Resistance-Associated Protein Expression Who Received Anthracyclines Therapy. Jpn. J. Clin. Oncol. 2016, 46, 893–902. [Google Scholar] [CrossRef]
  43. Garmpis, N.; Damaskos, C.; Dimitroulis, D.; Kouraklis, G.; Garmpi, A.; Sarantis, P.; Koustas, E.; Patsouras, A.; Psilopatis, I.; Antoniou, E.A.; et al. Clinical Significance of the Histone Deacetylase 2 (HDAC-2) Expression in Human Breast Cancer. J. Pers. Med. 2022, 12, 1672. [Google Scholar] [CrossRef]
  44. Ibrahim, H.S.; Abdelsalam, M.; Zeyn, Y.; Zessin, M.; Mustafa, A.-H.M.; Fischer, M.A.; Zeyen, P.; Sun, P.; Bülbül, E.F.; Vecchio, A.; et al. Synthesis, Molecular Docking and Biological Characterization of Pyrazine Linked 2-Aminobenzamides as New Class I Selective Histone Deacetylase (HDAC) Inhibitors with Anti-Leukemic Activity. Int. J. Mol. Sci. 2022, 23, 369. [Google Scholar] [CrossRef]
  45. Scafuri, B.; Bontempo, P.; Altucci, L.; De Masi, L.; Facchiano, A. Molecular Docking Simulations on Histone Deacetylases (HDAC)-1 and -2 to Investigate the Flavone Binding. Biomedicines 2020, 8, 568. [Google Scholar] [CrossRef]
  46. Dong, J.; Zhu, X.; Yu, W.; Hu, X.; Zhang, Y.; Yang, K.; You, Z.; Liu, Z.; Qiao, X.; Song, Y. Pyrazolo [3,4-d]Pyrimidine-Based Dual HDAC/Topo II Inhibitors: Design, Synthesis, and Biological Evaluation as Potential Antitumor Agents. J. Mol. Struct. 2023, 1272, 134221. [Google Scholar] [CrossRef]
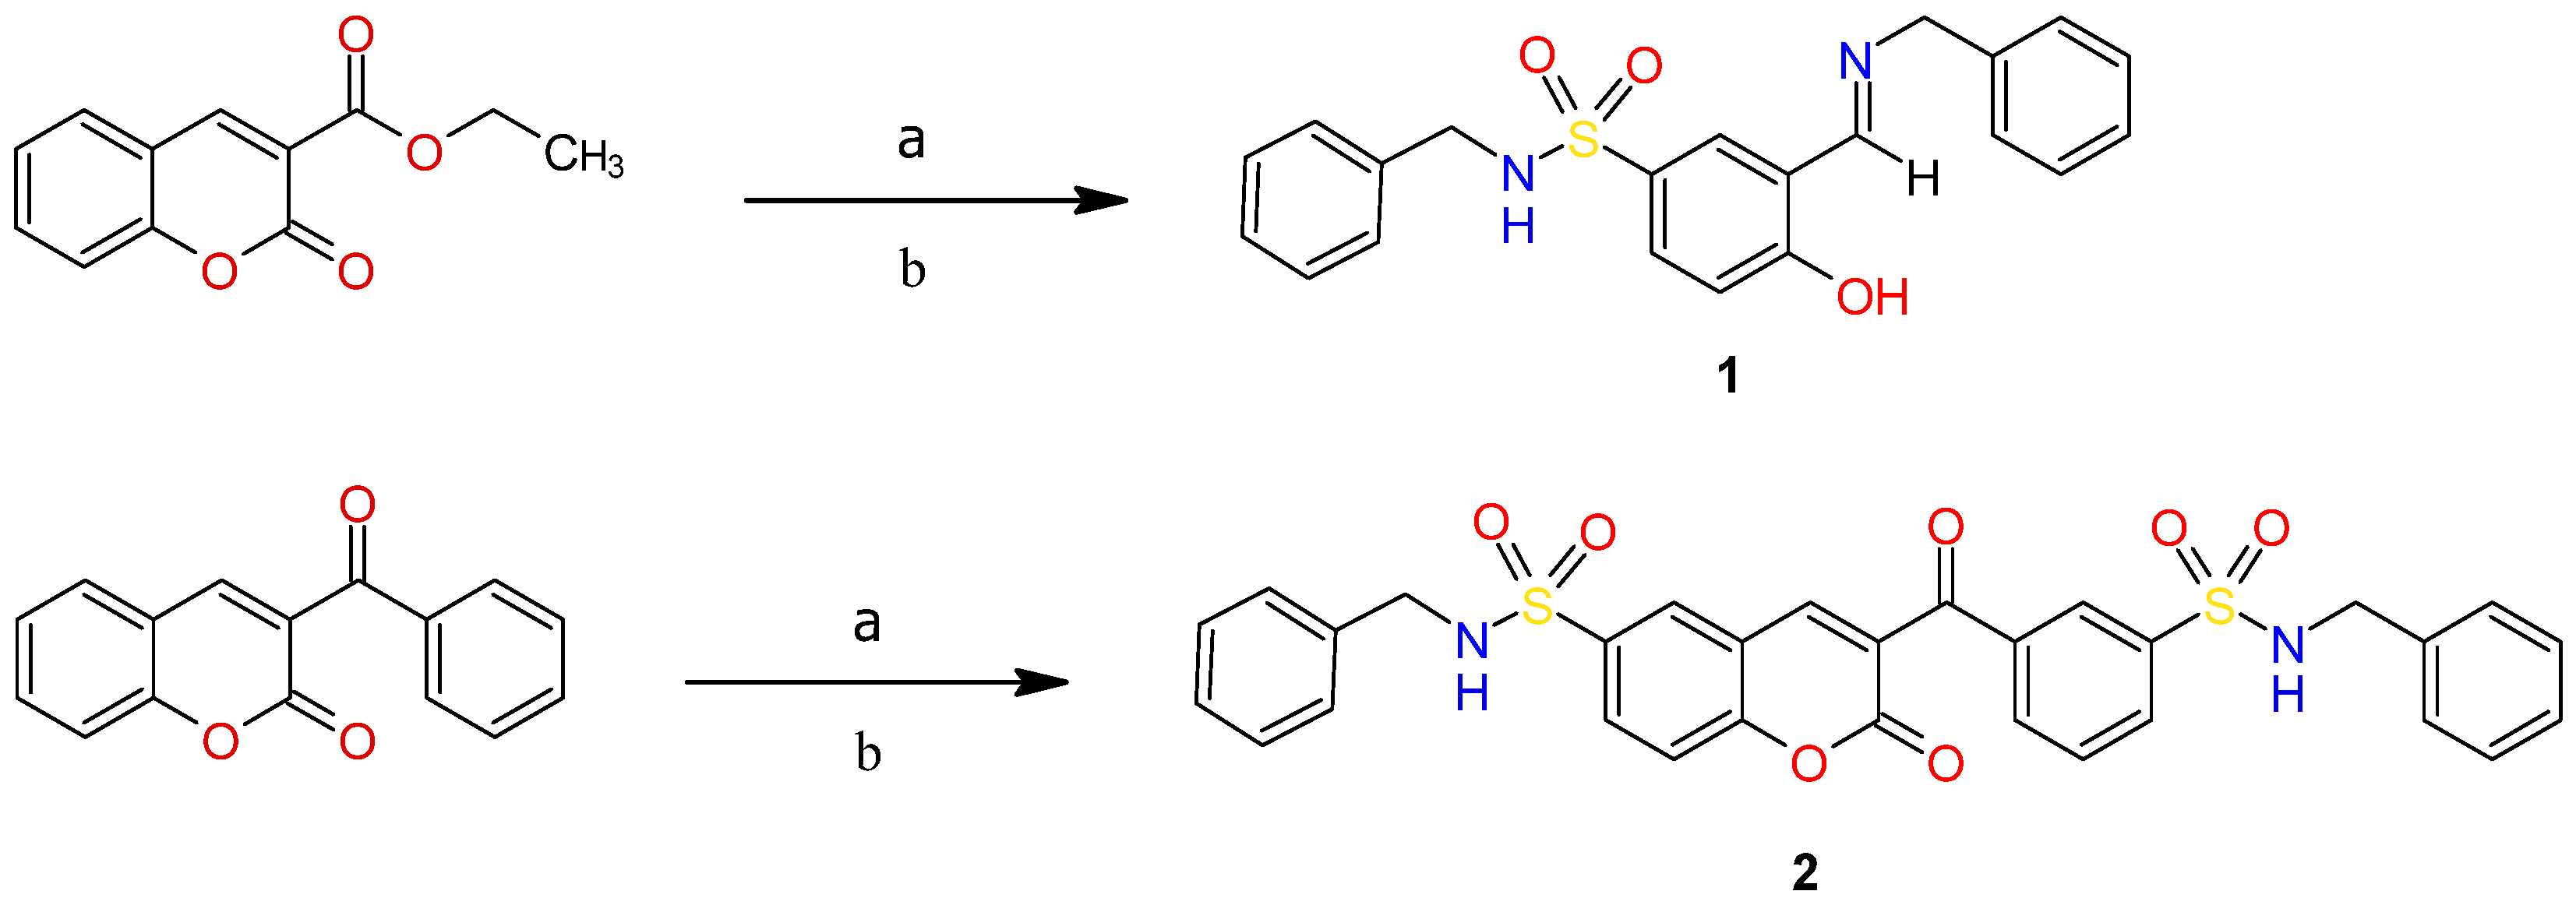
Scheme 1. Scheme of synthesis of sulfonamides 1 and 2. Reagents and conditions: (a) HSO3Cl, reflux; (b) benzylamine, Et3N, THF, stirring 1–24 h at room temperature [4].
Crystals 15 00854 sch001
Figure 1. Chemical structure of belinostat.
Crystals 15 00854 g001
Figure 2. ORTEP diagram of sulfonamide 1 with ellipsoids drawn at the 30% probability level.
Crystals 15 00854 g002
Figure 3. ORTEP diagram of sulfonamide 2A, a representative independent molecule. Ellipsoids are drawn at the 30% probability level.
Crystals 15 00854 g003
Figure 4. Supramolecular architecture of compound 1. (a) N20–H20···O19B hydrogen bonding and C–H….π interactions along the b axis. (b) C12–H12….O19A hydrogen bonding in the ac plane.
Crystals 15 00854 g004
Figure 5. (a) Hydrogen bonding and π…π stacking along the a axis. (b) Hydrogen bonding interactions along the ab plane.
Crystals 15 00854 g005
Figure 6. Hirsfeld surfaces (HS) of compound 1. The bright red spots represent the strongest interactions on the individual surface.
Crystals 15 00854 g006
Figure 7. Hirsfeld surfaces (HSs) of the four independent molecules (AD) of compound 2. The bright red spots represent the most significant interactions on the individual surfaces.
Crystals 15 00854 g007
Figure 8. Comparative percentage of contributions and their reciprocals to the HSs of compounds 1 and 2 (mean values of the four molecules ± standard deviations). X = H, C.
Crystals 15 00854 g008
Figure 9. Energy frameworks of 1 and 2. (a) Electrostatic; (b) Dispersive; (c) Total. Tube size 150, cut-off energy 10 kJ/mol, and unit cell 23.
Crystals 15 00854 g009
Figure 10. Binding modes of compounds 1 (a), 2 (b), belinostat (c), and superimposition (d) of 1 (blue), 2 (purple) and belinostat (yellow) within the HDAC2 active site.
Crystals 15 00854 g010
Table 1. Crystallographic data and refinement parameters for 1 and 2.
Compound12
CCDC deposition number23844672385727
Chemical formula C21H20N2O3SC30H24N2O7S2
Formula weight380.45588.63
Crystal size (mm)0.3 × 0.2 × 0.10.35 × 0.30 × 0.28
Crystal systemMonoclinic Monoclinic
Space groupP21/nCc
a (Å)20.303 (5)14.9003 (13)
b (Å)4.9211 (12)14.9110 (14)
c (Å)20.945 (5)50.4691 (5)
α (°)9090
β (°)113.88 (1)93.138 (3)
γ (°)90°90°
V (Å3)1913.6 (8) 11196.3 (18)
Z416
Dx (mg/m3)1.3211.397
F (000)8004896
µ (mm−1)0.1930.24
Measured, independent, and observed reflections [I > 2σ(I)]46857, 3191, 2178160036, 20868, 12259
R (int)0.1560.106
GOOF1.1391.09
No. of reflections 314120868
No. of parameters2571510
R[F2 > 2σ(F2)], wR(F2)0.064, 0.1000.072, 0.136
Table 2. Representative bond lengths and torsion angles for compounds 1 and 2. The values of 2 are the average of four independent molecules.
Bond Lengths (Å)
1 2
O1–C91.337 (4)C2–O21.204 (7)
C4–N111.275 (5)C3–C41.340 (8)
C6–S191.752 (3)C11–O111.204 (8)
S19–O19A1.435 (2)C6–S271.752 (4)
S19–N201.614 (3)C14–S181.766 (5)
N20–C211.466 (5)S18–O18A1.438 (5)
S27–O27A 1.428 (3)
S27–N281.605 (4)
N28–C291.447 (7)
Torsion angles (deg)
C5–C6–S19–O19A−21.1 (3)O1–C9–C10–C41.025 (7)
C5–C6–S19–O19B−150.9 (3)C2–C3–C11–O11−82.7 (7)
C5–C6–S19–N2094.5 (3)C3–C4–C10–C90.62 (7)
C5–C10–C4–N11179.8 (3)C4–C3–C11–O11−96.975 (8)
C9–C10–C4–N110.9 (5)C4–C3–C11–C1283.475 (7)
C5–C6–S27–O7A17.925 (4)
C5–C6–S27–N2898.275 (4)
C13–C14–S18–O18A19.825 (4)
C13–C14–S18–N1994.375 (4)
Table 3. Geometric parameters for the intermolecular hydrogen bonding interactions in compounds 1 and 2.
Comp.D–H…AD–H (Å)H…A (Å)D….A (Å)D–H…A (°)
1N20–H20···O19B i0.79 (3)2.08 (3)2.844 (4)163 (3)
C12–H12B….O19A ii0.972.523.450 (4)160
2AC4A–H4A…O2D iii0.932.493.210 (13)135
C7A–H7A…O27E iv0.932.463.019 (11)119
N19A–H19A…O27G v0.67 (6)2.37 (6)3.032 (12)172 (8)
N28A–H28A…O27F iii0.98 (10)2.28 (10)3.258 (11)178 (10)
2BC4B–H4B…O2C iii0.932.463.202 (13)137
C7B–H7B…O27H vi0.932.513.001 (11)113
N19B–H19B…O27F vii1.00 (7)2.07 (7)3.032 (11) 161 (5)
N28B–H28B…O27G iii0.94 (9)2.52 (9)3.198 (11)130 (7)
2CC4C–H4C…O2B v0.932.463.195 (12)136
C7C–H7C…O27A iii0.932.523.003 (10)112
N19C–H19C…O27D iii1.01 (9)2.06 (9)3.040 (11)164 (7)
N28C–H28C…O27B vi0.92 (12)2.32 (11)3.179 (11)156 (10)
2DC4D–H4D…O2A vii0.932.453.190 (12)136
C7D–H7D…O27C iii0.932.462.995 (11)117
N19D–H19D…O27B iii0.91 (15)2.11 (17)2.994 (10)165 (15)
N28D–H28D…O27D iv0.75 (7)2.55 (8)3.252 (11)157 (6)
Symmetry codes: (i) −x + 1, −y, −z + 1; (ii) x, y − 1, z; (iii) x, y, z; (iv) x + 1/2, y + 1/2, z; (v) x − 1/2, y + 1/2, z; (vi) x − 1/2, y − 1/2, z; (vii) x + 1/2, y − 1/2, z.
Table 4. Calculated interaction energies a (kJ mol−1); %Ecomp contributions b to stabilization energy for selected HBs and close contacts in compounds 1 and 2.
InteractionMolecules−Eelec−Epol−EdispErep−Etot%Eelec%EdispR c
Comp. 1
N20–H20∙∙∙O19B
C21–H21B∙∙∙Cg(3) d
37.67.063.837.571.034.758.94.92
C12–H12B∙∙∙O19A
C4–H4∙∙∙O19A
21.48.733.311.651.733.752.56.02
Comp. 2
N19B–H19B∙∙∙O27F
C4C–H4C∙∙∙O2B
B∙∙∙C58.613.386.345.4112.837.054.65.248
N19C–H19C∙∙∙O27D
C4B–H4B∙∙∙O2C
C∙∙∙B56.212.883.342.8109.536.954.75.297
N19A–H19A∙∙∙O27G
C4D–H4D∙∙∙ O2A
C11A–O11A∙∙∙Cg(17) e
A∙∙∙D54.212.585.544.1108.235.656.25.260
N19D–H19D∙∙∙O27B
C4A–H4A∙∙∙ O2D
C11D–O11D∙∙∙Cg(2) f
D∙∙∙A59.613.884.547.2110.737.753.55.282
C2A–O2A∙∙∙Cg(6) g
C8A–H8A∙∙∙Cg(8) h
C2B–O2B∙∙∙ Cg(1) i
C8B–H8B∙∙∙Cg(3) j
A∙∙∙B

B∙∙∙A
51.610.162.524.799.541.550.35.527
C2C–O2C∙∙∙Cg(16) k
C8C–H8C∙∙∙Cg(18) l
C2C–O2C∙∙∙C2D
C2D–O2D∙∙∙ Cg(11) m
C8D–H8D∙∙∙Cg(13) n
C2D–O2D∙∙∙C2C
C D


D∙∙∙C
47.49.562.223.295.839.852.35.556
C4A–H4A∙∙∙O11B
C29B–H29D∙∙∙O18A
A∙∙∙B19.18.075.029.372.818.773.45.593
N28C–H28C∙∙∙O27B
C7A–H7A∙∙∙O27E
C15A–H15A∙∙∙ O18E
C∙∙∙A49.89.743.327.675.248.442.16.283
N28A–H28A∙∙∙O27F
C7C–H7C∙∙∙O27A
C15C–H15C∙∙∙O18A
A∙∙∙C46.49.541.925.272.647.542.96.345
N28B–H28B∙∙∙O27G
C7D–H7D∙∙∙O27C
C15D–H15D∙∙∙ O18C
B∙∙∙D43.39.342.725.070.445.544.86.311
N28D–H28D∙∙∙O27D
C7B–H7B∙∙∙O27H
C15B–H15B∙∙∙ O18G
D∙∙∙B46.59.343.025.873.047.143.66.331
a Scaling factors (kcomp) were applied (Ecomp = kcomp × E’comp) according to reference [23]. b The % contribution of Ecomp (%Ecomp) is calculated through (Ecomp/Estab) × 100 where Estab = Eele + Epol + Edisp. c R = distance between centroids in Å. Cg(n) is the centroid of the n ring: d Cg(3) = C22–C27 benzylamine Ph ring; e Cg17 = C5D–C10D; f Cg(2) = C5A–C10A; g Cg(6) = O1B/C2B–C9B; h Cg(8) = C12B–C17B; i Cg(1) = O1A/C2A–C9A; j Cg(3) = C12A–C17A; k Cg(16) = O1D/C2D–C9D; l Cg(18) = C12D–C17D; m Cg(11) = O1C/C2C–C9C; n Cg(13) = C12C–C17C.
Table 5. Free binding energies ΔG (kJ/mol) of compounds 1 and 2 docked into the active site of HDAC2.
CompoundΔG (kJ/mol)
1−32.2
2−34.7
Belinostat −36.4
Disclaimer/Publisher’s Note: The statements, opinions and data contained in all publications are solely those of the individual author(s) and contributor(s) and not of MDPI and/or the editor(s). MDPI and/or the editor(s) disclaim responsibility for any injury to people or property resulting from any ideas, methods, instructions or products referred to in the content.