Article

Effect of Initial Solid Solution Microstructure on the Hot Deformation Behavior of Mg-Er-Sm-Zn-Zr Alloy

by
Guiyang Shao
1,2,3,
Zhongyi Cai
2,
Chaojie Che
1,*,
Liren Cheng
1,
Minqiang Shi
1,2,
Tingzhuang Han
4,
Xiaobo Liang
5 and
Hongjie Zhang
1,6
1
State Key Laboratory of Rare Earth Resource Utilization, Changchun Institute of Applied Chemistry, Chinese Academy of Sciences, Changchun 130022, China
2
College of Materials Science and Engineering, Jilin University, Changchun 130025, China
3
Engineering Research Center for Deep Processing of Rare Metals, School of Engineering, Changchun Normal University, Changchun 130032, China
4
Department of Aviation Manufacturing Engineering, Changzhou Institute of Technology, Changzhou 213032, China
5
Jiangsu Key Laboratory of Advanced Manufacturing Technology, Huaiyin Institute of Technology, Huai’an 223003, China
6
Department of Chemistry, Tsinghua University, Beijing 100084, China
*
Author to whom correspondence should be addressed.
Crystals 2025, 15(10), 855; https://doi.org/10.3390/cryst15100855
Submission received: 27 August 2025 / Revised: 22 September 2025 / Accepted: 29 September 2025 / Published: 30 September 2025
(This article belongs to the Special Issue Mechanical Properties and Structure of Metal Materials)

Abstract

The hot deformation behavior of a Mg-9.2Er-4.9Sm-2.2Zn-0.6Zr (wt.%) alloy, with emphasis on the role of grain size and long-period stacking-ordered (LPSO) phases, was examined via comparison experiments. Two types of samples were obtained through distinct heat treatment schedules: sample A had a smaller grain size, featuring block-shaped LPSO phases at grain boundaries and lamellar LPSO phases within grains, while sample B had a larger grain size and few LPSO phases. The hot deformation behavior was characterized by the true stress–strain curve within the processing window of 300–450 °C and 0.001–1 s−1. The block-shaped LPSO phases contributed more significantly to strain hardening, leading to elevated flow stress in sample A, particularly under low-temperature and high-strain-rate conditions. Through the particle-stimulated nucleation (PSN) mechanism, block-shaped LPSO phases demonstrated greater efficiency in promoting Dynamic recrystallization (DRX) compared to lamellar LPSO phases; additionally, the synergistic effect between LPSO phases and grain boundary density further improved DRX efficiency. During hot deformation, dynamic precipitation of both block-shaped and lamellar LPSO phases occurred. The formation of block-shaped phases required a longer duration than that of lamellar ones. The presence of the LPSO kink exerted an influence on DRX, while a significant angle kink can promote DRX.

1. Introduction

Motivated by the requirements of energy saving and emission abatement, lightweight design has become a critical focus in materials engineering. Specifically, in fields such as automotive and railway, where weight minimization is a key objective, magnesium (Mg) and its alloys have been recognized as promising structural materials, and this is primarily due to their low density, high specific strength, and superior machinability [1,2,3].
The previous reports have demonstrated that alloying rare earth (RE) elements significantly enhances the mechanical properties of Mg alloys, particularly at elevated temperatures, via precipitation strengthening and solution strengthening [1,4]. The solid solubility of certain RE elements in the Mg matrix is high at high temperatures, such as Gd, Y, Er et al., while it decreases sharply with decreasing temperatures, which leads to an excellent aging hardening response in Mg-RE alloys [5]. Dual RE additions selected from separate families (i.e., cerium- and yttrium-group elements) into Mg alloys have been shown to effectively enhance their strength, as reported by Rokhlin [6]. The maximum solubility of Sm (from the cerium group) in Mg is 5.8 wt.%, contributing significantly to both solution and precipitation strengthening [7,8], and Sm is priced at only 20% of Nd [7]. Er (from the yttrium group) exhibits a maximum solid solubility of 32.58 wt.% in Mg. Moreover, under specific conditions, Mg-Er-Zn alloys can form LPSO phases, which have gained significant attention as reinforcing phases [9]. Therefore, incorporating Sm and Er into Mg alloys is expected to lead to substantial improvements in mechanical properties. However, there are few studies on the Mg-Sm-Er alloy system.
Wrought Mg alloys with high rare earth (RE) content exhibit excellent mechanical properties from ambient to elevated temperatures, and their development has seen significant progress to meet growing industrial demand. Yang et al. [10] achieved remarkable advancements in the Mg-Gd-Yb-Zn-Zr alloy, exhibiting superior mechanical characteristics. Specifically, at room temperature, the alloy reached an ultimate tensile strength (UTS) and yield stress (YS) of 425 MPa and 413 MPa, respectively. Even when tested at 300 °C, values of 204 MPa (UTS) and 191 MPa (YS) were recorded for the alloy. Besides Mg-7Y-4Gd-1.5Zn-0.4Zr (wt.%) (compositions in the text are in wt.% unless specified) [11], Mg-11Gd-5Y-2Zn-0.7Zr [12] alloys also have been developed. The superior mechanical properties exhibited by these alloys are primarily attributed to the strong thermal stability of nano-metastable precipitates and/or LPSO phases.
The accurate prediction of flow stress and the description of flow behavior via a constitutive model are crucial for optimizing the hot deformation process of wrought Mg alloys. The Arrhenius model effectively captures the temperature and strain rate dependence of flow stress in Mg alloys (e.g., AZ91, AZ80, and ZK60) [13,14,15]. In addition, Prasad et al. proposed a widely recognized approach for constructing processing maps using the dynamic material model (DMM), which assists in optimizing hot deformation parameters and elucidating microstructural evolution and flow instability mechanisms [16].
The primary impact of the LPSO phase on the hot deformation of Mg alloys has been mainly studied in Mg-Y-Zn and Mg-Gd-Zn alloys [17,18,19,20,21,22,23,24]. The effect of LPSO phases on dynamic recrystallization (DRX) has also been investigated. Most reports agree that DRX can be effectively activated at grain boundaries through the PSN mechanism by block-shaped LPSO phases. In contrast, DRX is inhibited within grains by the presence of lamellar LPSO phases and stacking faults (SFs) [25,26]. While it has been reported that intragranular lamellar LPSO phases could promote DRX via the PSN mechanism, though dense, fine stacking faults (SFs) tend to inhibit this effect [27]. Therefore, the impact of LPSO phases on DRX remains controversial, which will be discussed in this paper.
In this work, a Mg-9.2Er-4.9Sm-2.2Zn-0.6Zr alloy was prepared. Different initial microstructures were obtained through distinct heat treatment schedules: one with a smaller grain size and containing LPSO phases, and the other with a larger grain size and nearly no LPSO phases. Hot compression tests were carried out to analyze the effect of these initial microstructure differences on the alloy’s hot deformation behavior. Additionally, the activation energy of plastic flow, the hot processing map, and microstructural evolution were also investigated.

2. Materials and Methods

Mg-9.2Er-4.9Sm-2.2Zn-0.6Zr (wt.%) alloy was prepared by melting commercially pure Mg, Mg-30 wt.%Er, Mg-20 wt.%Sm, pure Zn, and Mg-30 wt.%Zr in a crucible under a protective atmosphere of CO2 and SF6. The melt was cast in a water-cooled cylindrical steel mold. The composition was analyzed by inductively coupled plasma (ICP, see Table 1). Compression specimens (φ10 mm × 15 mm) were cut from the as-cast ingot. After various heat treatment schedules, two distinct samples, one with and one without LPSO phases, were obtained. After a 500 °C/4 h solution treatment, sample A exhibited LPSO phases both at grain boundaries and within the grains. In contrast, sample B was heated to 530 °C and held for 10 h, resulting in minimal LPSO phase formation. Subsequently, the solution-treated samples were meticulously polished.
The flow stress of the experimental alloy was characterized via hot compression on a Gleeble-3800 simulator. Testing conditions included temperatures between 300 and 450 °C and strain rates spanning 0.001 to 1 s−1. A heating rate of 10 °C/s was applied to the samples, followed by a 3 min dwell time to achieve thermal homogeneity. Graphite sheets were used at the indenter–specimen interfaces to reduce friction. Deformation was applied until a 50% height reduction (true strain = 0.7) was reached. Subsequently, all compressed samples underwent rapid water quenching. Microstructural analysis employed a Soptop ICX41 M optical microscope (OM), a Qunta250 field-emission scanning electron microscope (SEM, 15 kV, 10 mm working distance), an Oxford NordlysMax2 EBSD instrument (0.3 µm step size), and a FEI Tecnai G2 F20 transmission electron microscope at 200 kV. All deformed samples were first bisected axially. OM and SEM examination required mechanical polishing and etching in a nitrous-alcoholic solution (4% HNO3 by volume). EBSD samples (3 mm thick, CD-oriented) underwent mechanical then electrochemical polishing in ACII electrolyte (−20 °C, 20 V, 0.2 A, 60 s). For TEM, foils were taken from 1 mm slices, ground to 50 µm, punched as 3 mm disks, then thinned by twin-jet electrophishing (30 V, −30 °C) and ion milling (Gatan 691, −30 °C, 4 eV). Figure 1 illustrates the overall experimental workflow adopted in this investigation.

3. Results and Discussion

3.1. Initial Microstructures

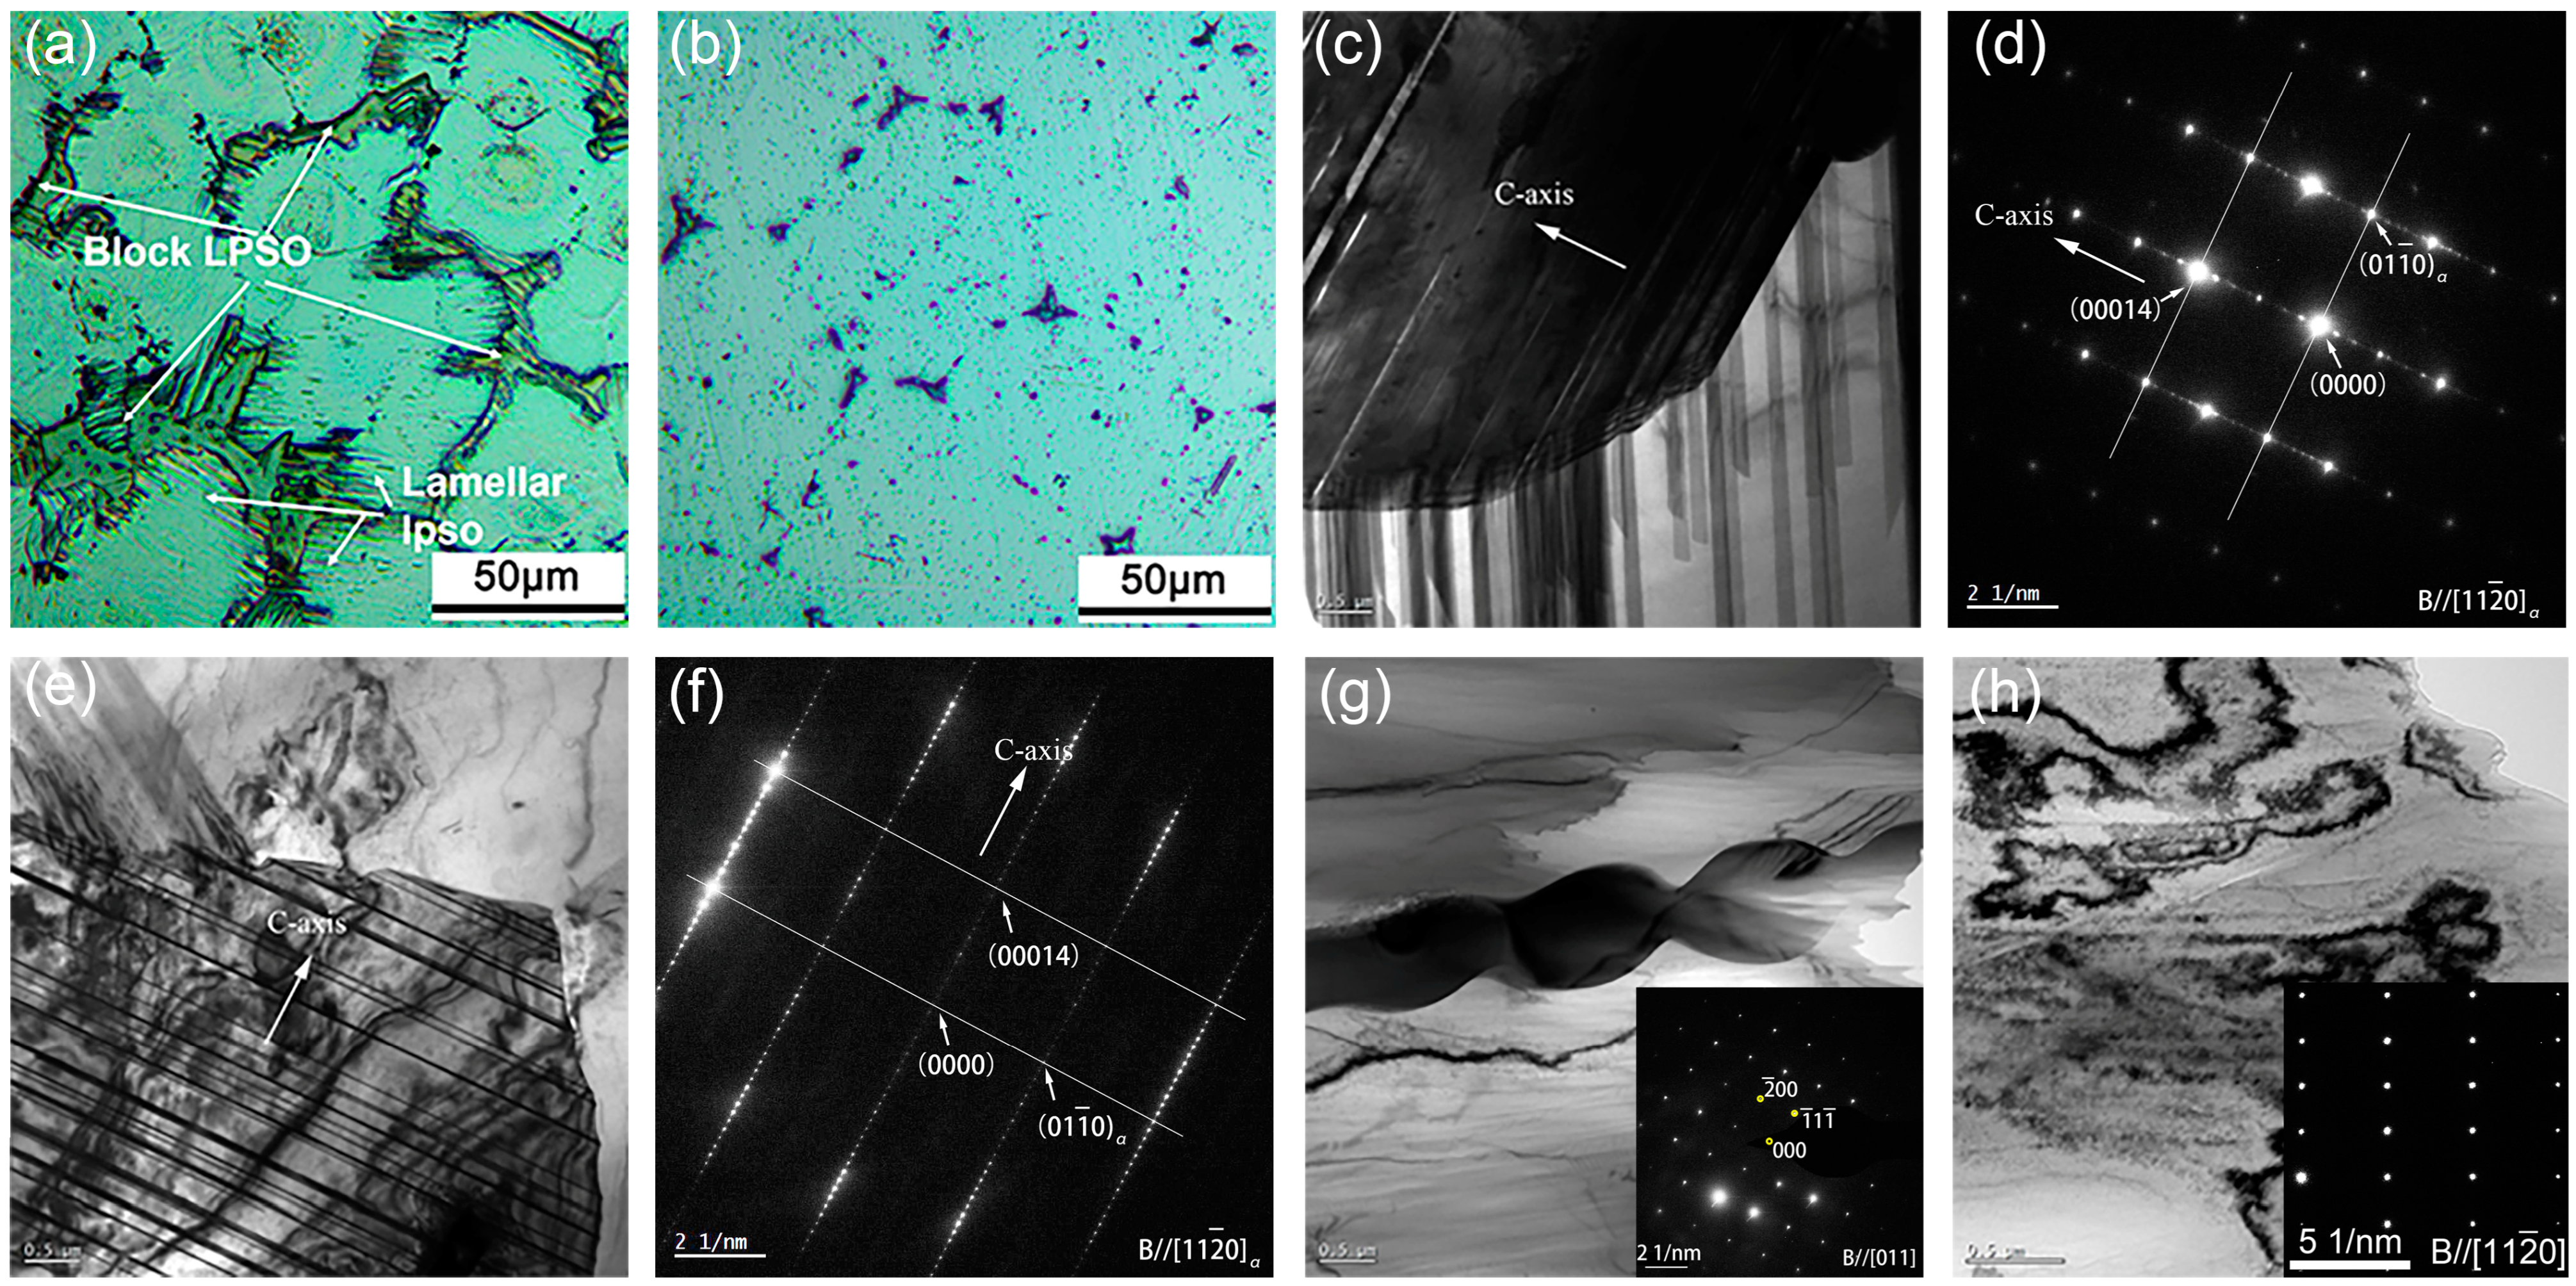
Figure 2a,b present OM images from samples A and B before deformation. Sample A contains numerous block-shaped phases located along grain boundaries, along with fine lamellar structures oriented perpendicular to these boundaries. Its mean grain size measures 40 ± 1.1 µm. In comparison, most grain-boundary phases in sample B have been predominantly absorbed into the magnesium matrix, resulting in considerable grain coarsening and a final average grain size of 47 ± 1.4 µm. Figure 2c,e display LPSO phases within sample A, illustrating microstructural features at grain boundaries and inside grains, respectively. Figure 2d,f present the corresponding selected area electron diffraction (SAED) patterns, which verify the existence of 14H LPSO phases located both at grain boundaries and within the grain. The bright-field TEM micrographs and the corresponding SAED patterns of sample B are illustrated in Figure 2g,h. For Figure 2g, the SAED pattern in the lower right corner corresponded to the second phase at the grain boundary. The second phase has a face-centered cubic (FCC) structure and is similar to the (Mg, Zn) RE3 phase [28,29]. For Figure 2h, the SAED pattern corresponded to the matrix. The combined analyses of Figure 2g,h demonstrate the absence of LPSO phases either along the grain boundaries or within the grains.

3.2. Flow Stress

3.2.1. Work Hardening and Dynamic Softening

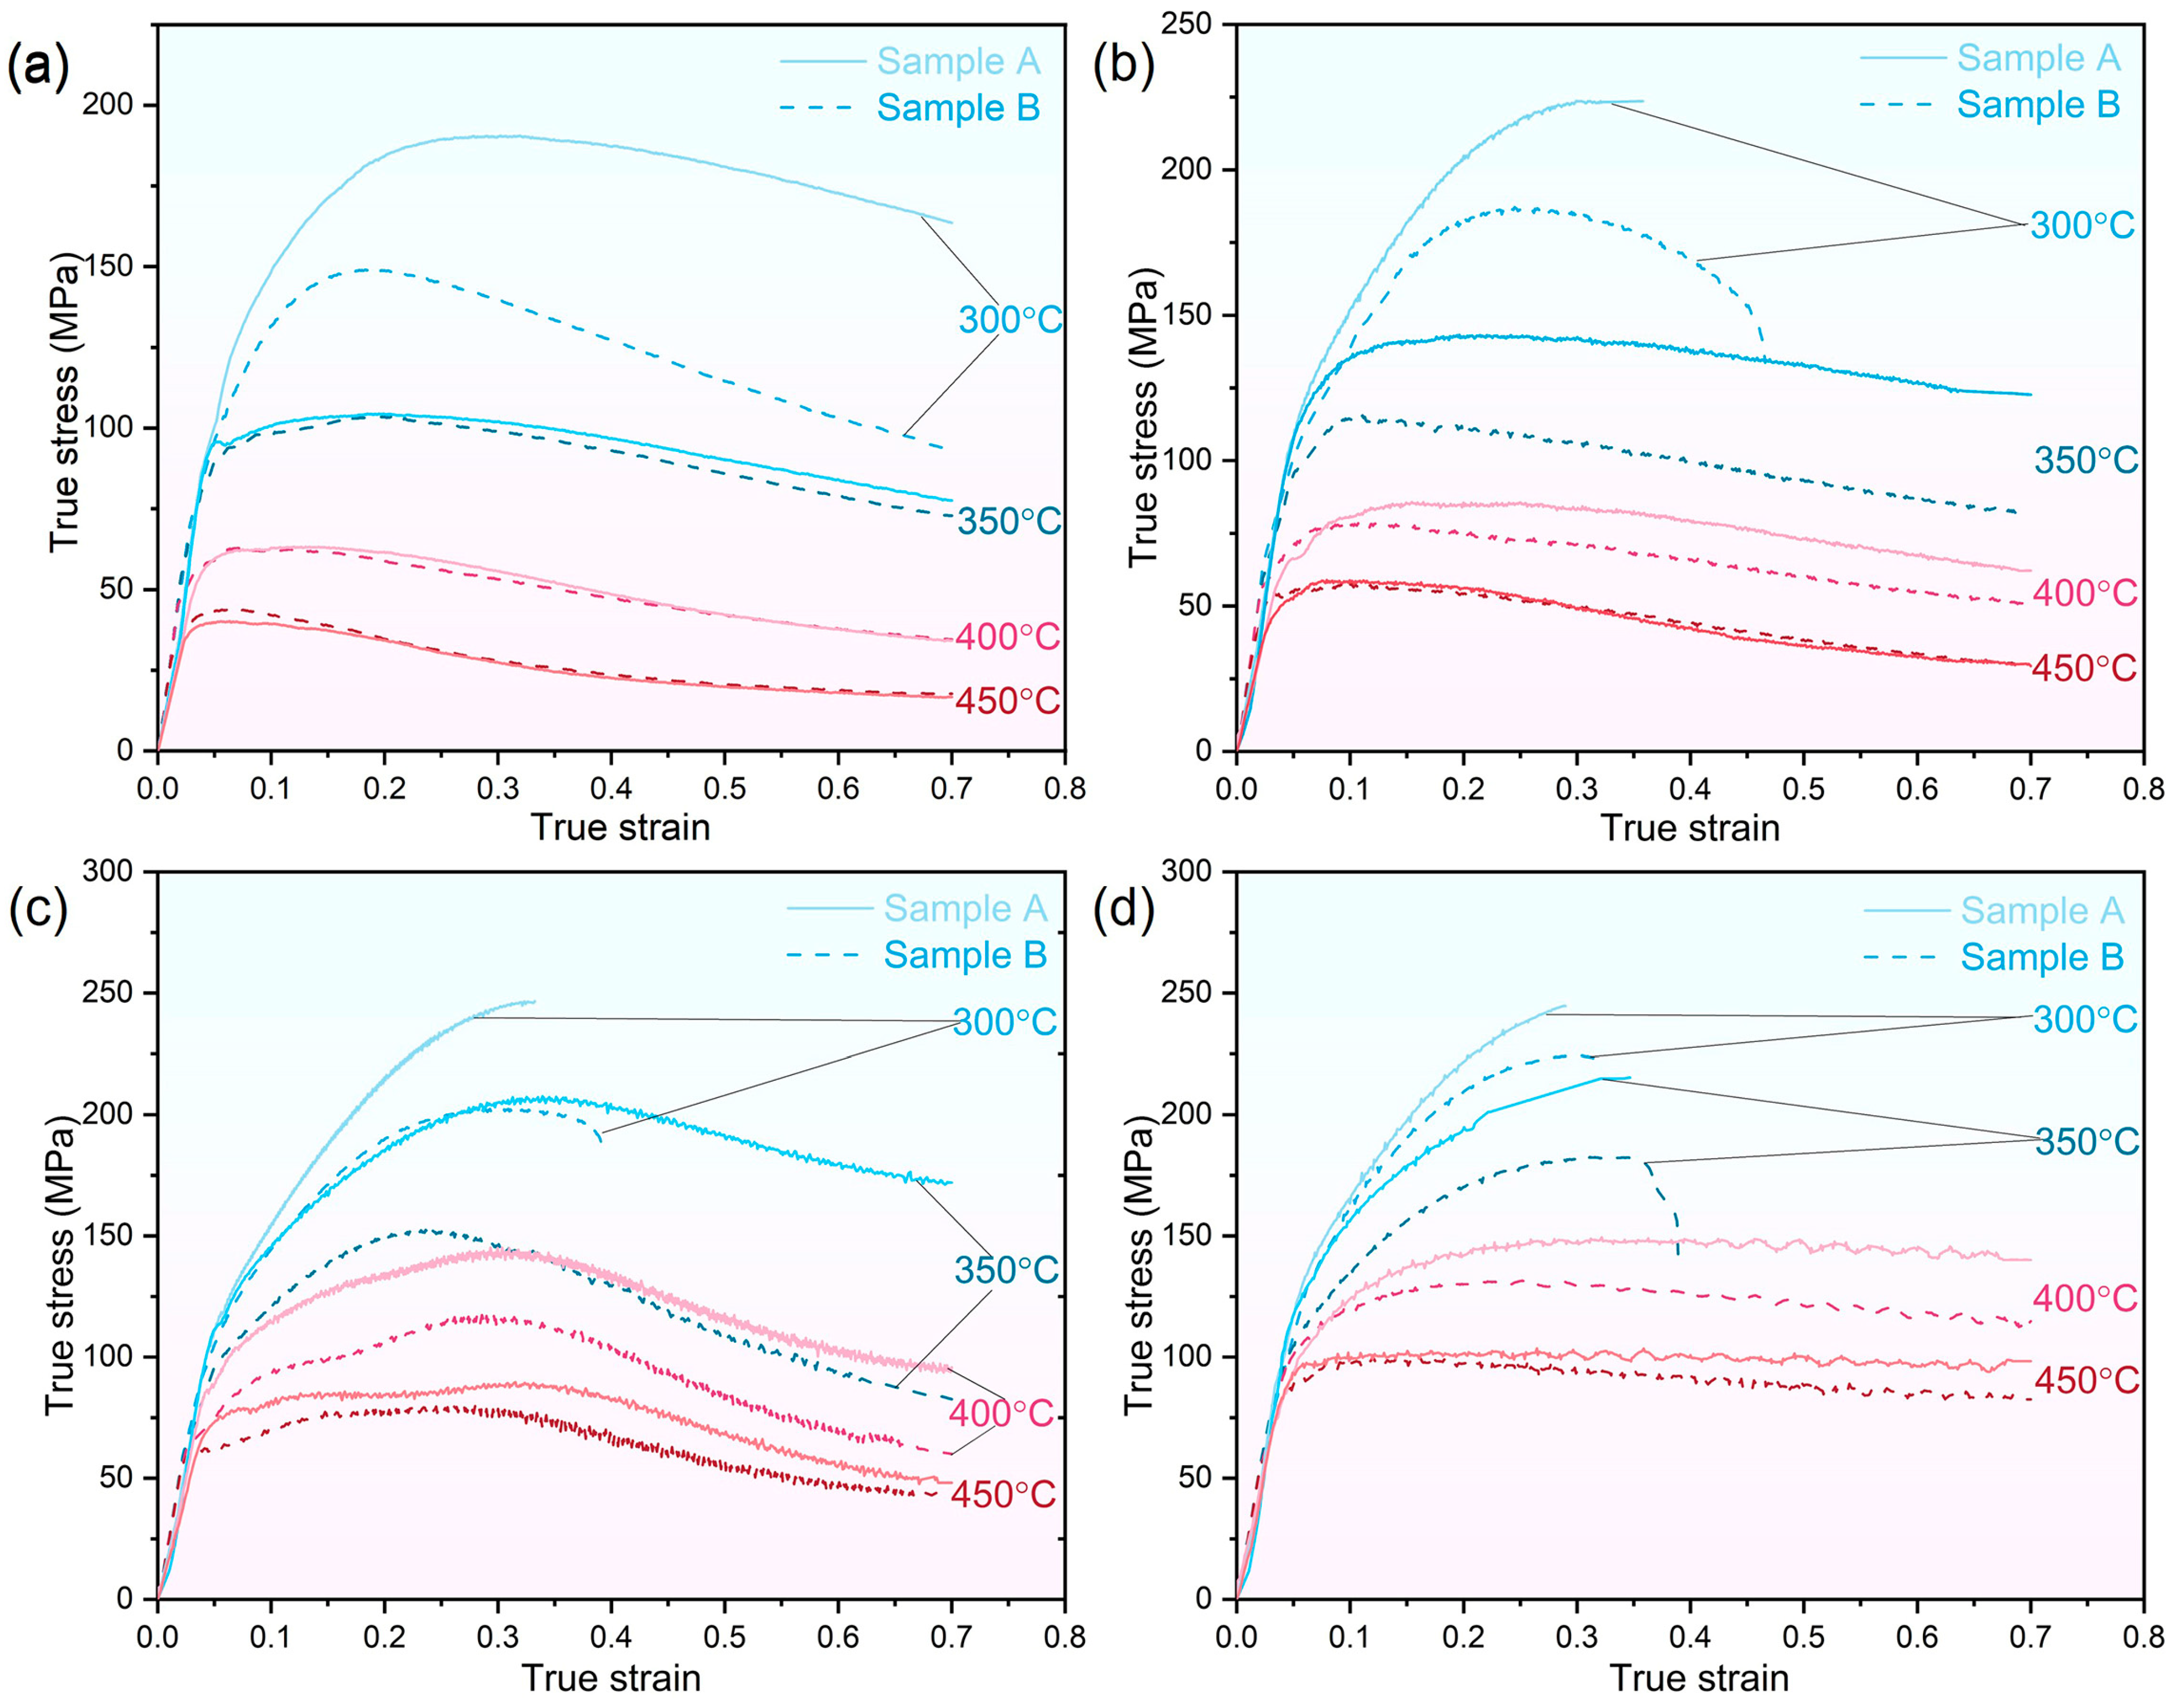
Figure 3 displays the flow stress curves of both samples across a range of temperatures and strain rates. The flow stress shows a strong dependence on deformation conditions, including temperature and strain rate. The flow stress behavior can be categorized into three forms: (1) At 300 °C, the flow curves for both samples show significant instability under varying strain rates, ranging from 0.01 to 1 s−1. Fracture occurs following continuous work hardening, with premature shear failure oriented at approximately 45° to the compression direction. In contrast, under a 0.001 s−1 strain rate, the material exhibits stable deformation without failure. This suggests that instability is primarily induced by low-temperature and high-strain-rate conditions, and that lower strain rates delay the onset of instability. (2) Under deformation at 1 s−1 and 400–450 °C, the flow stress rapidly reaches a peak and then stabilizes in both samples. (3) Under most other deformation conditions, the flow stress in each sample quickly attains its peak stress, followed by a gradual decrease.
The flow stress behaviors described above can be effectively explained through microstructural analysis. Initially, dislocation multiplication and tangling cause significant work hardening, rapidly increasing the flow stress [30]. As deformation progresses, the dislocation density continues to rise, enhancing the driving force for recrystallization, which leads to intensified dynamic softening and a slower rate of flow stress increase [31]. Upon reaching peak flow stress, DRX initiates, and work hardening competes continuously with dynamic softening [31,32]. Three distinct flow stress behaviors can be observed: (1) the work hardening rate consistently exceeds that of dynamic softening rate; (2) a state of dynamic equilibrium is achieved between work hardening and dynamic softening; and (3) dynamic softening surpasses work hardening.

3.2.2. Effect of Initial Microstructures on Flow Stress

The initial microstructure plays a significant role in determining the flow stress. At 300 °C, sample A demonstrates a markedly greater flow stress compared to sample B across all tested strain rates. This discrepancy is further amplified by elevating strain rates (Figure 3). With rising temperature and declining strain rate, the disparity in stress–strain curves between the two samples diminishes, until they closely align.
With rising temperature, the peak stress of both samples decreased substantially. This reduction results from enhanced thermal activation, which facilitates dislocation motion at higher temperatures; in turn, this promotes dynamic softening [33]. In environments characterized by low temperatures and high strain rates, shear fractures at approximately 45° to the compression axis were observed in both samples during hot compression. The shear fracture is due to limited DRX at low deformation temperatures, where work hardening predominates the deformation process [34]. Throughout the compression process, the flow stress of sample A followed a similar trend to that of sample B. The initial deformation stage of all curves showed rapid strain hardening, with sample A exhibiting a higher degree of hardening compared to sample B, especially at low temperatures. Using the Hall–Petch relationship with a selected slope of k = 0.28 MPa/m1/2 (noted as a room-temperature value [35]), the flow stress difference induced by grain size variation between samples is calculated to be only ~3.4 MPa, confirming that grain size is not the main factor affecting strain hardening. Moreover, k decreases significantly with increasing temperature, which would further reduce the flow stress difference [36]. By contrast, sample A’s block-type LPSO phases enhance strain hardening, primarily through the reinforcement capability of structural defects in these phases that hinder dislocation movement within the matrix [37]. Furthermore, strain hardening is intensified by the kinking deformation of LPSO phases. However, the extent of strain hardening significantly decreases with increasing temperature, as non-basal slip becomes more prominent at higher temperatures [38].

3.3. Constitutive Equation

To elucidate the relationship between deformation conditions and flow stress, a constitutive equation has been established to analyze the deformation behavior. Under conditions where ασ is less than 0.8, the material exhibits an exponential dependence of steady-state flow stress on strain rate, as demonstrated in Equation (1). Under high stress conditions (ασ > 1.2), the correlation follows a power-law function, formulated as Equation (2). Sellars and Tegart [39] formulated the modified Arrhenius relationship, incorporating the hot deformation activation energy (Q), effectively capturing the interdependence of deformation temperature (T), flow stress (σ), and strain rate ( ε ˙ ) for all stress states, as depicted by Equation (3).
ε   ˙ =   A 1 σ n 1 exp Q / RT
ε   ˙ =   A 2 exp β σ exp Q / RT
ε ˙ = A [ s i n h ( α σ ) ] n exp Q / RT
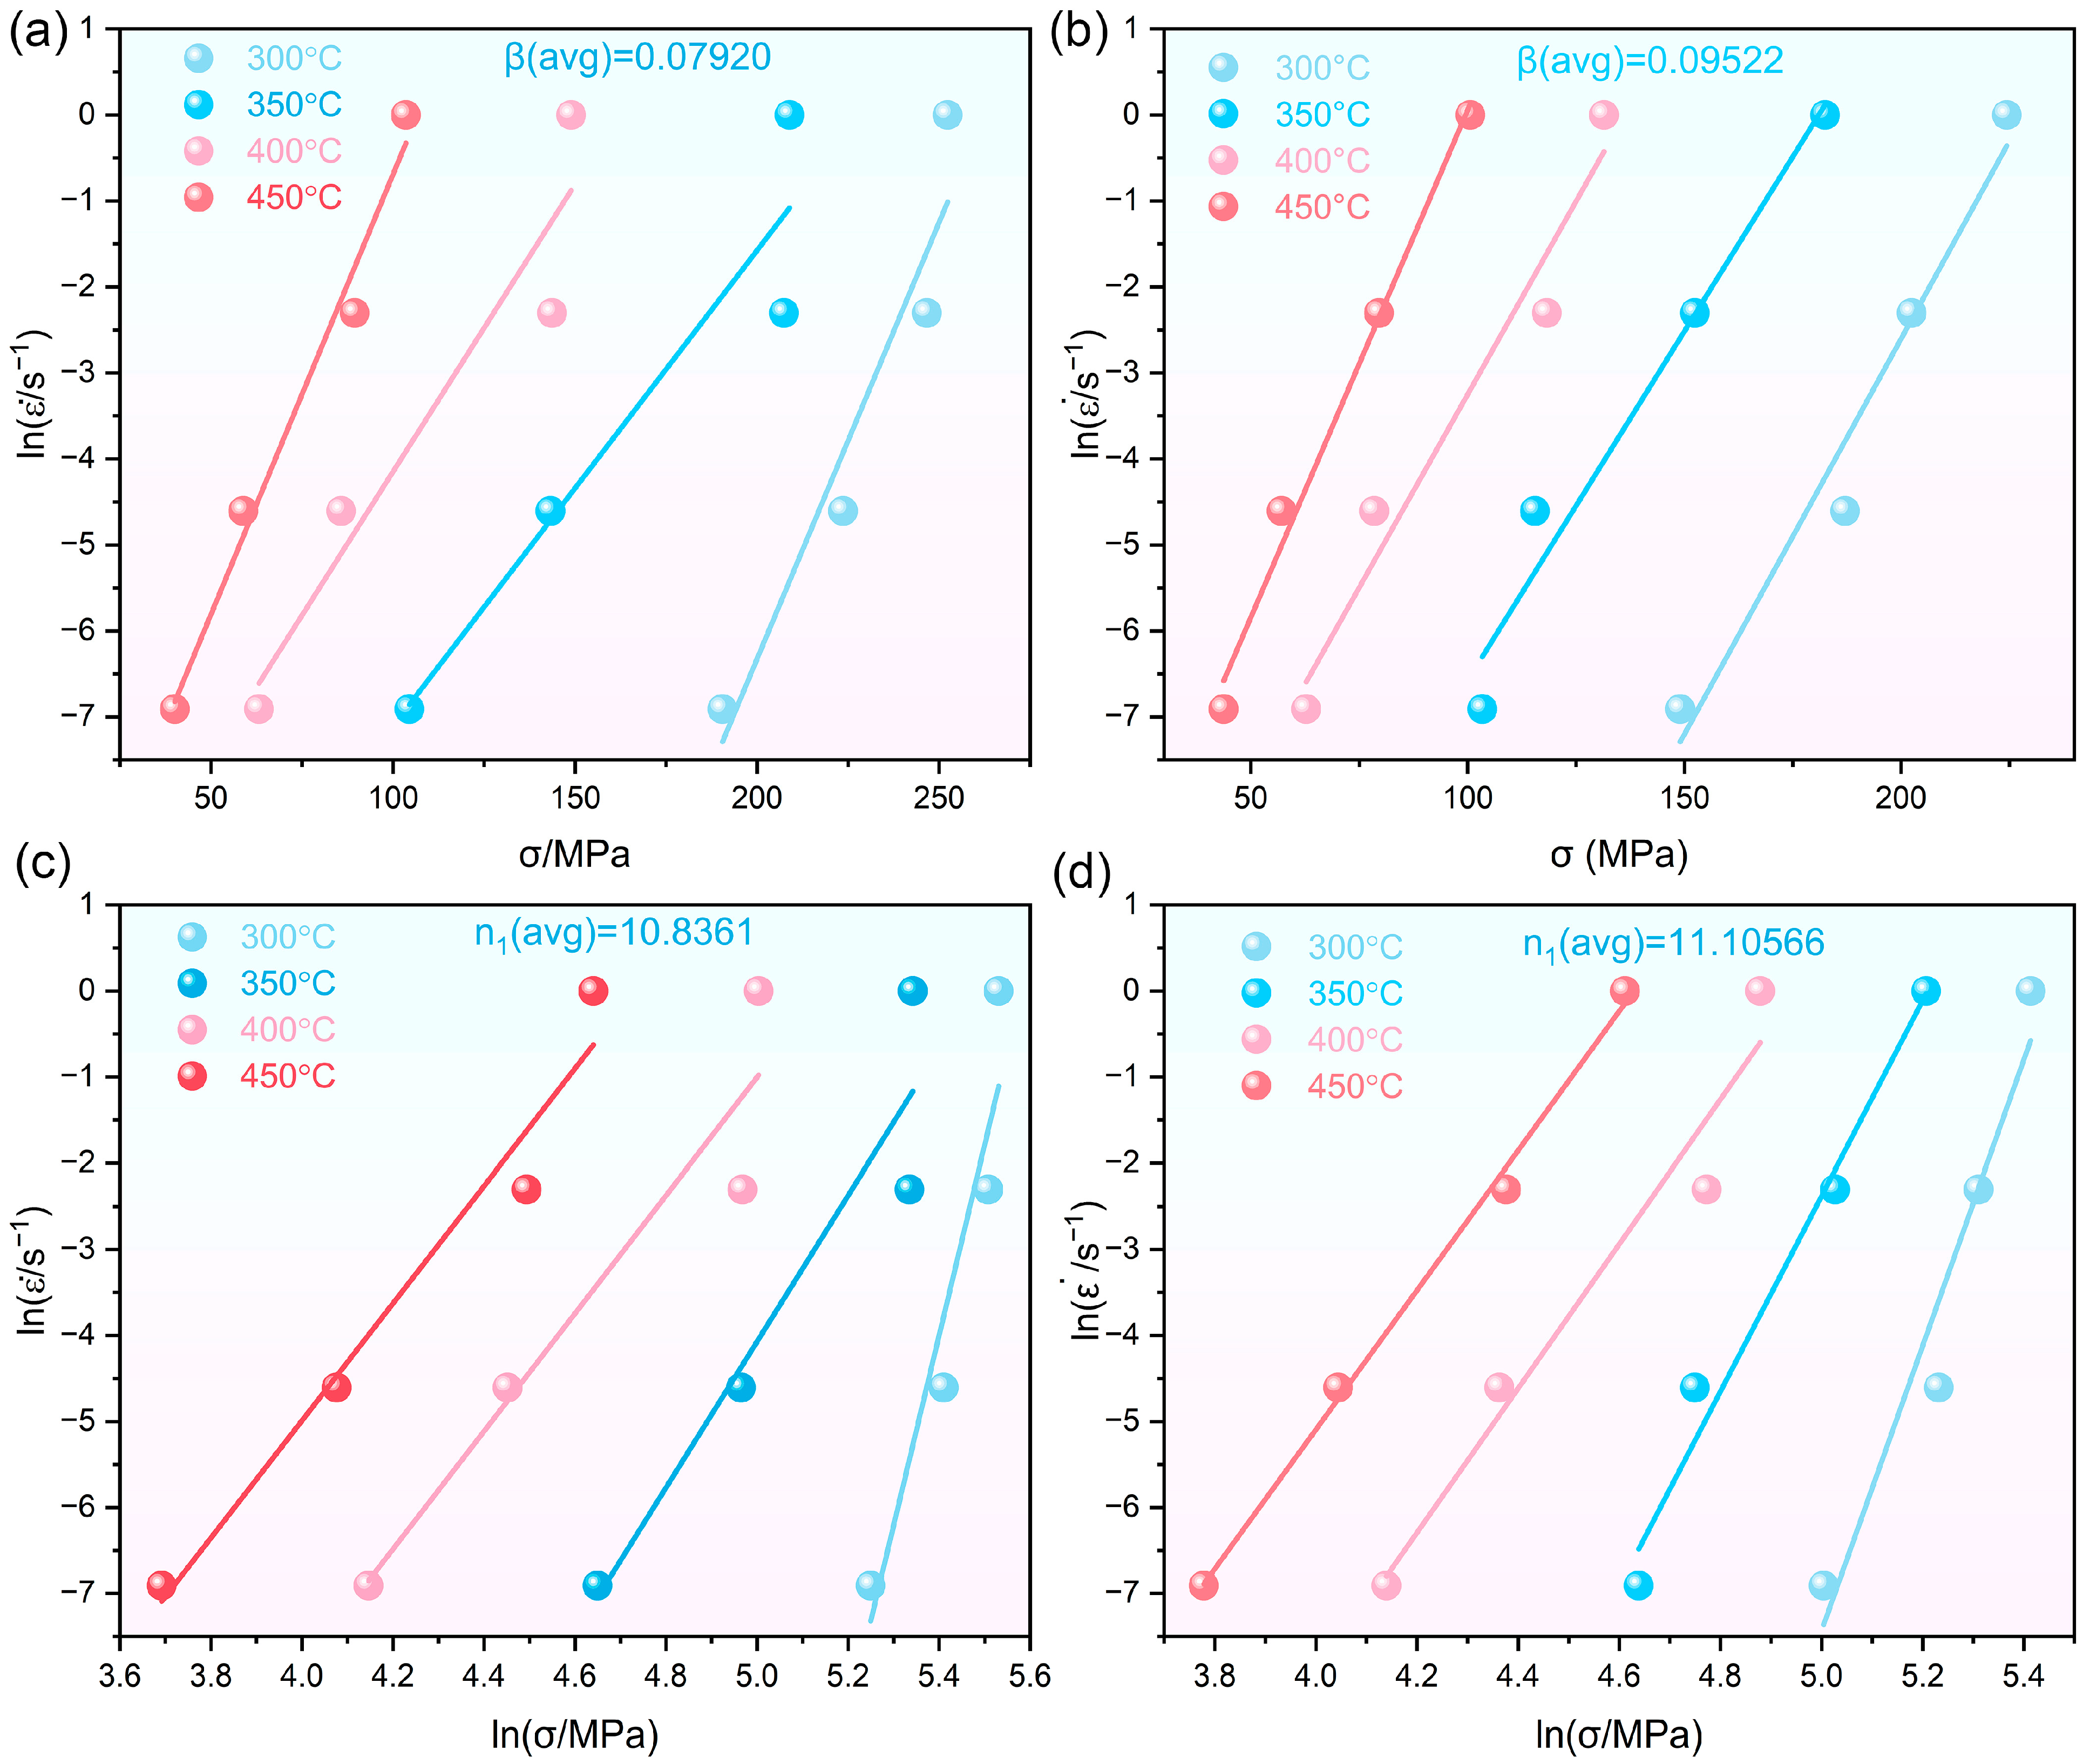
Here, ε ˙ is the strain rate (s−1); σ corresponds to the flow stress (MPa); A1, A2, and A (structure factors proportional to the position of thermal activation in the rate control mechanism); α (the reciprocal of the flow stress associated with the transition from exponential to power exponential correlation between temperature-compensated strain rate and flow stress); and n (stress index), are all material constants. Where α = β / n 1 , with β representing the slope of the fitting curves for l n ε ˙ and σ , n 1 denoting the slope of the fitting curves for l n ε ˙ and l n σ . The curves of l n ε ˙ σ versus l n ε ˙ l n σ for two experimental samples are depicted in Figure 4. The α values were calculated as 0.008574 for sample A and 0.007367 for sample B. The activation energy for deformation, Q (kJ/mol), corresponds to the minimum energy barrier necessary to initiate for atomic rearrangement during plastic deformation, and serves as a crucial characterization parameter for hot deformation in materials. T (°C)-temperature, and R =   8.314   J / ( mol · K ) -gas constant.
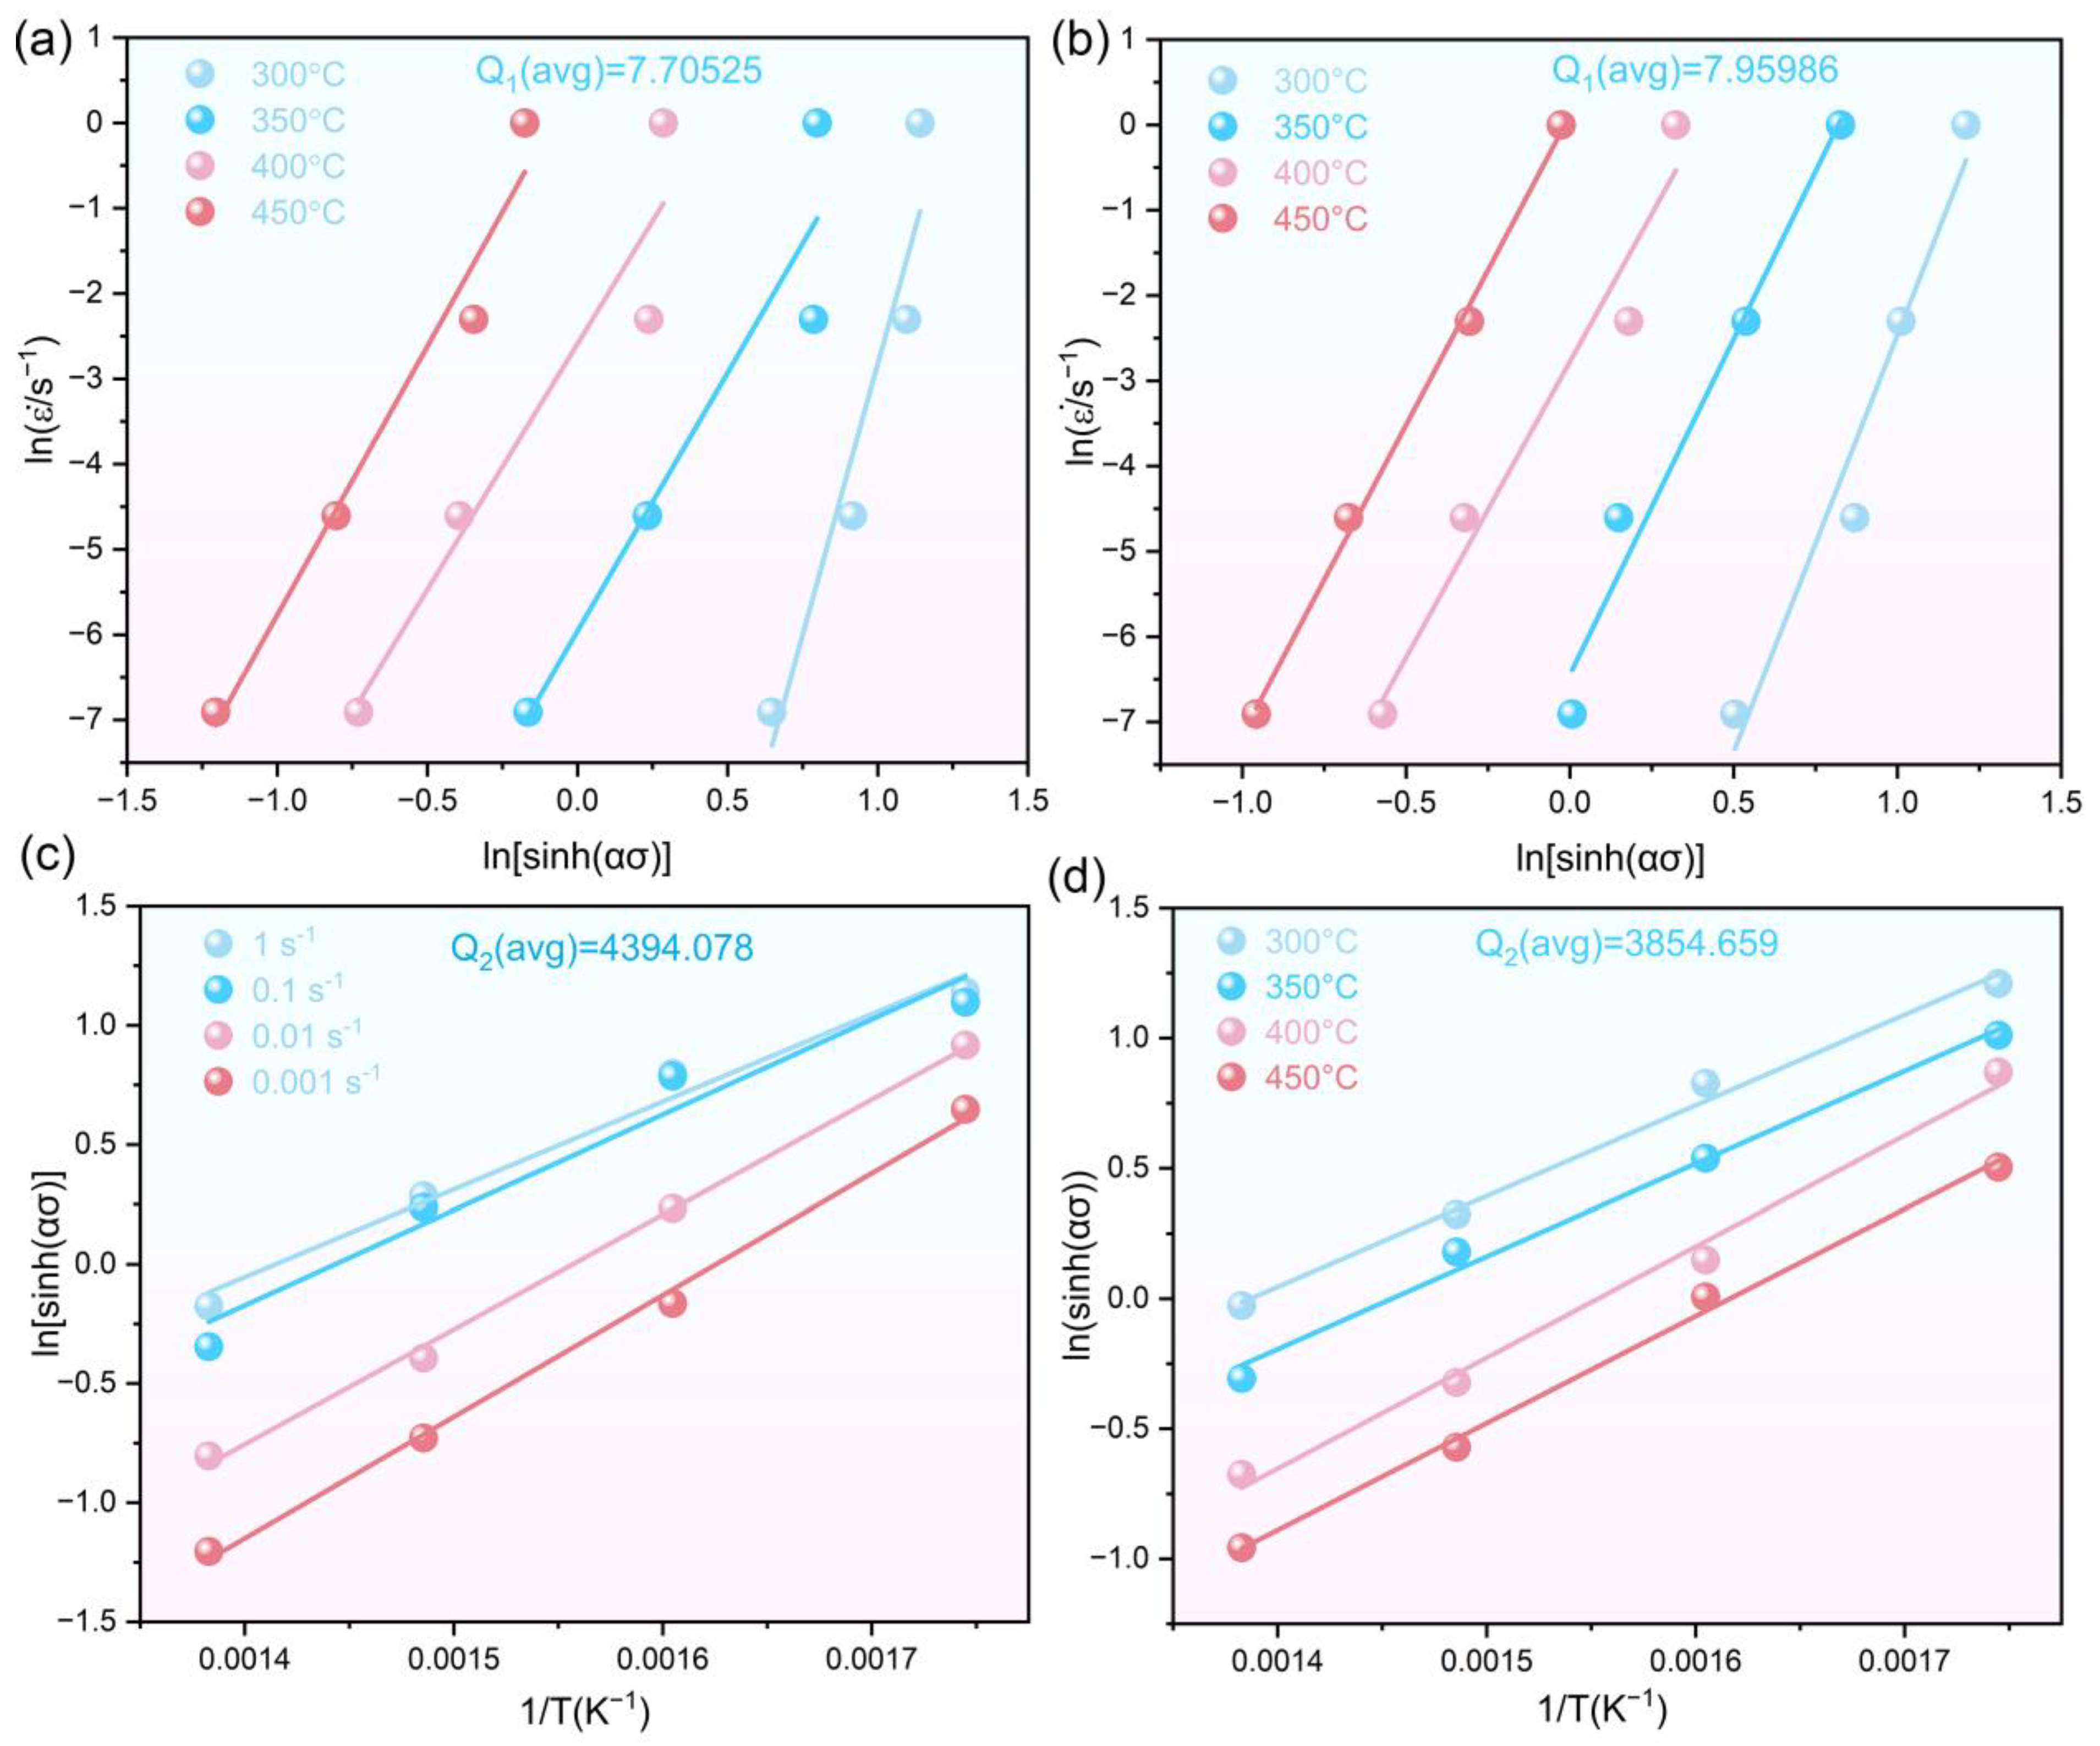
By simultaneously taking the logarithm of Equation (3), Equation (4) can be derived, providing a corrected value for Q. The second factor of Q1 represents the gradient of the linear relation ln ε ˙ ln [ sin h ( α σ ) ] at a specific temperature, while the third factor represents the slope of the linear relation l n s i n h α σ 1 / T for a specific strain rate.
Q = R · ln ε ˙ / ln sin h α σ | T · ln sin h α σ / 1 / T | ε ˙ = R · Q 1 · Q 2
The ln ε ˙ ln [ sin h ( α σ ) ] and l n [ s i n h ( α σ ) ] 1 / T hysteresis curves of the two experimental samples are depicted in Figure 5. The deformation energy of the two samples can be determined using Equation (4), with values of 281 for sample A and 255 kJ/mol for sample B. The deformation activation energy of the two samples is significantly elevated compared to pure Mg’s ( 135   k J / m o l ), which is primarily attributed to the increase in the contents of Sm and Er rare earth elements in the Mg matrix [40]. The increase in activation energy presents a greater difficulty to the deformation process, which is primarily attributed to factors such as the pinning effect, second equivalence, and dynamic precipitation. These factors hinder dislocation motion and consequently elevate the activation energy required for deformation [41]. The block-shaped LPSO phases at the grain boundaries of sample A contribute to second phase strengthening when deformed, thereby resulting in a higher Q compared to sample B [42].
Table 2 presents the hot deformation activation energies and key parameters of relevant Mg-based alloys. This study shows a significant increase in deformation activation energy for the two samples compared to pure Mg (self-diffusion activation energy: 135 kJ/mol) [41,43,44], primarily attributed to the increase in the contents of rare earth elements Sm [45] and Er in Mg matrix [40]. The increase in activation energy presents a greater difficulty for the deformation process, which is primarily attributed to factors such as the pinning effect of LPSO phases, second equivalence, and dynamic precipitation [40,41]. These factors collectively hinder dislocation motion and consequently elevate the activation energy required for deformation [41]. The block-like LPSO phase at the grain boundary of sample A, as a relatively hard grain boundary second phase [42], contributes to second phase strengthening during deformation, thereby resulting in a higher activation energy compared to sample B; the suppression of 14H-LPSO on the rotation of the relative lattice has the potential to yield a higher Q [43].
To account for flow behavior dependence on deformation temperature and strain rate, the Zener–Hollomon parameter was developed [46] to account for temperature effects during deformation through a compensation factor. The grain size of hot-deformed alloys is commonly analyzed using the Z-parameter. The Z parameter is mathematically described by Equation (5), which establishes its correlation with T and ε ˙ .
Z = ε ˙ e x p Q / R T = A s i n h α σ
Reformulate Equation (5) by employing a logarithmic transformation to its sides, resulting in Equation (6).
l n Z = l n A + n l n s i n h α σ
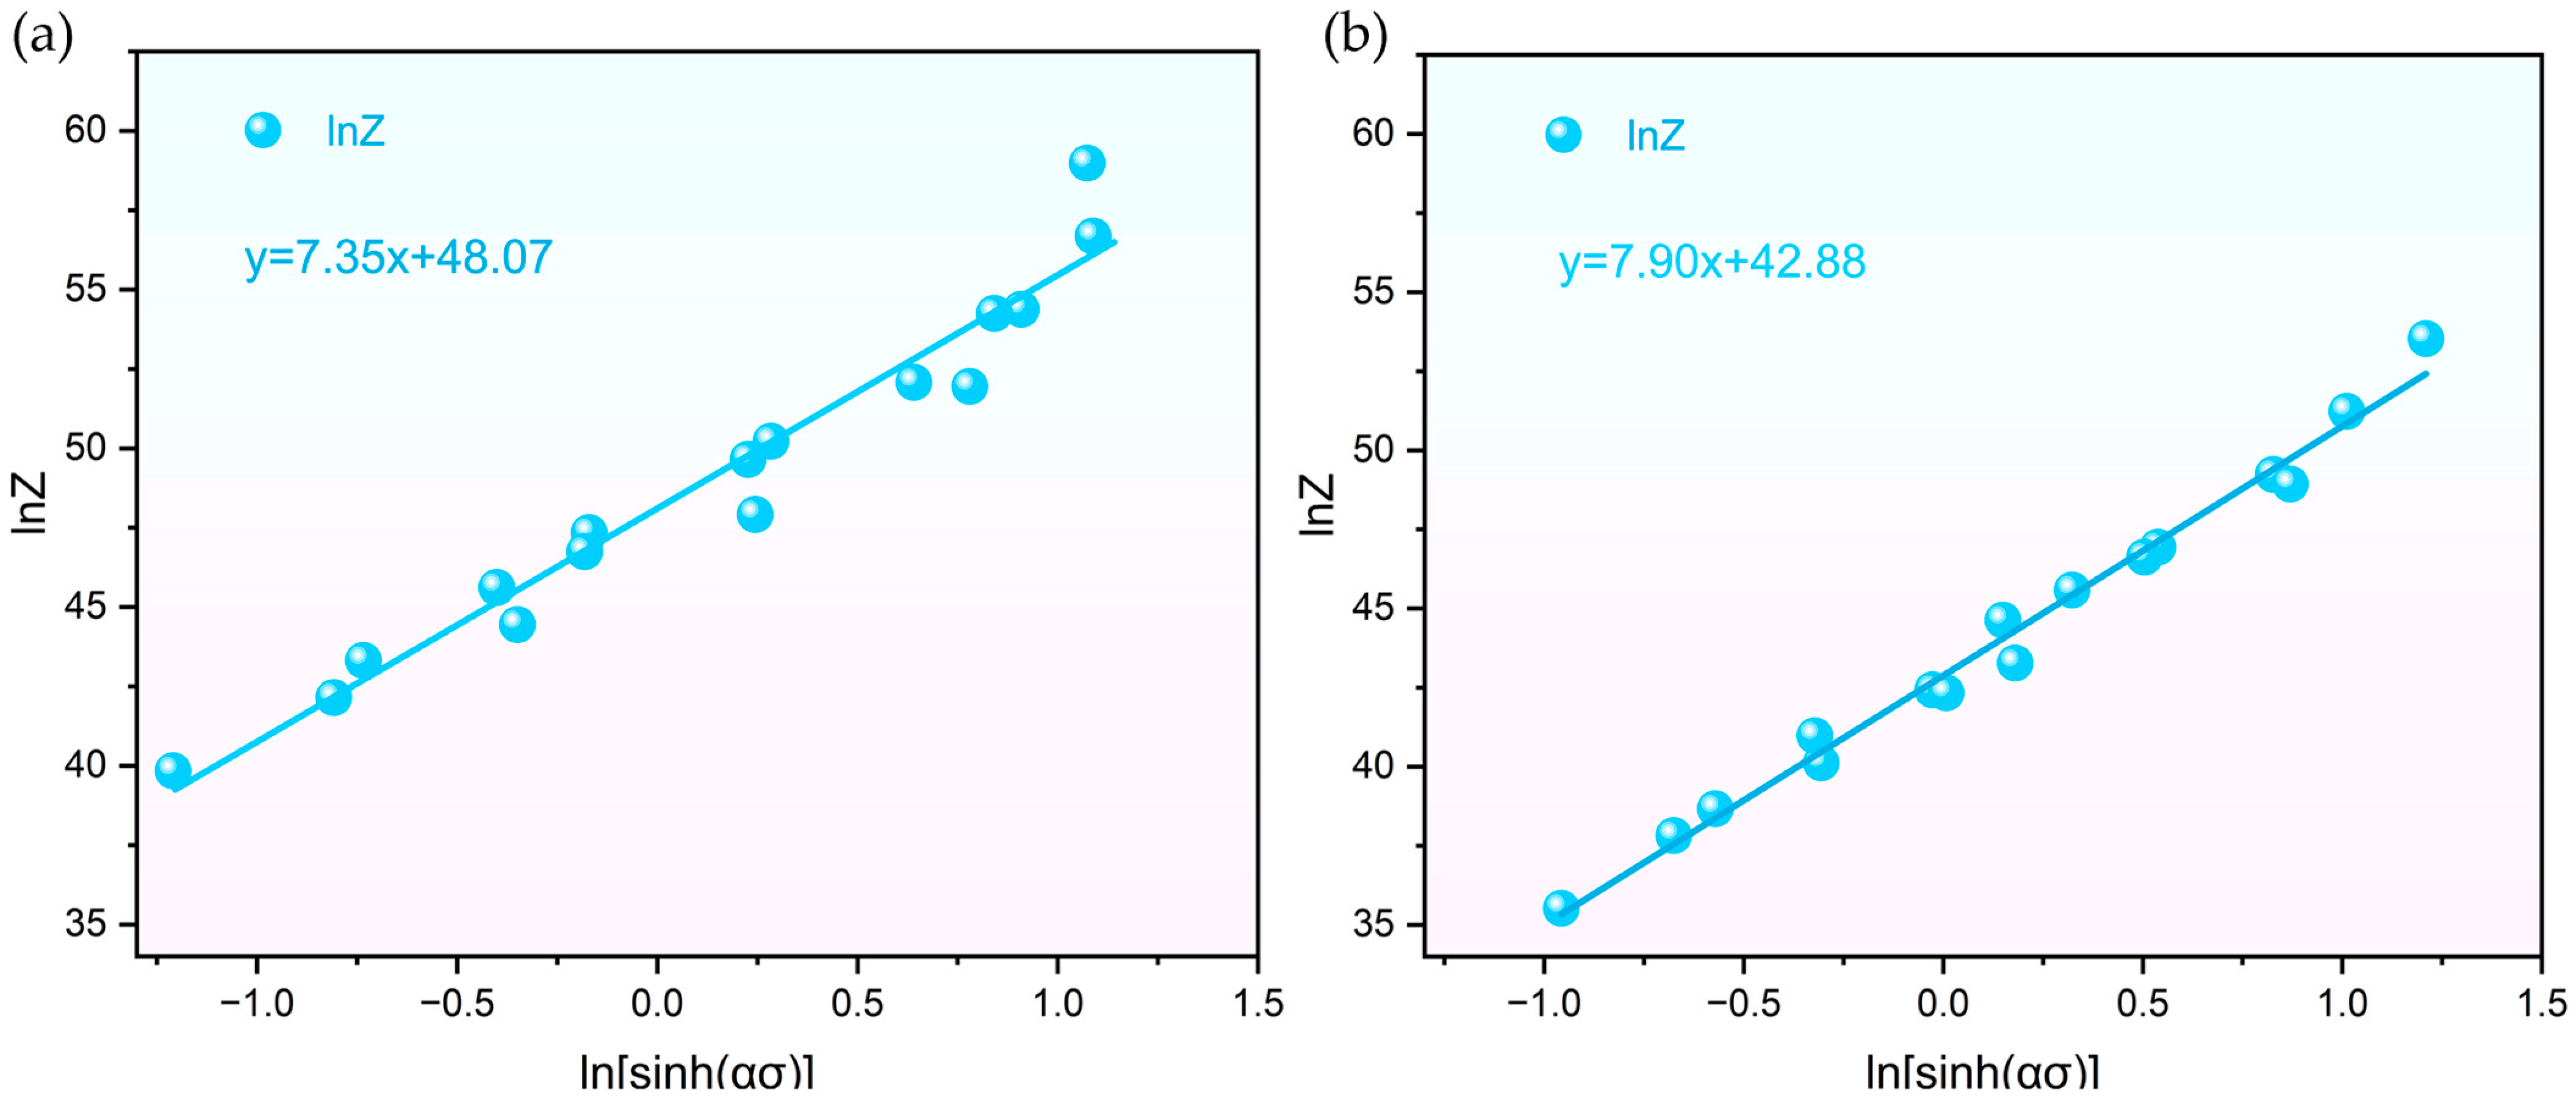
The correlation curve of l n Z l n [ s i n h ( α σ ) ] of the two samples is depicted in Figure 6. The linear distribution of all data points for both samples is evident. Through linear regression analysis, the stress index ( n ) and structure factor ( A ) of the two samples were determined, n = 7.35 and A = 7.53 × 10 20 for sample A, while n = 7.90 and A = 4.20 × 10 18 for sample B.
Equations (7) and (8) represent the constitutive behavior of sample A and B, respectively.
ε ˙ = 7.53 × 10 20 × [ s i n h ( α σ ) ] 7.35 e x p 281.491 / R T
ε ˙ = 4.20 × 10 18 × [ s i n h ( α σ ) ] 7.90 e x p 255.095 / R T
Figure 7a,b illustrate the comparisons between predicted stresses (calculated via Equations (7) and (8)) and experimental stresses for samples A and B, respectively, with the pink solid line denoting the “Perfect match line” (where predicted values equal experimental values). The overall distribution trend of data points for both samples aligns with the perfect match line, with a correlation coefficient (R) of 0.93 for sample A and 0.97 for sample B—evidencing that both constitutive equations can effectively capture the variation law of flow stress with deformation conditions. Notably, the predicted stress values for both samples are systematically lower than their experimental counterparts across the entire stress range; this deviation requires focused consideration in subsequent model optimization. Quantitative error analysis yields the following results: the average absolute relative error (AARE) is 19.73% for sample A and 14.13% for sample B, both of which are below 20%. Consistent with engineering standards for metallic material constitutive models [47,48], these metrics confirm that the constitutive equations for both samples meet engineering application requirements. Actually, during the hot compression experimental process, a friction and temperature rise can lead to deviations in the measured stress values, and the model calibrated for a friction and temperature rise demonstrates higher accuracy.

3.4. Processing Maps

Based on the DMM, processing maps serve as an effective means to evaluate and optimize the hot workability of Mg alloys. In the DMM, the material functions as a nonlinear energy dissipator, wherein the total dissipated power (P) comprises two distinct components; according to Equation (9) [49], the dissipated energy G is generated by plastic deformation, and the power dissipation J is linked to microstructure variations.
P = σ ε ˙ = G + J = 0 ε ˙ σ d ε ˙ + 0 σ ε ˙ d σ
The strain rate sensitivity index (m), presented in Equation (10), characterizes the ratio of dissipated energy during deformation.
m = d J / d G = ε ˙ d σ / σ d ε ˙ = l n σ / l n ε ˙
The maximum value of J, denoted as Jmax, is achieved when m = 1, corresponding to the ideal dissipative state of the material. The relationship between J and Jmax during deformation is quantified by the power dissipation factor (η), as depicted in Equation (11).
η = J / J m a x = J 2 m / m + 1
Constructing a power dissipation diagram facilitates the visualization of the microstructural evolution, encompassing dynamic recovery, DRX, and super-plasticity, as η fluctuates as a function of temperature and strain rate [50]. In general, an elevated η value indicates a higher proportion of energy allocated to the microstructure evolution within the overall energy, thereby increasing the likelihood of DRX or dynamic recovery and other softening phenomena occurring, and ultimately enhancing machinability [51]. However, the increase in η may also be attributed to rheological instability; hence, it is crucial to comprehensively consider both the power dissipation factor η and the material’s instability region during actual processing. Instability regions typically employ the Prasad instability criterion, derived from the rheological function given in Equation (12) [52].
ξ ( ε ˙ ) = l n m / m + 1 / l n ε ˙ + m < 0
The construction of hot processing maps involves superimposing the power dissipation diagram with the parameter ξ ( ε ˙ ) , which characterizes the correlation of deformation temperature with strain rate ε ˙ .
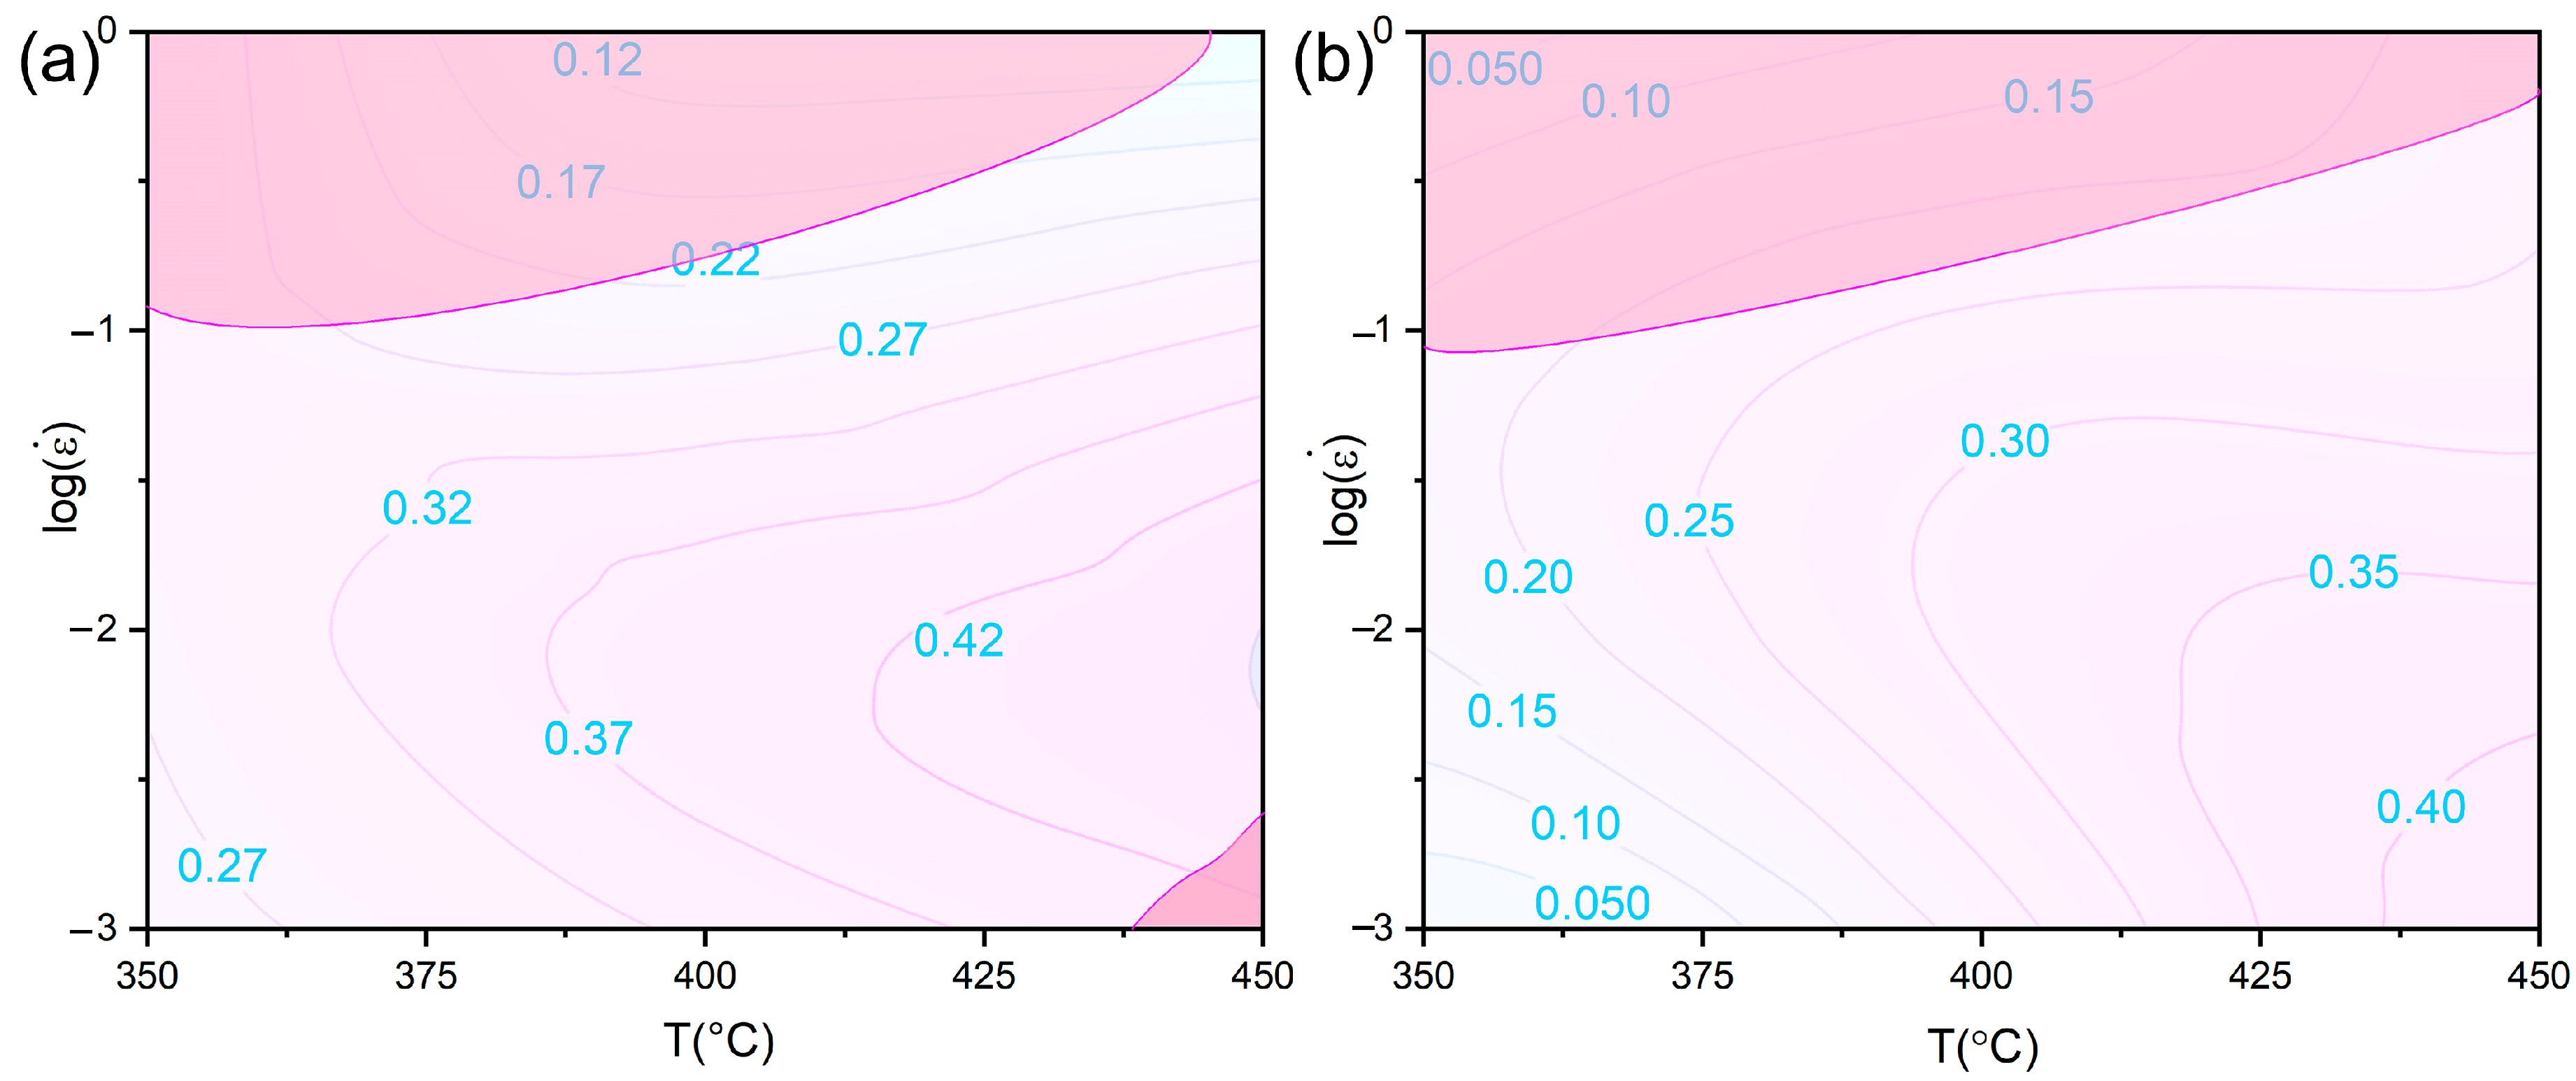
Due to a fracture at 300 °C, processing maps were constructed using only three temperatures. Figure 8a,b display the hot processing maps for both experimental samples under a true strain of 0.4. The contour plot illustrates the dissipation factor’s efficiency, while the hatched section indicates that the rheological instability criterion ξ ( ε ˙ ) < 0 is not suitable for hot working. In Figure 8, η progressively rises, moving from the upper-left to the lower-right region, and it directly correlates with DRX or dynamic recovery [52,53]. Sample A reaches its maximum η value at 450 °C/0.01 s−1, whereas the peak η for sample B occurs under 450 °C/0.001 s−1. Consequently, both samples exhibit an optimal thermal working performance. The two samples exhibit a fracture during deformation at 300 °C, resulting in the formation of an unstable plastic flow. At elevated strain rates (≥0.1 s−1), both samples exhibit unstable behavior. The η value of sample A exhibits higher values under various deformation conditions.
As mentioned above, friction and temperature rise during the experimental process can lead to deviations in the measured stress values, which in turn affect the accuracy of the hot processing map. Additionally, the DMM is based on certain assumptions and simplifications, while the actual material behavior may be more complex. Therefore, on the basis of calculations, we have revised the deformation instability region in the hot processing maps according to the macroscopic morphology of the compressed samples, as shown in Figure 8. The macroscopic morphologies of the compressed samples are present in Figures S1 and S2.

3.5. Microstructures

3.5.1. Dynamic Precipitation of LPSO Phases

The OM images were presented in Figure 9. At 300 °C, no discernible DRXed grains were observed. At a strain rate of 1 s−1 (Figure 8b,f), minimal signs of compression were evident, and the grains maintained an equiaxed morphology. However, at strain rate of 0.001 s−1 (Figure 8a,e), distinct flat deformed grains aligned in the same direction were prominently observed. The flow stress exhibited its highest values at this temperature in the stress–strain curves. With conditions of 450 °C/1 s−1, both samples exhibited grain deformation with consistent orientation. The block-shaped LPSO phases in sample A displayed a streamlined distribution along the vertical compression direction, effectively coordinating the deformation. Moreover, this streamlined distribution became more pronounced as the strain rate increased. The lamellar LPSO kinking deformation precipitated in the grain also can be observed in Figure 9.
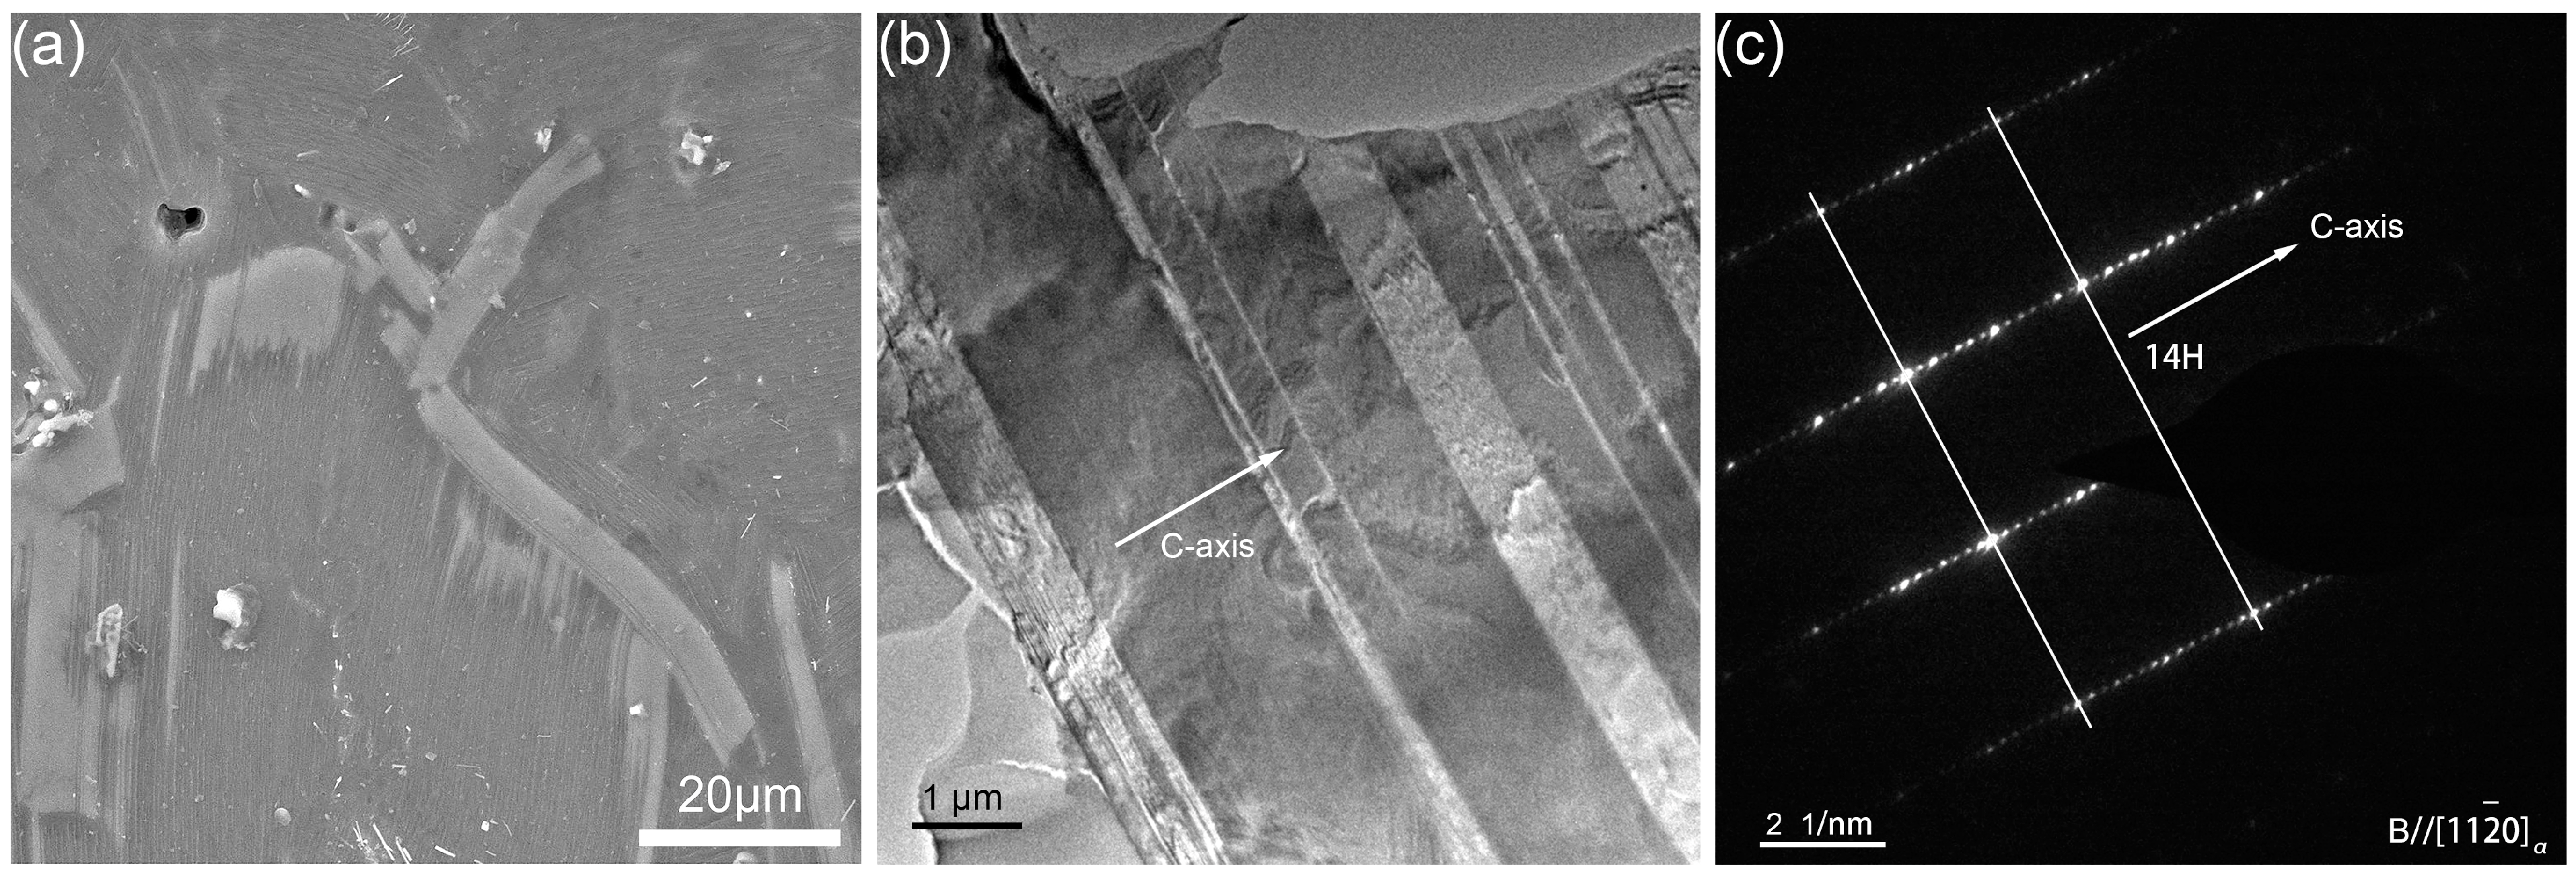
The dynamic precipitation of LPSO phases occurs during hot deformation, at grain boundaries and in the grains. An obvious increase in density was observed for the lamellar LPSO phases in the hot deformed grains in both samples. Moreover, block-shaped LPSO phases were observed in as-compressed sample B with 450 °C/0.001 s−1, as illustrated in Figure 9g. Specifically, Figure 10a presents the SEM micrograph, which further confirms the presence of such block-shaped LPSO phases at the microscopic scale. Meanwhile, the bright-field TEM image and SAED pattern are presented in Figure 10b,c, revealing a characteristic 14H stacking structure for the precipitated block-shaped LPSO phases.
After solution treatment, the supersaturated solid solution is formed in the grains for both samples. According to Su et al. [54], the activation energy provided by hot deformation is much larger than the formation energy and stability of the lamellar LPSO phases; the dissolution and re-precipitation of the lamellar LPSO phases occur almost simultaneously via dislocation slips and solute atoms’ diffusion during hot deformation. In contrast, the dynamic precipitation of block-shaped LPSO phases remains rarely studied. Zhao et al. [55] recently showed that the precipitation sequence of block-shaped LPSO phases during homogenization is as follows: 18R LPSO → metastable LPSO clusters → 14H LPSO. This suggests that the formation of block-like 14H LPSO phases is relatively slow, explaining why block-shaped LPSO phases precipitated in sample B at 450 °C/0.001 s−1 but not at 450 °C/1 s−1. The dynamic precipitation of block-shaped LPSO phases results in similar microstructures for both samples, leading to nearly identical stress–strain curves, as presented in Figure 3a.

3.5.2. Discontinuous and Continuous DRX
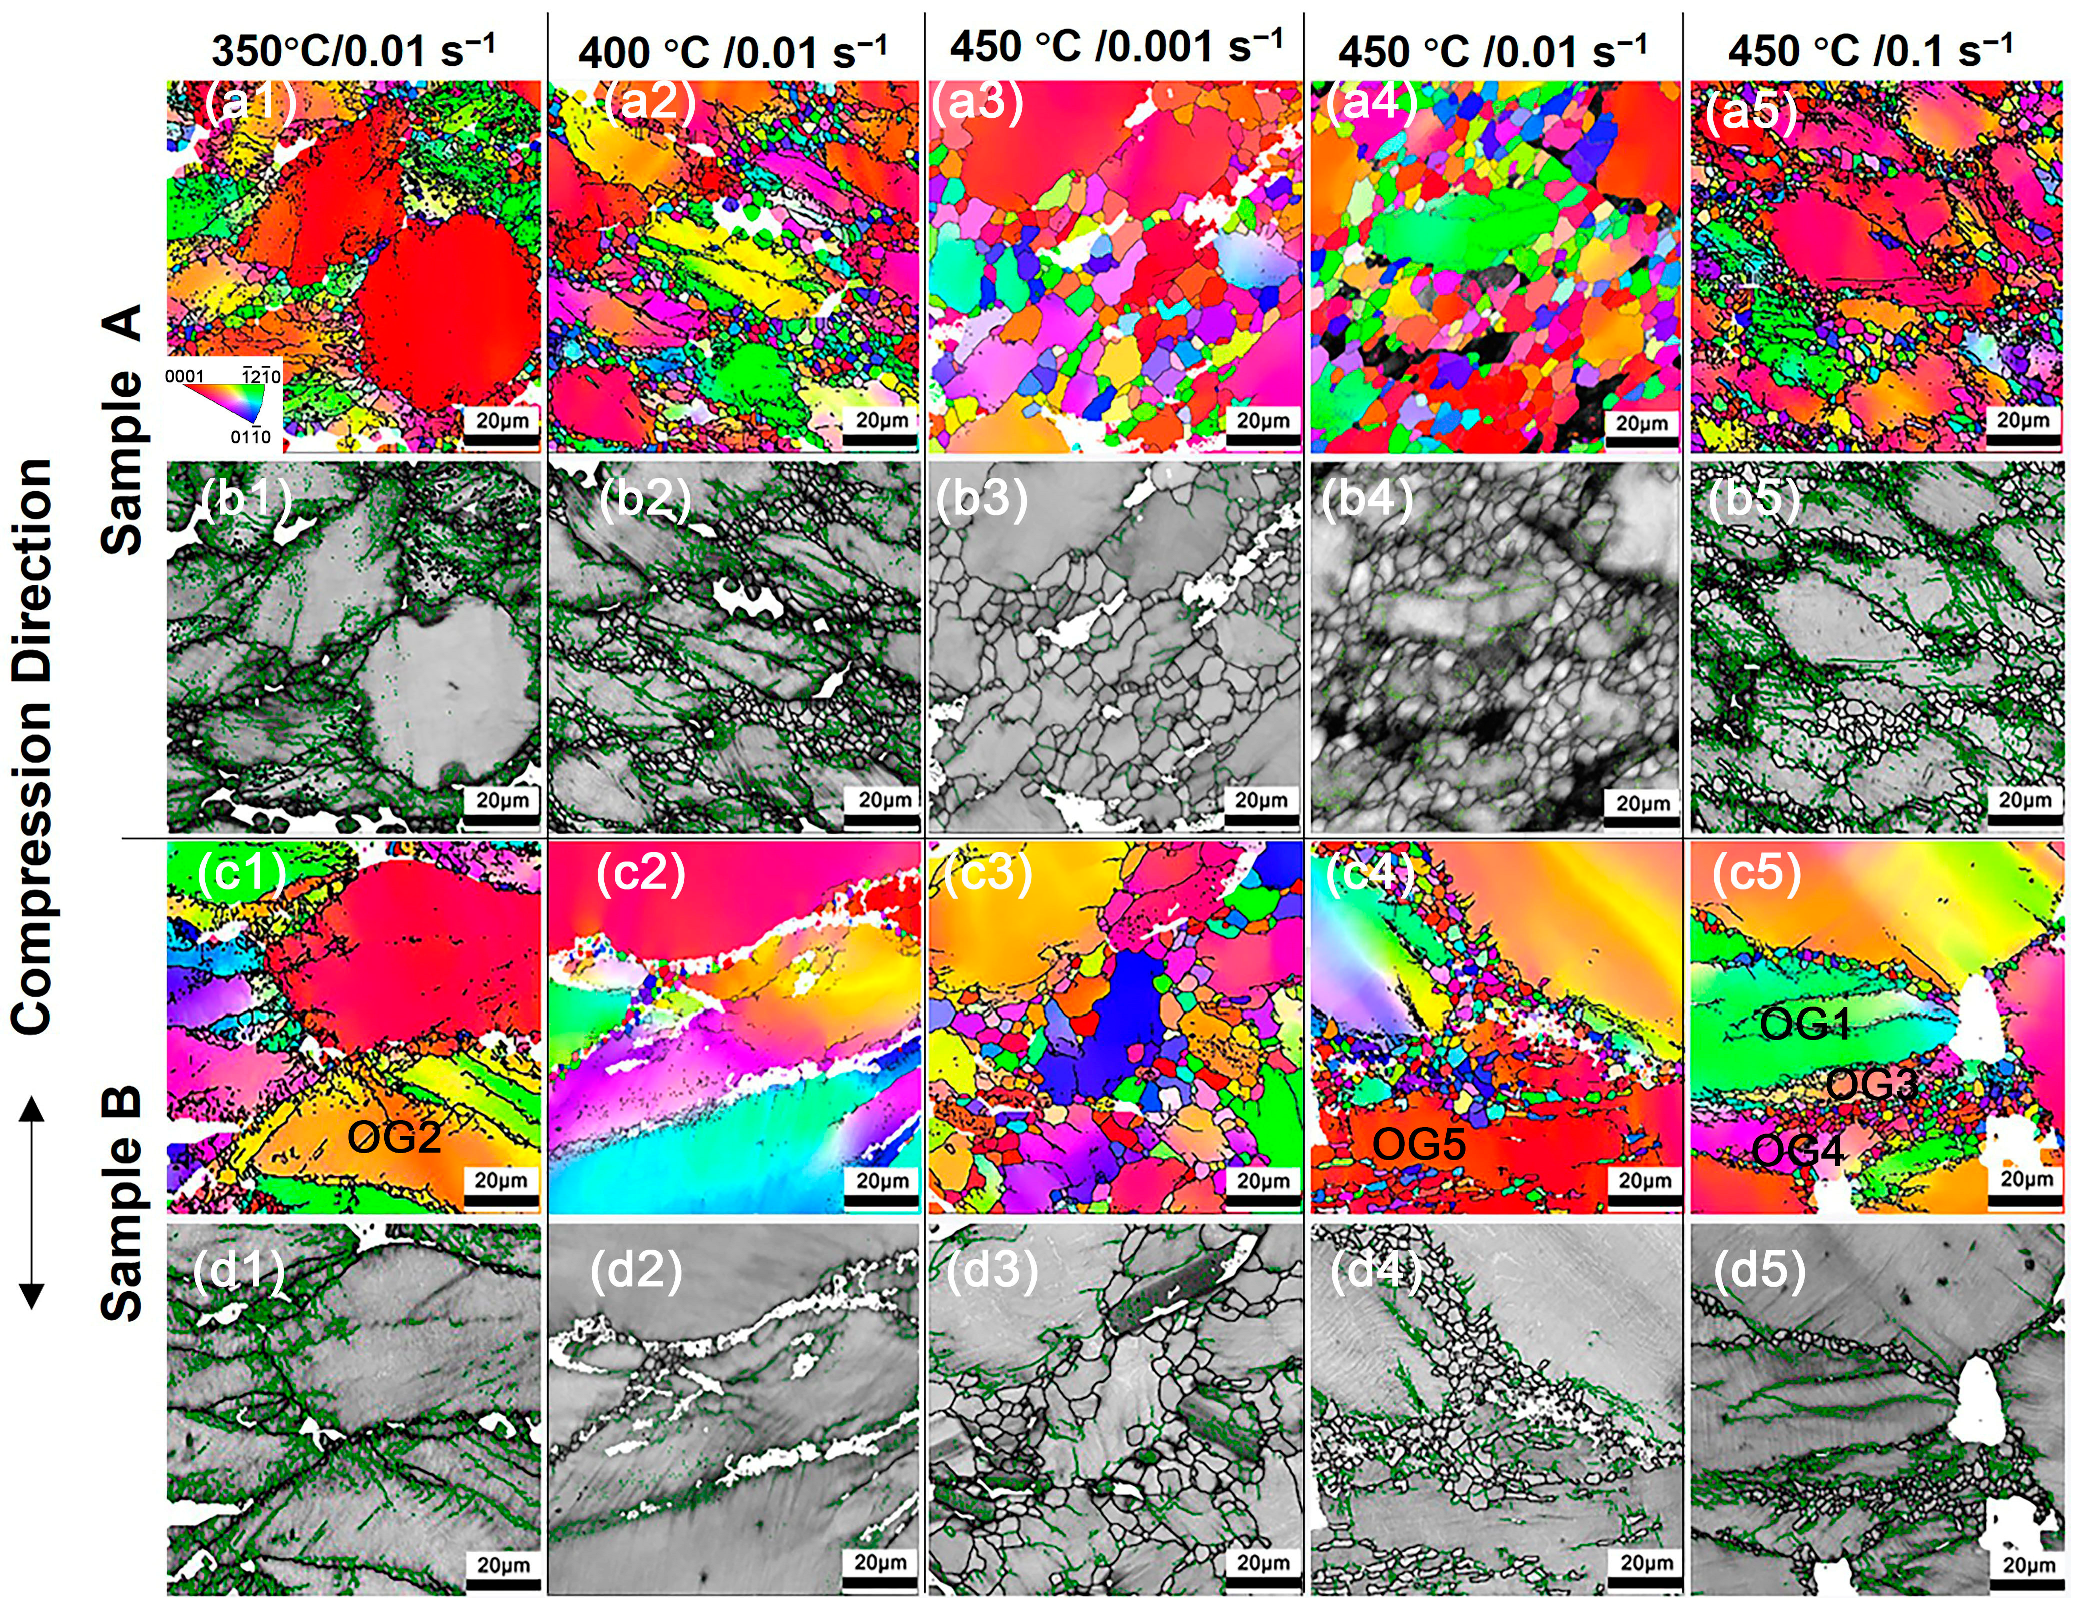
The inverse pole (IPF) maps and grain boundaries (GBs) maps of the as-compressed samples are presented in Figure 11. At 350 °C/0.01 s−1, DRXed grains primarily distributed at the original grain boundaries, and limited DRXed grains can be observed for both as-compressed samples. At 400 °C/0.01 s−1, obvious DRXed grains extended from the grain boundary into grain, leading to the formation of the DRXed grains “necklace” near the grain boundary, as presented in Figure 11(a2–d2). At 450 °C, the formation of the grains “necklace” was observed in both samples as the strain rate decreased. In the GBs maps in Figure 11, low-angle grain boundaries (LAGBs, 2° to 15°) are indicated by green lines, whereas high-angle grain boundaries (HAGBs), exceeding 15°, are indicated by black lines. The grain boundaries significantly impede the movement of dislocations, resulting in a substantial accumulation of dislocation entanglement at these interfaces. “necklace structure” consisting of DRXed grains along these boundaries [53]. The newly formed DRXed grains along the boundary of the deformed grains exhibit a necklace-like arrangement, serving as a distinctive characteristic of discontinuous dynamic recrystallization (DDRX) [56].
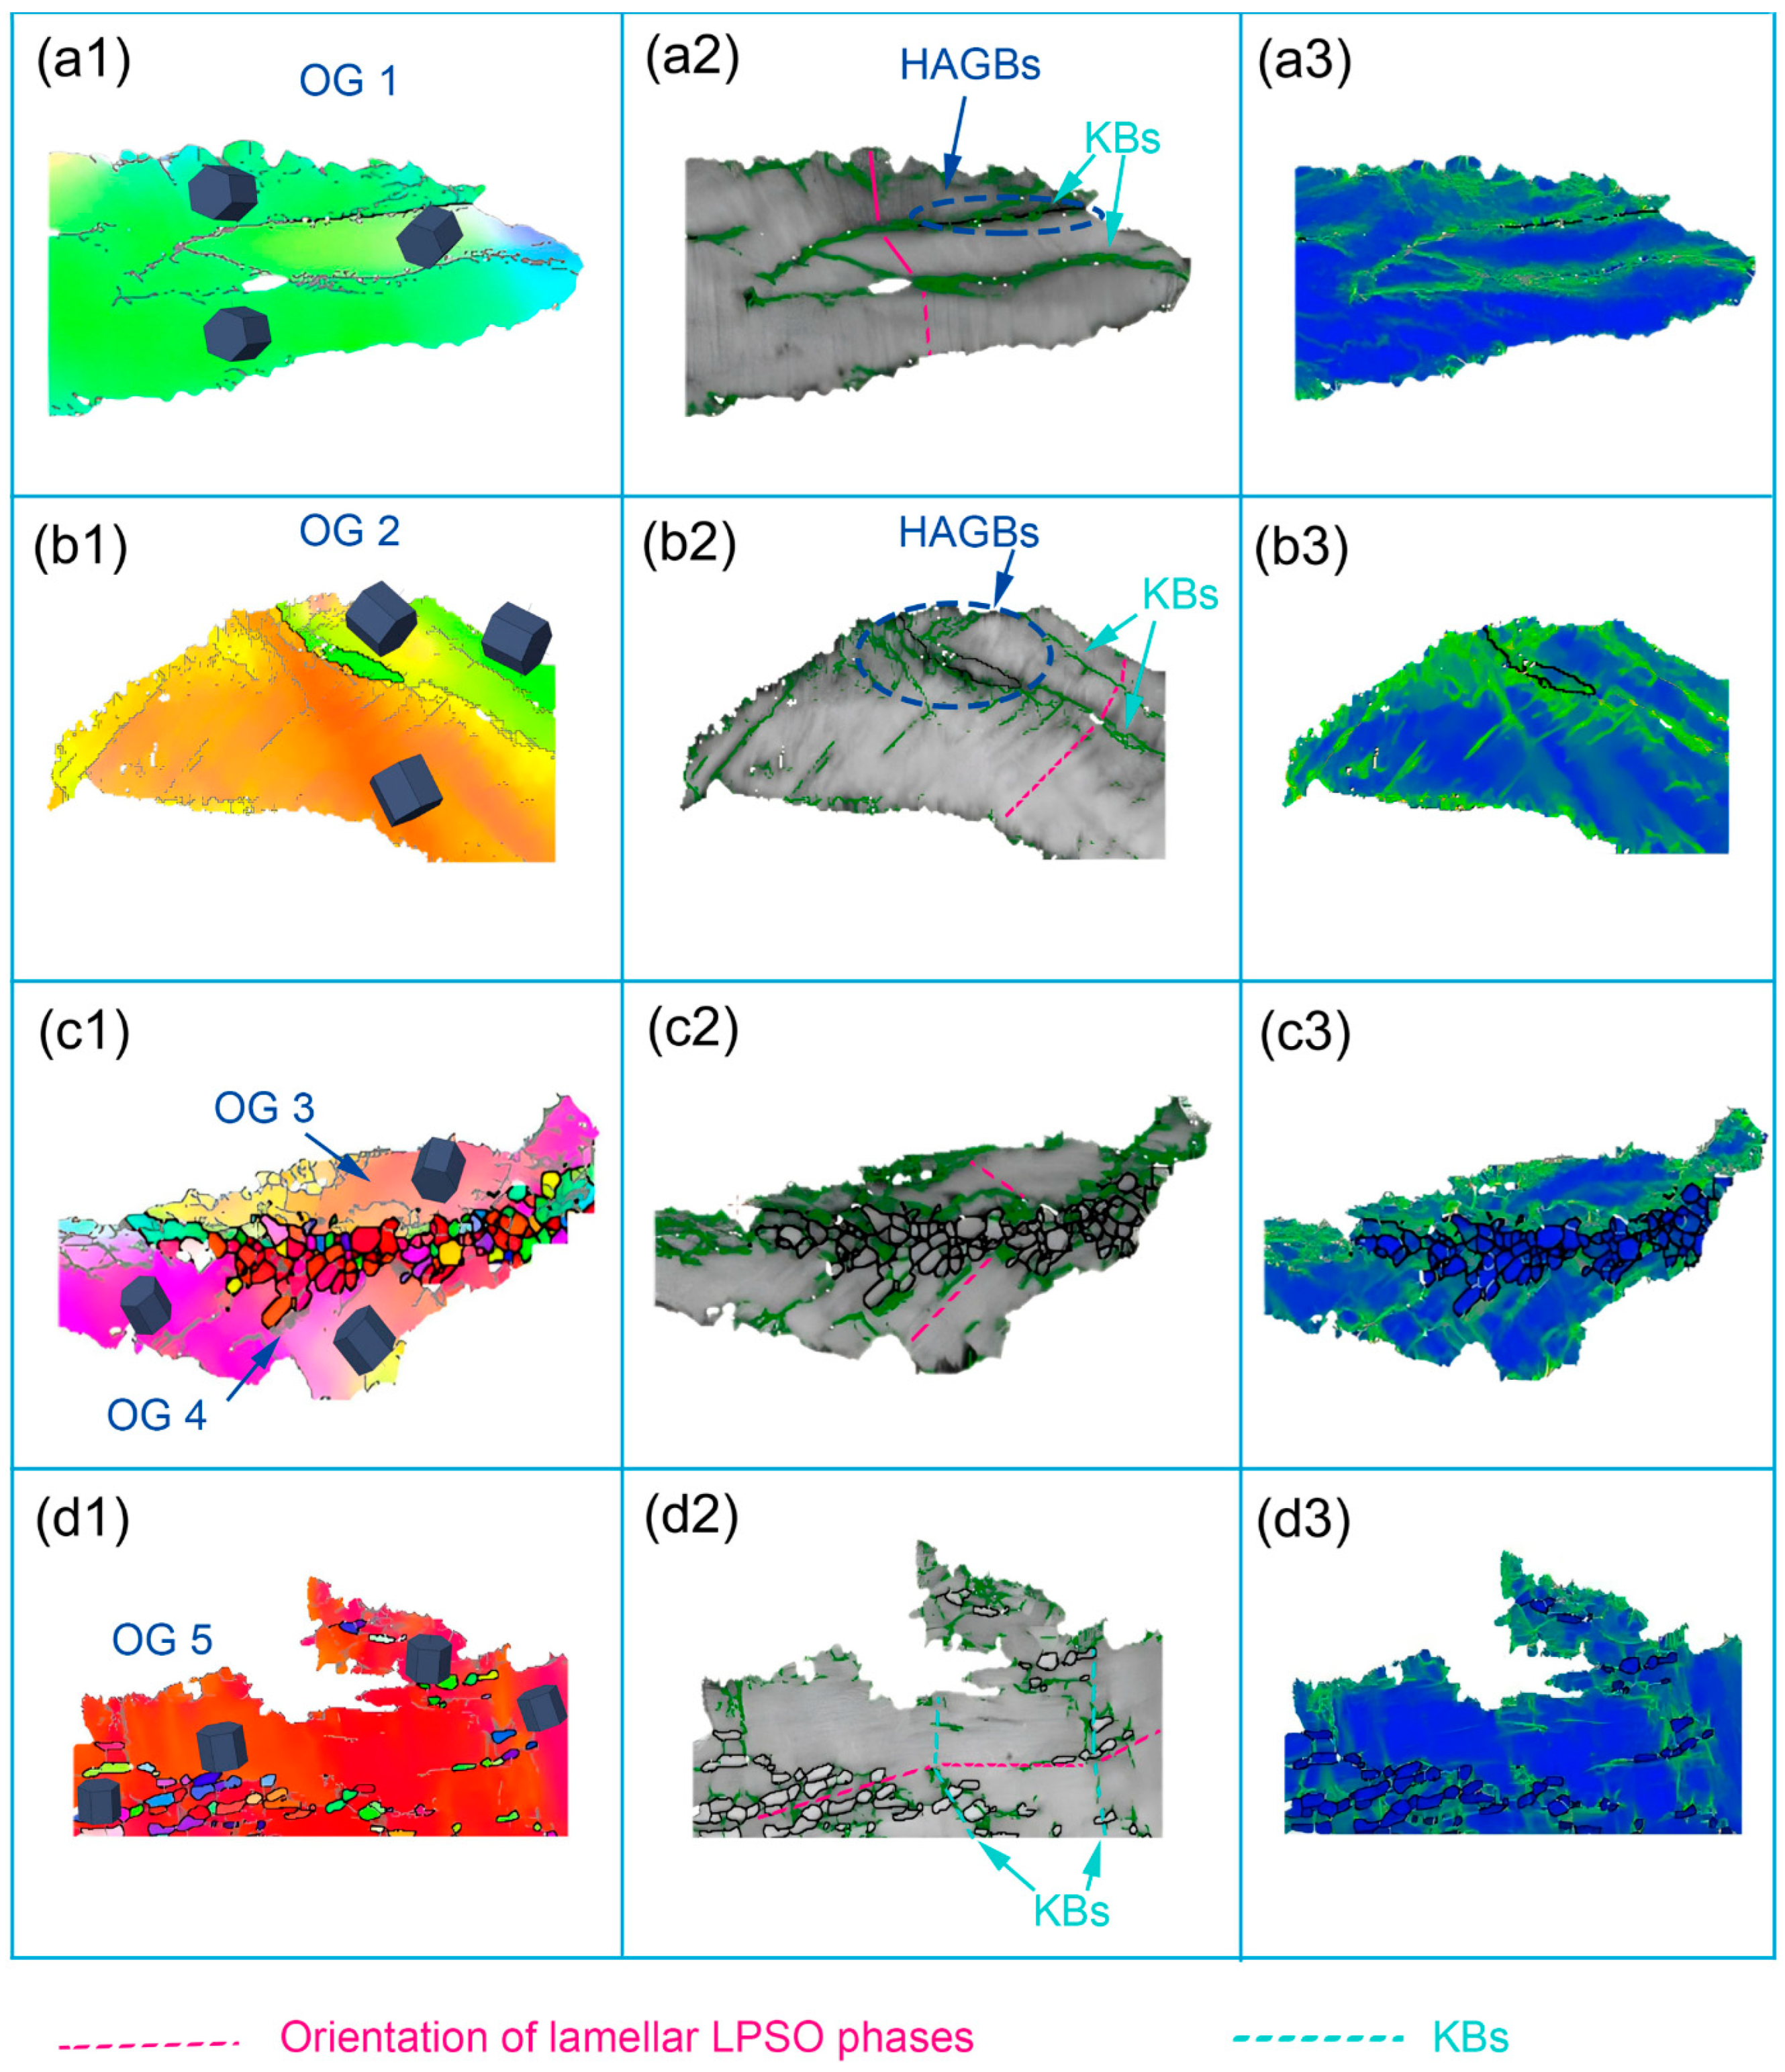
Mg alloys belong to low stacking fault energy (SFE) alloys; continuous dynamic recrystallization (CDRX) always occurs in high-temperature deformation of aluminum, nickel and other high SFE alloys, while previous reports have suggested that the kink bands (KBs) within the grains could effectively promote DRX via CDRX mechanism [57,58,59]. However, the CDRX mechanism here is different from the traditional CDRX mechanism. Zhang et al. [60] proposed another CDRX mechanism in Al alloy, i.e., microshear bands (MSBs) to form subgrains. As shown in Figure 12(a1–a3,b1–b3), in the original grain 1 (OG1) and OG 2, the LAGBs and HAGBs are located at the KBs, where new DRXed grains are on the verge of formation. Here, the KBs is like a special kind of MSBs, which provides another deformation mechanism besides dislocation motion for Mg alloys. The formation of KBs along different direction coordinates deformation of origin grain effectively. As deformation increases, dislocation density and LAGBs density will increase significantly at the KBs, and gradually form HAGBs, as illustrated in Figure 13. A similar CDRX mechanism has also been reported by Liu et al. [61].
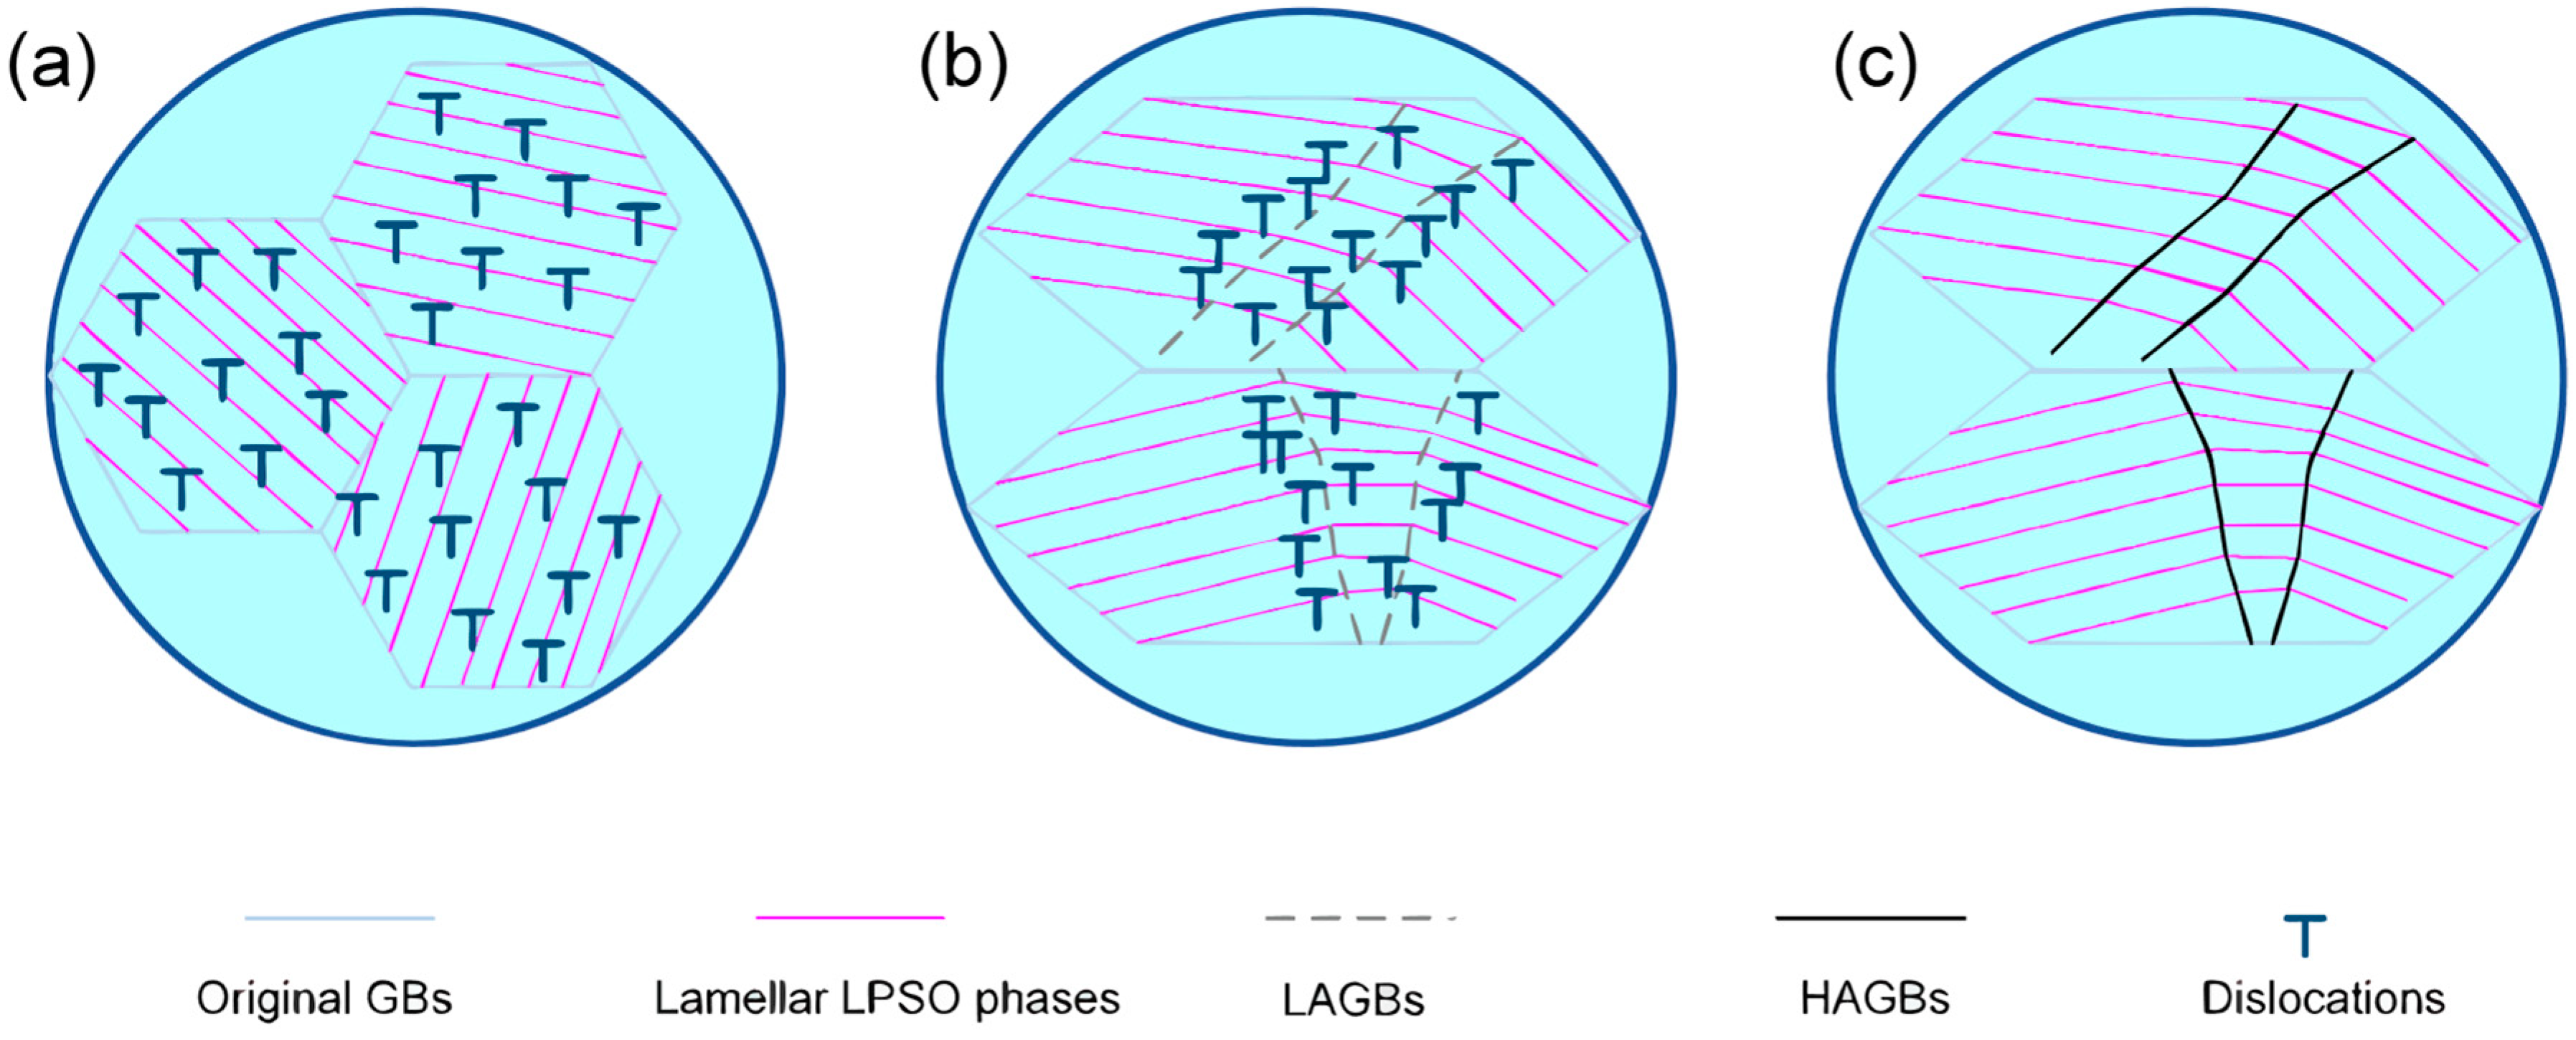
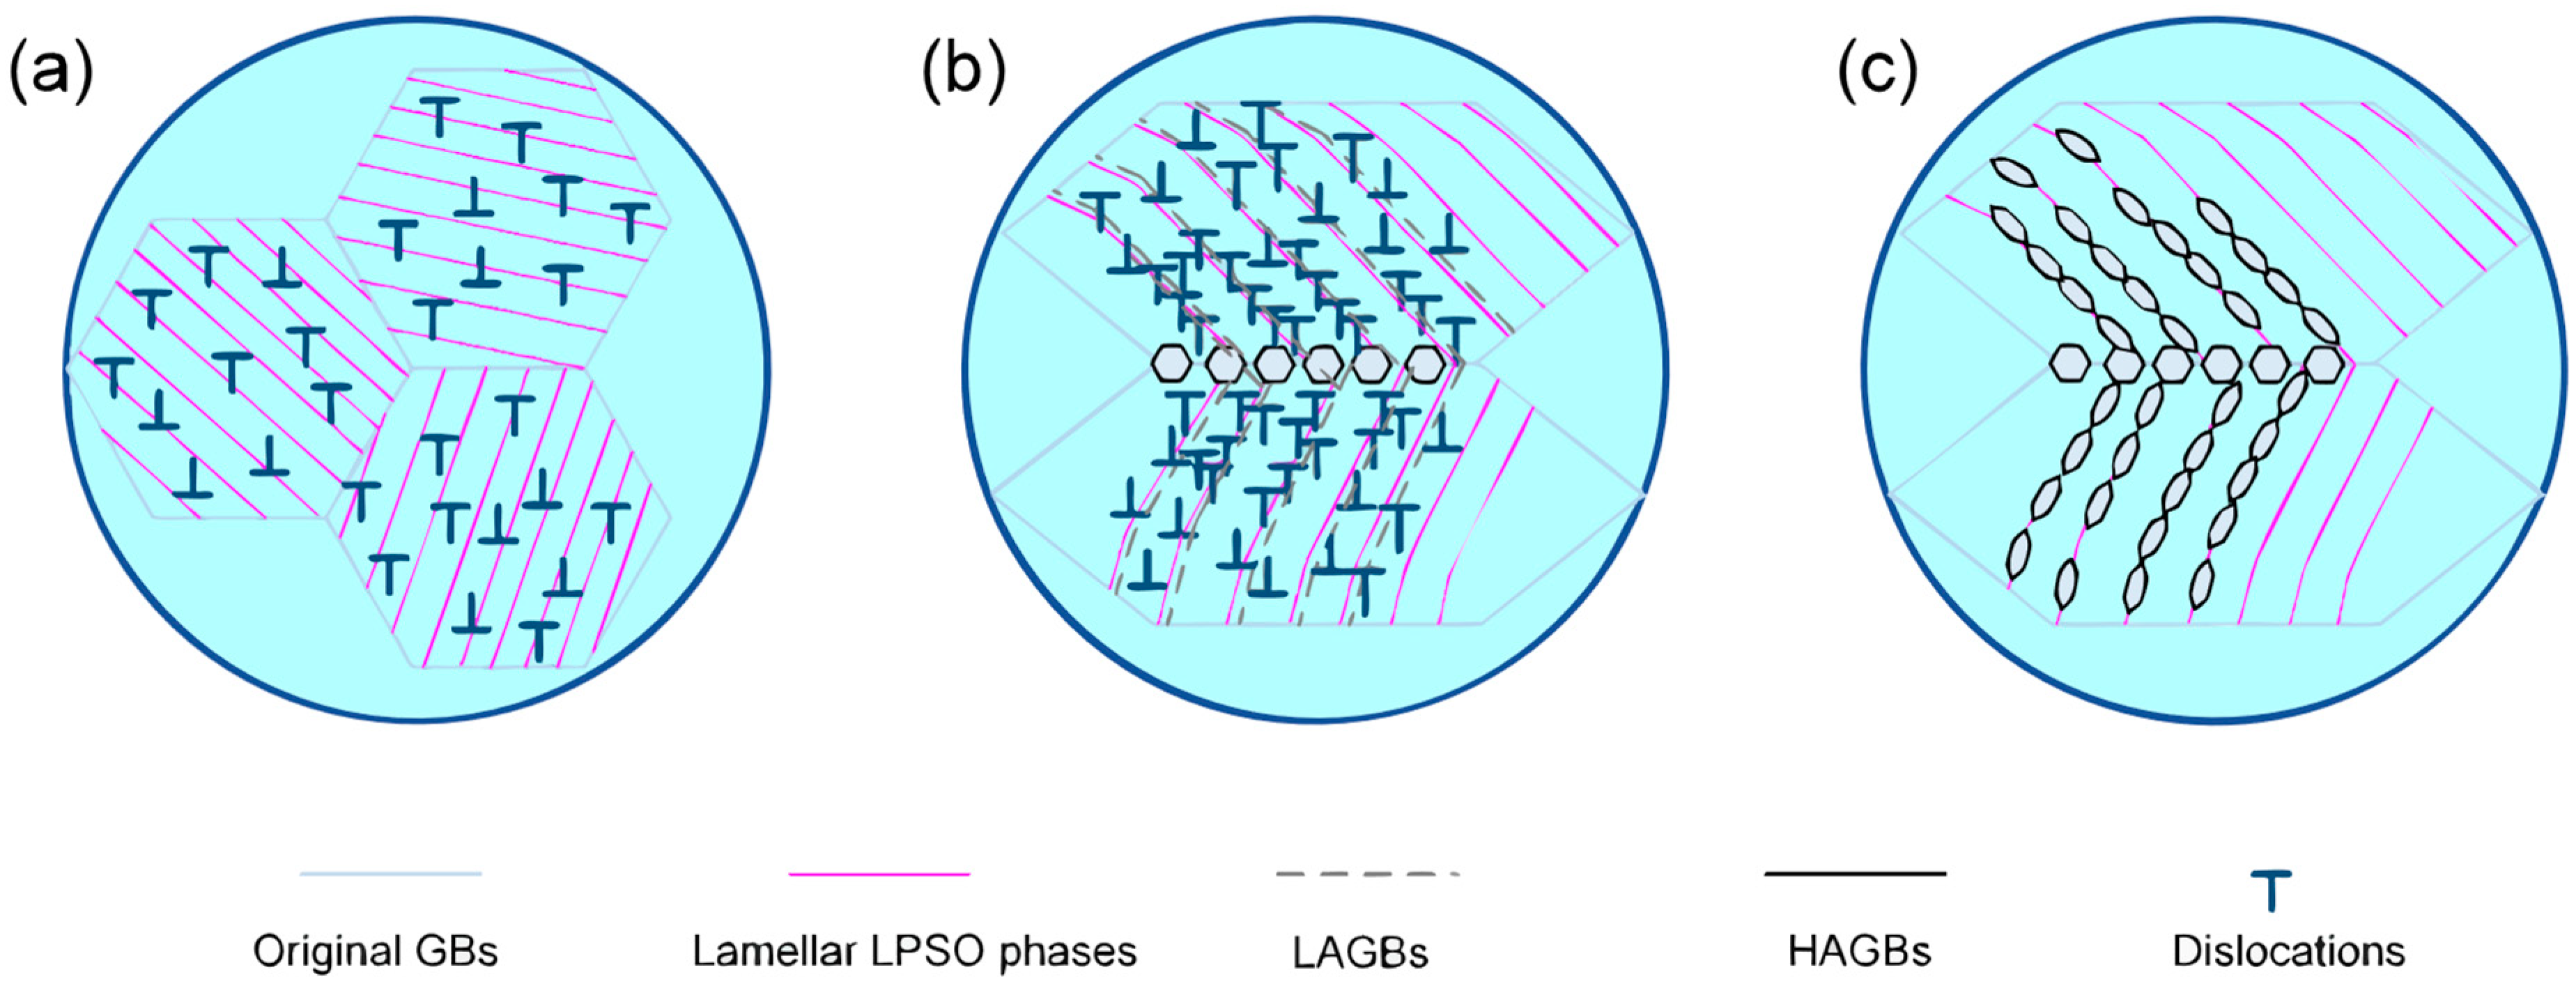
In addition, another DRX mechanism also is observed in the EBSD IPF maps, as shown in Figure 12(c1–c3,d1–d3). In OG 4 and OG 5, the magenta dotted lines indicate the orientation of the lamellar LPSO phases, and the fine DRXed grains distributed along the magenta dotted lines, as shown in Figure 12(c2,d2). In Figure 12(c2,c3,d2,d3), the green areas distributed along the magenta dotted lines indicate regions characterized by a high density of dislocations, meaning that dislocations are converging at the lamellar LPSO phases. With increasing deformation, dislocation and LAGB densities rise significantly in lamellar LPSO phases, progressively forming HAGBs, as illustrated in Figure 14. The result of Xu et al. [27] confirms this mechanism: i.e., the microscale lamellar LPSO phases promote the DRX via PSN, resulting in higher DRX fraction and weaker basal texture during the hot extrusion process, while the nanoscale SFs restrict DRX. The research from Zhang et al. [25] revealed that the laminar LPSO phases could motivate KBs and delayed the DRX in the Mg-Gd-Y-Zn-Zr alloy at 763 K, and the twins and block-shaped LPSO phases could assist the DRX. Combined with the observations in this work, it is suggested that the two kinds of LPSO phases can assist DRX under certain conditions, but the former have higher efficiency.
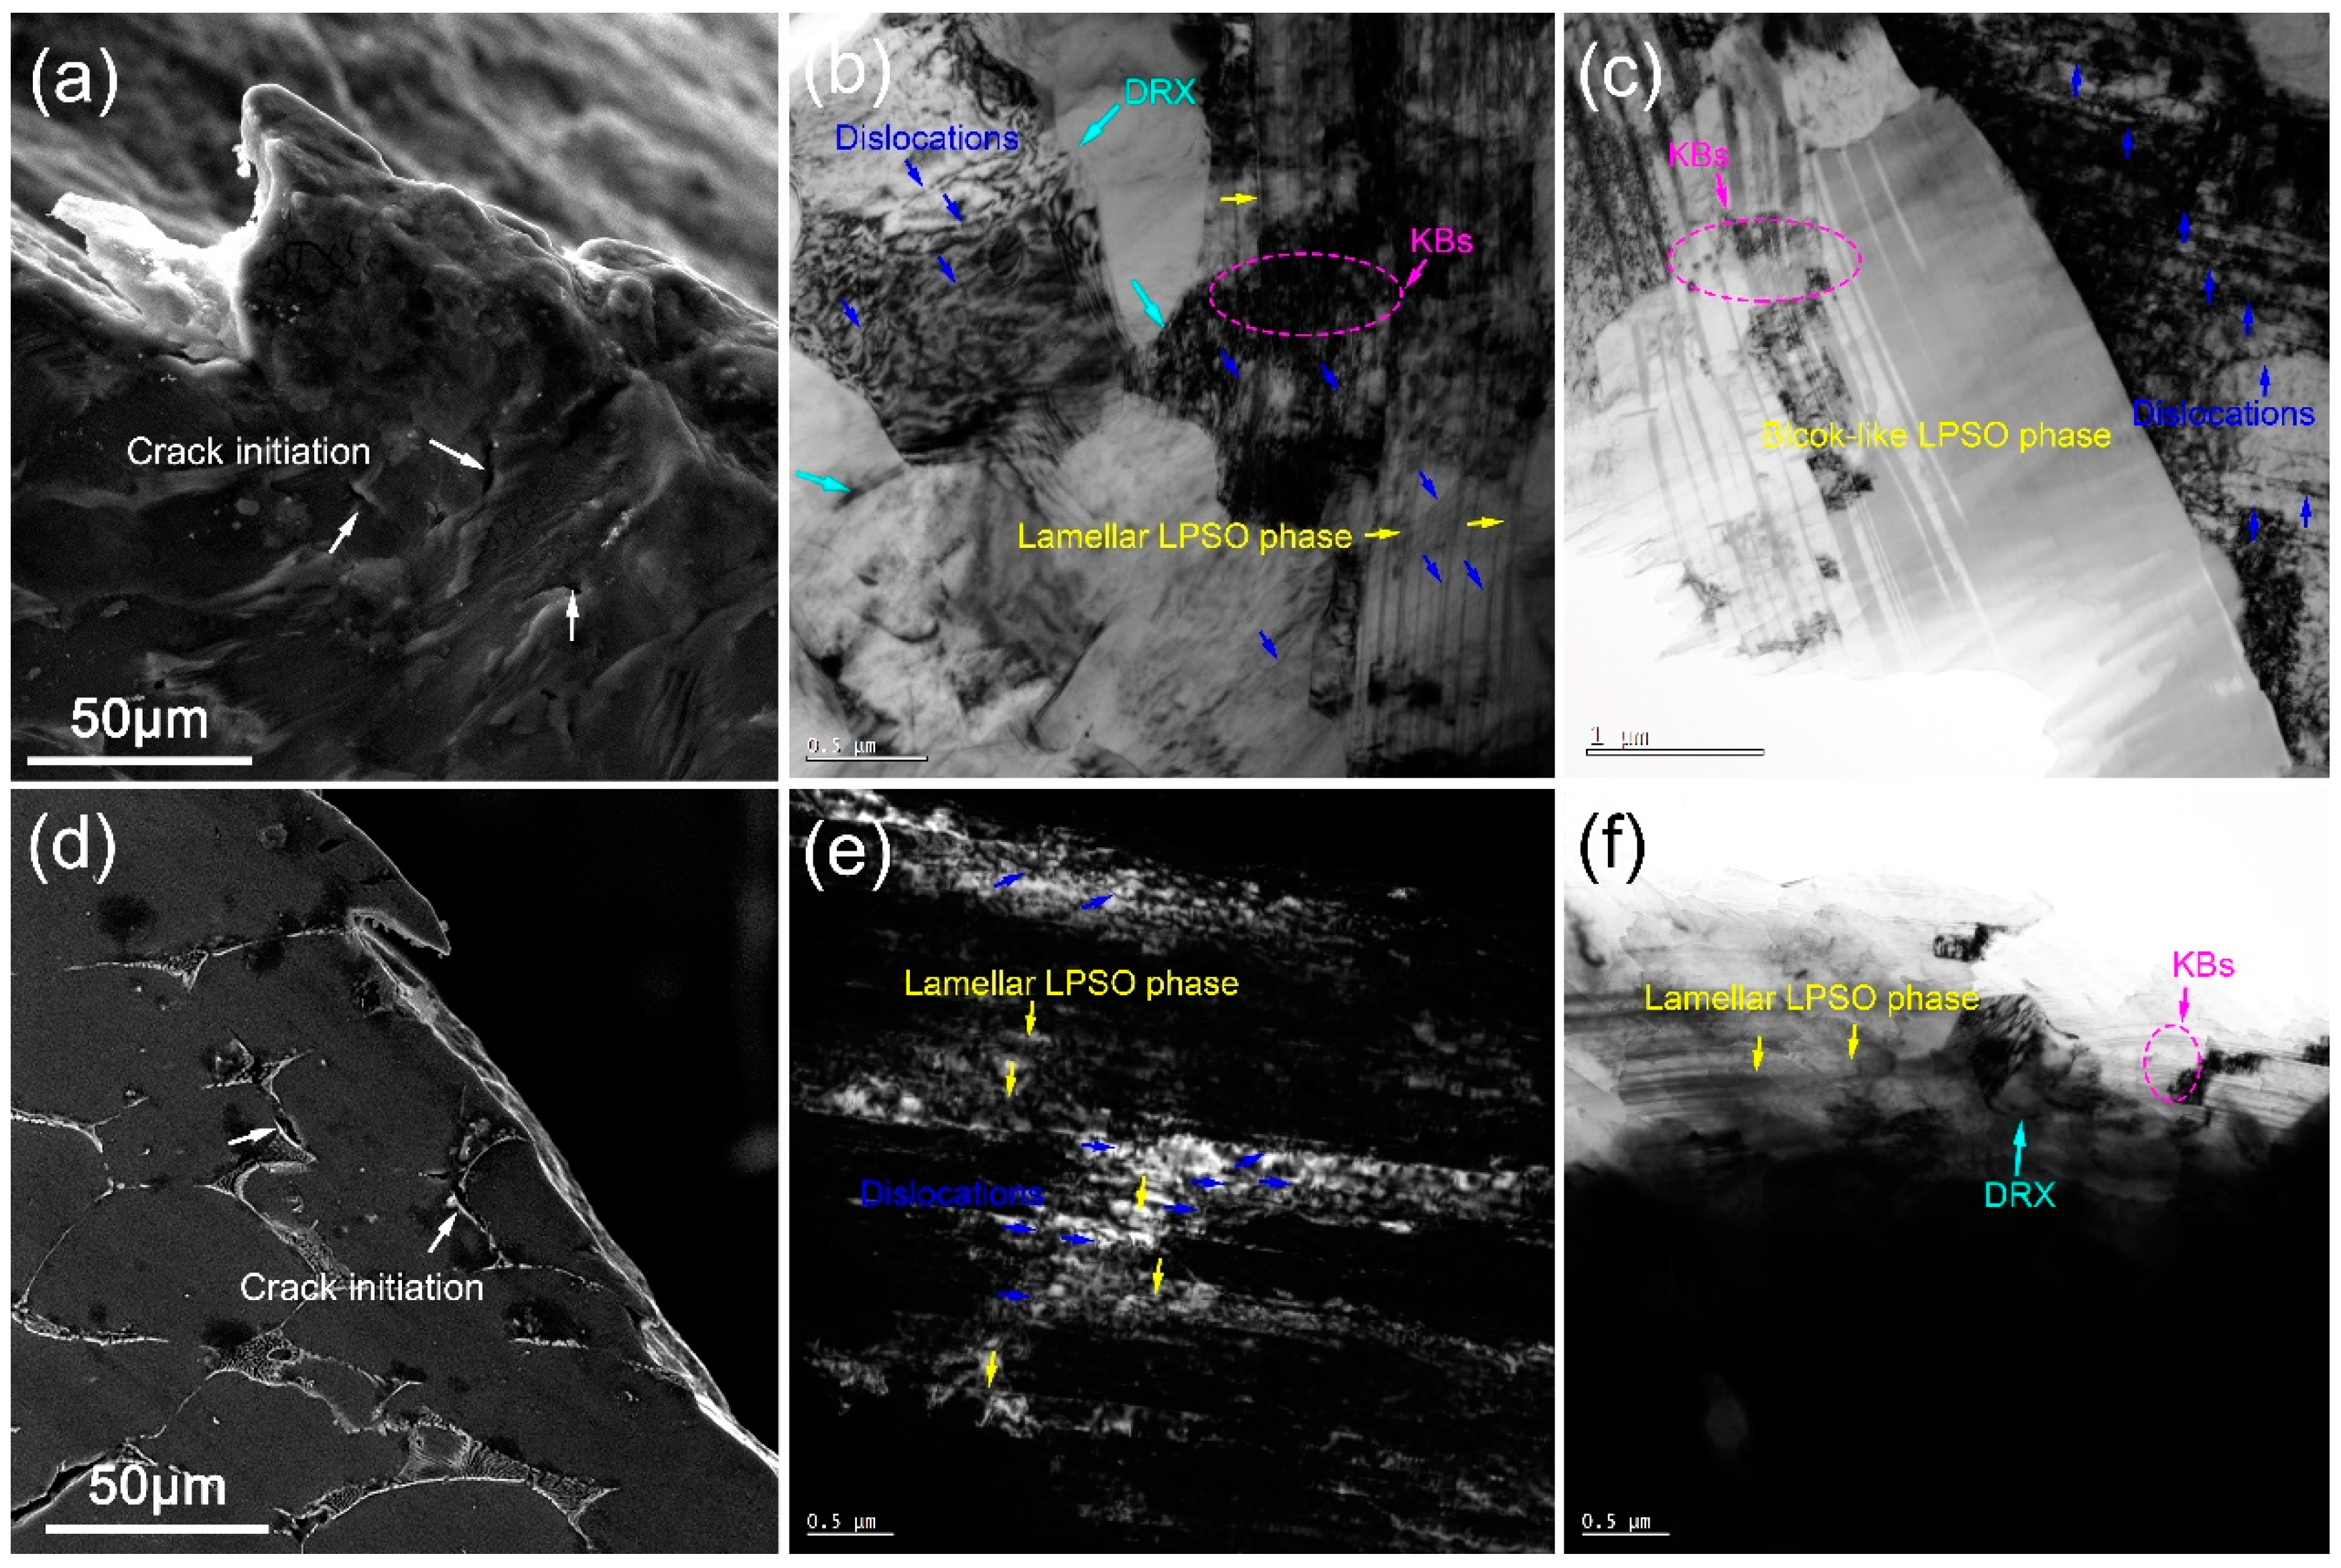
Figure 14. Schematic of microstructural evolution characterized with DRX stimulated by lamellar LPSO phases: (a) Original grains; (b) with increasing deformation, dislocation and LAGB densities rise significantly in lamellar LPSO phases; (c) Ultimately, HAGBs forming lamellar LPSO phases. The classical microstructures corresponding to the deformation stability zones and instability zones in processing maps are presented in Figure 11 and Figure 15. The cracks at a 45 degree angle to the compression direction can be observed in samples under high strain rates and low temperature conditions, as shown by the red boxes in Figures S1 and S2 (except the sample A with 450 °C/0.001 s−1), which is consistent with the characteristics of a brittle fracture in metallic materials. The SEM images of sample A and B with 350 °C/1 s−1 are presented in Figure 15a,d. It could be observed that the original grains underwent severe distortion, with cracks initiating at the LPSO phase or second-phase particles on the grain boundaries. These cracks then propagated, leading to a fracture. The typical microstructure corresponding to the deformation stability zones is characterized by distorted original grains and DRXed grains formed along the grain boundaries, for example, samples A and B with 400 °C/0.01 s−1, as shown in Figure 11(a2,b2,c2,d2). The TEM images of samples A and B with 400 °C/0.01 s−1 are presented in Figure 15b,c and Figure 15e,f, respectively. The lamellar LPSO phase and KBs can be observed in Figure 15b; the DRXed grains and dislocations also could be found along the lamellar LPSO phase and KBs. In Figure 15c, a large number of dislocations pile up at the block-like LPSO phase, forming subgrain boundaries, which also indicates that the presence of the block-like LPSO phase facilitates the promotion of DRX. In Figure 15e,f, in the lamellar LPSO phase, KBs and DRXed grain can be observed. In addition, dislocation motion is obstructed by the lamellar LPSO phase, resulting in dislocation pile-up, which is in agreement with the result in Figure 11(d2).
Crystals 15 00855 g014

3.5.3. DRXed Grain Sizes and Frequencies

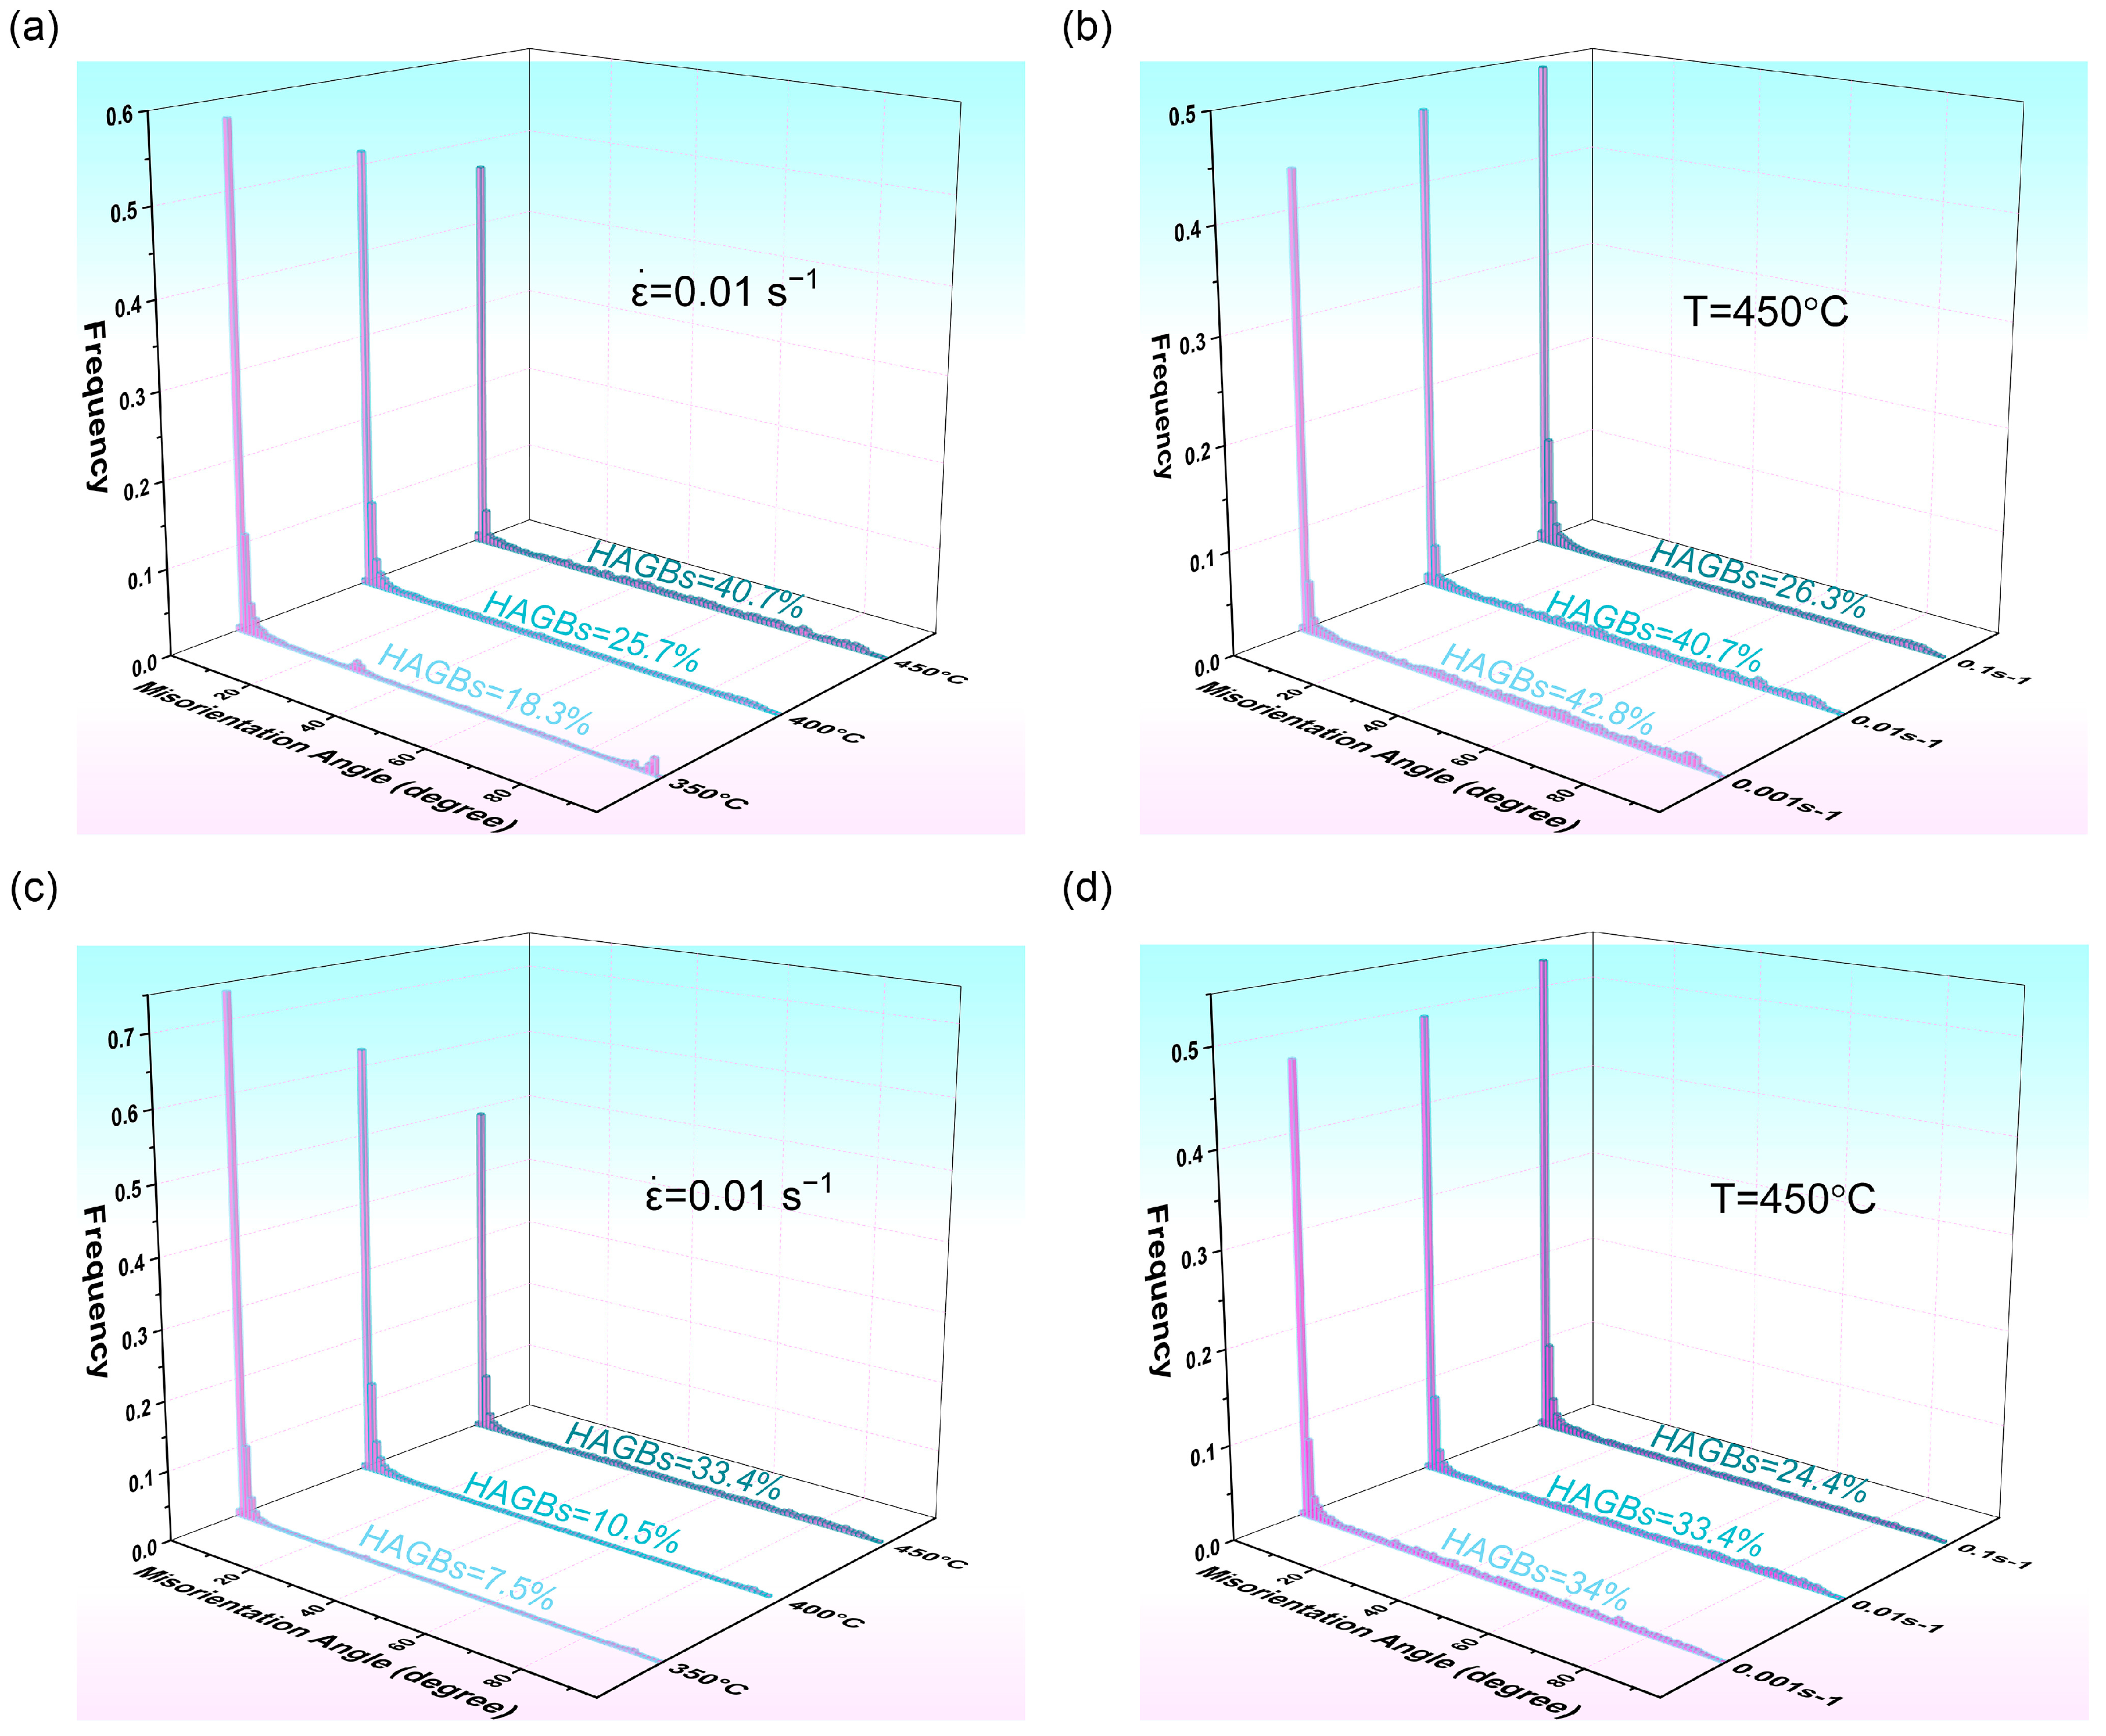
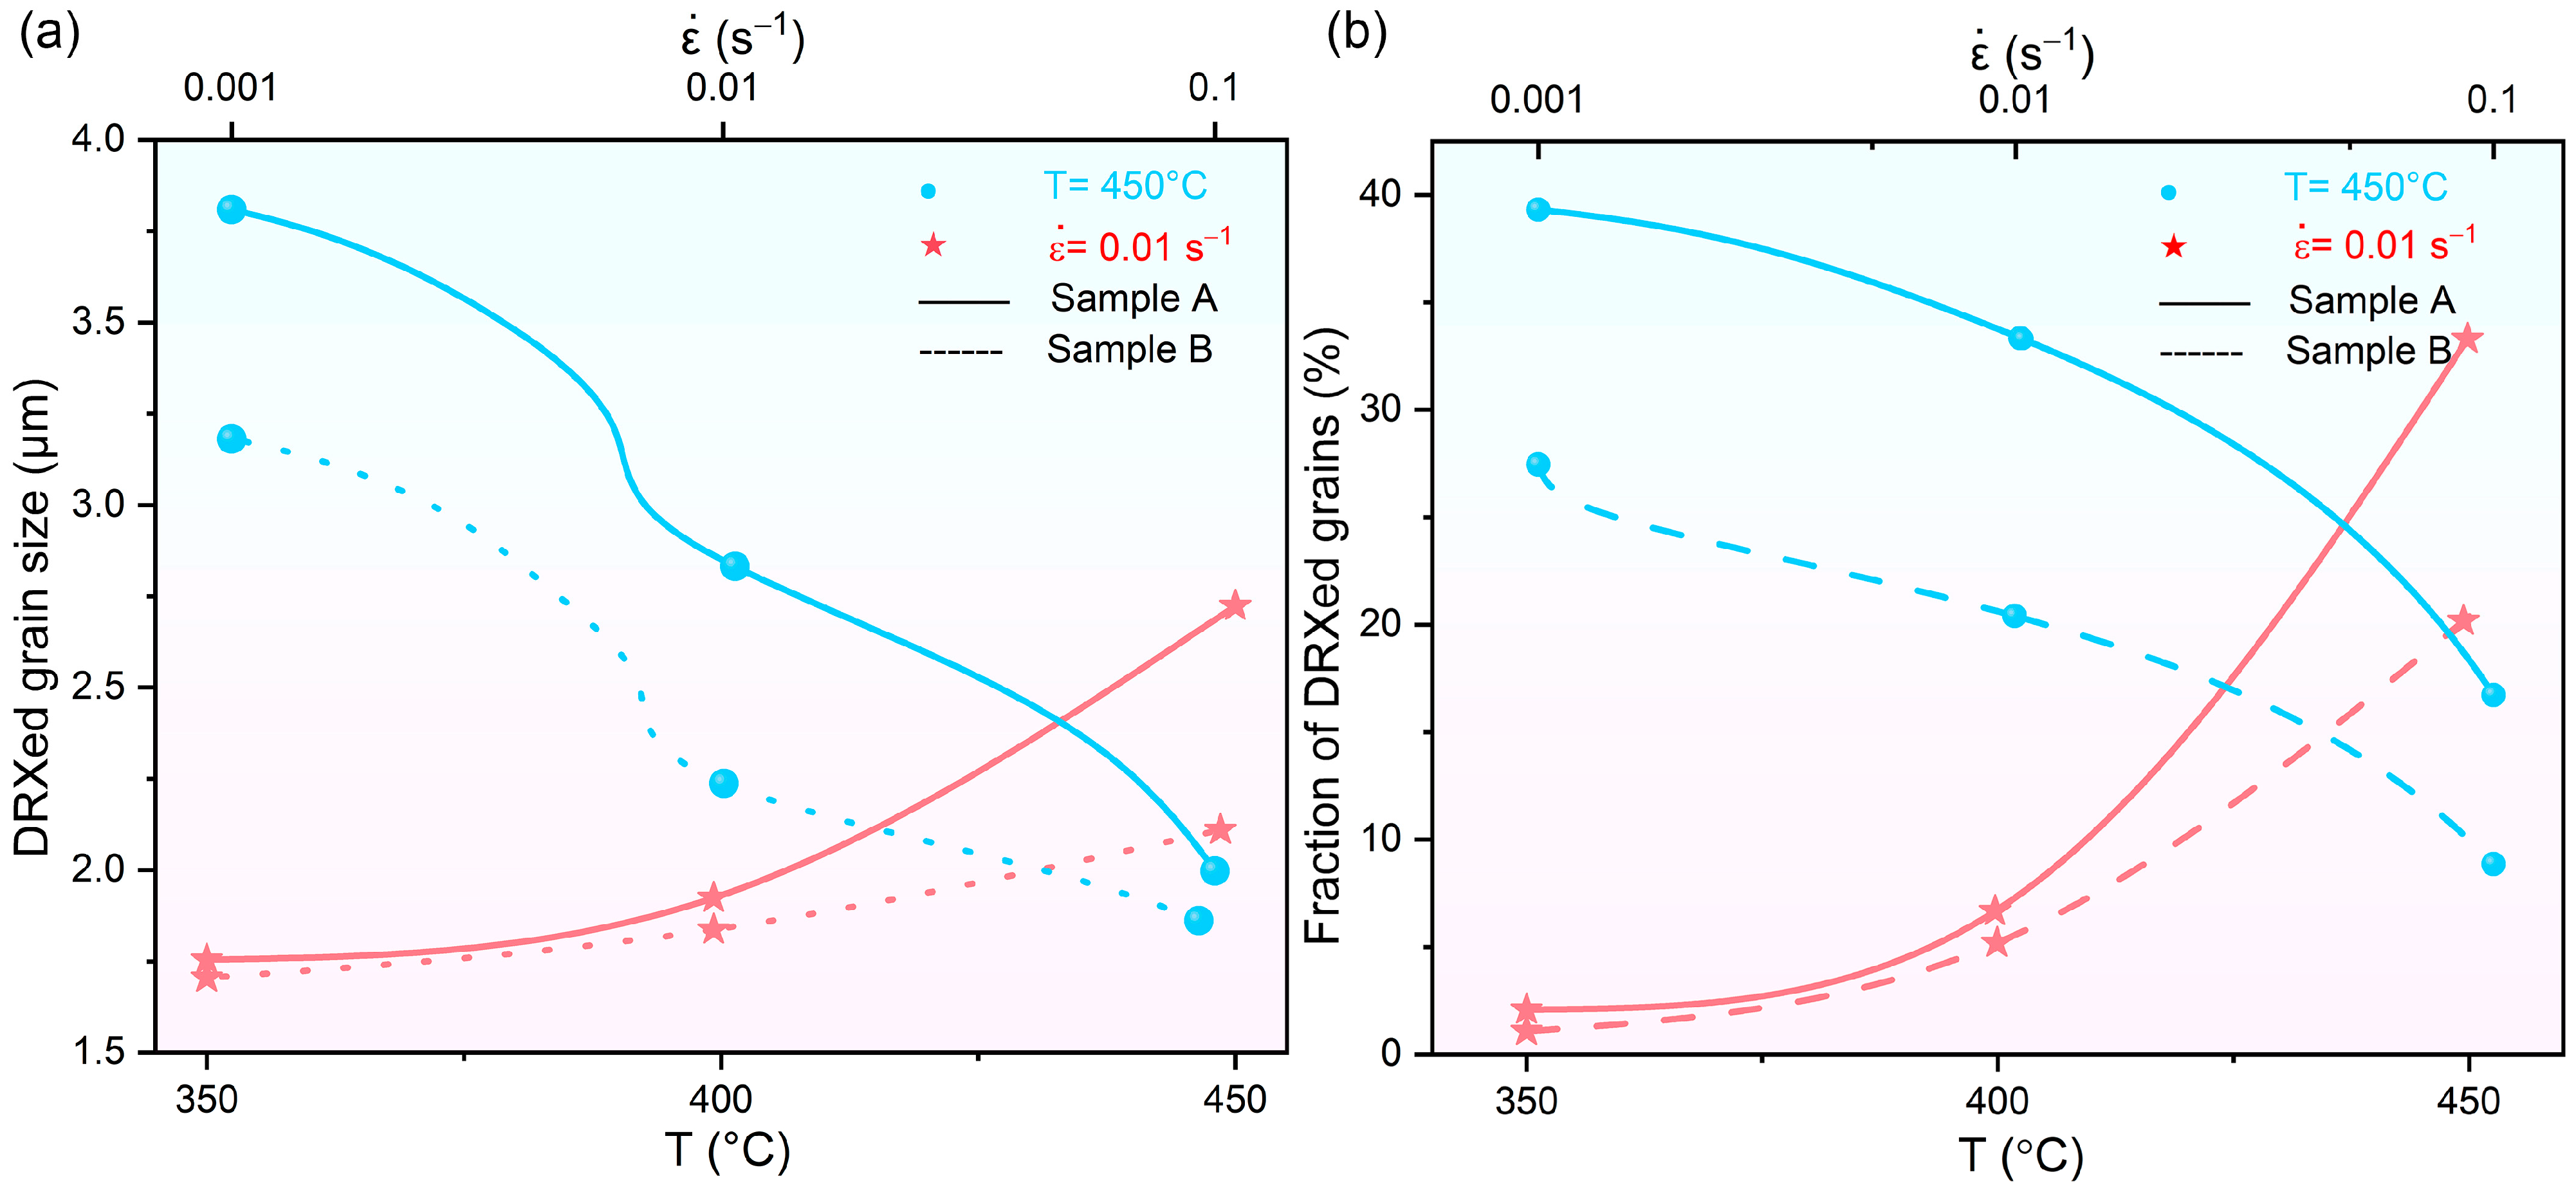
The misorientation angle distribution histograms of the two samples are illustrated in Figure 16. With a strain rate of 0.01 s−1, an evident increase in the frequency of high-angle grain boundaries can be observed as the temperature rises, which is consistent with the microstructure evolution trends in GBs maps in Figure 11. The sizes and frequencies of DRXed grains are illustrated in Figure 17. With the strain rate of 0.001 s−1, the peak DRX fraction in sample A and sample B were 39% and 27%, respectively, as shown in Figure 17b. As the strain rate increases, the cumulative strain increases at the same time. However, DRX is unable to respond quickly enough to the rapid accumulation of dislocations, resulting in a significant decrease in the volume fraction of DRXed grains. With strain rate of 0.01 s−1, the DRX proportions in both samples exhibited a consistent increase with the rising deformation temperature.
Under identical deformation conditions, sample A exhibited a higher proportion of DRX compared to sample B. In the absence of dynamic precipitation during the compression process, the block-like LPSO phases in sample A served as a reinforcement, just like in the metal matrix composite, because of its higher Young’s modulus [42], exerting a secondary strengthening effect during the deformation process. Moreover, the increased grain boundary density ( ρ G B = 0.05   μ m 1 ) in sample A, calculated via the stereological formula ρ G B = 2 d , provided a critical density of nucleation sites for DRX. It has been shown that block-shaped LPSO phases facilitate DRX nucleation through the PSN mechanism [26,43,62], while the synergistic effect between LPSO phases and grain boundary density further enhances DRX efficiency. Therefore, sample A with block-shaped LPSO phases shows a higher volume fraction of DRX. Specifically, when the ρ G B exceeds a certain critical threshold, the DRX growth rate increases significantly. Notably, this critical threshold can be reduced by block-shaped LPSO phases via the PSN mechanism, as observed in the Mg-Gd-Y-Zn-Zr alloy system [26]. For sample B (tested at 450 °C and a strain rate of 0.001 s−1), in the presence of block-shaped LPSO phase precipitation, the grain boundary density is the dominant factor affecting DRX. Thus, sample A exhibits a higher DRX fraction than sample B under the same deformation conditions.
The average DRXed grain size in both samples diminished, with the strain rate increasing. When the strain rate was below 0.1 s−1, sample A exhibited a slightly lager DRXed grains size compared to sample B under identical deformation conditions. Simultaneously, at low strain rates, the plugging dislocations in the deformation process can be more effectively consumed by DRXed grains, thereby facilitating grain growth. When strain rates are high, the response time becomes limited, impeding the growth of the DRXed grains due to insufficient development time, and thereby resulting in smaller DRXed grains [41]. Under identical conditions, a smaller grain size induces a higher grain boundary density, which, combined with block-shaped LPSO phases, synergistically facilitates the earlier occurrence of DRX nucleation and growth in sample A, ultimately resulting in larger DRXed grains. Both the DRXed grain size and DRX fraction of sample A surpass those observed in sample B. This phenomenon implies that block-shaped LPSO phases, coupled with the enhanced grain boundary density from smaller initial grains, can effectively promote the kinetics of DRX, an observation that aligns with the high η value exhibited by sample A in the hot processing map.

4. Conclusions

A Mg-Er-Sm-Zn-Zr alloy underwent solid solution treatment through various heat treatment processes. The hot compression behavior of a Mg-Er-Sm-Zn-Zr alloy was investigated in this study. The conclusions were outlined as follows:
(1) Sample A exhibited block-shaped LPSO phases at grain boundaries and lamellar LPSO phases in grains (both 14H structure), while sample B contained few LPSO phases, and the initial grain sizes were 40 ± 1.1 μm and 47 ± 1.4 μm, respectively.
(2) The block-shaped LPSO phases had a greater impact on enhancing the strain hardening behavior, leading to a higher flow stress in sample A, relative to sample B. The flow stress difference induced by grain size was only ~3.4 MPa. The Arrhenius constitutive model had been developed, and activation energies were 281 and 255 kJ/mol, respectively.
(3) The block-shaped LPSO phases exhibited higher efficiency in promoting DRX compared to lamellar LPSO phases. The smaller grain size induced higher grain boundary density, which synergistically enhanced DRX with block-shaped LPSO phases—resulting in a higher DRX volume fraction and accelerated DRXed grain growth in sample A across all hot deformation conditions.
(4) The dynamic precipitation of block-shaped and lamellar LPSO phases occurred during hot deformation, and the precipitation of block-shaped LPSO phases required a longer duration compared to lamellar LPSO phases. The presence of LPSO kink exerts an influence on DRX, while a significant angle kink can enhance the production of DRX.

Supplementary Materials

The following supporting information can be downloaded: https://www.mdpi.com/article/10.3390/cryst15100855/s1, Figure S1: The macroscopic morphology of as-compressed sample A with different conditions; Figure S2: The macroscopic morphology of as-compressed sample B with different conditions.

Author Contributions

Conceptualization, C.C. and Z.C.; methodology, G.S.; validation, C.C., L.C. and Z.C.; formal analysis, G.S., X.L. and T.H.; investigation, G.S. and M.S.; resources, L.C. and H.Z.; data curation, G.S. and M.S.; writing—original draft preparation, G.S. and C.C.; writing—review and editing, G.S. and C.C.; visualization, G.S. and C.C.; supervision, Z.C., L.C. and H.Z.; funding acquisition, C.C., Z.C., X.L., T.H. and H.Z. All authors have read and agreed to the published version of the manuscript.

Funding

This research was jointly supported financially by the Science and Technology Development Program of Jilin Province (Grant No. SK2202302038), the National Natural Science Foundation of China (Grant Nos. 51975248 and 52275382), the Basic Science Center Project of the National Natural Science Foundation of China (Grant No. 22388101), the Natural Science Research Program of Huai’an (HAB202227), and the Natural Science Foundation of the Higher Educations Institutions of Jiangsu Province (23KJB460003).

Data Availability Statement

The raw data supporting the conclusions of this article will be made available by the authors on request.

Conflicts of Interest

The authors declare no conflicts of interest.

Abbreviations

The following abbreviations are used in this manuscript:
LPSOLong-period stacking order
DRXDynamic recrystallization
MgMagnesium
RErare earth
UTSultimate tensile strength
YSyield stress
DMMdynamic material model
PSNparticle-stimulated nucleation
SFsstacking faults
SAEDselected area electron diffraction
IPFinverse pole diagram
GBsgrain boundaries
DDRXdiscontinuous dynamic recrystallization
CDRXcontinuous dynamic recrystallization
KBskink bands
MSBsmicroshear bands
LAGBslow-angle grain boundaries
HAGBshigh-angle grain boundaries
SFEstacking fault energy

References

  1. Pan, F.; Yang, M.; Chen, X. A Review on Casting Magnesium Alloys: Modification of Commercial Alloys and Development of New Alloys. J. Mater. Sci. Technol. 2016, 32, 1211–1221. [Google Scholar] [CrossRef]
  2. Song, J.; She, J.; Chen, D.; Pan, F. Latest research advances on magnesium and magnesium alloys worldwide. J. Magnes. Alloys 2020, 8, 1–41. [Google Scholar] [CrossRef]
  3. Han, T.; Wang, L.; Lu, Y.; Lu, L.; Tiyyagura, H.R. Effect of Tensile Direction on Corrosion Behavior of AZ31 Magnesium Alloy Rolled Sheets. J. Mater. Eng. Perform. 2023, 33, 9194–9213. [Google Scholar] [CrossRef]
  4. Luo, Q.; Guo, Y.; Liu, B.; Feng, Y.; Zhang, J.; Li, Q.; Chou, K. Thermodynamics and kinetics of phase transformation in rare earth–magnesium alloys: A critical review. J. Mater. Sci. Technol. 2020, 44, 17190. [Google Scholar] [CrossRef]
  5. Liu, J.; Bian, D.; Zheng, Y.; Chu, X.; Lin, Y.; Wang, M.; Lin, Z.; Li, M.; Zhang, Y.; Guan, S. Comparative in vitro study on binary Mg-RE (Sc, Y, La, Ce, Pr, Nd, Sm, Eu, Gd, Tb, Dy, Ho, Er, Tm, Yb and Lu) alloy systems. Acta Biomater. 2020, 102, 508–528. [Google Scholar] [CrossRef]
  6. Rokhlin, L.L.; Dobatkina, T.V.; Nikitina, N.I. Constitution and Properties of the Ternary Magnesium Alloys Containing Two Rare-Earth Metals of Different Subgroups. Mater. Sci. Forum 2003, 419–422, 291–296. [Google Scholar] [CrossRef]
  7. Xia, X.; Sun, W.; Luo, A.A.; Stone, D.S. Precipitation evolution and hardening in Mg-Sm-Zn-Zr alloys. Acta Mater. 2016, 111, 335–347. [Google Scholar] [CrossRef]
  8. Rokhlin, L.L.; Dobatkina, T.V.; Tarytina, I.E.; Luk’yanova, E.A.; Ovchinnikova, O.A. Effect of Samarium on the Strength Properties of Mg–Y–Gd–Zr Alloys. Russ. Metall. (Met.) 2021, 2021, 267–271. [Google Scholar] [CrossRef]
  9. Nie, J.F.; Zhu, Y.M.; Morton, A.J. On the Structure, Transformation and Deformation of Long-Period Stacking Ordered Phases in Mg-Y-Zn Alloys. Metall. Mater. Trans. A 2014, 45A, 3338–3348. [Google Scholar] [CrossRef]
  10. Li, B.; Guan, K.; Yang, Q.; Niu, X.; Zhang, D.; Lv, S.; Meng, F.; Huang, Y.; Hort, N.; Meng, J. Microstructures and mechanical properties of a hot-extruded Mg−8Gd−3Yb−1.2Zn−0.5Zr (wt.%) alloy. J. Alloys Compd. 2019, 776, 666–678. [Google Scholar] [CrossRef]
  11. Liu, K.; Rokhlin, L.L.; Elkin, F.M.; Tang, D.; Meng, J. Effect of ageing treatment on the microstructures and mechanical properties of the extruded Mg–7Y–4Gd–1.5Zn–0.4Zr alloy. Mater. Sci. Eng. A 2010, 527, 828–834. [Google Scholar] [CrossRef]
  12. Zhou, J.; Yang, H.; Jiang, B.; He, C.; Dong, Z.; Liu, L.; Luo, X.; Liu, Y.; Huang, D.; Xu, J.; et al. Clarifying the deformation modes and strengthening mechanisms of Mg-11Gd-5Y-2Zn-0.7Zr with outstanding high-temperature mechanical properties. Mater. Sci. Eng. A 2023, 866, 1446–1483. [Google Scholar] [CrossRef]
  13. Liu, L.; Ding, H. Study of the plastic flow behaviors of AZ91 magnesium alloy during thermomechanical processes. J. Alloys Compd. 2009, 484, 949–956. [Google Scholar] [CrossRef]
  14. Li, Z.-J.; Wang, J.-G.; Yan, R.-F.; Chen, Z.-Y.; Ni, T.-Y.; Dong, Z.-Q.; Lu, T.-S. Effect of Ce addition on hot deformation behavior and microstructure evolution of AZ80 magnesium alloy. J. Mater. Res. Technol. 2022, 16, 1339–1352. [Google Scholar] [CrossRef]
  15. Qin, Y.-J.; Pan, Q.-L.; He, Y.-B.; Li, W.-B.; Liu, X.-Y.; Fan, X. Modeling of flow stress for magnesium alloy during hot deformation. Mater. Sci. Eng. A 2010, 527, 2790–2797. [Google Scholar] [CrossRef]
  16. Prasad, Y.V.R.K.; Gegel, H.L.; Doraivelu, S.M.; Malas, J.C.; Morgan, J.T.; Lark, K.A.; Barker, D.R. Modeling of dynamic material behavior in hot deformation: Forging of Ti-6242. Metall. Mater. Trans. A 1984, 15, 1883–1892. [Google Scholar] [CrossRef]
  17. Chen, T.; Chen, Z.; Shao, J.; Wang, R.; Mao, L.; Liu, C. The role of long period stacking ordered phase in dynamic recrystallization of a Mg–Zn–Y alloy during hot compression. J. Alloys Compd. 2020, 818, 1528–1541. [Google Scholar] [CrossRef]
  18. Hu, L.; Wang, J.; Zheng, P.; Lu, L.; Zhang, Y.; Zhang, L.; Tan, J.; Li, R.; Shen, H.; Zhang, J. Hot deformation and dynamic recrystallization of Mg-Gd-Y-Zn-Zr alloy containing high volume fraction 18R-LPSO phase. J. Alloys Compd. 2024, 1003, 175718. [Google Scholar] [CrossRef]
  19. Zhao, D.; Zhao, C.; Chen, X.; Huang, Y.; Hort, N.; Gavras, S.; Pan, F. Compressive deformation of as-extruded LPSO-containing Mg alloys at different temperatures. J. Mater. Res. Technol. 2022, 16, 944–959. [Google Scholar] [CrossRef]
  20. Bi, G.L.; Wang, Y.; Jiang, J.; Gu, J.; Li, Y.; Chen, T.; Ma, Y. Microstructure and mechanical properties of extruded Mg-Y-Zn (Ni) alloys. J. Alloys Compd. 2021, 881, 160577. [Google Scholar] [CrossRef]
  21. Zheng, J.; Chen, Z.; Yan, Z.; Zhang, Z.; Wang, Q.; Xue, Y. Preparation of ultra-high strength Mg-Gd-Y-Zn-Zr alloy by pre-ageing treatment prior to extrusion. J. Alloys Compd. 2022, 894, 162490. [Google Scholar] [CrossRef]
  22. Jeong, H.T.; Kim, W.J. The hot compressive deformation behavior of cast Mg-Gd-Y-Zn-Zr alloys with and without LPSO phase in their initial microstructures. J. Magnes. Alloys 2022, 10, 2901–2917. [Google Scholar] [CrossRef]
  23. Jia, J.; Zhang, H.; Meng, M.; Yang, X.; Zhang, X.; Zhang, Z. Strain-induced heterogeneous bimodal microstructure behavior of Mg-Gd-Y-Zn-Zr alloy containing LPSO phase during hot compression. J. Mater. Res. Technol. 2023, 27, 4264–4277. [Google Scholar] [CrossRef]
  24. Zhao, L.; Hao, J.; Liu, C.; Gui, H.; Zhang, J.; Wang, H.; Cheng, W. Hot compression behavior of Mg-Zn-Y-Mn-Ti magnesium alloy enhanced by lamellar LPSO phase and spherical W phase. J. Mater. Res. Technol. 2023, 25, 4784–4798. [Google Scholar] [CrossRef]
  25. Zhang, D.; Tan, Z.; Huo, Q.; Xiao, Z.; Fang, Z.; Yang, X. Dynamic recrystallization behaviors of Mg-Gd-Y-Zn-Zr alloy with different morphologies and distributions of LPSO phases. Mater. Sci. Eng. A 2017, 715, 389–403. [Google Scholar] [CrossRef]
  26. Zhou, X.-J.; Liu, C.-M.; Gao, Y.-H.; Jiang, S.-N.; Han, X.-Z.; Chen, Z.-Y. Evolution of LPSO Phases and Their Effect on Dynamic Recrystallization in a Mg-Gd-Y-Zn-Zr Alloy. Metall. Mater. Trans. A 2017, 48A, 3060–3072. [Google Scholar] [CrossRef]
  27. Xu, C.; Nakata, T.; Qiao, X.; Zheng, M.; Wu, K.; Kamado, S. Effect of LPSO and SFs on microstructure evolution and mechanical properties of Mg-Gd-Y-Zn-Zr alloy. Sci. Rep. 2017, 7, 4084–4089. [Google Scholar] [CrossRef]
  28. Zhang, S.; Yuan, G.Y.; Lu, C.; Ding, W.J. The relationship between (Mg,Zn) sub(3)RE phase and 14H-LPSO phase in Mg-Gd-Y-Zn-Zr alloys solidified at different cooling rates. J. Alloys Compd. 2011, 509, 3515–3521. [Google Scholar] [CrossRef]
  29. Yuan, M.; Zheng, Z.Q. Effects of heat treatment on microstructure and mechanical properties of Mg-2.6Sm- 1.3Gd-0.6Zn-0.5Zr alloy. Mater. Sci. Technol. MST A Publ. Inst. Met. 2014, 30, 261–267. [Google Scholar] [CrossRef]
  30. Li, B.B.; Shi, G.L.; Zhang, K.; Wang, K.K.; Li, X.G.; Li, Y.J.; Ma, M.L.; Yuan, J.W. Hot deformation behavior and processing map of Mg-12Gd-1MM-0.6Zr magnesium alloy. IOP Conf. Ser. Mater. Sci. Eng. 2020, 770, 012097. [Google Scholar] [CrossRef]
  31. Poliak, E.I.; Jonas, J.J. Critical Strain for Dynamic Recrystallization in Variable Strain Rate Hot Deformation. ISIJ Int. 2003, 43, 692–700. [Google Scholar] [CrossRef]
  32. Zhou, S.; Deng, K.; Li, J.; Nie, K.; Xu, F.; Zhou, H.; Fan, J. Hot deformation behavior and workability characteristics of bimodal size SiCp/AZ91 magnesium matrix composite with processing map. Mater. Des. 2014, 64, 177–184. [Google Scholar] [CrossRef]
  33. Tahreen, N.; Zhang, D.F.; Pan, F.S.; Jiang, X.Q.; Li, C.; Li, D.Y.; Chen, D. Characterization of hot deformation behavior of an extruded Mg–Zn–Mn–Y alloy containing LPSO phase. J. Alloys Compd. 2015, 644, 814–823. [Google Scholar] [CrossRef]
  34. Li, L.; Qi, F.; Wang, Q.; Hou, C.; Zhao, N.; Yang, Y.; Chai, S.; Ouyang, X. Hot deformation behavior of Mg95.21Zn1.44Y2.86Mn0.49 alloy containing LPSO phase. Mater. Charact. 2020, 169, 110649. [Google Scholar] [CrossRef]
  35. Wen, Y.; Guan, B.; Xin, Y.; Liu, C.; Wu, P.; Huang, G.; Liu, Q. Solute atom mediated Hall-Petch relations for magnesium binary alloys. Scr. Mater. 2022, 210, 114451. [Google Scholar] [CrossRef]
  36. Yu, H.; Xin, Y.; Wang, M.; Liu, Q. Hall-Petch relationship in Mg alloys:A review. J. Mater. Sci. Technol. 2018, 34, 248–256. [Google Scholar] [CrossRef]
  37. Luo, S.; Wang, N.; Wang, Y.; Chen, J.; Qin, H.; Kong, S.; Bai, T.; Lu, W.; Xiao, L.; Ma, X.; et al. Texture, microstructure and mechanical properties of an extruded Mg-10Gd-1Zn-0.4Zr alloy: Role of microstructure prior to extrusion. Mater. Sci. Eng. A 2022, 849, 143476. [Google Scholar] [CrossRef]
  38. Hagihara, K.; Yamasaki, M.; Kawamura, Y.; Nakano, T. Strengthening of Mg-based long-period stacking ordered (LPSO) phase with deformation kink bands. Mater. Sci. Eng. A 2019, 763, 138163. [Google Scholar] [CrossRef]
  39. Sellars, C.; Tegart, W. Hot Workability. Int. Mater. Rev. 1972, 17, 1–24. [Google Scholar] [CrossRef]
  40. Xu, W.; Jin, X.; Shan, D.; Chai, B. Study on the effect of solution treatment on hot deformation behavior and workability of Mg-7Gd-5Y-0.6Zn-0.8Zr magnesium alloy. J. Alloys Compd. 2017, 720, 309–323. [Google Scholar] [CrossRef]
  41. Zhang, Z.; Yan, Z.; Du, Y.; Zhang, G.; Zhu, J.; Ren, L.; Wang, Y. Hot Deformation Behavior of Homogenized Mg-13.5Gd-3.2Y-2.3Zn-0.5Zr Alloy via Hot Compression Tests. Materials 2018, 11, 2282. [Google Scholar] [CrossRef]
  42. Oñorbe, E.; Garcés, G.; Pérez, P.; Cabezas, S.; Klaus, M.; Genzel, C.; Frutos, E.; Adeva, P. The evolution of internal strain in Mg–Y–Zn alloys with a long period stacking ordered structure. Scr. Mater. 2011, 65, 719–722. [Google Scholar] [CrossRef]
  43. Li, B.; Teng, B.; Xu, W. Hot Deformation Characterization of Homogenized Mg-Gd-Y-Zn-Zr Alloy During Isothermal Compression(Article). J. Miner. Met. Mater. Soc. 2019, 71, 4059–4070. [Google Scholar] [CrossRef]
  44. Xue, Z.; Luo, W.; Zhao, Z.; Ren, Y. Thermal compression, processing maps and microstructural evolution of as-cast Mg-Gd-Y-Zn-Zr alloy with long period stacking ordered phase(Article). Mater. Res. Express 2020, 7, 056512. [Google Scholar] [CrossRef]
  45. Pang, H.; Li, Q.; Chen, X.; Chen, P.; Li, X.; Tan, J. Hot deformation behavior and microstructure evolution of Mg-Gd-Y(-Sm)-Zr alloys. J. Alloys Compd. 2022, 920, 165937. [Google Scholar] [CrossRef]
  46. Zener, C.; Hollomon, J.H. Effect of Strain Rate Upon Plastic Flow of Steel. J. Appl. Phys. 1944, 15, 22–32. [Google Scholar] [CrossRef]
  47. Dong, Y.Y.; Zhang, C.; Lu, X.; Wang, C.; Zhao, G. Constitutive equations and flow behavior of an as-extruded AZ31 magnesium alloy under large strain condition. J. Mater. Eng. Perform. 2016, 25, 2267–2281. [Google Scholar] [CrossRef]
  48. Cai, J.; Wang, K.; Han, Y. A Comparative Study on Johnson Cook, Modified Zerilli-Armstrong and Arrhenius-Type Constitutive Models to Predict High-Temperature Flow Behavior of Ti-6Al-4V Alloy in alpha plus beta Phase. High Temp. Mater. Process. 2016, 35, 297–307. [Google Scholar] [CrossRef]
  49. Prasad, Y.V.R.K.; Seshacharyulu, T. Modelling of hot deformation for microstructural control. Int. Mater. Rev. 1998, 43, 243–258. [Google Scholar] [CrossRef]
  50. Srinivasan, N.; Prasad, Y.V.R.K. Microstructural control in hot working of IN-718 superalloy using processing map. Metall. Mater. Trans. A 1994, 25, 2275–2284. [Google Scholar] [CrossRef]
  51. Xin, J.; Zhang, L.; Ge, G.; Lin, J. Characterization of microstructure evolution in β-γ TiAl alloy containing high content of Niobium using constitutive equation and power dissipation map. Mater. Des. 2016, 107, 406–415. [Google Scholar] [CrossRef]
  52. Prasad, Y.; Rao, K. Processing maps for hot deformation of rolled AZ31 magnesium alloy plate: Anisotropy of hot workability. Mater. Sci. Eng. A 2008, 487, 316–327. [Google Scholar] [CrossRef]
  53. Kaibyshev, R.; Gottstein, G.; Galiyev, A. Correlation of plastic deformation and dynamic recrystallization in magnesium alloy ZK60. Acta Mater. 2001, 49, 1199–1207. [Google Scholar] [CrossRef]
  54. Su, N.; Deng, Q.; Wu, Y.; Peng, L.; Yang, K.; Chen, Q. Deformation-induced dissolution of long-period stacking ordered structures and its re-precipitation in a Mg-Gd-Zn-Mn alloy. Mater. Charact. 2020, 171, 110756. [Google Scholar] [CrossRef]
  55. Zhao, X.; Yang, Z.; Zhang, J.; Liang, M.; Wang, L. Formation and transformation of metastable LPSO building blocks clusters in Mg-Gd-Y-Zn-Zr alloys by spinodal decomposition and heterogeneous nucleation. J. Magnes. Alloys 2024, 12, 673–686. [Google Scholar] [CrossRef]
  56. Huang, K.; Logé, R.E. A review of dynamic recrystallization phenomena in metallic materials. Mater. Des. 2016, 111, 548–574. [Google Scholar] [CrossRef]
  57. Zhou, X.J.; Liu, C.M.; Gao, Y.H.; Jiang, S.N.; Chen, Z.Y. Improved workability and ductility of the Mg-Gd-Y-Zn-Zr alloy via enhanced kinking and dynamic recrystallization. J. Alloys Compd. 2018, 749, 878–886. [Google Scholar] [CrossRef]
  58. Yu, J.; Zhang, Z.; Wang, Q.; Yin, X.; Cui, J.; Qi, H. Dynamic recrystallization behavior of magnesium alloys with LPSO during hot deformation. J. Alloys Compd. 2017, 704, 382–389. [Google Scholar] [CrossRef]
  59. Li, K.; Chen, Z.; Chen, T.; Shao, J.; Wang, R.; Liu, C. Hot deformation and dynamic recrystallization behaviors of Mg-Gd-Zn alloy with LPSO phases. J. Alloys Compd. 2019, 792, 894–906. [Google Scholar] [CrossRef]
  60. Zhang, J.; Yi, Y.; Huang, S.; Mao, X.; He, H.; Tang, J.; Guo, W.; Dong, F. Dynamic recrystallization mechanisms of 2195 aluminum alloy during medium/high temperature compression deformation. Mater. Sci. Eng. A 2021, 804, 140650. [Google Scholar] [CrossRef]
  61. Liu, W.; Zhang, J.; Xu, C.; Zong, X.; Zhu, W.; Ma, Q. Precipitation behaviors of 14H LPSO lamellae in Mg96Gd3Zn0.5Ni0.5 alloys during severe plastic deformation. J. Mater. Sci. 2017, 52, 13271–13283. [Google Scholar] [CrossRef]
  62. Xiao, J.; Chen, Z.; Shao, J.; Chen, T.; Lin, X.; Liu, C. Evolution of long-period stacking ordered phases and their effect on recrystallization in extruded Mg-Gd-Y-Zn-Zr alloy during annealing. Mater. Charact. 2020, 167, 110515. [Google Scholar] [CrossRef]
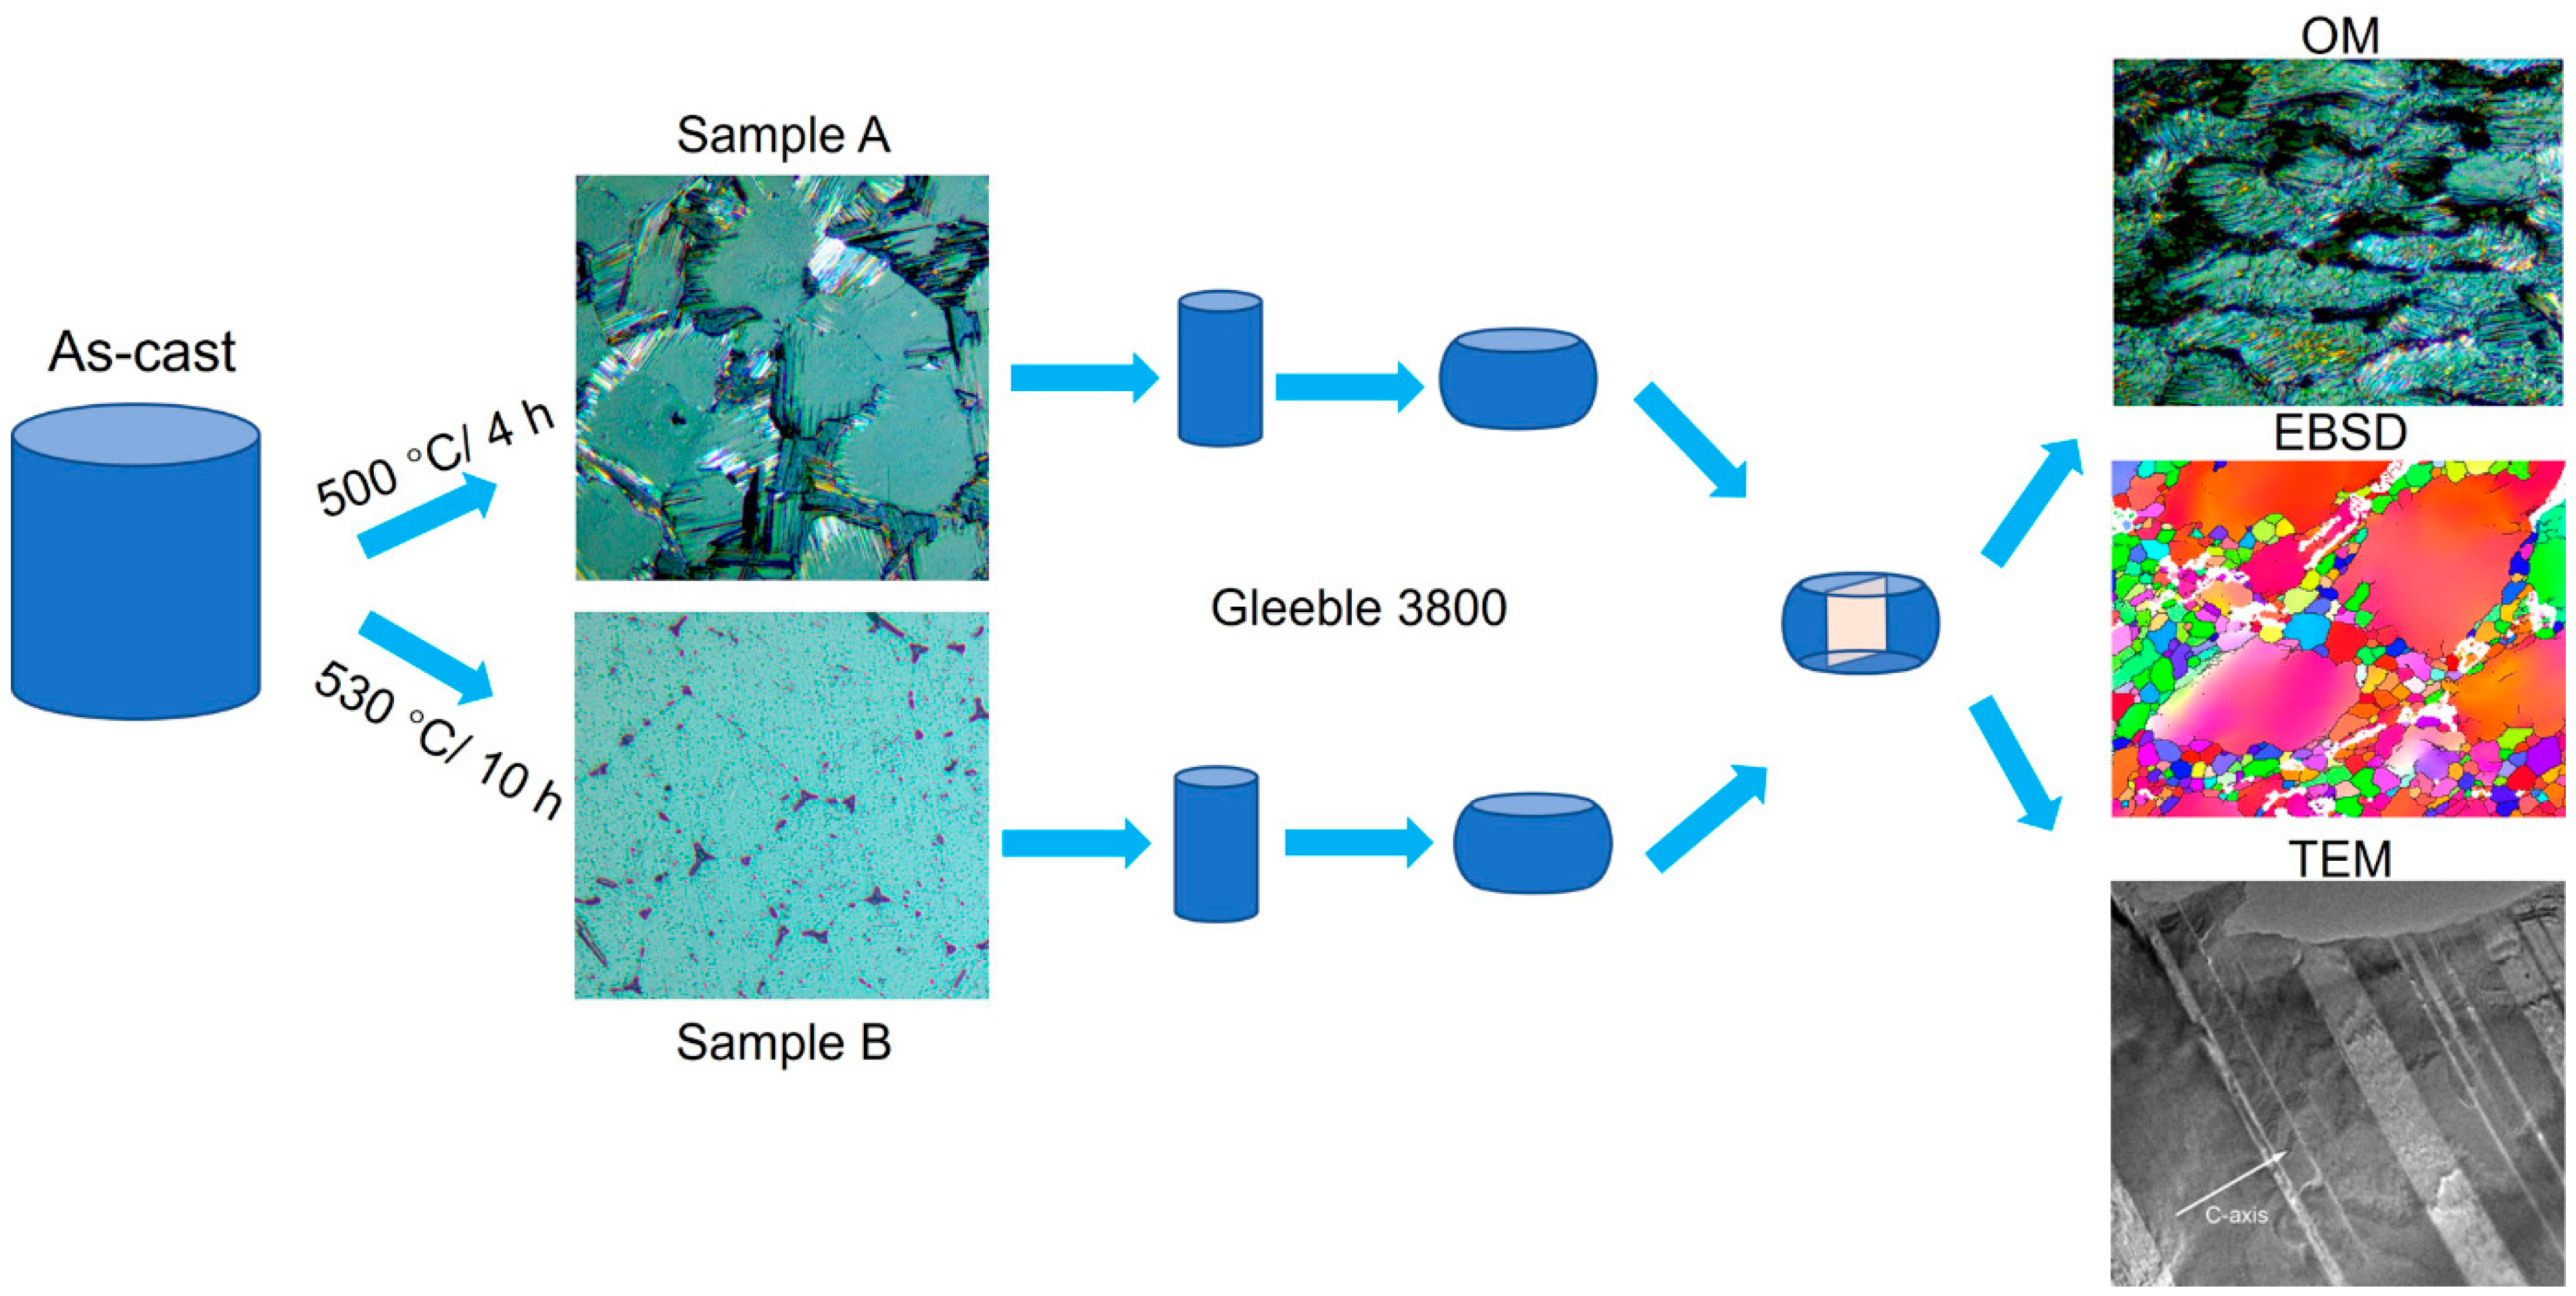
Figure 1. Flow chart of the experiments in this work.
Crystals 15 00855 g001
Figure 2. The OM (a,b) and TEM (ch) photographs of experimental samples: (a) Sample A, (b) Sample B; (cf) Sample A, (g,h) Sample B.
Crystals 15 00855 g002
Figure 3. True stress–true strain curves of sample A and sample B: (a) 0.001 s−1; (b) 0.01 s−1; (c) 0.1 s−1; (d) 1 s−1.
Crystals 15 00855 g003
Figure 4. Relationship curves of the l n ε ˙ σ and l n ε ˙ l n σ of experimental samples (a,c) sample A; (b,d) sample B.
Crystals 15 00855 g004
Figure 5. l n ε ˙ l n s i n h α σ and l n s i n h α σ 1 / T relation curves of experimental samples: (a,c) sample A; (b,d) sample B.
Crystals 15 00855 g005
Figure 6. l n Z l n s i n h α σ relation curve of the experimental samples: (a) sample A; (b) sample B.
Crystals 15 00855 g006
Figure 7. Correlations between the predicted and experimentally corrected flow stress: (a) sample A; (b) sample B.
Crystals 15 00855 g007
Figure 8. The processing maps for the (a) sample A and (b) sample B.
Crystals 15 00855 g008
Figure 9. The OM photographs of compressed samples: the sample A (ad) and sample B (eh); (a,e) 350 °C/0.001 s−1, (b,f) 350 °C/0.1 s−1, (c,g) 450 °C/0.001 s−1, (d,h) 450 °C/0.1 s−1.
Crystals 15 00855 g009
Figure 10. Microstructure of thermally compressed Sample B (450 °C/0.001 s−1). (a) SEM image; (b) Bright-Field TEM micrograph; (c) Corresponding SAED pattern.
Crystals 15 00855 g010
Figure 11. The EBSD IPF maps and GBs maps of as-compressed samples: the sample A (a1b5) and sample B (c1d5), (a1,b1,c1,d1) 350 °C/0.01 s−1, (a2,b2,c2,d2) 400 °C/0.01 s−1, (a3,b3,c3,d3) 450 °C/0.001 s−1, (a4,b4,c4,d4) 450 °C/0.01 s−1, and (a5,b5,c5,d5) 450 °C-0.1 s−1.
Crystals 15 00855 g011
Figure 12. The IPF, GBs, and KAM maps of the selected original grains indicated in Figure 11: (a1a3) OG1; (b1b3) OG2; (c1c3) OG3 and OG4; and (d1d3) OG5.
Crystals 15 00855 g012
Figure 13. Schematic of microstructural evolution characterized with DRX stimulated by KBs: (a) Original grains; (b) as deformation increases, dislocation density and LAGBs density increase sig-nificantly at the KBs; (c) Ultimately, HAGBs form at the kink.
Crystals 15 00855 g013
Figure 15. SEM images: (a) as-compressed sample A with 350 °C/1 s−1; (d) as-compressed sample B with 350 °C/1 s−1; TEM micrographs: (b,c) as-compressed samples A with 450 °C/0.01 s−1; (e,f) as-compressed samples B with 400 °C/0.01 s−1.
Crystals 15 00855 g015
Figure 16. The misorientation angle distribution: (a,c) with strain rate of 0.01 s−1; (b,d) at 450 °C.
Crystals 15 00855 g016
Figure 17. (a) The DRXed grain size and (b) the fraction of DRXed grains measured from the EBSD data (Blue curve: T = 450 °C; red curve: strain rate = 0.01 s−1).
Crystals 15 00855 g017
Table 1. Chemical composition of the experimental alloy.
ElementErSmZnZrMg
Composition (wt.%)9.2354.8562.2230.5940Bal.
Table 2. Hot deformation activation energies and key parameters of relevant Mg-based alloys.
Alloy Composition (wt.%)Deformation Temperature Range (K)Strain Rate Range (s−1)Activation Energy (Q, kJ/mol)
Pure Mg [41,43,44]623~7730.001~1135
Mg-13.5Gd-3.2Y-2.3Zn-0.5Zr [41]623~7730.001~1263.17
Mg-13Gd-4Y-2Zn-0.6Zr [43]673~7480.001~1276.21
Mg-7.5Gd-2.5Y-1.5Zn-0.5Zr [44]623~7230.001~1234.6
Mg-6Gd-3Y-0.5Zr [45]623~7730.003~1206.17
Mg-6Gd-3Y-3Sm-0.5Zr [45]623~7730.003~1263.07
Disclaimer/Publisher’s Note: The statements, opinions and data contained in all publications are solely those of the individual author(s) and contributor(s) and not of MDPI and/or the editor(s). MDPI and/or the editor(s) disclaim responsibility for any injury to people or property resulting from any ideas, methods, instructions or products referred to in the content.