Article

Fine Tuning of Hierarchical Zeolite Beta Acid Sites Strength

1
Ruđer Bošković Institute, Bijenička 54, 10000 Zagreb, Croatia
2
National Institute of Chemistry, Hajdrihova 19, 1000 Ljubljana, Slovenia
*
Author to whom correspondence should be addressed.
Crystals 2024, 14(1), 53; https://doi.org/10.3390/cryst14010053
Submission received: 29 November 2023 / Revised: 26 December 2023 / Accepted: 28 December 2023 / Published: 29 December 2023

Abstract

:
Two different synthesis methods to obtain hierarchical Beta zeolite are investigated: direct synthesis using cetyltrimethylammonium bromide (CTAB) as a mesoporous template and post-synthesis desilication by etching with NaOH and TPAOH. The main focus of this study is to show the possibility of fine tuning of the acid site (OH) strength (Brønsted and Lewis acid sites) through wet impregnation of these hierarchical Beta zeolites with divalent metal cations (Mg2+, Co2+, Ni2+, Cu2+, and Zn2+), which are important for various applications. Fourier transform infrared spectroscopy (FTIR) and deuterated acetonitrile as the probe molecule were used as a powerful technique to analyze the quantity and number of Brønsted/Lewis acid sites in the modified zeolite Beta structure. Investigating the influence of different divalent metal cations with a comparable ionic radius on the acidity of the hierarchical Beta zeolites, the present research aims to shed light on the structure–activity relationship that determines their catalytic behavior, for the development of efficient and environmentally friendly catalysts for various industrial applications.

1. Introduction

In recent years, the design and synthesis of advanced materials with tailored properties have become imperative. The unique physicochemical properties of the zeolites, such as their controlled acidity, adsorption capacity, ion-exchange properties, and thermal stability, as well as uniform channels and cavities crystallographically ordered in size and position, determine their effectiveness in catalytic processes. As a solid acid catalyst, zeolite plays an irreplaceable role and is currently the most widely used solid acid catalyst in the petrochemical and fine chemical fields [1,2,3]. The H+ from the OH group connected to the framework aluminum atom in zeolite can act as a proton donor, thus playing the role of a Brønsted acid site (BAS). The weaker acid sites dominantly come from non-framework aluminum and other balancing cations and act as Lewis acid sites (LAS) [4].
Despite the microporous structure, there are limitations that decrease the efficiency of zeolite as a catalyst. One of the greatest obstacles is intracrystalline diffusion of reactants and products during the process of catalysis. Such limitations can be avoided creating mesoporous voids in microcrystals, shortening the diffusion path. There are two approaches to increase the available number of active OH groups at the internal and external surface of crystals: a decrease in the particles size to nanosize and the creation of mesopores in micron-sized crystals by direct synthesis or by postsynthesis etching (desilication/dealumination) [5].
The primary focus lies in comprehending the precise positioning, quantity, categorization, and ease of access to acid sites within zeolite structures. This understanding is crucial for the meticulous adjustment of zeolites’ catalytic attributes. For example, “green“ syntheses of hydrocarbons from CO2 using solid-state acid catalysts (zeolite) can be made in several steps, including conversion to CH3OH, then to higher olefins (methanol to olefins-MTO). MTO conversion is a typical acid-catalyzed reaction. The active intermediates, e.g., polymethyl benzenes and the corresponding carbenium ions, can be formed at the BAS and induce the MTO conversion. On the other hand, coke compounds are formed faster at the BAS, causing catalyst deactivation [6,7].
For the characterization of zeolite and zeotype materials, among the different vibrational techniques, such as infrared (IR), Raman, inelastic neutron scattering (INS), and electron energy loss spectroscopy (EELS), to date, the most used is IR [8]. The acid strength and accessibility of OH groups can be measured using various probe molecules such as pyridine [9], carbon monoxide [10], and different nitriles [11] in low-pressure conditions and studied by transmission Fourier transform infrared spectroscopy (FTIR). Acetonitrile (CH3CN) appears to be an attractive probe for zeolite acidity study since it can be attached to strong and weak AS and show the difference between them [12]. Since the acetonitrile C≡N spectral region is strongly influenced by the Fermi resonance between the symmetric C≡N stretching and the combination of symmetric CH3 deformations and symmetric C–C stretching, deuterated acetonitrile (CD3CN) is used instead.
In particular, zeolite Beta is a versatile and widely used zeolitic material, and its acid properties were studied by several authors [13,14,15]. In those studies, the strength and accessibility of different acid sites were investigated by IR spectroscopy, using weakly basic CO as a probe molecule. The authors found that CO readily interacts with different OH groups, shifting the positions of the vibrational bands. Based on the shift of the bands, it is possible to finely distinguish the strength of the acid sites, indicating their heterogeneity in the zeolite framework.
This paper explores two distinct synthesis methods for generating hierarchical Beta zeolite: one through the use of cetyltrimethylammonium bromide (CTAB) as a mesoporous template during synthesis [16], and the other is a post-synthetic treatment using a mixture of sodium hydroxide (NaOH) and tetrapropylammonium hydroxide (TPAOH) [17] solutions to etch the parent crystals.
The primary focus of this study is to show how a different way of zeolite Beta preparation can influence the strength of acid sites (Brønsted and Lewis AS) through wet impregnation of these hierarchical Beta zeolites with divalent metal cations (Mg2+, Co2+, Ni2+, Cu2+, and Zn2+), which can be important in various catalytic/industrial applications. For example, zeolite beta catalyzes different types of reactions, such as (trans)alkylations, acylations, isomerizations, disproportionations, cracking, etc. [18,19,20,21,22,23], while metal exchanged/impregnated beta shows catalytic activity in NOx decomposition [24,25], acetone and methanol conversion to hydrocarbons [26,27] or oxidation of different organic compounds [28,29]. Also, the aim of this research is to shed a light on the structure–reactivity relationship governing the zeolite Beta acid strength, through design and development of efficient and environmentally friendly materials.

2. Materials and Methods

2.1. Zeolite Beta Synthesis and Cations Insertion

NaOH, NH4NO3, Mg(CH3COO)2×4H2O, Co(CH3COO)2×4H2O, Ni(CH3COO)2×4H2O, Cu(CH3COO)2×H2O, and Zn(CH3COO)2×2H2O were obtained from Kemika, Zagreb, Croatia. Tetraethylammonium hydroxide (TEAOH), tetrapropylammonium hydroxide (TPAOH), Al(i-OPr)3, colloidal silica (Ludox HS-40) and cetyltrimethylammonium bromide (CTAB) were purchased from Sigma Aldrich, St. Louis, MO, USA.
Two different mesoporous parent zeolites, HB-1 and HB-C, were prepared using two different procedures from the similar Si/Al ratio in the gel composition.
Nano-crystallites of Beta zeolite were prepared by classical hydrothermal synthesis from the gel of oxide composition 2 Na2O × 30 (TEA)2O × Al2O3 × 165 SiO2 × 1980 H2O adopted from [30]. The synthesis was made in Teflon-lined autoclaves as a one-pot synthesis in the following way: after the addition of an aqueous solution of NaOH, redistilled water, 35 wt% aqueous solution of tetraethylammonium hydroxide (TEAOH), and Al(i-OPr)3, mixture was stirred using magnetic stirrer until complete hydrolysis (about 30 min). Then, there was the addition of colloidal silica (Ludox HS-40) and stirring for 24 h, followed by heating for 5 days at 100 °C and 24 h at 150 °C. The obtained product was washed, dried, and slowly calcined at 600 °C in the stream of air. The H-form of the samples, labeled as HB-0, were obtained by ion exchange with NH4NO3 (c = 0.8 mol dm−3) followed by calcination. The post-synthesis desilication was performed using a mixture of NaOH and TPAOH (c = 0.2 mol dm−3). The treatment was carried out at 65 °C for 30 min, with a ratio of zeolite to etching mixture of 1:30. Finally, parent material (labeled HB-1) was obtained by 2 cycles of ion exchange with NH4NO3 and calcination as described above.
Direct synthesis of hierarchically structured zeolite Beta was made using cetyltrimethylammonium bromide (CTAB) as a mesoporous template. The oxide form of the chemical composition of the starting mixture was
2 Na2O × 30 (TEA)2O × Al2O3 × 165 SiO2 × 1980 H2O × 10 CTAB
After stirring for 24 h at room temperature, reaction mixture was transferred into the Teflon-lined autoclave and heated for 5 days at 100 °C and 2 more days at 150 °C. The obtained product was washed, dried, and slowly calcined at 600 °C in the stream of air. The H-form of the samples was obtained by 2 cycles of ion exchange (0.8 mol dm−3 NH4NO3) followed by calcination. Obtained material was labeled as HB-C.
All prepared samples were impregnated using acetate salts of magnesium(II), cobalt(II), nickel(II), copper(II), and zinc(II) dissolved in redistilled water. The molar ratio of a zeolite to a salt solution was calculated to have M(II)/Al = 4. A concentration of 0.5 mol dm−3 was chosen. The cation exchange procedure was carried out at 60 °C with stirring and repeated three times, after which all samples were thoroughly washed with redistilled water, dried at 60 °C, and calcined at 350 °C with a ramp of 2 °C per minute for 180 min.

2.2. Methods of Sample Characterization

Powder X-ray diffraction (PXRD) was used for the phase analysis of the synthesized samples after each modification step. Diffraction patterns were collected using copper Kα radiation on an Empyrean (Malvern Panalytical, Malvern, UK) diffractometer with the Bragg–Brentano optics at 2θ angles from 5° to 50°, as well as from 0.5° to 5°.
The elemental composition of the samples was measured using Flame Atomic Absorption Spectroscopy (FAAS) on Aanalyst 200 (Perkin Elmer, Waltham, MA, USA). All solutions for the analysis were prepared in accordance with prescribed procedures.
UV–Vis diffuse reflectance spectroscopy (DRS) was applied to identify metal species. Measurements were made using the instrument model UV 3600 (Shimadzu, Kyoto, Japan), equipped with Integrating Sphere, and using BaSO4 as standard.
The size and the morphology of the crystals were observed using a high-resolution field emission scanning electron microscope (FE-SEM) model JSM 7000F (JEOL, Tokyo, Japan).
Textural properties were determined by isothermal adsorption of nitrogen at 77 K, after a pre-treatment in a vacuum at 250 °C for 12 h (Autosorb iQ3, Anton Paar, Graz, Austria). The specific surface area was determined using the Brunauer–Emmett–Teller (BET) method. Micropore volumes and the micropore surface area were obtained using the t-plot method. Pore size distribution was calculated by non-linear DFT (NLDFT) method, using N2 at 77 K on silica with cylindrical/spherical pores as a model.
Qualitative and quantitative analysis of acid sites was performed using Fourier transformed infrared spectroscopy (FTIR) on a Frontier (Perkin-Elmer) instrument, in the transmission mode under the pressure of 5×10⁻⁵ mbar and resolution of 4 cm−1. Self-supported pellets (d = 13 mm) for the analysis were prepared from around 5 mg of sample and activated at 350 °C for 3 h. To determine acid site strength (AS), desorption of deuterated acetonitrile (CD3CN) was measured at 100, 150, 200, and 300 °C. The concentration of the specific acid site (Brønsted and Lewis) was calculated from the integral intensity of the corresponding bands in the IR spectra after the adsorption of CD3CN, using the formula
C ( μ mol   g c a t 1 ) = I A ( X ) ε ( X ) × σ
where IA(X) is the integrated absorbance of the peak of the acid species X (Lewis or Brønsted), σ is the “density” of the wafer (actually it is wafer thickness after making at predefined pressure of 1.25 T cm−2), while ε is the molar extinction coefficient (2.05 ± 0.1 cm μmol−1 and 3.6 ± 0.2 cm μmol−1, for Brønsted and Lewis acid sites, respectively) as described by Wichterlová et al. [31].

3. Results and discussion

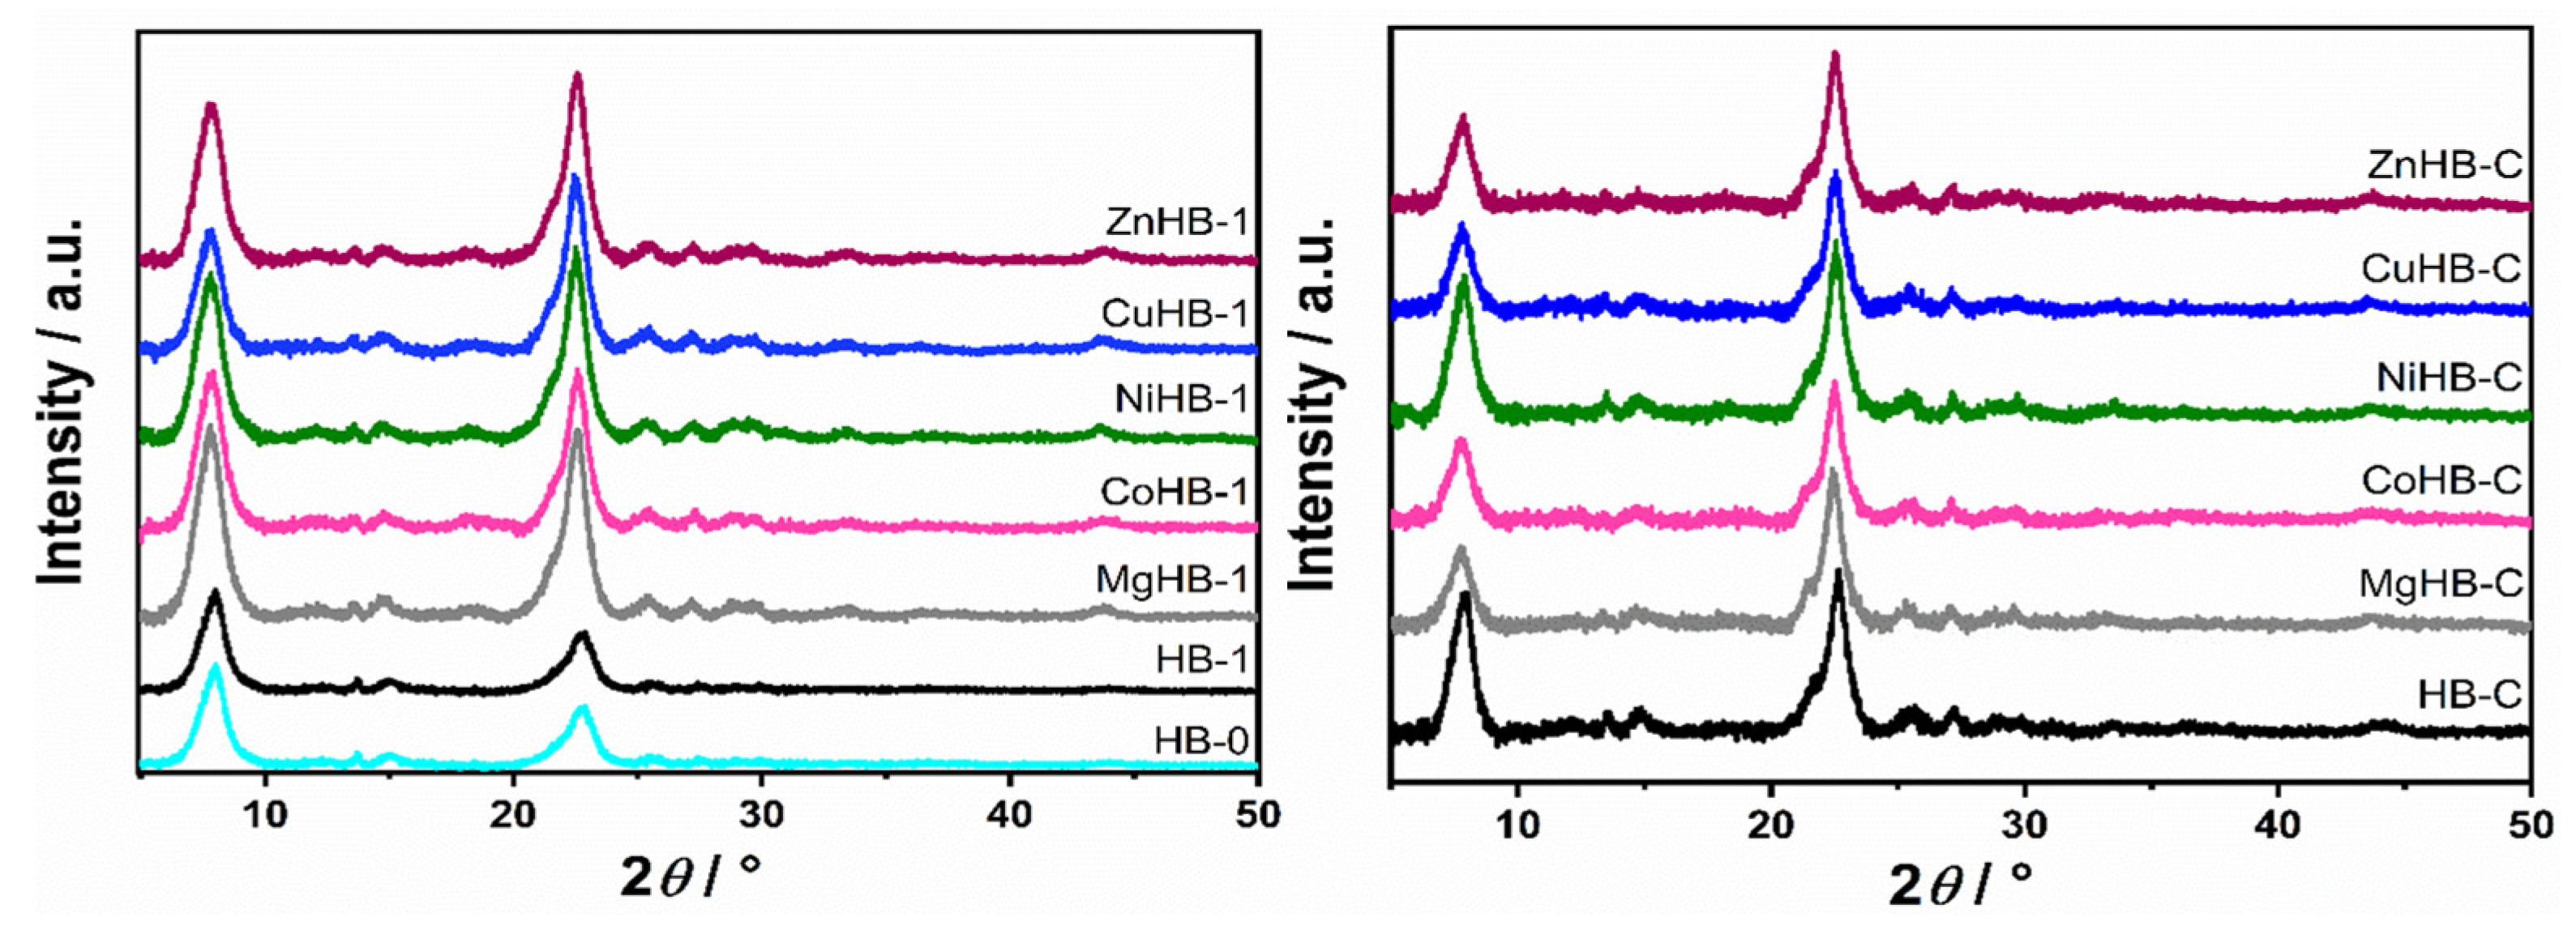
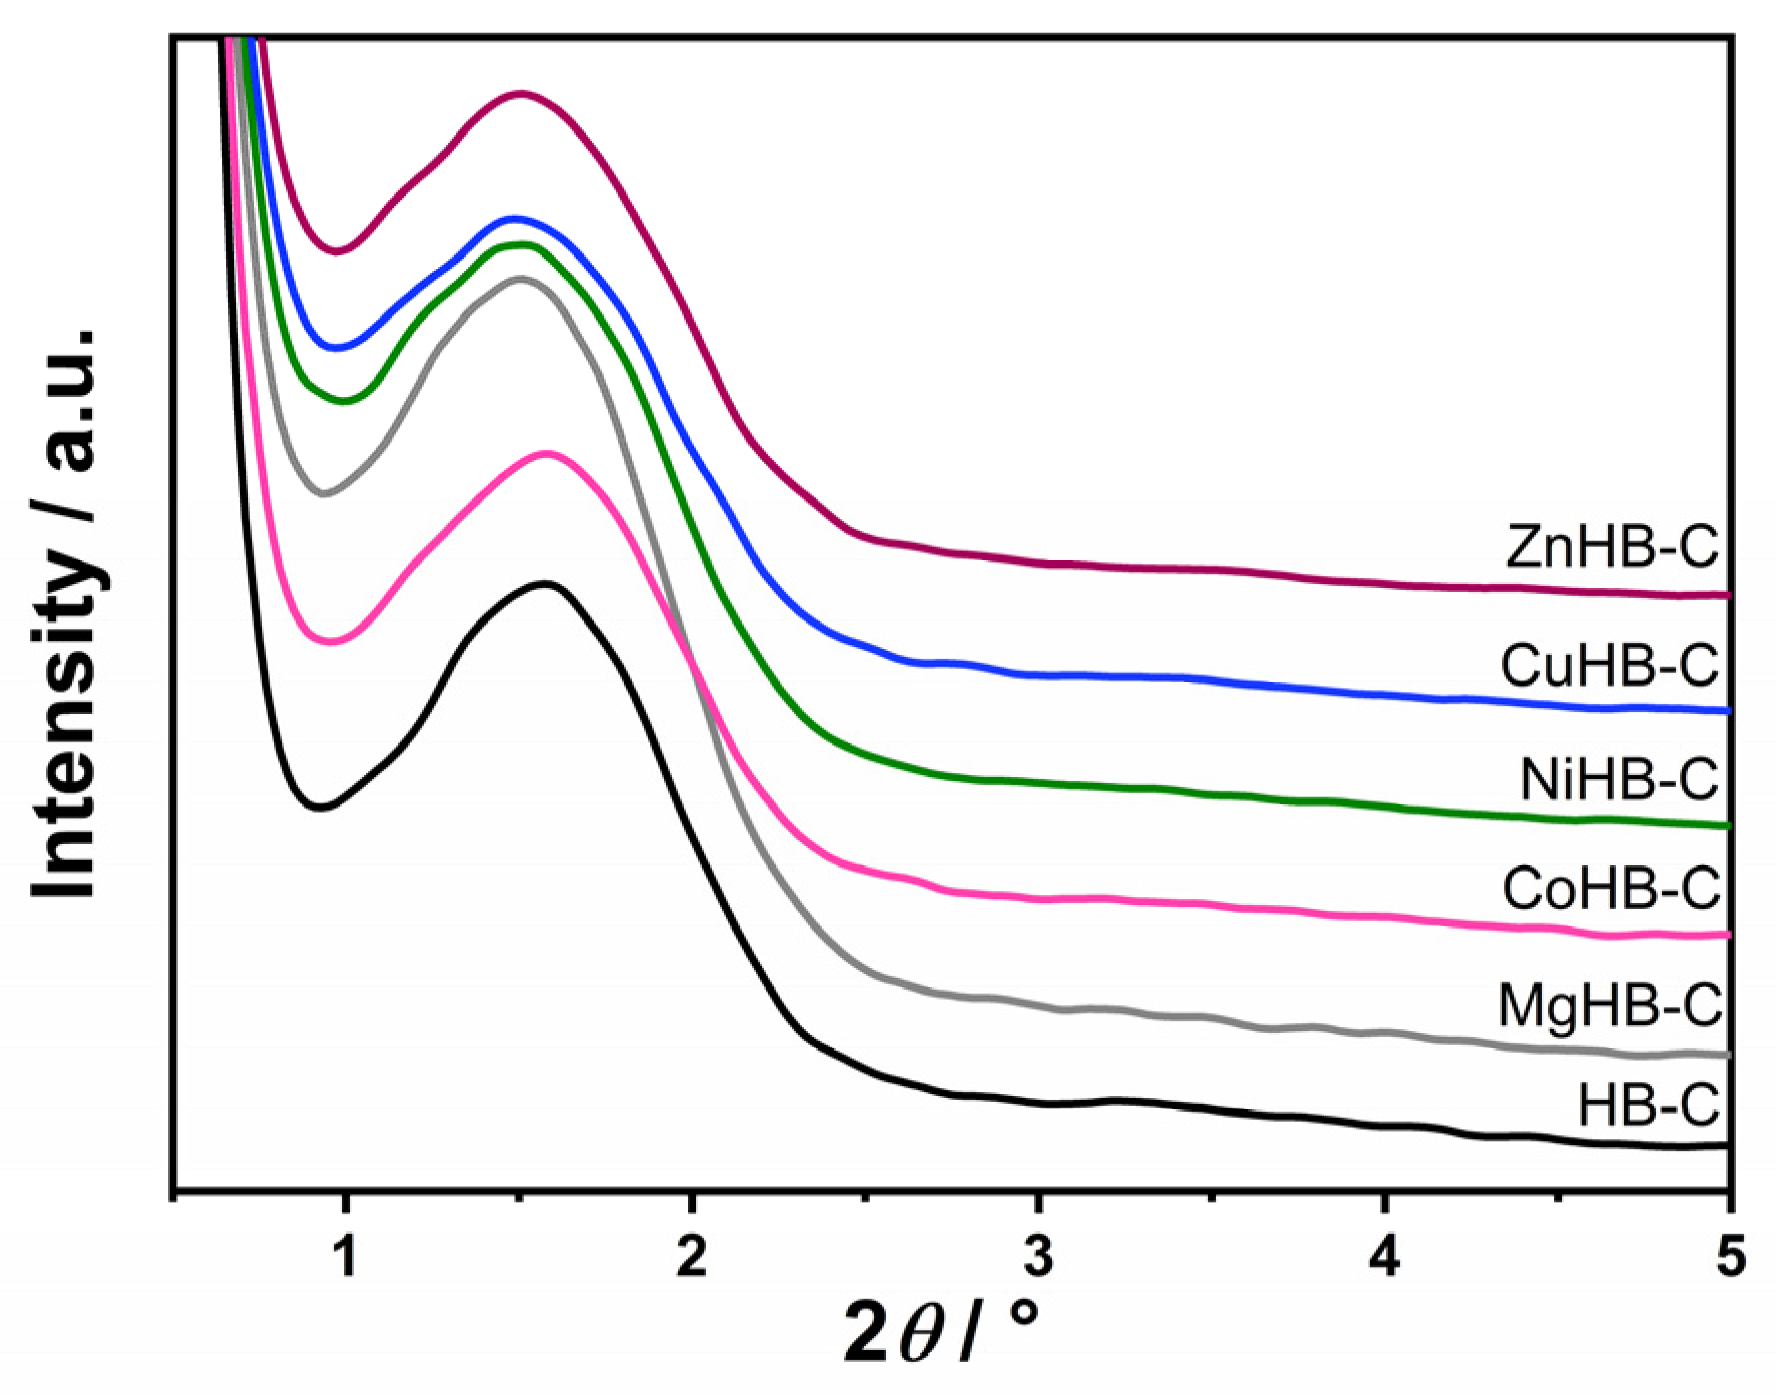
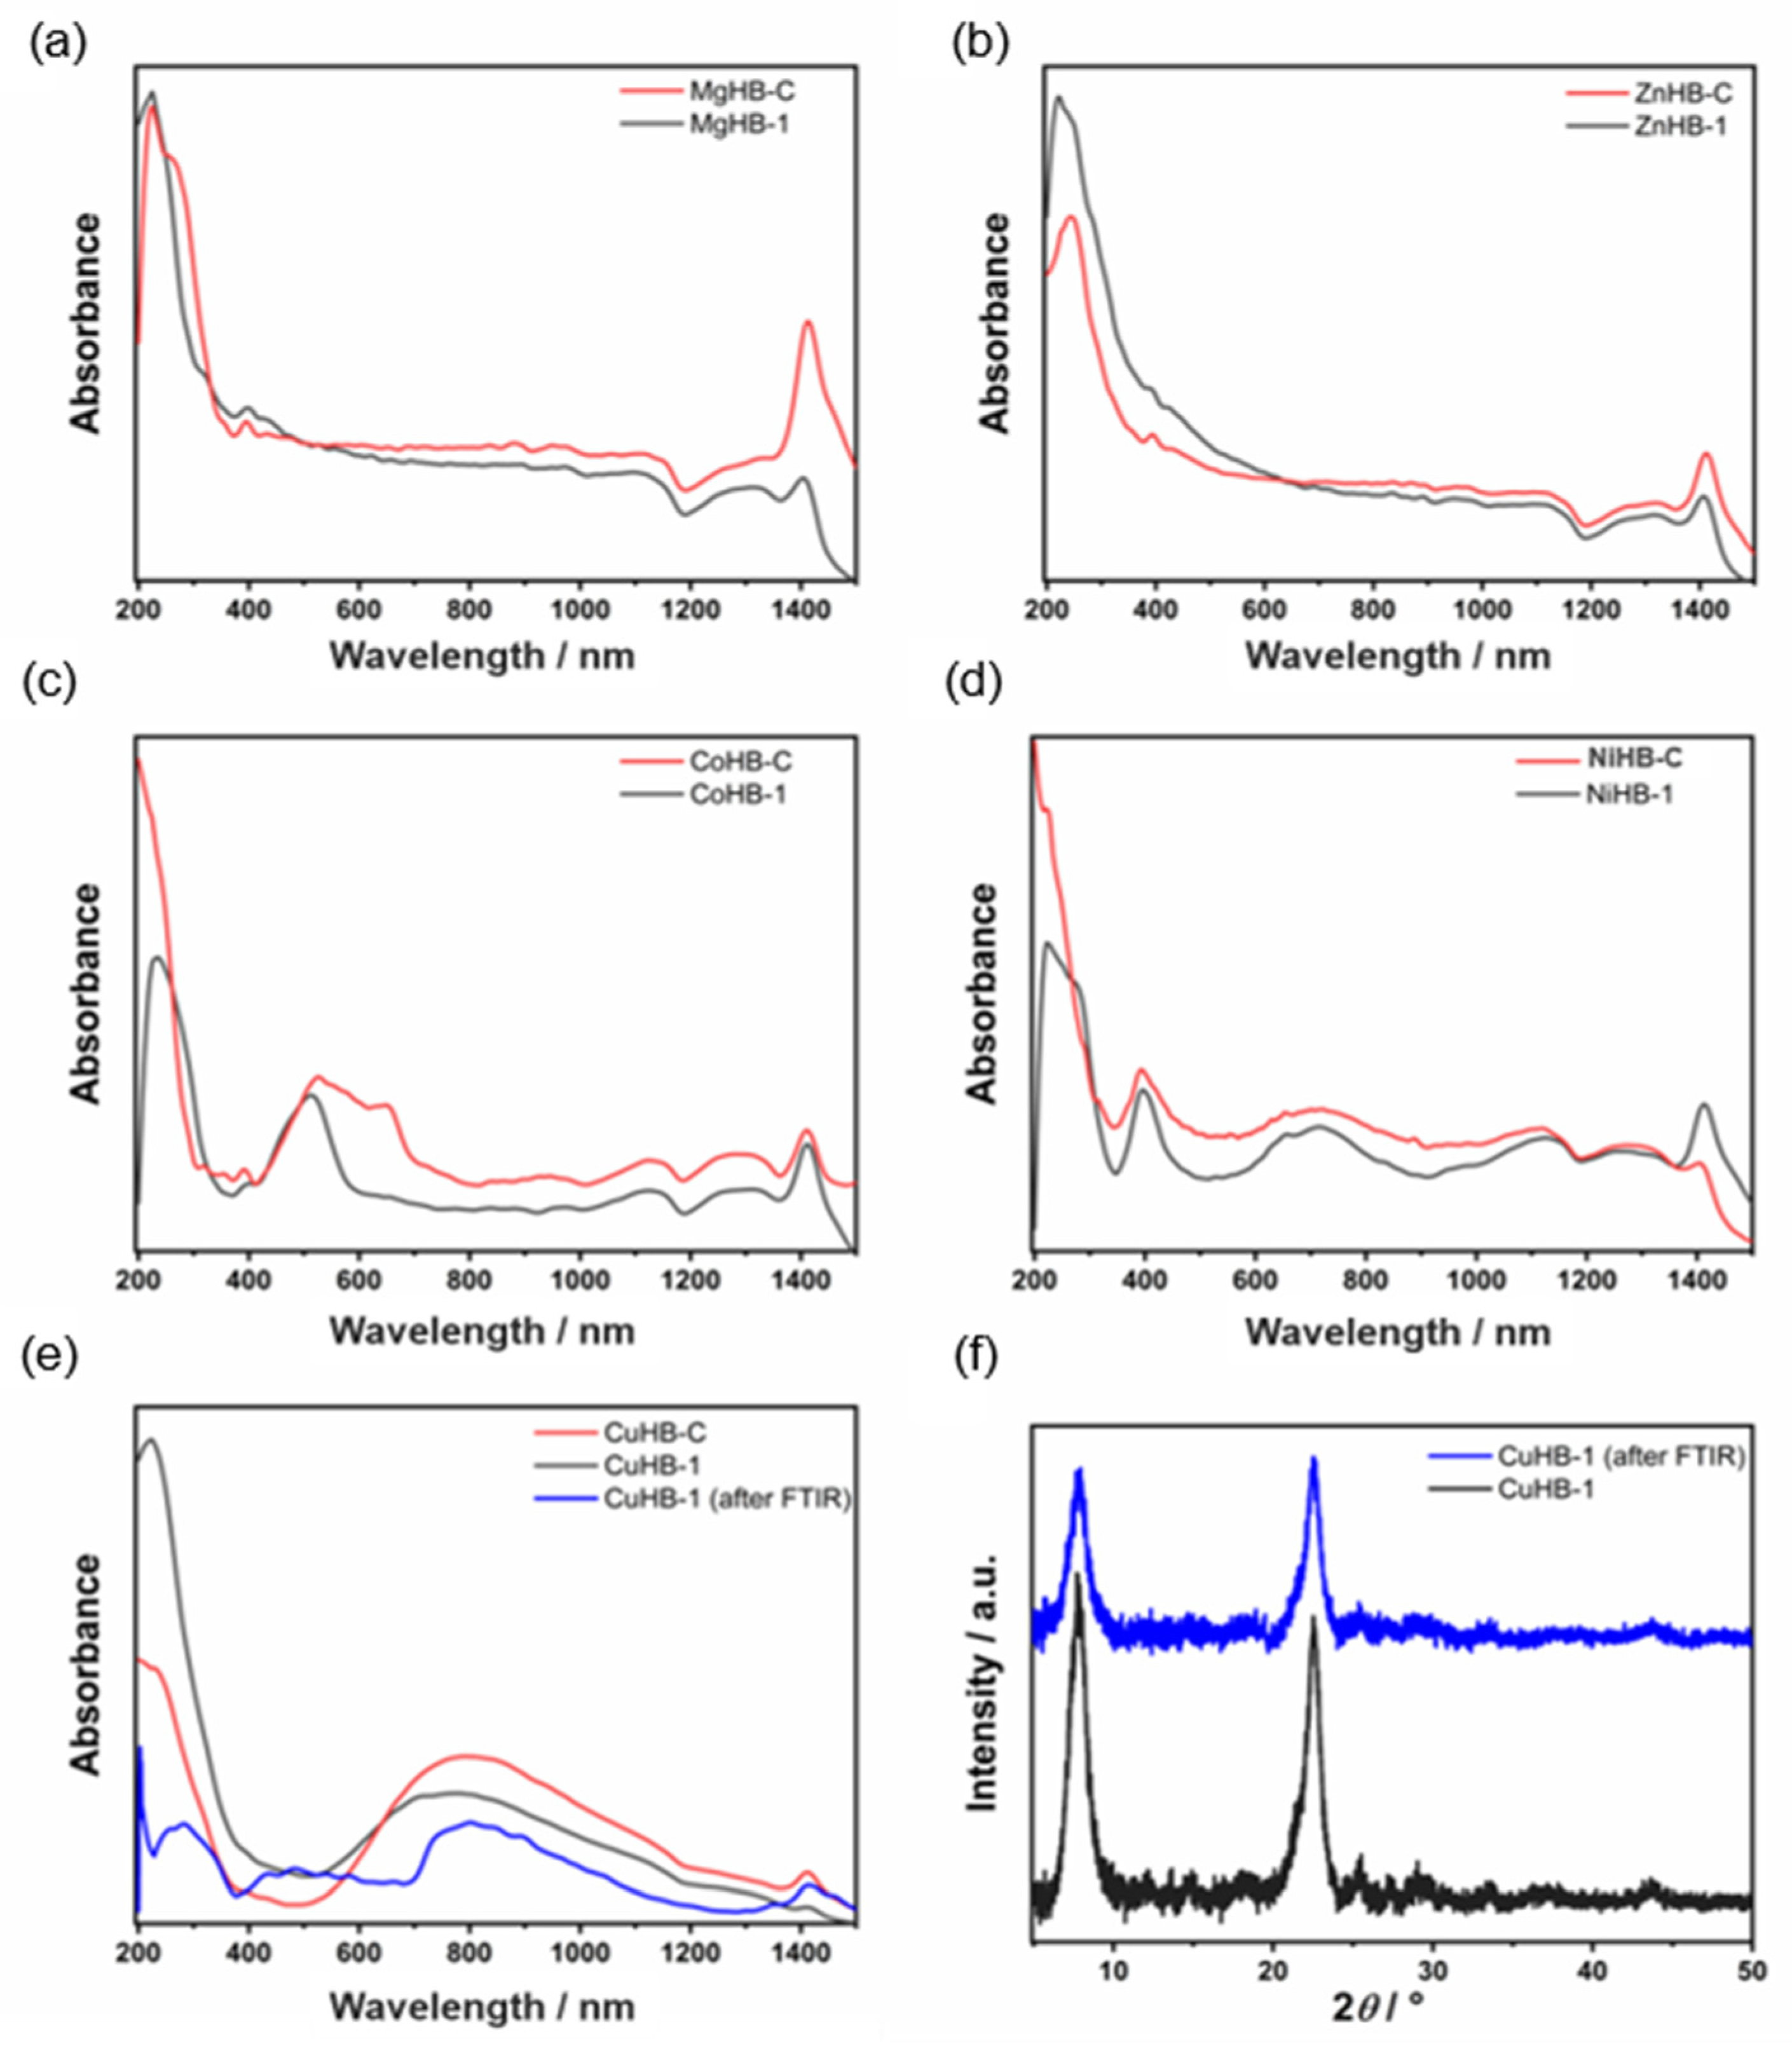
3.1. Powder X-ray Diffraction (PXRD)

PXRD profile of all samples is consistent with the standards available in the database of the International Zeolite Association relative to Beta zeolite phases. XRD patterns of the two different parent samples (HB-1 and HB-C) modified with divalent metal cations are presented in Figure 1, showing no differences in the diffraction patterns of the zeolites, indicating that the metal incorporation did not alter the zeolitic structure.
However, increase in the intensity of the diffraction maxima in HB-1 series upon loading of metal cations can be explained by the “healing” effect of the impregnation procedure. Desilication (etching) with a NaOH/TPAOH solution creates defects (silanol nests) and possibly some amorphous debris. After the process of wet impregnation, subsequent washing, and slow calcination, part of the structural defects is “healed”, and the intensity of healing depends on the type of metal cation used. At the same time, if present, the amorphous content is removed. Therefore, samples become more structured, that is, more crystalline as evidenced by the increase in the intensity of XRD signals.
Furthermore, no additional peaks between 35° and 50° were observed indicating that samples do not contain any crystalline impurities, such as metal oxides, within the detection limits of the PXRD method.
Low-angle powder X-ray diffraction patterns of the calcined parent—mesostructured zeolite Beta prepared using CTAB (HB-C)—and modified HB-C are shown in Figure 2. They clearly show a characteristic, yet relatively broad, low-angle peak around 1.6°, indicating the presence of mesopores in the materials. However, the breadth of the peak suggests that mesopores do not have significant order. Nevertheless, mesopores remain present after wet impregnation with the aqueous solutions of metal salts.

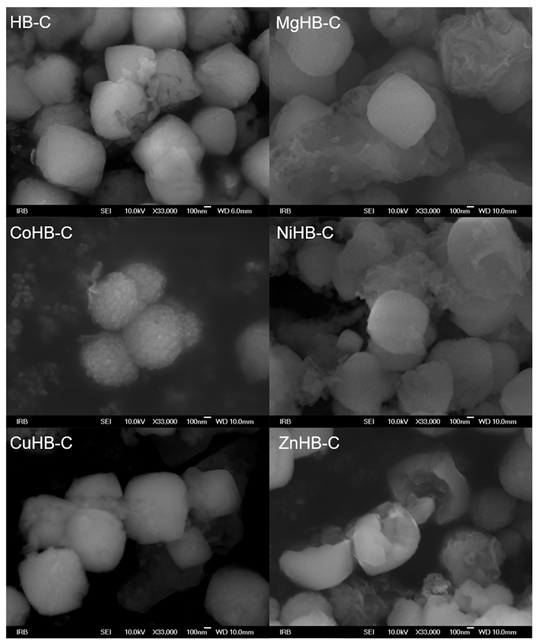
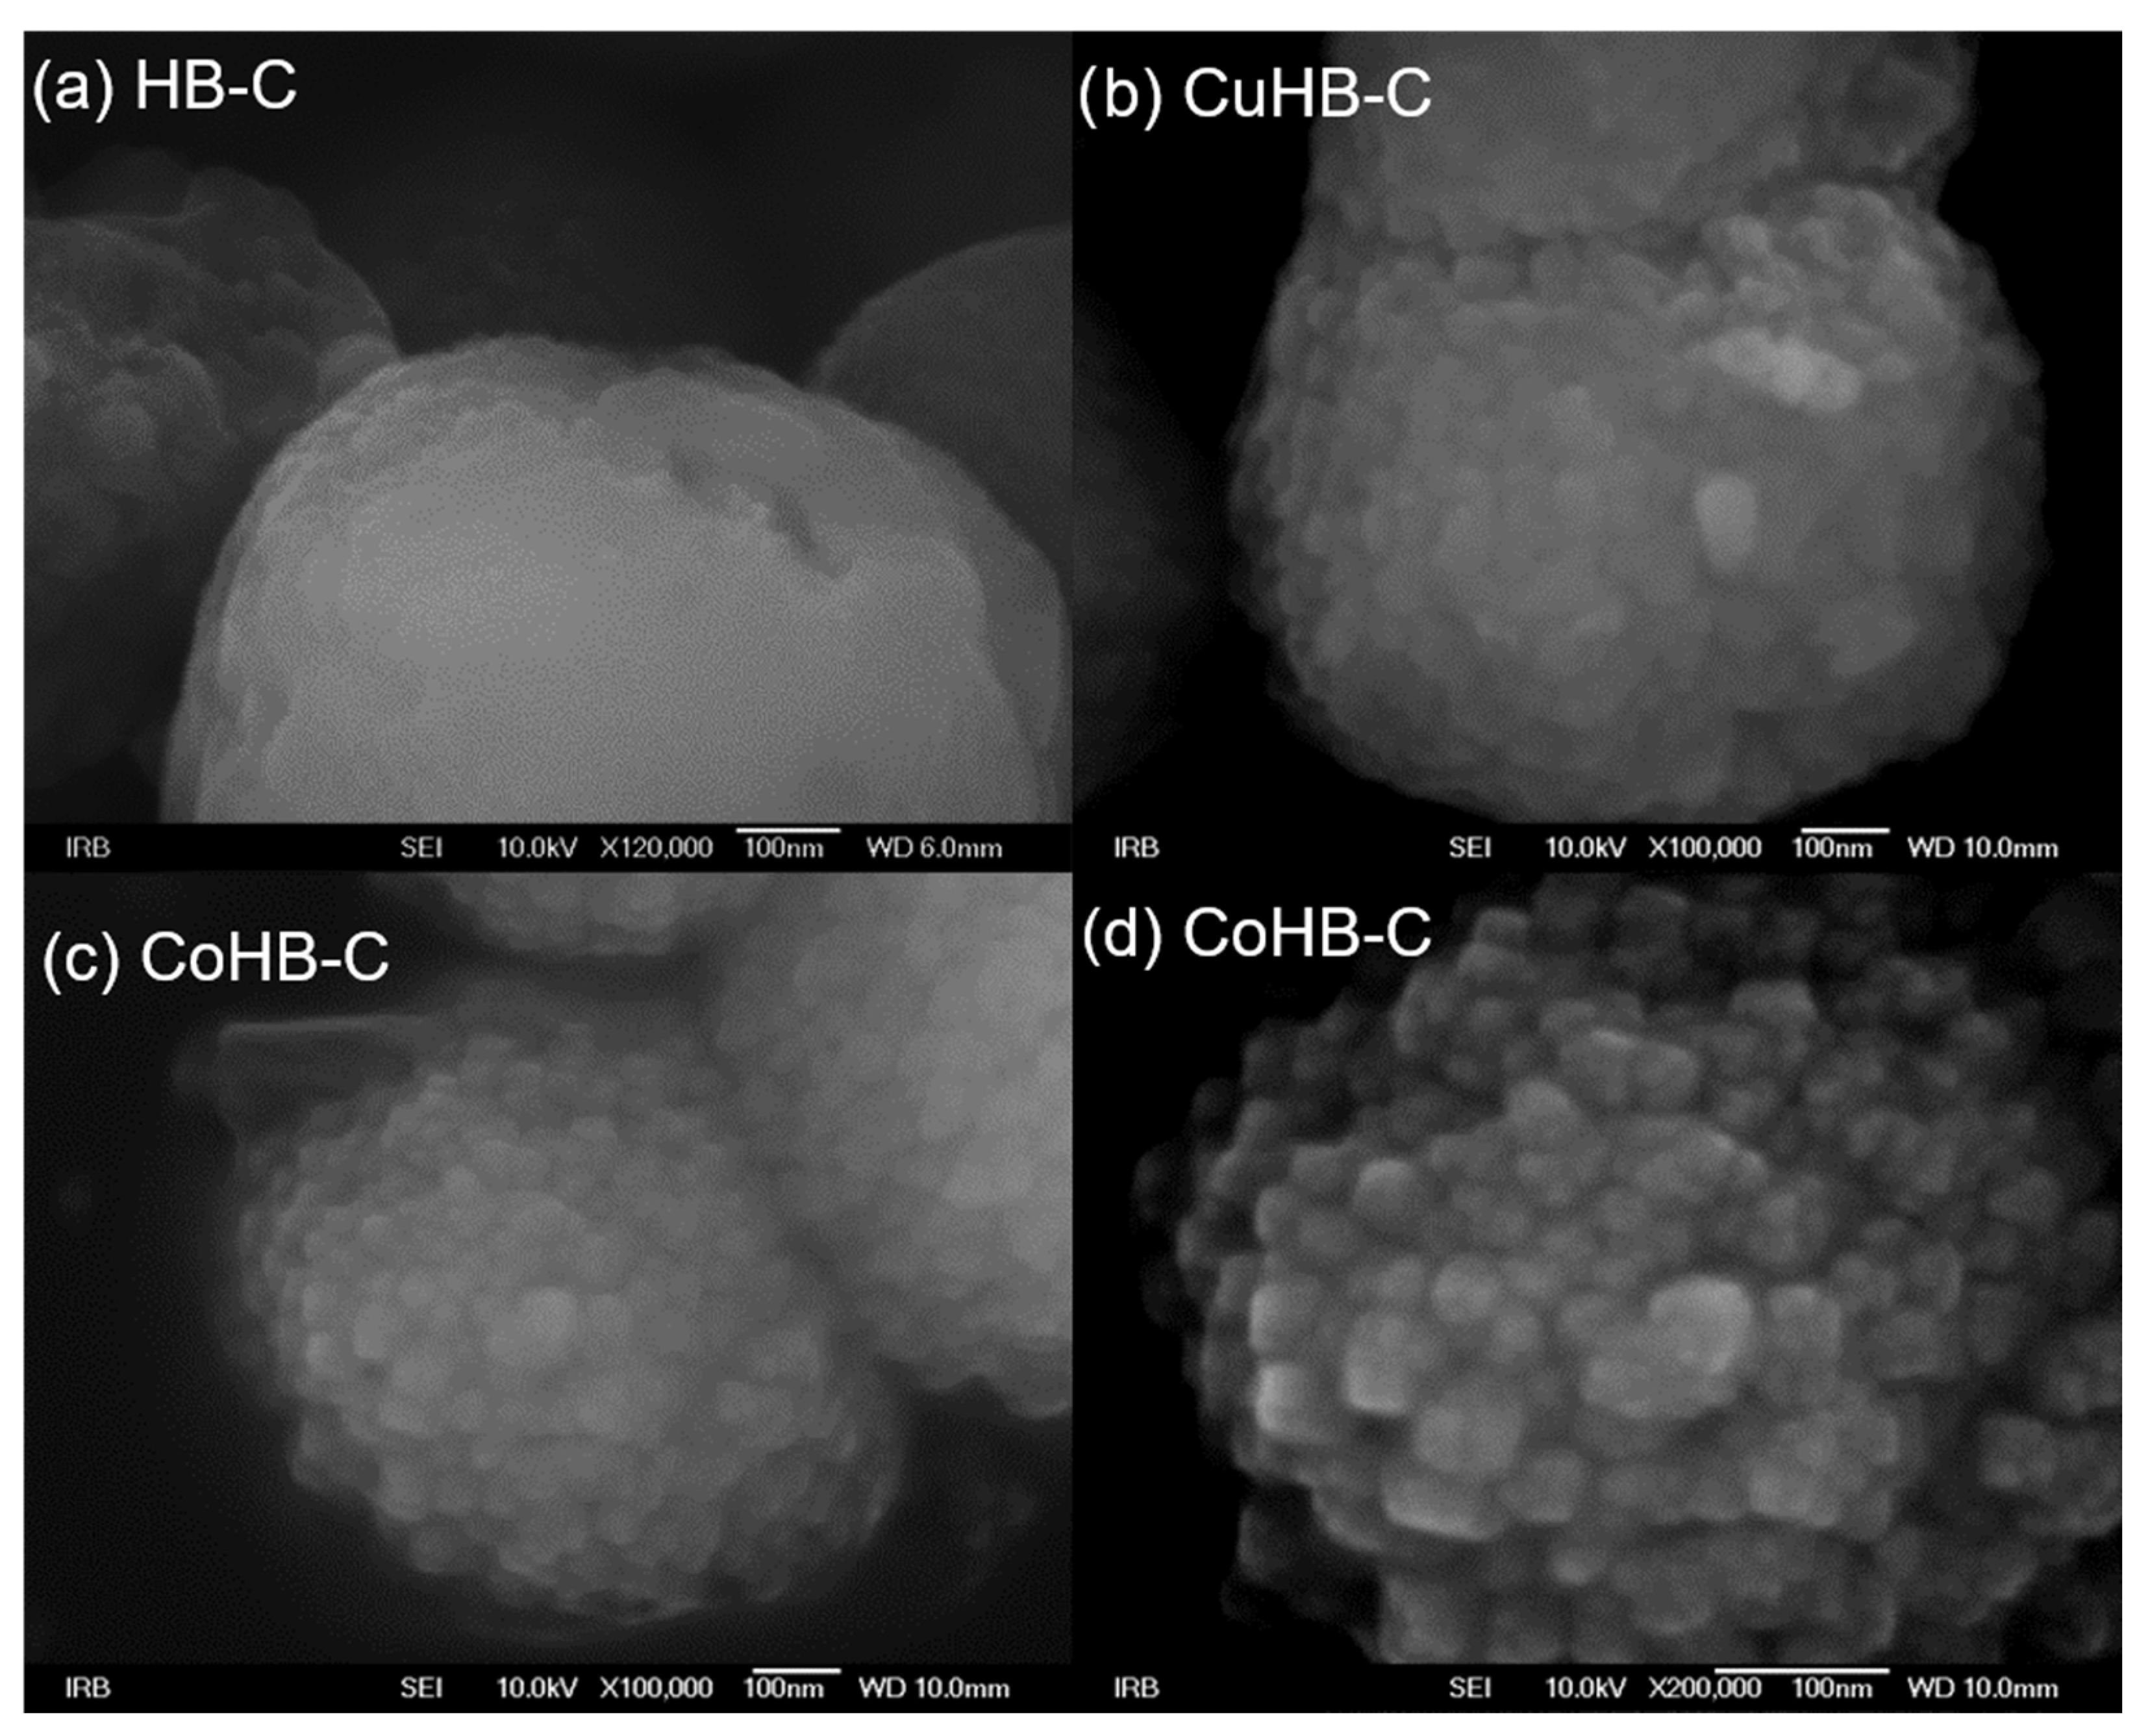
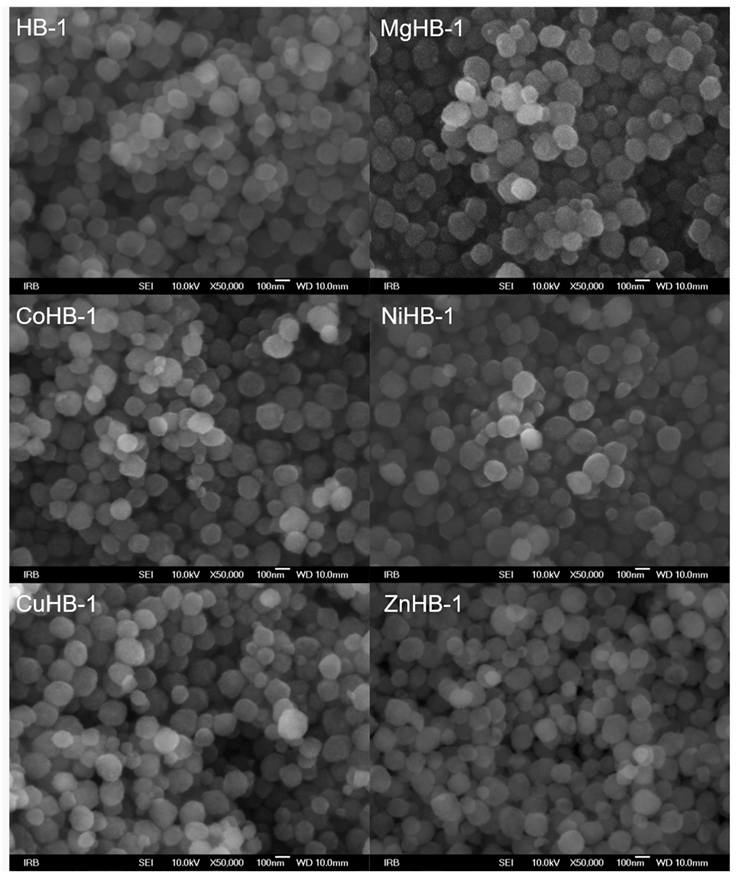
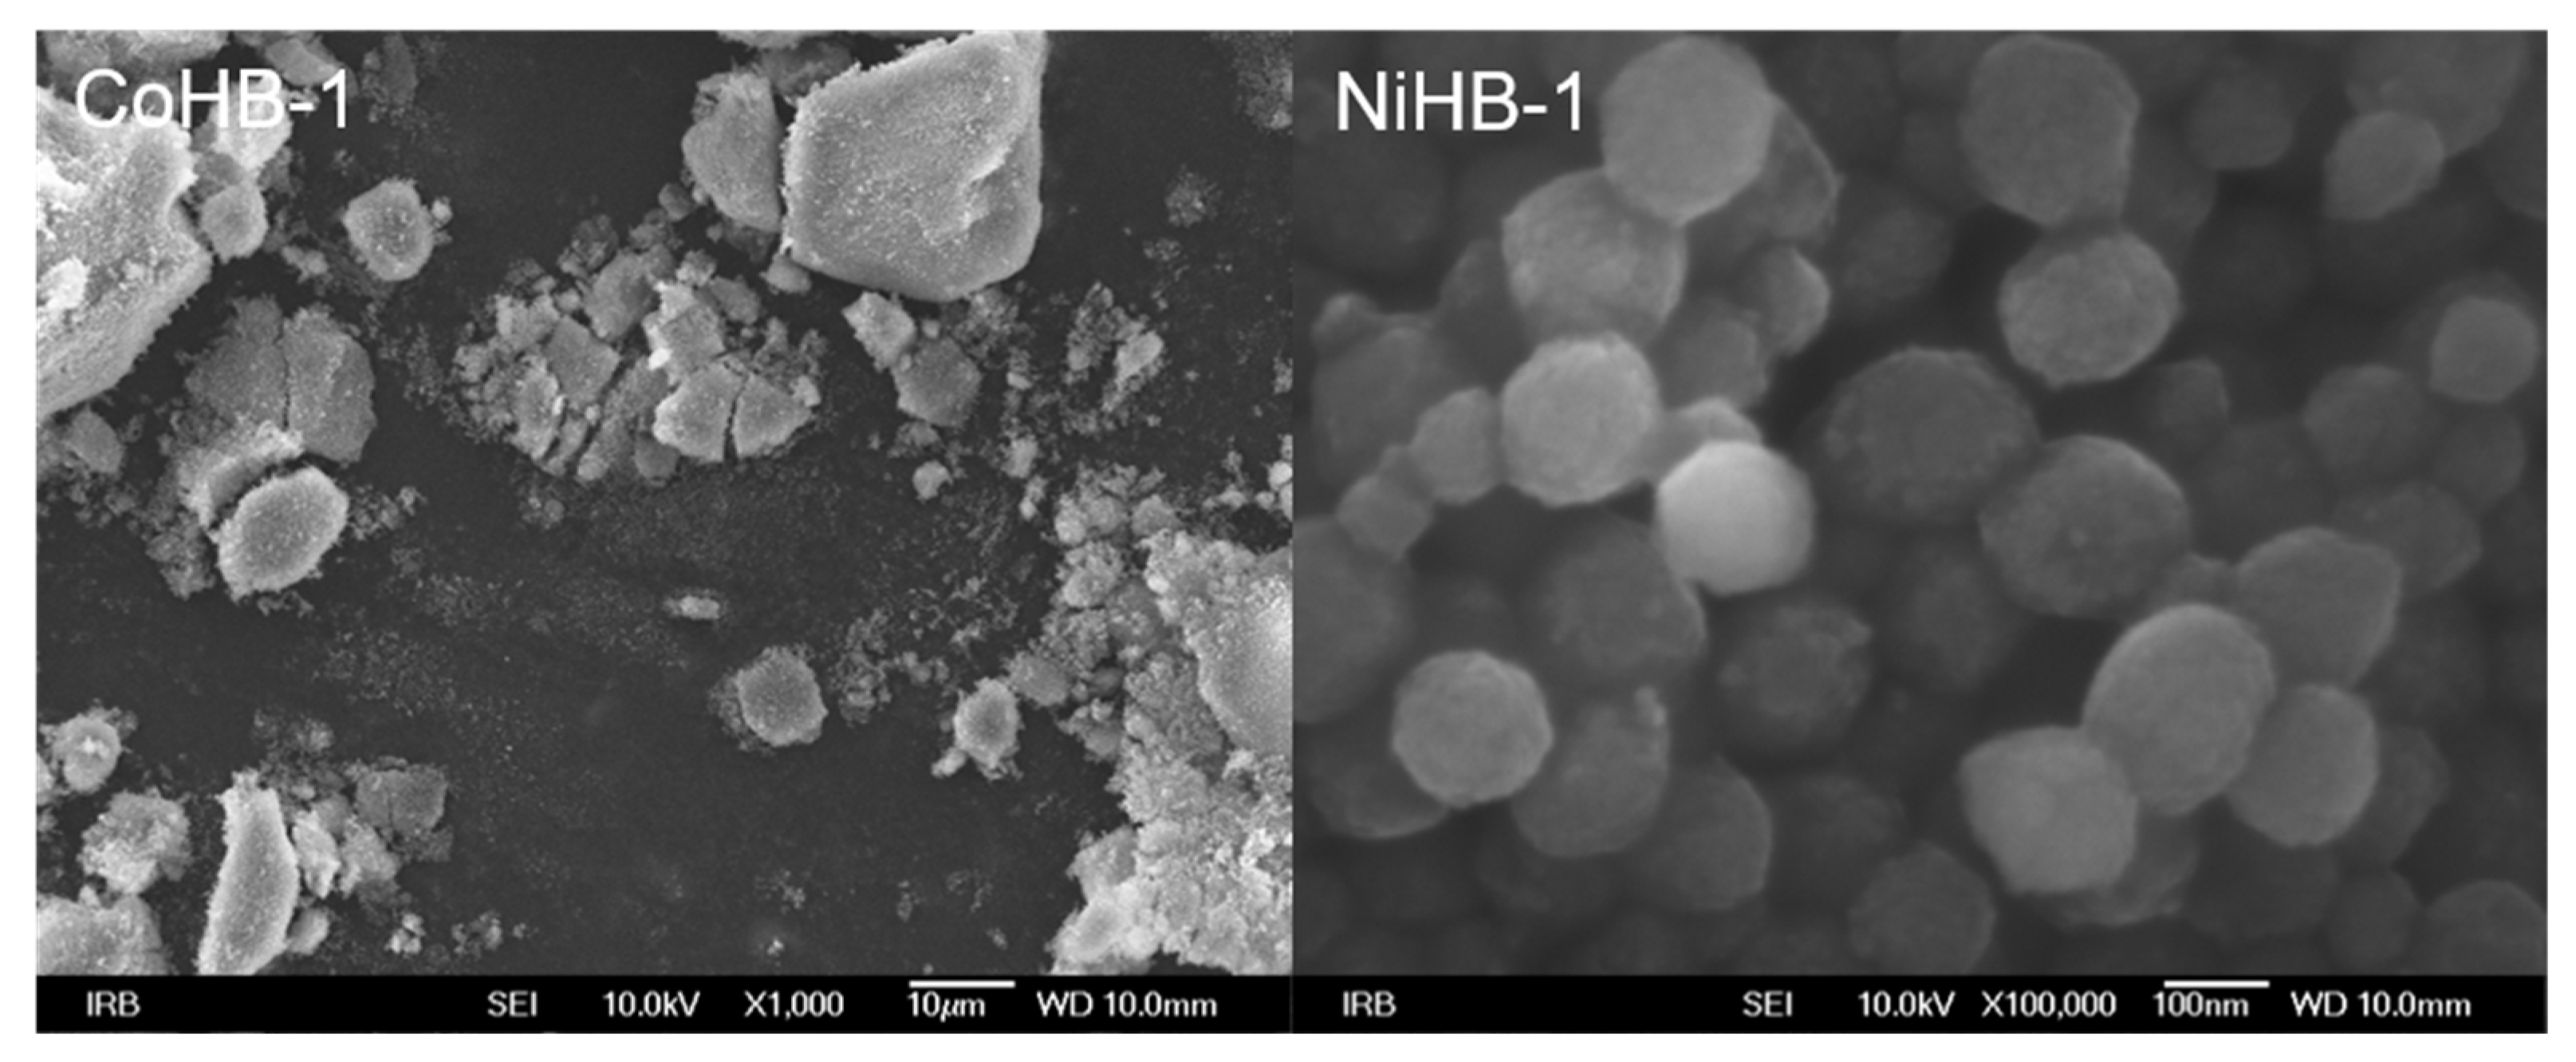
3.2. Scanning Electron Microscopy (SEM)

The nano-particles of zeolite Beta—HB-1 series of samples (Figure 3)—are spherical and have only one morphology. Wet impregnation followed by calcination did not alter the primary morphology of the parent sample HB-1. The particle size mainly falls within the range of 80 to 180 nm. In this series of samples, no impurities were found in terms of significantly larger-sized particles. During the drying process, the particles tend to aggregate into weak large agglomerates that can be several tens of micrometers in size as shown in Figure 4 (left). The SEM images provided show no significant influence of cation insertion on the morphology and dimensions of the MHB-1 particles. While agglomerated particles consist of even smaller crystallites, revealing a rough surface at high magnifications, their real size can only be estimated (Figure 4, right). Based on the high magnification SEM images, it can be argued that even nano-particles are polycrystalline. They are not smooth, exhibiting a rough surface, indicating a higher external surface area, which is confirmed by the BET analysis. Furthermore, relatively broad diffraction maxima of both HB-1 and HB-C series (Figure 1) point out that the crystallites, or more precisely crystalline domains, are smaller in size, corroborating findings from the SEM images.
On the other hand, the particles in the HB-C series (synthesized with CTAB, Figure 5) are much bigger, micrometer size, and contain a small amount of gel. Just a little longer time of synthesis (e.g., 8 h) results in the appearance of analcime and quartz crystals. In order to avoid it, a new procedure for synthesis of pure zeolite Beta was made, see Section 2.1. In samples impregnated with Mg(II), Ni(II), and Zn(II) acetate salts, a small quantity of material (gel) shows morphology of irregular thin sheets. So, from the diffraction patterns (Figure 1), the samples of the HB-C series show slightly lower crystallinity compared to the HB-1 series. The morphology of the parent (HB-C) sample and the samples impregnated with metal cations slightly differ. Although the rough surface of these particles is not immediately visible at lower magnifications, it becomes clear at higher magnifications (Figure 6), where agglomerates of nanometer-sized crystals are clearly visible. The particles in the HB-C series have a size in the range of 400–1300 nm (Figure 5) and are composed of much smaller crystallites whose size spans between 20–50 nm. These fine particles are better expressed in CuHB-C and CoHB-C samples (Figure 6).

3.3. UV Vis Spectroscopy

The DRS UV-Vis spectra of zeolite Beta samples prepared via the wet impregnation method are shown in Figure 7. The spectrum of CoHB-1 reveals a band at 515 nm which may be attributed to [Co(H2O)6]2+ species in octahedral coordination. There are also broad bands around 300 nm likely related to the oxygen-to-metal charge transfer, in line with earlier reports on the framework Co2+ in Co-MFI and Co-APO-5 structures [32]. Moreover, the pink color of the samples also confirms the presence of octahedral Co(II) species. Sample CoHB-C contains additional bands occurring at about 525, 600, and 660 nm, and those are consistent with the formation of isolated pseudo-tetrahedral Co(II) species [32,33,34].
DRS UV–Vis spectra of light green nickel-containing Beta zeolite samples look very similar and contain characteristic bands (at 405, 660, and 740 nm) related to mononuclear Ni2+ in octahedral coordination [35]. The shoulder visible in the spectra of sample NiHB-1 at around 300 nm indicates the presence of a small amount of NiO [35].
The DRS UV–Vis spectra, recorded for the Cu-modified Beta after calcination at 350 °C in the stream of air, reveal the presence of monomeric Cu2+ species. Those species are characterized with a strong absorption below 400 nm, with maxima at 230 nm [34,36]. Both samples display a broad band from 560 nm up to 1200 nm, and it is assigned to d–d transitions of isolated of Cu2+ ions in the distorted octahedral coordination. A weak band in a region between 380 and 600 nm can be attributed to CuO and [Cu-O-Cu]2+ species [37]. According to PXRD patterns, there is no evidence of CuO, but the blue color of the sample also indicates that only Cu2+ (mainly monomeric) exists in the zeolite framework probably due to the better accessibility of the ion-exchange positions in the material [38].
Finally, the very weak band for sample CuHB-C after FTIR centered at approximately 430 nm is assigned as the Obridge-Cu charge transfer transition of bis(µ-oxo)dicopper [39]. It was found that there is an optimal calcination temperature region (280–700 °C) needed to form the copper species responsible for the 440 nm band starting from a hydrated sample [40].
Samples containing Mg2+ and Zn2+ have no visible bands in the region from 200 to 1500 nm, so we can only assume that those samples would follow the same trend in metal coordination (PXRD shows that there are no metal oxides). The bands in the region between 1100 and 1430 nm are attributed to the zeolite network.

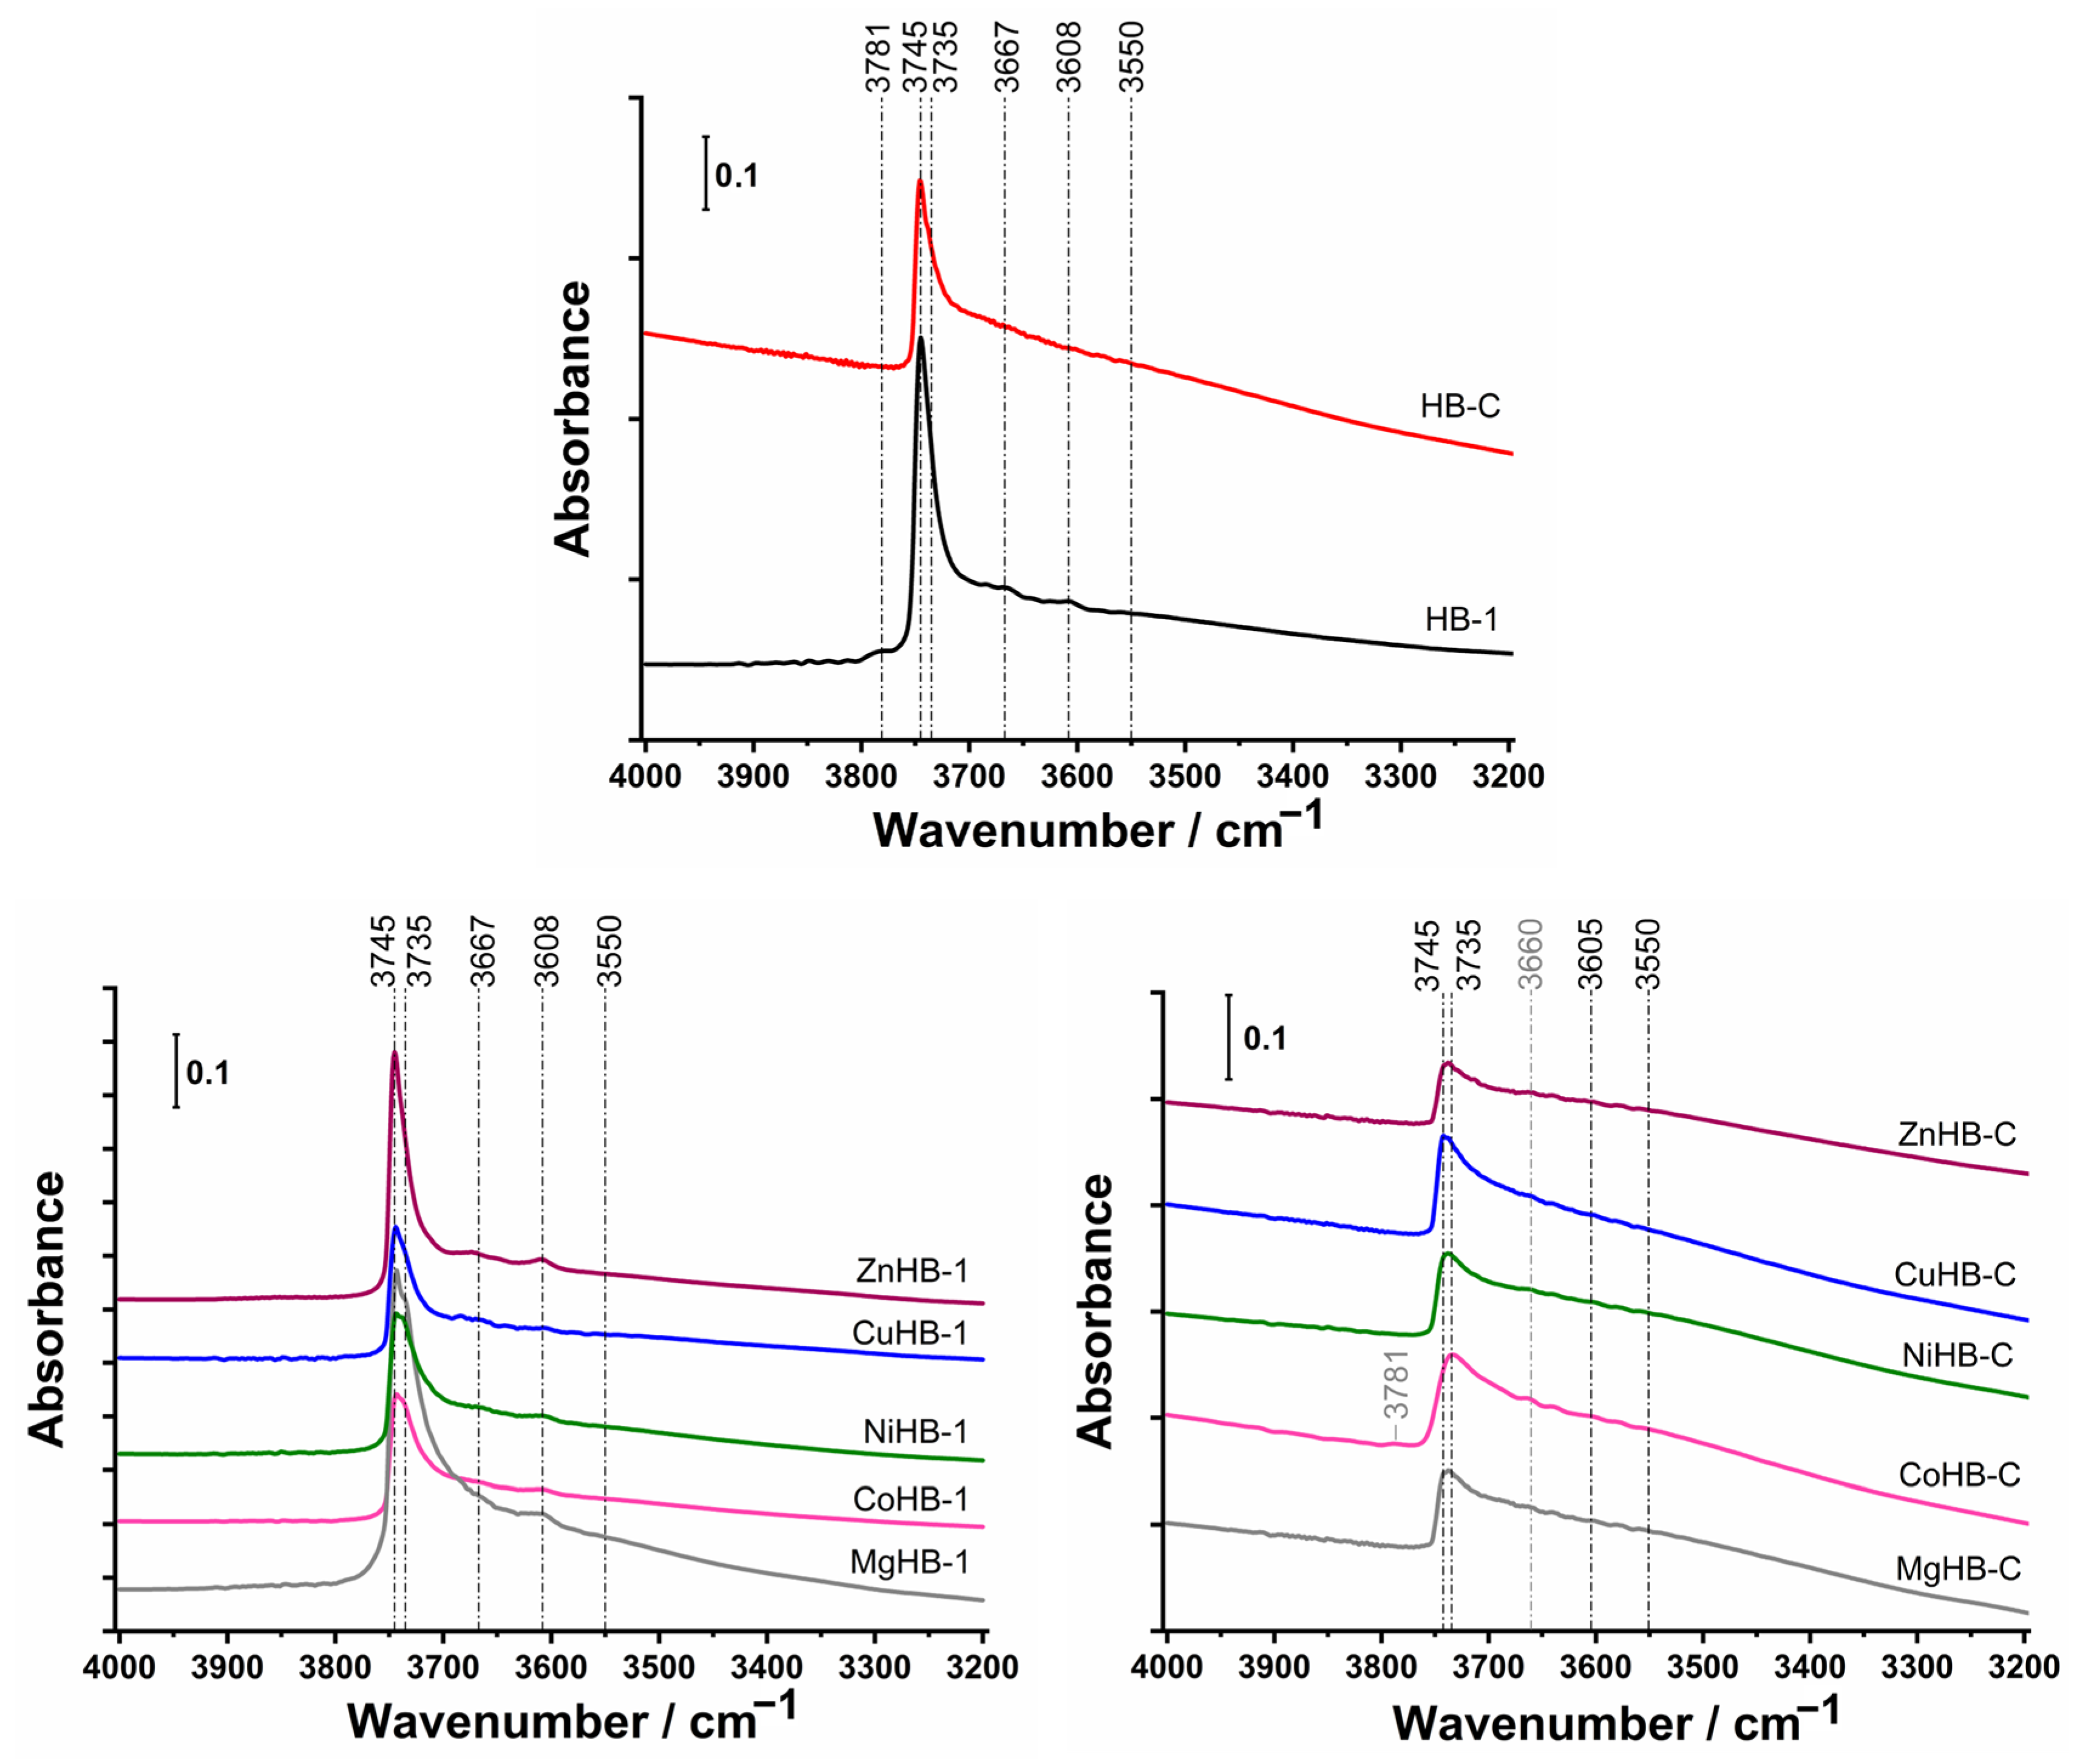
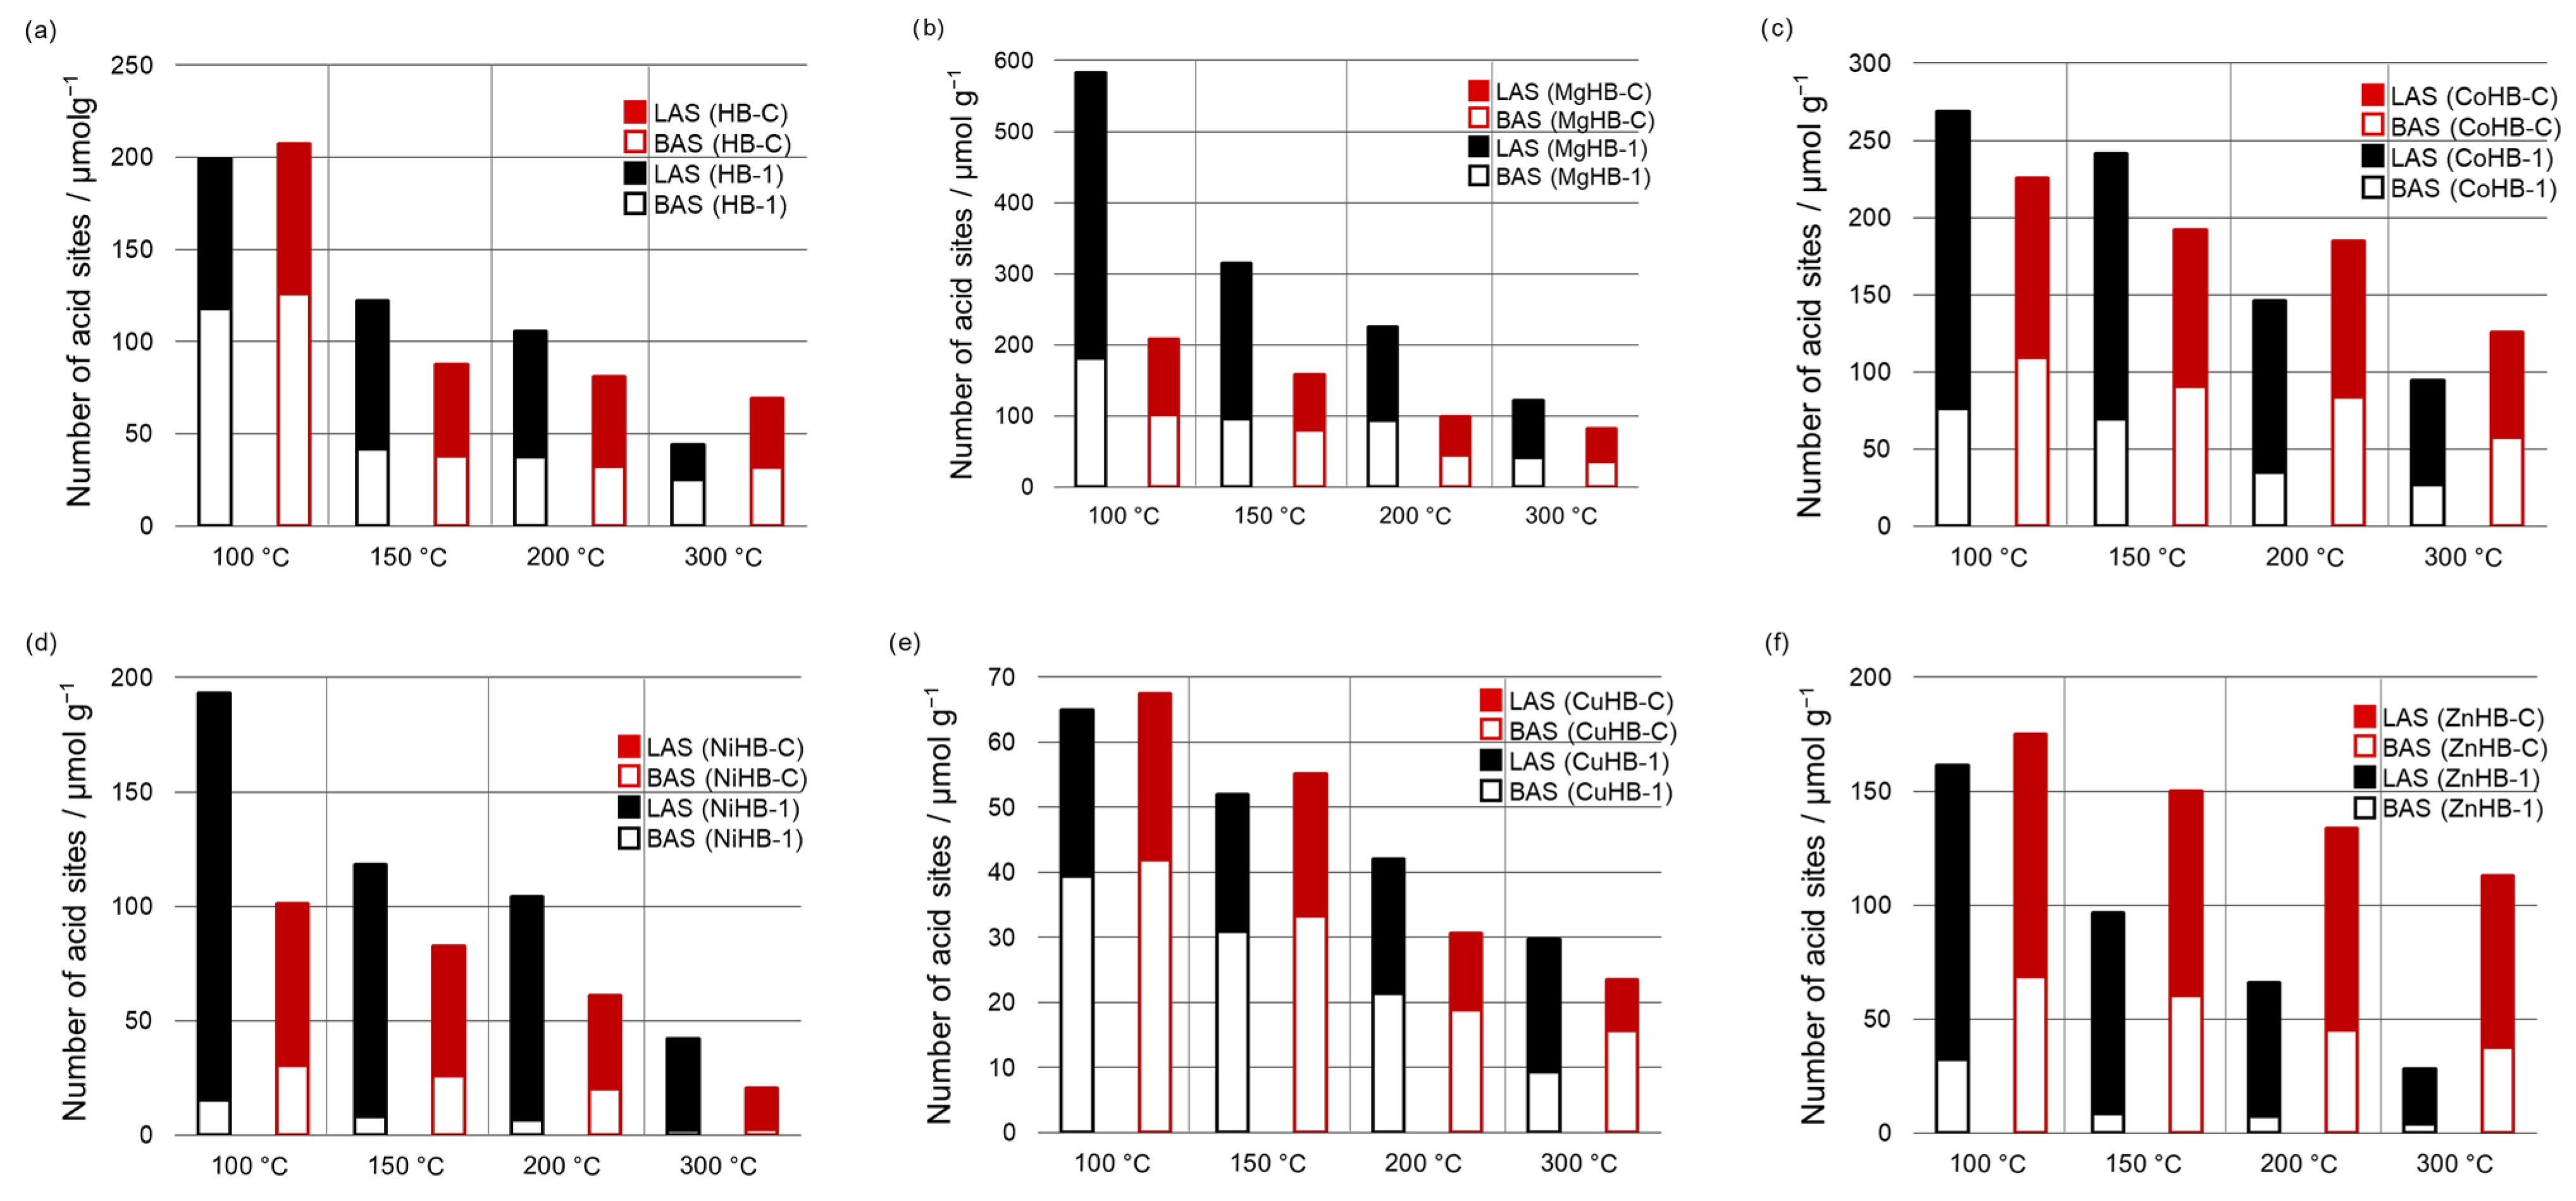
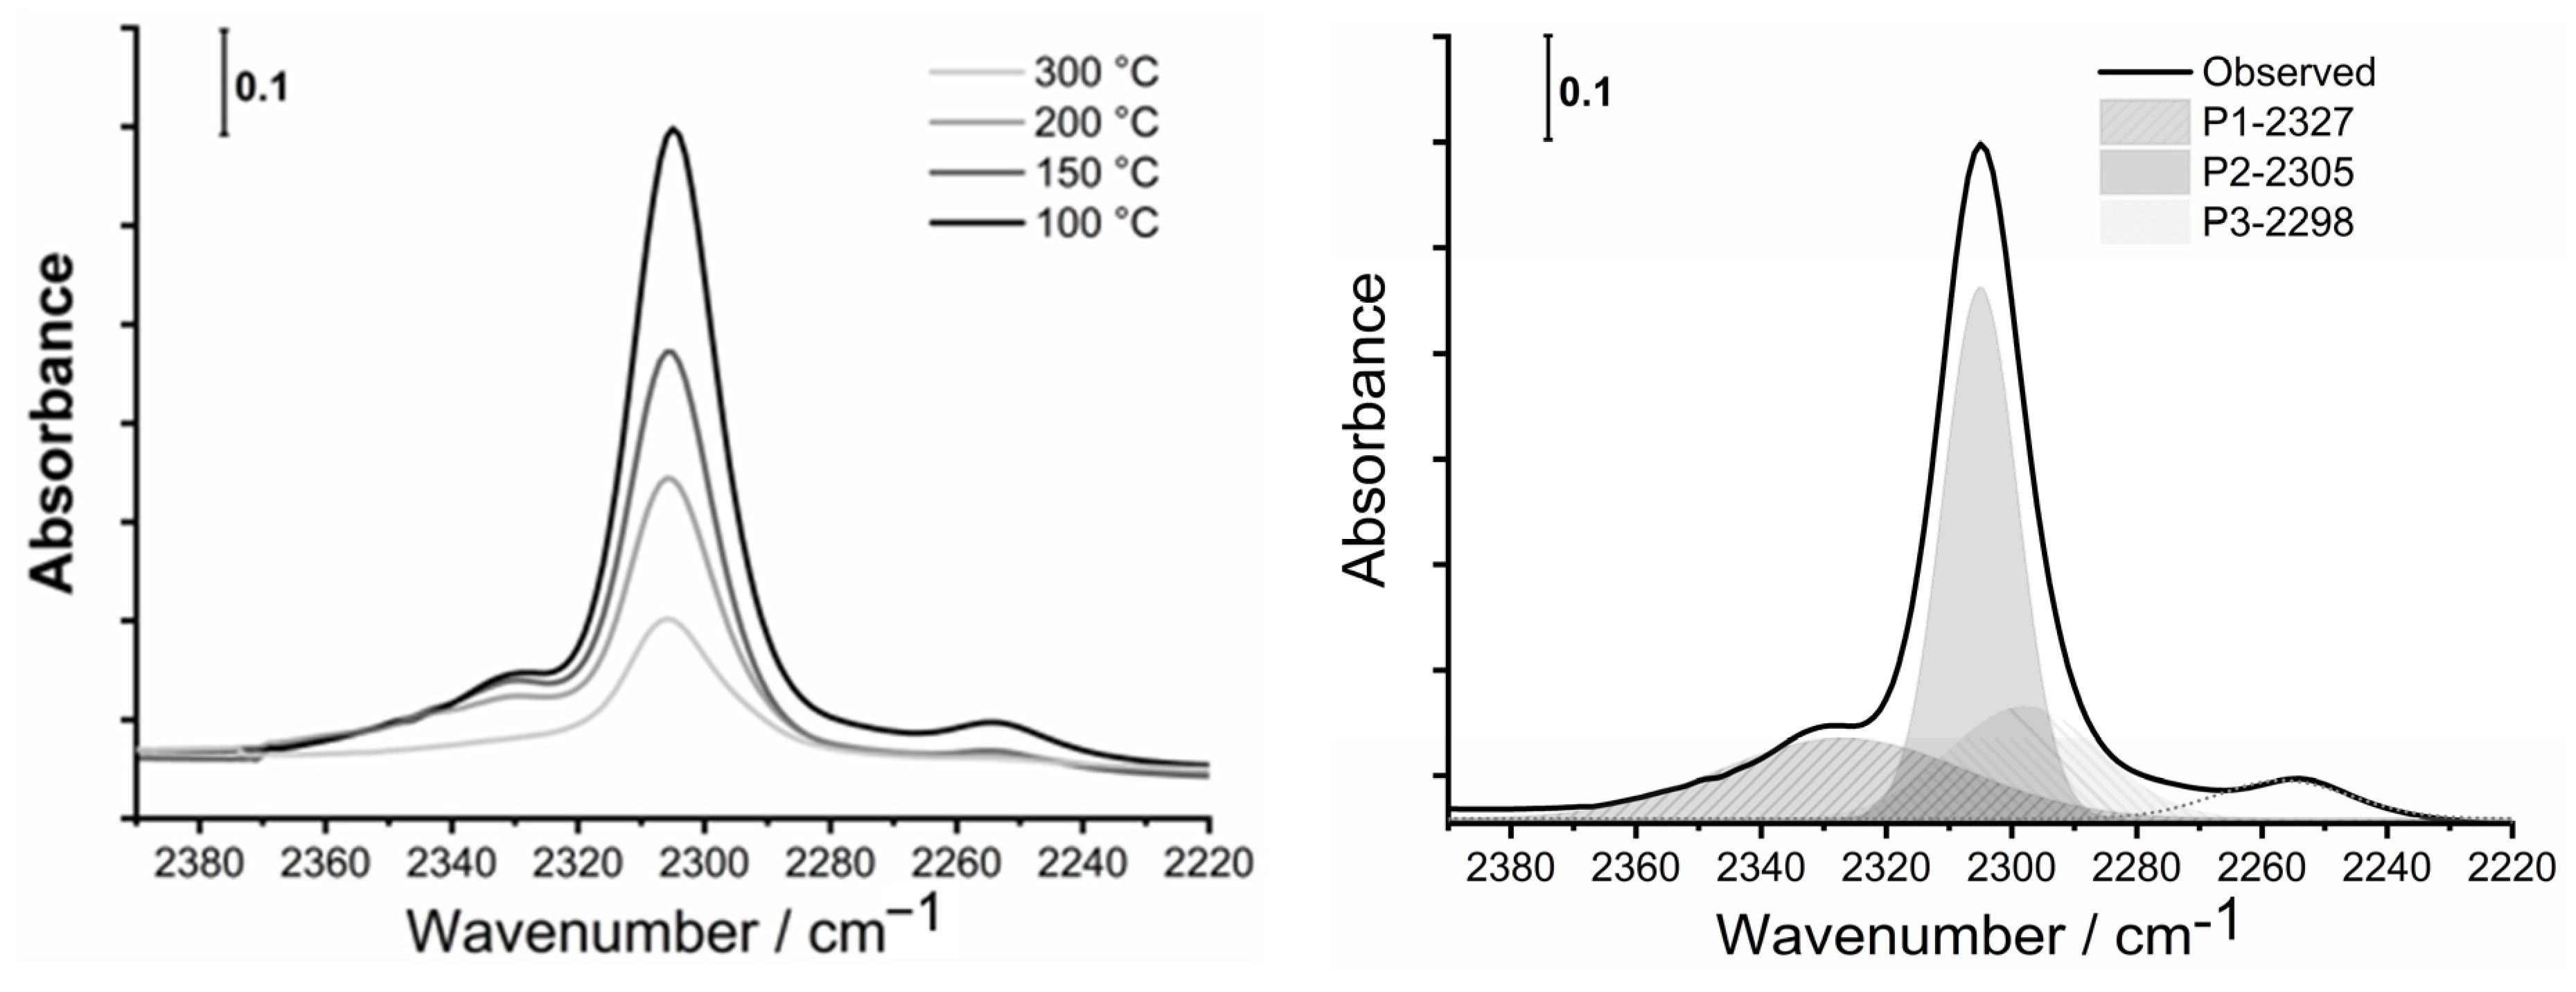
3.4. FTIR Spectroscopy

The FTIR spectra of activated HB-1 zeolite, shown in Figure 8 (top), exhibits strong bands at 3745 and 3735 cm−1, associated with isolated external and isolated internal Si-OH groups [41] and weak bands at 3667 cm−1 attributed to Al-OH groups of extra-framework aluminum (EFAL), at 3608 cm−1 related to bridging hydroxyls Si–O(H)–Al, and a band at 3550 cm−1 related to H-bonded Si-O(H)-Si groups [41,42,43]. The similar intensity of the bands at 3745 cm−1 and 3735 cm−1 for metal-impregnated samples in the HB-1 series, except for the sample impregnated with Mg2+ cations, which has a higher intensity, indicates that Mg2+ cations tend to generate more OH groups which directly bind to Mg.
In comparison to HB-1, the samples of HB-C have considerably weaker bands at 3745–3734 cm−1 and very weak bands at 3605 cm−1 and 3550 cm−1. Generally, the smaller size of nanocrystals (HB-1) and structural defects generated by etching (desilication) are responsible for the larger number of terminal OH groups (silanol nests).
To determine the nature, number, and strength of acid sites of parents and modified, divalent metal-containing samples, the desorption FTIR spectra of adsorbed CD3CN (deuterated acetonitrile), as a probe molecule, were recorded. First, the samples were activated under vacuum at 350 °C to eliminate all the water present in the materials. Then, deconvoluted spectra of CD3CN desorption at different temperatures (100 °C, 150 °C, 200 °C and 300 °C) were used for calculation of the number of specific acid sites (BAS and LAS) using Equation (1). An example of MgHB-1 sample spectra recorded at different temperatures of CD3CN desorption and its deconvolution is shown in Figure 9.
All samples have multiple bands of the adsorbed probe molecule (CD3CN) in the range of 2390 cm−1 to 2220 cm−1, covering the Lewis and Brønsted acid sites. At room temperature, the amount of adsorbed CD3CN varies greatly from sample to sample due to surface adsorption. The fundamental band of νs(CD3) and νas(CD3) of CD3CN in the liquid phase are at 2250 cm−1 and 2114 cm−1, respectively. The stretching mode of ν(C≡N) is a band at 2265 cm−1. Acetonitrile is a weak base and interacts with the acid sites via the lone electron pair of the C≡N group. While both modes of ν(CD3) are not significantly changed after the adsorption of acetonitrile on acid sites, the strength of binding of acetonitrile to acid sites is reflected in the shift of the stretching mode of ν(C≡N) to higher frequencies [44]. The characteristic bands of adsorbed acetonitrile were attributed to acid sites of different natures: two bands of Lewis acid sites (LAS) at 2330–2320 and at 2315–2305 cm−1 and a band of Brønsted acid sites (BAS) at 2297 cm−1, or at a slightly higher frequency (2300 cm−1) due to inserted metal cations. The low-intensity bands at 2280–2275 cm−1, 2265 cm−1, and 2255–2245 cm−1 are assumed to correspond to the acetonitrile C≡N group bonded to terminal Si-OH groups or defect sites, physisorbed acetonitrile, and to C-D vibrations, respectively, as assigned by Otero Areán et al. [45].
Since the parent samples do not have a band at 2315 cm−1, and the amount of BAS is larger than LAS (desorption of CD3CN at 100 °C, Figure 1), it is easy to conclude that M2+ cations inserted to crystals were responsible for the increased amount of LAS, which prevails. The exceptions are both systems with Cu2+ inserted (CuHB-1 and CuHB-C, Figure 10e), where the total amount of AS is lowest.
If we compare the amount of BAS of HB-1 and the metal-impregnated HB-1 series after desorption of the probe molecule at 100 °C, all samples except MgHB-1 have less BAS than the parent HB-1. NiHB-1 has by far the smallest amount of probe molecules adsorbed on BAS at 100 °C, and only 13% of them are strong enough to bind CD3CN after desorption at 300 °C; while the MgHB-1 sample has by far the largest amount of BAS and 22% of all Brønsted acid sites detected are still bound to zeolite at 300 °C, just as in the parent sample. In contrast to the Brønsted acid sites, all metal-impregnated samples have multiple bands of adsorbed probe molecules corresponding to Lewis acid sites (Figure 10). HB-1 has only one band, as mentioned above. The amount and strength of these sites differ drastically. All metal-impregnated HB-1 samples except the sample with copper, which has less BAS and LAS than the parent material, have at least 40% more LAS after desorption of D3-acetonitrile at 100 °C. Even the sample impregnated with Cu2+ has a very low amount of LAS, 80% of which is strong. For the samples exchanged with Co2+, Zn2+, and Ni2+, the number of adsorbed probe molecules at the Lewis acid sites barely differs at 150 °C and 200 °C, which is also observed for the parent samples HB-1. Finally, only the samples impregnated with Mg2+ and Co2+ have a higher total amount of acid sites than the parent material. Moreover, a large influence of the metal cation on the ratio of BAS/LAS in the sample NiHB-1 was observed.
For the HB-C series, it is obvious that all metal-impregnated samples have less BAS than the parent material. Like NiHB-1, the sample NiHB-C has by far the lowest amount of BAS. At 150 °C, only 50% of the probe molecules are still adsorbed, and after desorption at 300 °C, only 6% of them are still adsorbed.
Comparing the samples prepared by different procedures, some interesting peculiarities could be observed. For example, the HB-1 series, prepared by post-synthesis treatment with NaOH/TPAOH, have more acid sites except for the Zn2+ exchanged sample (Tables S1–S4). More acid sites in the HB-1 series are generated by desilication and consequentially its larger specific surface area and pore volumes. Also, there is more Al atoms in HB-1 than in the HB-C series (Table 1).
Although the HB-1 series has a relatively large total number of LAS, only the minor part (19 to 35%) of these sites are present after desorption of CD3CN at 300 °C, excluding the CuHB-1 sample. In contrast to HB-1, HB-C samples have a larger percentage (25 to 71%) of the strongest LAS.
When we compare the number and strength of BAS, parent and Cu2+ impregnated samples of HB-1 and HB-C are almost the same. However, the HB-C series has a greater number of the strongest BAS in Co2+, Cu2+, and Zn2+ impregnated samples, with MgHB-1 as an outlier.
In samples impregnated with Cu2+ ions, a drastic reduction of Brønsted and Lewis active sites was observed. In the FTIR spectra, a band appears at 2325 cm−1 as a consequence of the interaction between CD3CN and extra-framework aluminum. In the literature, it is explained that the classical ion-exchange procedure, i.e., starting from Cu2+ salt, can lead to divalent oxocations, e.g., [Cu–O–Cu]2+ which can be located only in the vicinity of a pair of nearby Al sites. Theoretically, Al pairs can be significantly present only in zeolites with a low Si/Al ratio, and calculations have shown their possible existence in ZSM-5, mordenite, and ferrierite, providing coordination sites for divalent metal oxocations [46]. For high Si/Al ratios, charge compensation must follow other ways, and can be achieved, e.g., by OH− groups, resulting in monovalent [Cu–OH]+ complexes.
The mechanism for the “self-reduction” of Cu2+ under vacuum or inert flow is thought to start from the dehydration of two [Cu–OH]+ ions located close to one framework Al [47]. There is a possibility that Cu+ in the samples is formed via autoreduction of [CuOH]+ during the vacuum pretreatment [22]. In the literature, the “blocking effect” of the active sites is explained by the formation of a strong complex between the Cu2+ cation and probe molecule (CD3CN) during its introduction into the zeolite framework [47].

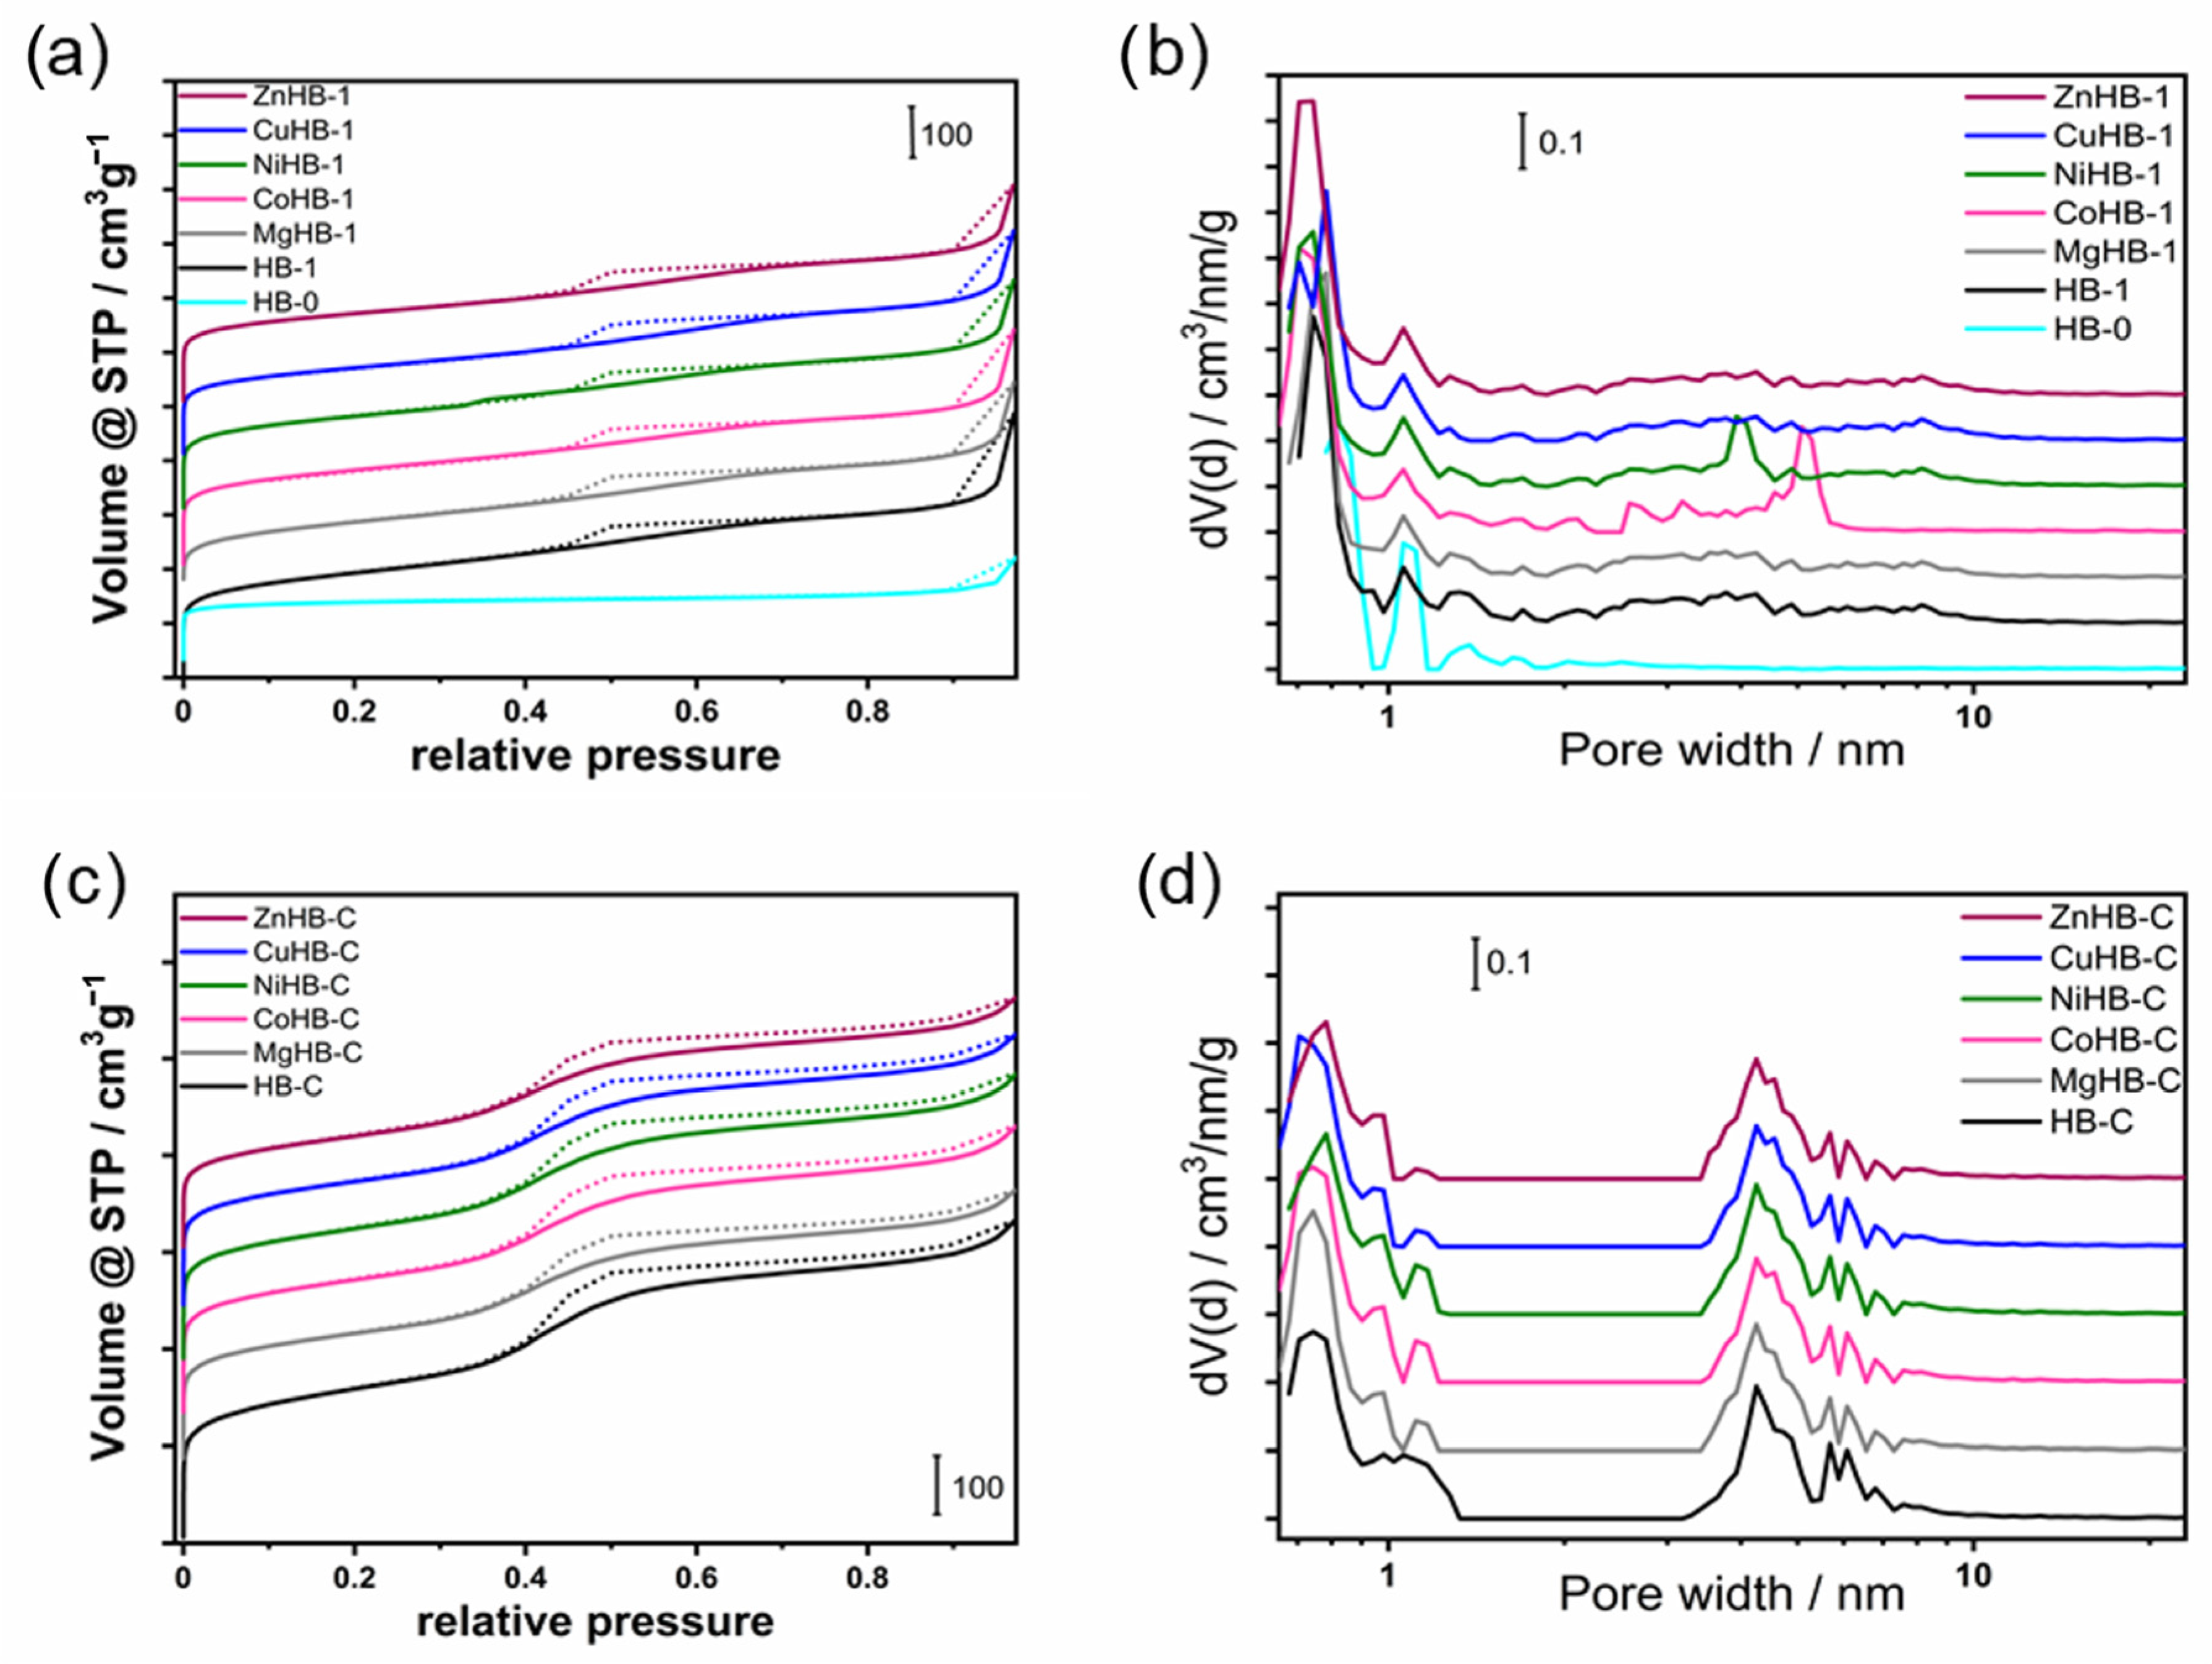
3.5. Textural Properties—Porosimetry (N2 Adsorption/Desorption)

The N2 adsorption–desorption isotherms used to estimate the textural properties of all samples studied are shown in Figure 11a,c, and the data are listed in Table 1. As can be seen in Figure 11, HB-0 shows a typical type I isotherm, reflecting its intrinsic microporous structure. Other samples obtained by etching (HB-1 series) or by using the surfactant CTAB (HB-C series) during synthesis show a composition of a type I and IV isotherm with a hysteresis loop.
These samples show gradual but continuous increasing curves after a steep increase due to the filling of the micropores in the low relative pressure region (p/p0 < 0.01). At a relative pressure of 0.4–0.98 p/p0, the desorption branch was significantly higher than the adsorption branch, along with the occurrence of capillary condensation, leading to the hysteresis loop. These analyses confirm a micro-meso hierarchical porous structural feature. The HB-1 series shows a hysteresis loop typical of a non-uniform pore size distribution (Figure 11b).
Pore size distributions were estimated using the NLDFT method on the adsorption branch of the isotherms using nitrogen on silica, sphere-cylindrical pore and show a pore size distribution where the mesopore diameters are in the range from 3 to 8 nm (Figure 11d).
The mesopores in the HB-1 series samples (Figure 11b) are widely dispersed in the range of 2–10 nm and can be attributed to inter-nanocrystals voids in the aggregates after etching (Figure 4).
The desilication of HB-0 results in an increase in the total specific surface area and substantial increase in the external surface area. The micropore volume decreases with the development of mesoporosity, with the mesopore volume almost five times higher than the microporous HB-0.
As expected, the subsequent introduction of divalent metal cations leads to a notable decrease in the total volume of both systems (HB-1 and HB-C). It is explained by the shadowing effect of inserted M2+ cations (column Vtotal in Table 1).
The mesopores in HB-C are well defined and open to the external surface of the crystals, which is important for improving the accessibility of the inner parts of the crystals.
It is evident that wet impregnation of HB-1 with divalent metal acetates leads to partial dealumination (an increase in the Si/Al ratio), which is not observed with the impregnation of HB-C. This is due to the presence of a certain amount of extra-framework aluminum at the surface of the etched sample which can be easily separated from the zeolite structure under acidic conditions [29].

4. Conclusions

Insertion of metal cations (Mg2+, Co2+, Ni2+, Cu2+, Zn2+) into hierarchical zeolite Beta crystals strongly influence the acidity of OH groups; increasing the amount of LAS and decreasing the amount of BAS in comparison to parent crystals. Generally, etched samples (HB-1) have more structural defects including “silanol nests”, and it seems that Mg2+ and Co2+ cations better fit to these defects and have more AS than the parent, confirming the findings of Medak et al. [33] in a study of zeolite FAU.
It is difficult to determine from these experiments what happens within the copper-containing samples. However, under conditions of the adsorption/desorption experiment of CD3CN in a vacuum, an irreversible formation of the new copper species occurs, as clearly observed in the DRS UV-Vis spectra. Considering that the amount of BAS and LAS significantly deviates from the trend followed by samples impregnated with other divalent cations, it is very likely that during heating in a vacuum and saturation with CD3CN vapor, there is an inactivation or blocking of access to the active sites which are not occupied by copper. This is likely because the metal center fills its coordination sphere with acetonitrile molecules, forming a stable complex, and the size of the Beta zeolite channels allows for the formation of such complexes.

Supplementary Materials

The following supporting information can be downloaded at: https://www.mdpi.com/article/10.3390/cryst14010053/s1, Tables S1–S4: number of acid sites calculated from deconvoluted spectra of desorption of CD3CN for HB-1 and HB-C series at 100, 150, 200 and 300 °C.

Author Contributions

Conceptualization, J.B.; methodology, I.L.; formal analysis, I.L., M.R. and A.P.; investigation, I.L.; resources, J.B.; writing—original draft preparation, I.L.; writing—review and editing, J.B. and A.P.; visualization, I.L.; supervision, J.B. All authors have read and agreed to the published version of the manuscript.

Funding

This research was funded by the Croatian Science Foundation through project IP-2016-06-2214.

Data Availability Statement

The data presented in this study are available in the article.

Conflicts of Interest

The authors declare no conflicts of interest. The funders had no role in the design of the study; in the collection, analyses, or interpretation of data; in the writing of the manuscript; or in the decision to publish the results.

References

  1. Wang, J.-J.; Chuang, Y.-Y.; Hsu, H.-Y.; Tsai, T.-C. Toward industrial catalysis of zeolite for linear alkylbenzene synthesis: A mini review. Catal. Today 2017, 298, 109–116. [Google Scholar] [CrossRef]
  2. Armor, J.N. A history of industrial catalysis. Catal. Today 2011, 163, 3–9. [Google Scholar] [CrossRef]
  3. Abate, S.; Barbera, K.; Centi, G.; Lanzafame, P.; Perathoner, S. Disruptive catalysis by zeolites. Catal. Sci. Technol. 2016, 6, 2485–2501. [Google Scholar] [CrossRef]
  4. Hong, L.; Zang, J.; Li, B.; Liu, G.; Wang, Y.; Wu, L. Research Progress on the Synthesis of Nanosized and Hierarchical Beta Zeolites. Inorganics 2023, 11, 214. [Google Scholar] [CrossRef]
  5. Valtchev, V.; Tosheva, L. Porous Nanosized Particles: Preparation, Properties, and Applications. Chem. Rev. 2013, 113, 6734–6760. [Google Scholar] [CrossRef] [PubMed]
  6. Yang, L.; Wang, C.; Zhang, L.; Dai, W.; Chu, Y.; Xu, J.; Wu, G.; Gao, M.; Liu, W.; Xu, Z.; et al. Stabilizing the framework of SAPO-34 zeolite toward long-term methanol-to-olefins conversion. Nat. Commun. 2021, 12, 4661. [Google Scholar] [CrossRef]
  7. Dalena, F.; Puškarić, A.; Landripet, I.; Jelić, T.A.; Bosnar, S.; Medak, G.; Marino, A.; Giordano, G.; Bronić, J.; Migliori, M. Combining hierarchization and Mg2+ ions insertion in ZSM-5: Acidity-modulation effect on MTO reaction. Mol. Catal. 2023, 545, 113181. [Google Scholar] [CrossRef]
  8. Bordiga, S.; Lamberti, C.; Bonino, F.; Travert, A.; Thibault-Starzyk, F. Probing zeolites by vibrational spectroscopies. Chem. Soc. Rev. 2015, 44, 7262–7341. [Google Scholar] [CrossRef]
  9. Hegde, S.; Abdullah, R.; Bhat; Ratnasamy, P. FTi.r. spectroscopic study of gallium beta. Zeolites 1992, 15, 951–956. [Google Scholar] [CrossRef]
  10. Kefirov, R.; Penkova, A.; Hadjiivanov, K.; Dzwigaj, S.; Che, M. Stabilization of Cu+ ions in BEA zeolite: Study by FTIR spectroscopy of adsorbed CO and TPR. Microporous Mesoporous Mater. 2008, 116, 180–187. [Google Scholar] [CrossRef]
  11. Anquetil, R.; Saussey, J.; Lavalley, J.-C. Confinement effect on the interaction of hydroxy groups contained in the side pockets of H-mordenite with nitriles; a FT-IR study. Phys. Chem. Chem. Phys. 1999, 1, 555–560. [Google Scholar] [CrossRef]
  12. Pelmenschikov, A.G.; van Santen, R.A.; Janchen, J.; Meijer, E. Acetonitrile-d3 as a probe of Lewis and Broensted acidity of zeolites. J. Phys. Chem. 1993, 97, 11071–11074. [Google Scholar] [CrossRef]
  13. Kotrel, S.; Lunsford, J.H.; Knözinger, H. Characterizing Zeolite Acidity by Spectroscopic and Catalytic Means: A Comparison. J. Phys. Chem. B 2001, 105, 3917–3921. [Google Scholar] [CrossRef]
  14. Góra-Marek, K.; Datka, J.; Dzwigaj, S.; Che, M. Influence of V Content on the Nature and Strength of Acidic Sites in VSiβ Zeolite Evidenced by IR Spectroscopy. J. Phys. Chem. B 2006, 110, 6763–6767. [Google Scholar] [CrossRef] [PubMed]
  15. Bisio, C.; Massiani, P.; Fajerwerg, K.; Sordelli, L.; Stievano, L.; Silva, E.; Coluccia, S.; Martra, G. Identification of cationic and oxidic caesium species in basic Cs-overloaded BEA zeolites. Microporous Mesoporous Mater. 2006, 90, 175–187. [Google Scholar] [CrossRef]
  16. Zhang, W.; Ming, W.; Hu, S.; Qin, B.; Ma, J.; Li, R. A Feasible One-Step Synthesis of Hierarchical Zeolite Beta with Uniform Nanocrystals via CTAB. Materials 2018, 12, 651. [Google Scholar] [CrossRef]
  17. Verboekend, D.; Pérez-Ramírez, J. Design of hierarchical zeolite catalysts by desilication. Catal. Sci. Technol. 2011, 1, 879–890. [Google Scholar] [CrossRef]
  18. De Baerdemaeker, T.; Yilmaz, B.; Müller, U.; Feyen, M.; Xiao, F.-S.; Zhang, W.; Tatsumi, T.; Gies, H.; Bao, X.; De Vos, D. Catalytic applications of OSDA-free Beta zeolite. J. Catal. 2013, 308, 73–81. [Google Scholar] [CrossRef]
  19. Chaida-Chenni, F.Z.; Belhadj, F.; Casas, M.S.G.; Márquez-Álvarez, C.; Hamacha, R.; Bengueddach, A.; Pérez-Pariente, J. Synthesis of mesoporous-zeolite materials using Beta zeolite nanoparticles as precursors and their catalytic performance in m-xylene isomerization and disproportionation. Appl. Catal. A Gen. 2018, 568, 148–156. [Google Scholar] [CrossRef]
  20. Wang, Y.; Yokoi, T.; Namba, S.; Tatsumi, T. Effects of Dealumination and Desilication of Beta Zeolite on Catalytic Performance in n-Hexane Cracking. Catalysts 2016, 6, 8. [Google Scholar] [CrossRef]
  21. Hao, W.; Zhang, W.; Guo, Z.; Ma, J.; Li, R. Mesoporous Beta Zeolite Catalysts for Benzylation of Naphthalene: Effect of Pore Structure and Acidity. Catalysts 2018, 8, 504. [Google Scholar] [CrossRef]
  22. Miao, S.; Sun, S.; Lei, Z.; Sun, Y.; Zhao, C.; Zhan, J.; Zhang, W.; Jia, M. Micron-Sized Hierarchical Beta Zeolites Templated by Mesoscale Cationic Polymers as Robust Catalysts for Acylation of Anisole with Acetic Anhydride. Catalysts 2023, 13, 1517. [Google Scholar] [CrossRef]
  23. Zhao, R.; Zhao, Z.; Li, S.; Parvulescu, A.; Müller, U.; Zhang, W. Excellent Performances of Dealuminated H-Beta Zeolites from Organotemplate-Free Synthesis in Conversion of Biomass-derived 2,5-Dimethylfuran to Renewable p-Xylene. ChemSusChem 2018, 11, 3803–3811. [Google Scholar] [CrossRef] [PubMed]
  24. Rutkowska, M.; Piwowarska, Z.; Micek, E.; Chmielarz, L. Hierarchical Fe-, Cu-and Co-Beta zeolites obtained by mesotemplate-free method. Part I: Synthesis and catalytic activity in N2O decomposition. Microporous Mesoporous Mater. 2015, 209, 54–65. [Google Scholar] [CrossRef]
  25. Xu, L.; Shi, C.; Zhang, Z.; Gies, H.; Xiao, F.-S.; De Vos, D.; Yokoi, T.; Bao, X.; Feyen, M.; Maurer, S.; et al. Enhancement of low-temperature activity over Cu-exchanged zeolite beta from organotemplate-free synthesis for the selective catalytic reduction of NOx with NH3 in exhaust gas streams. Microporous Mesoporous Mater. 2014, 200, 304–310. [Google Scholar] [CrossRef]
  26. Cruz-Cabeza, A.J.; Esquivel, D.; Jiménez-Sanchidrián, C.; Romero-Salguero, F.J. Metal-Exchanged β Zeolites as Catalysts for the Conversion of Acetone to Hydrocarbons. Materials 2012, 5, 121–134. [Google Scholar] [CrossRef] [PubMed]
  27. Esquivel, D.; Cruz-Cabeza, A.J.; Jiménez-Sanchidrián, C.; Romero-Salguero, F.J. Transition metal exchanged β zeolites: Characterization of the metal state and catalytic application in the methanol conversion to hydrocarbons. Microporous Mesoporous Mater. 2013, 179, 30–39. [Google Scholar] [CrossRef]
  28. Atoguchi, T.; Kanougi, T. Phenol oxidation over alkaline earth metal ion exchange beta zeolite in the presence of ketone. J. Mol. Catal. A Chem. 2004, 222, 253–257. [Google Scholar] [CrossRef]
  29. Essid, S.; Ayari, F.; Bulánek, R.; Vaculík, J.; Mhamdi, M.; Delahay, G.; Ghorbel, A. Improvement of the conventional preparation methods in Co/BEA zeolites: Characterization and ethane ammoxidation. Solid State Sci. 2019, 93, 13–23. [Google Scholar] [CrossRef]
  30. Mintova, S.; Valtchev, V.; Onfroy, T.; Marichal, C.; Knözinger, H.; Bein, T. Variation of the Si/Al ratio in nanosized zeolite Beta crystals. Microporous Mesoporous Mater. 2006, 90, 237–245. [Google Scholar] [CrossRef]
  31. Wichterlová, B.; Tvarůžková, Z.; Sobalík, Z.; Sarv, P. Determination and properties of acid sites in H-ferrierite: A comparison of ferrierite and MFI structures. Microporous Mesoporous Mater. 1998, 24, 223–233. [Google Scholar] [CrossRef]
  32. Sadek, R.; Chalupka-Spiewak, K.; Krafft, J.-M.; Millot, Y.; Valentin, L.; Casale, S.; Gurgul, J.; Dzwigaj, S. The Synthesis of Different Series of Cobalt BEA Zeolite Catalysts by Post-Synthesis Methods and Their Characterization. Catalysts 2022, 12, 1644. [Google Scholar] [CrossRef]
  33. Medak, G.; Puškarić, A.; Bronić, J. The Influence of Inserted Metal Ions on Acid Strength of OH Groups in Faujasite. Crystals 2023, 13, 332. [Google Scholar] [CrossRef]
  34. Sobuś, N.; Michorczyk, B.; Piotrowski, M.; Kuterasiński, Ł.; Chlebda, D.K.; Łojewska, J.; Jędrzejczyk, R.J.; Jodłowski, P.; Kuśtrowski, P.; Czekaj, I. Design of Co, Cu and Fe–BEA Zeolite Catalysts for Selective Conversion of Lactic Acid into Acrylic Acid. Catal. Lett. 2019, 149, 3349–3360. [Google Scholar] [CrossRef]
  35. Śrębowata, A.; Baran, R.; Łomot, D.; Lisovytskiy, D.; Onfroy, T.; Dzwigaj, S. Remarkable effect of postsynthesis preparation procedures on catalytic properties of Ni-loaded BEA zeolites in hydrodechlorination of 1,2-dichloroethane. Appl. Catal. B Environ. 2014, 147, 208–220. [Google Scholar] [CrossRef]
  36. Baran, R.; Averseng, F.; Wierzbicki, D.; Chalupka, K.; Krafft, J.-M.; Grzybek, T.; Dzwigaj, S. Effect of postsynthesis preparation procedure on the state of copper in CuBEA zeolites and its catalytic properties in SCR of NO with NH3. Appl. Catal. A Gen. 2016, 523, 332–342. [Google Scholar] [CrossRef]
  37. Wang, H.; Xu, R.; Jin, Y.; Zhang, R. Zeolite structure effects on Cu active center, SCR performance and stability of Cu-zeolite catalysts. Catal. Today 2019, 327, 295–307. [Google Scholar] [CrossRef]
  38. Rutkowska, M.; Díaz, U.; Palomares, A.E.; Chmielarz, L. Cu and Fe modified derivatives of 2D MWW-type zeolites (MCM-22, ITQ-2 and MCM-36) as new catalysts for DeNOx process. Appl. Catal. B Environ. 2015, 168–169, 531–539. [Google Scholar] [CrossRef]
  39. Groothaert, M.H.; Smeets, P.J.; Sels, B.F.; Jacobs, P.A.; Schoonheydt, R.A. Selective Oxidation of Methane by the Bis(μ-oxo)dicopper Core Stabilized on ZSM-5 and Mordenite Zeolites. J. Am. Chem. Soc. 2005, 127, 1394–1395. [Google Scholar] [CrossRef]
  40. Smeets, P.J.; Groothaert, M.H.; Schoonheydt, R.A. Cu based zeolites: A UV–vis study of the active site in the selective methane oxidation at low temperatures. Catal. Today 2005, 110, 303–309. [Google Scholar] [CrossRef]
  41. Dzwigaj, S.; Massiani, P.; Davidson, A.; Che, M. Role of silanol groups in the incorporation of V in β zeolite. J. Mol. Catal. A Chem. 2000, 155, 169–182. [Google Scholar] [CrossRef]
  42. Maache, M.; Janin, A.; Lavalley, J.; Joly, J.; Benazzi, E. Acidity of zeolites Beta dealuminated by acid leaching: An FTi.r. study using different probe molecules (pyridine, carbon monoxide). Zeolites 1993, 13, 419–426. [Google Scholar] [CrossRef]
  43. Janin, A.; Maache, M.; Raatz, F.; Lavalley, J.C.; Joly, J.F.; Szydlowski, N. FTIR study of the silanol groups in dealuminated HY zeolites: Nature of the extraframework debris. Zeolites 1991, 11, 391–396. [Google Scholar] [CrossRef]
  44. Chen, J.; Thomas, J.M.; Sankar, G. IR spectroscopic study of CD3CN adsorbed on ALPO-18 molecular sieve and the solid acid catalysts SAPO-18 and MeAPO-18. J. Chem. Soc. Faraday Trans. 1994, 90, 3455–3459. [Google Scholar] [CrossRef]
  45. Areán, C.O.; Platero, E.E.; Mentruit, M.P.; Delgado, M.R.; i Xamena, F.L.; García-Raso, A.; Morterra, C. The combined use of acetonitrile and adamantane–carbonitrile as IR spectroscopic probes to discriminate between external and internal surfaces of medium pore zeolites. Microporous Mesoporous Mater. 2000, 34, 55–60. [Google Scholar] [CrossRef]
  46. Giordanino, F.; Vennestrøm, P.N.R.; Lundegaard, L.F.; Stappen, F.N.; Mossin, S.; Beato, P.; Bordiga, S.; Lamberti, C. Characterization of Cu-exchanged SSZ-13: A comparative FTIR, UV-Vis, and EPR study with Cu-ZSM-5 and Cu-β with similar Si/Al and Cu/Al ratios. Dalton Trans. 2013, 42, 12741–12761. [Google Scholar] [CrossRef]
  47. Deka, U.; Lezcano-Gonzalez, I.; Weckhuysen, B.M.; Beale, A.M. Local Environment and Nature of Cu Active Sites in Zeolite-Based Catalysts for the Selective Catalytic Reduction of NOx. ACS Catal. 2013, 3, 413–427. [Google Scholar] [CrossRef]
Figure 1. PXRD patterns of HB-0 (H-form of untreated parent zeolite) and HB-1 (desilicated zeolite) series (left) and HB-C (zeolite synthesized using CTAB) series (right).
Crystals 14 00053 g001
Figure 2. Low-angle diffraction patterns of samples synthesized with CTAB (parent HB-C) and modified by wet impregnation with cations (Mg2+, Co2+, Ni2+, Cu2+, and Zn2+).
Crystals 14 00053 g002
Figure 3. Photos of zeolite Beta nanocrystals modified by wet impregnation with cations (Mg2+, Co2+, Ni2+, Cu2+, and Zn2+) at magnification of 50,000×.
Crystals 14 00053 g003
Figure 4. Photos of zeolite Beta nanocrystals modified by wet impregnation: irregular aggregates of CoHB-1, and NiHB-1 at large magnification of 100,000×.
Crystals 14 00053 g004
Figure 5. Photos of zeolite Beta crystals synthesized with addition of CTAB; parent (HB-C) and samples modified by wet impregnation with the following metal-acetate salts: MgHB-C, CoHB-C, NiHB-c, CuHB-C and ZnHB-C; at magnification of 33,000×.
Crystals 14 00053 g005
Figure 6. High magnification photos of zeolite Beta synthesized with addition of CTAB nanocrystals (a) and modified by Cu(II) (b) and Co(II) acetates (c,d).
Crystals 14 00053 g006
Figure 7. DRS UV-Vis spectra of metal-containing samples (ae) and PXRD patterns of CuHB-1 sample before and after FTIR experiment (after desorption of CD3CN at 300 °C) (f).
Crystals 14 00053 g007
Figure 8. FTIR spectra of OH groups in the region from 4000 cm−1 to 3200 cm−1 of the samples after activation in a vacuum at 350 °C for 3 h of parents (top) and modified by wet impregnation with a solution of M(II) acetates: nanocrystals HB-1 series (left) and mesoporous crystals HB-C series (right).
Crystals 14 00053 g008
Figure 9. FTIR spectra of adsorbed CD3CN in the region from 2390 cm−1 to 2220 cm−1 of nanocrystals impregnated with Mg2+ (MgHB-1) at different temperatures (left) and deconvolution of spectra recorded at 100 °C (right).
Crystals 14 00053 g009
Figure 10. Relative content of specific acid sites (BAS and LAS) calculated from deconvoluted spectra of desorption of CD3CN at different temperatures (100 °C, 150 °C, 200 °C, and 300 °C) for HB-1 and HB-C series (af).
Crystals 14 00053 g010
Figure 11. N2 adsorption/desorption isotherms at −196 °C of the (a) nanocrystals (HB-1 series) and (c) microcrystals (HB-C series). The corresponding NLDFT pore size distribution of (b) HB-1 series (including HB-0) and (d) HB-C series.
Crystals 14 00053 g011
Table 1. Surface characteristics of samples determined using the N2 adsorption–desorption method, and element ratios (Si/Al, M/Al) in the samples determined using AAS.
SAMPLESBET (m2g−1)Vtotal a
(cm3g−1)
Vmicro b
(cm3g−1)
Smicro b
(m2g−1)
Sext b
(m2g−1)
Vmeso c
(cm3g−1)
Si/Al dM/Al d
HB-05480.2710.183478710.08825.4/
HB-16740.5270.1182783970.40913.9/
MgHB-16450.4910.1212863580.37020.80.54
CoHB-16580.5250.1232933650.40220.60.58
NiHB-16200.5180.1192493700.39920.90.51
CuHB-16180.5030.1152753430.38821.20.95
ZnHB-16210.4890.1222913300.36720.20.60
HB-C5580.4860.0842023690.40231.3/
MgHB-C4710.4070.0551313400.35231.60.50
CoHB-C5090.4370.0771853240.36031.50.59
NiHB-C5190.4430.0841993200.35931.90.50
CuHB-C4780.4150.0731733050.34232.01.00
ZnHB-C4290.3820.0501193090.33229.60.58
a total volume at p/p0 = 0.95; b calculated using t-plot method; c Vmeso = Vtotal − Vmicro; d molar quantity of elements determined by flame atomic absorption spectroscopy.
Disclaimer/Publisher’s Note: The statements, opinions and data contained in all publications are solely those of the individual author(s) and contributor(s) and not of MDPI and/or the editor(s). MDPI and/or the editor(s) disclaim responsibility for any injury to people or property resulting from any ideas, methods, instructions or products referred to in the content.

