Abstract
Polymorphism is a prevalent occurrence in pharmaceutical solids and demands thorough investigation during product development. This paper delves into the crystal growth and structure of a newly synthesized polymorph (TPT)2[CoII(NCS)4], (1), where TPT is triphenyl tetrazolium. The study combines experimental and theoretical approaches to elucidate the 3D framework of the crystal structure, characterized by hydrogen-bonded interactions between (TPT)+ cations and [Co(NCS)4]2− anions. Hirshfeld surface analysis, along with associated two-dimensional fingerprints, is employed to comprehensively investigate and quantify intermolecular interactions within the structure. The enrichment ratio is calculated for non-covalent contacts, providing insight into their propensity to influence crystal packing interactions. Void analysis is conducted to predict the mechanical behavior of the compound. Utilizing Bravais-Friedel, Donnay-Harker (BFDH), and growth morphology (GM) techniques, the external morphology of (TPT)2[CoII(NCS)4] is predicted. Experimental observations align well with BFDH predictions, with slight deviations from the GM model. Quantum computational calculations of the synthesized compounds is performed in the ground state using the DFT/UB3LYP level of theory. These calculations assess the molecule’s stability and chemical reactivity, including the computation of the HOMO-LUMO energy difference and other chemical descriptors. The study provides a comprehensive exploration of the newly synthesized polymorph, shedding light on its crystal structure, intermolecular interactions, mechanical behavior, and external morphology, supported by both experimental and computational analyses.
1. Introduction
The chemistry of cobalt complexes is gaining interest in several inorganic chemistry groups due to the distinct reactivity of the produced complexes and the variety of ligands that influence the characteristics of such complexes [1]. The Co(II) cations having a d9 configuration are found in most organometallic compounds in square planar, square-pyramidal, or square-bipyramidal geometries [2]. Thiocyanate (SCN)− is an ambidentate ligand that has been significant in the generation of bonding models for the mechanisms that influence linkage isomerism in transition metal complexes, resulting in a variety of structures of varying dimensions [3,4]. Increasing the diversity of the paramagnetic metal centers used can lead to more exciting magnetic and optic properties [5]. Thiocyanate coordination modes have been the subject of numerous studies. Thiocyanates’ linkage isomerism preferences as terminal or bridging modes were investigated across a range of experimental conditions. Notable experimental factors include electronic and steric effects, central metal type, solvent type, organic molecule type, and position of substituents in N donor ligands [6,7].
Tetrazole derivatives are commonly employed as color markers for detecting enzyme systems that produce reduction equivalents. They are incredibly important tools in academic and clinical research, as well as for numerous diagnostic applications, because of this property [8]. Aromatic derivatives of 1,2,3,4-tetrazole (substitution at positions 2, 3, and 5) are the most commonly utilized tetrazole derivatives in biochemistry and cell biology. The 2,3,5-triphenyl-2H-tetrazolium salt has garnered a lot of attention so far [9]. It is a heterocyclic compound composed of four nitrogen atoms, one of which is positively charged, and a five-member ring. The use of triphenyl tetrazolium salt for element and ion extraction, spectrophotometric, and potentiometric determination has been reported [5,10]. Triphenyl tetrazolium salt was recently used as an ion-pair reagent for the detection of different analytes as PVC membrane sensors [11,12,13]. It could also be employed in salt synthesis experiments where the size of the cationic group is connected to the kind and structure of the matching anionic units.
The work presents the synthesis, characterization, and determination of the single-crystal structure and DFT calculations of the tetraphenyltetrazolium thiocyanate cobalt (II) complex. The molecular structure was stabilized by hydrogen bonds and non-covalent interactions studied by Hirshfeld surface analysis. The characterization of this complex was performed using differential spectroscopic techniques such as UV spectrometry, infrared, mass spectrometry, elemental analysis, and NMR. Additionally, DFT calculations for the compound was carried out.
2. Experimental
2.1. General
A Gallenkamp melting point instrument was used to calculate the melting point. A Perkin-Elmer FTIR spectrometer was used to record the IR spectra. The experiments involved the utilization of Bruker 500 and 700 MHz instruments to acquire 1H NMR and 13C NMR spectra in DMSOd6. TMS was employed as an internal standard, and the chemical shifts were reported in δ-ppm. The complex spectrum was scanned using a Shimadzu double-beam spectrophotometer (1800 UV) with a quartz cell. Perkin Elmer’s 2400 series II, CHNS/O elemental analysis was used for the elemental analysis.
2.2. Synthesis
Twenty-five milliliters of 1 mmol (0.291 mg) of cobalt (II) nitrate hexahydrate in methanol was added to fifty milliliters of potassium thiocyanate of 1 mmol (0.0972 g), then the cobalt thiocyanate complex was formed [Co(SCN)4]−2. Twenty-five milliliters of triphenyl tetrazolium chloride solution in methanol 1 mmol (0.3348 g) was added to the previously formed cobalt thiocyanate complex. A blue precipitate was produced, thereafter separated by filtration, and finally washed with methanol. The resulting precipitate was subjected to vacuum drying in order to obtain the desired ion-pair complex. The titled compound (74% yield, m.p.225 °C) was obtained by recrystallization in acetonitrile. The formed ion-pair complex was confirmed by different spectroscopic and instrumentation analyses. IR (KBr cm−1): 2000.85 cm−1 for CN and 1H-NMR (DMSO-d6) δ: 7.63–8.26 ppm (all Ar H of triphenyl rings). 13C-NMR (DMSO-d6) δ: 123.23, 126.73, 127.66, 130.63, 130.83, 133.28, 134.05, 134.55, 164.45.
2.3. Single Crystal X-ray Diffraction Measurement
We measured single-crystal X-ray diffraction at 293 K using a STOE IPDS 2 diffractometer with a sealed X-ray tube and a graphite monochromator. Cell refinement and data reduction were completed by APX3 [14]. The structure was solved and refined using the ShelXT and ShelXL programs, respectively [15], using Olex2 software [16]. Non-hydrogen atoms were refined with anisotropic displacement parameters. Geometrically, hydrogen atoms were positioned (C-H = 0.93 Å) and refined using a riding model, with Uiso(H) = 1.2 Ueq(C). The crystal structure was visualized using the Mercury software 4.0 [17]. The crystallographic data have been stored in the Cambridge Crystallographic Data Centre (CCDC) as CCDC-2259943. A summary of crystallographic and structure refinement data is given in Table 1.

Table 1.
Crystal data and structure refinement parameters for (1).
2.4. Hirshfeld Surface Analysis and Enrichment Ratio Calculations
Hirshfeld surface analysis (HS) and generation of 2D fingerprint plots [18,19] were calculated using the CrystalExplorer 17.5 software [20] as a highly useful tool for evaluating and illustrating all non-covalent interactions in multi-component crystal structures. For quantifying and decoding the intercontacts in the crystal packing, the normalized contact distance dnorm [20] based on Bondi’s van der Waals radii [21] and 2D fingerprint plots were employed. The Hirshfeld surface is defined by the distances de and di, which represent the distance from the surface to the nearest atoms outside and inside, respectively. The normalized contact distance, dnorm, is calculated based on these distances. The deep red color corresponds to the interactions that are shorter than the sum of van der Waals radii, as shown by negative dnorm values. Other intermolecular distances near van der Waals interactions with dnorm = 0 appear as light-red circles. On the other hand, contacts with positive dnorm values that are longer than the total van der Waals radii are colored blue.
The enrichment ratio EXY for an element pair (X, Y) is defined as the ratio of the actual percentage of random contacts in the crystal (CXY) to the percentage of theoretically equivalently distributed random contacts (RXY) (EXY = CXY/RXY) [22]. If the enrichment ratio of two elements is greater than 1, they are more likely to make contacts in the crystal, whereas contacts with EXY values less than 1 are less likely to create contacts.
2.5. Growth Morphology Prediction
There are good relationships between an investigational pharmaceutical compound’s crystal structure, crystal morphology, and physicochemical characteristics [23,24]. The theoretical crystal morphology of (1) was simulated using Materials Studio 7.0 [25] utilizing the Bravais-Friedel-Donnay-Harker (BFDH) model and growth morphology (GM) models. The BFDH approach is capable of independently predicting the relative growth rates of faces, without considering factors such as atoms, partial charges, bond types, or interatomic forces. Nevertheless, this approach remains the most straightforward and expedient technique for identifying potential crystal development facets and providing an approximate initial assessment of a crystal’s structure. The determination relies solely on the lattice parameters and the crystal’s symmetry. This is done based on the fact that the facets with the largest interplanar spacing (dhkl) are likely to be morphologically important (MI) [26].
The concept of attachment energy, denoted as Ehklatt, refers to the energy that is released when a building unit, also known as a growth slice, is added to the surface of a growing crystal. The variable in question holds considerable importance in comprehending the characteristics of chemical bonding inside solid materials. In this technique, it is assumed the attachment energy Ehkl is directly proportional to the growth rate Rhkl of a specific crystal face (hkl). The AE method additionally posits the Miller index MIhkl exhibits an inverse relationship with the face’s Ehklatt. Consequently, this particular approach posits facial features exhibiting the lowest Ehklatt values are associated with the highest MIhkl values and exhibit the slowest growth rates, as represented by the subsequent equations:
Rhkl ~ |Ehklatt|
MIhkl ~ 1/|Ehklatt|
2.6. DFT Calculations
2.6.1. Computational Details
In this study, we conducted comprehensive calculations of geometric and electronic properties for the [(TPT)2[Co(NCS)4] crystal using the Gaussian 16 program [27]. Our computational methodology of geometry optimization, frequency calculations, and electronic properties was initiated by the crystal’s asymmetric unit with a charge of zero and a doublet spin. The geometry was fully optimized in the C1 symmetry group. All structures, analyzed using different levels of theory, exhibit a real minimum on their potential energy surfaces, as indicated by the absence of negative values in the calculated wavenumbers (imaginary frequencies).
To explore the optical behavior and chemical reactivity descriptors of the studied compound, we utilized density functional theory (DFT) and time-dependent density functional theory (TD-DFT) methodologies. As we have an open shell system, the unrestricted formalism UB3LYP functional [28,29], was used for the system’s characteristics. To accurately represent the electronic behavior of the cobalt atoms (Co) within the crystal, we adopted the LANL2DZ pseudopotential and basis set [30]. Additionally, for the constituent atoms of nitrogen (N), carbon (C), hydrogen (H), and sulfur (S), we used the 6–31+G* basis set as implemented in Gaussian 16 [27]. This choice of basis set effectively captured the electron distribution of these elements, enabling precise calculations of their properties within the compound. This analysis holds particular significance in the context of biology and the study of molecular structures. It sheds light on the studied crystal’s properties, which can be very important in various biological processes. Understanding these properties can have far-reaching implications, from drug design to understanding biomolecular interactions, ultimately contributing to advancements in the field of molecular biology.
2.6.2. Global Reactivity Descriptors
DFT method and frontier molecular orbitals (FMOs) analysis are now essential instruments employed by both theorists and experimentalists to explore, comprehend, and forecast chemical properties of organic and inorganic compounds [31,32,33,34]. This is chiefly attributable to the exceptional balance struck between precision and computational efficiency.
In the forthcoming phase of our research, our focus extends beyond predicting the energy gap (Eg), this term refers to the disparity between the energy levels of the highest occupied molecular orbital (HOMO) and the lowest unoccupied molecular orbital (LUMO). We are committed to conducting an in-depth exploration of chemical reactivity descriptors to gain a comprehensive understanding of the compound’s chemical behavior under scrutiny. To accomplish this, we draw upon a range of well-established chemical reactivity descriptors, extensively discussed in our previous works [35,36,37]. These descriptors, which are integral to understanding the electronic properties of our compound, are rigorously evaluated and summarized as follows [38,39]:
Energy Gap (Eg): Eg = E(LUMO) − E(HOMO)
This term denotes the disparity in energy levels between the highest occupied molecular orbital (HOMO) and the lowest unoccupied molecular orbital (LUMO). It provides insights into the compound’s electronic transitions.
First Ionization energy (I), I = −E(HOMO)
The symbol I denotes the energy that is necessary for the removal of an electron from the highest occupied molecular orbital (HOMO), indicating the compound’s electron-donating capacity.
Affinity (A), A = −E(LUMO)
Affinity refers to the quantification of the energy variation that occurs upon the addition of an electron to the lowest unoccupied molecular orbital (LUMO), indicating the compound’s electron-accepting propensity.
This descriptor reflects the stability of the compound, providing information about its resistance to electron exchange.
µ offers insights into the compound’s ability to exchange electrons with its environment.
Electrophilicity combines information about the chemical potential and hardness, offering valuable insights into the compound’s reactivity.
Electronegativity indicates the compound’s tendency to attract electrons in chemical bonds, reflecting its polarity and reactivity.
Softness describes the compound’s response to electron addition or removal, offering further insights into its reactivity and stability.
3. Results and Discussion
3.1. Chemistry
The reaction of triphenyl tetrazolium chloride with cobalt thiocyanate in a methanolic solution at ambient temperature afforded the title compound of cobalt (II) thiocyanate-tetraphenyl tetrazolium complex in 78% yield through an anion exchange reaction. The elemental analysis results show C = 55.63%, H 3.45%, and N 18.74%, which agree with theoretical values of C 56.69%, H 3.37%, and N 18.89%. The UV-visible spectra show the complex has a maximum wavelength of 623 nm.
Several resonances in the 1H-NMR spectrum are caused by chemical shifts in the aromatic zone. This is strong evidence that the triphenyl tetrazolium cobalt thiocyanate complex has been formed. When comparing the NMR spectra of the triphenyl tetrazolium ion (Figure 1A) and the triphenyl tetrazolium cobalt thiocyanate, we observe in the aromatic zone of the former more peaks, such as 7.68–7.80 ppm, assignable to particular protons in the triphenyl rings (a); 7.94–8.00 ppm also assignable to other different protons in the two phenyl rings (b); and 8.30–8.35 ppm assignable for protons in one phenyl ring (c). However, the 1H-NMR spectra exhibit only four peaks (7.63, 7.69, 7.77, and 8.26 ppm) for the protons of triphenyl groups, confirming the establishment of the triphenyl-tetrazolium complex. A prominent absorption band at 2000.85 cm−1 for CN can be seen in the IR spectrum of the triphenyl tetrazolium cobalt thiocyanate complex, which is not present in the IR spectrum of triphenyl-tetrazole. This is also another evidence for the complex. All carbons for the triphenyl group appear in the 13C-NMR for both the triphenyl tetrazolium and the triphenyl tetrazolium cobalt thiocyanate complex but with slightly distinct chemical shifts.
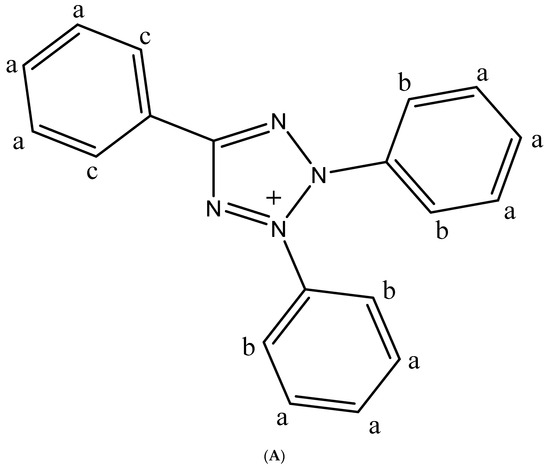
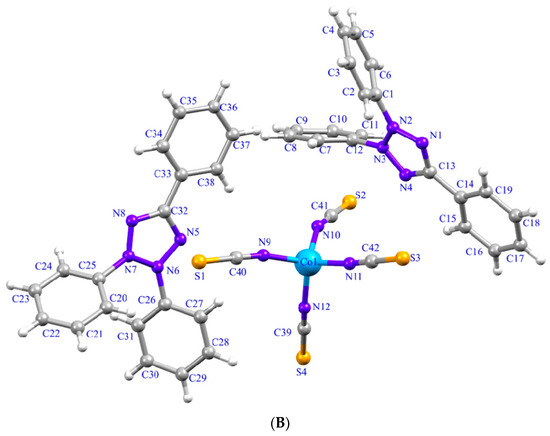
Figure 1.
(A) Chemical structure of triphenyltetrazolium. (B) The asymmetric unit of (1) with atom labeling scheme. Thermal ellipsoids are drawn at the 50% probability level.
3.2. Structural Description
The structure of (1), (TPT)2[CoII(NCS)4], is determined by single crystal X-ray analysis. It is a polymorph of the previously published structure by Nakashima et al. [40]. The asymmetric unit of (1) consists of one tetrathiocyanatecobaltate [CoII(NCS)4]2− anionic complex and two triphenyltetrazolium (TPT)+ organic cations (Figure 1B). The tetrathiocyanatecobaltate [Co(NCS)4]2− anion consists of the CoII ion, which is tetrahedrally coordinated by four nitrogen atoms of thiocyanate ligands with averaged Co-N bond lengths of 1.94–1.95 Å (Table 2). The thiocyanate ligands are bound through nitrogen atoms and are quasi-linear [N-C-S= 179.5 (4) Å], while the Co-NCS linkages are bent [C-N-Co = 157.0 (4) Å] (Table 2). These structural characteristics have been reported by its previously described polymorph (2) [40] and other similar compounds containing [M(NCS)4]2− anion (M is a transition metal) [2,41]. Regarding polymorphs, it is not surprising the structure determination for (2) revealed a network that differed from that of (1). In our case, the structure crystallizes in the chiral space group, P-1, though the starting material in both structures, 2,3,5-triphenyltetrazolium, is achiral. There are two crystallographically different molecules of bis(2,3,5-triphenyltetrazolium) tetrathiocyanatecobaltate in the asymmetric unit of (2). The coordination environments exhibited by complexes (1) and (2) are comparable; however, there are modest variations in the bond angles observed in each complex [40]. This difference may also be due to the intermolecular interactions between anions and cations. In (1), all five atoms in the tetrazolium rings are coplanar (r.m.s deviations are 0.0046 (Å) and 0.0028 (Å) for each tetrazolium ring, respectively). Delocalization in the tetrazolium ring is supported by N-C and N-N lengths (Table 2). The tetrazolium rings are close to being planar with one of the phenyl rings (r.m.s deviations = 0.052 and 0.031 Å) and form dihedral angles of 56.72(4)° and 54.99(5)° with the planes of the two other benzene rings. These values are different from its polymorphic form (2) and 2,3,5-triphenyltetrazolium hexachloroantimonate(V) [40,41], 2,3,5-triphenyltetrazolium perrhenate(vii) [9] and agree well with those reported for 2,3,5-triphenyltetrazolium chloride acetonitrile solvate [6], 2,3,5-triphenyltetrazolium chloride monohydrate [6], and 2,3,5-triphenyltetrazolium chloride ethanol solvate [6].
Table 2.
Selected bond lengths (Å) and angles (°) for (1).
The cohesion and stability of (1) are ensured by C-H···N hydrogen bonds between aromatic H atoms of [TPT] cations and N-atoms of thiocyanate groups of [Co(NCS)4]2− anion (Figure 2, Table 3) and X···π interactions (Figure 3, Table 4). All the hydrogen bonds in (1) are found to be electrostatic in nature and weak with respect to donor-acceptor bond lengths (D···A > 3 Å) [41,42]. The X···π interactions are established between the sulfur atoms of the thiocyanate groups and the tetrazolium rings (Figure 3, Table 4). In this structure, no π-stacking interactions is observed, compared to those reported for 2,3,5-triphenyltetrazolium cations [6,9,41]. All these non-covalent interactions give rise to a three-dimensional supramolecular framework (Figure S1).
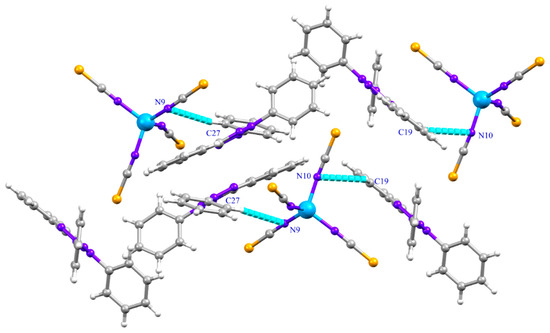
Figure 2.
C-H···N Hydrogen bonds in (1).
Table 3.
Hydrogen-bond geometry in (1).
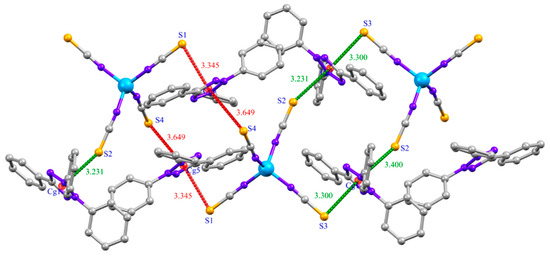
Figure 3.
S···π interactions in (1).
Table 4.
Analysis of Y-X···Cg (Pi-Ring) interactions (X···Cg < 4.0 Å).
3.3. Hirshfeld Surface Analysis and Enrichment Ratio Calculations
Figure 4 shows the Hirshfeld surface generated over a dnorm range of −0.0794 to 1.5355 a.u. The red spot on the views of the dnorm surfaces near nitrogen and ortho C-H of the phenyl ring indicates these atoms are involved in the C-H···N hydrogen-bonding contacts. Two-dimensional (2D) fingerprint plot analysis can be used to quantify contacts present in the structure [26,35]. The overall 2D fingerprint plot (Figure 5) and those delineated into H···C/C···H, H···H, H···S/S···H, and N···H/H···N, are given in Figure 5, respectively, together with their relative contributions to the HS. The most significant contribution from H···C/C···H contacts is 30.2% (Table 3), shown in the 2D fingerprint plot by a pair of sharp spikes pointed at de + di = 2.7 Å (Figure 5). Furthermore, because of the abundance of carbon (%SC) and hydrogen (%SH) on the molecular surface (%SC = 17.25% and %SH = 59.5%, respectively), rather than the presence of C-H···π interactions and an enrichment ratio greater than the unit EH···C = 1.47 (Table 5), these types of contacts are the most prominent interactions. Hydrogen-hydrogen (H···H) interactions are prominently observed in the two-dimensional fingerprint plot, exhibiting a substantial presence within the central region at a distance of de + di = 2.4 Å. These interactions account for approximately 28.7% of the entire area encompassed by the hydrogen bond surface (Figure 5); the second most frequent connections occur as a result of the high abundance of hydrogen on the molecular surface, with a hydrogen content of 59.5%. However, these contacts are significantly less prevalent, with an enrichment ratio of approximately 0.81. The H···S contacts, occur as a pair of sharp spikes pointed at de + di = 3 Å, and refer to S···π interactions, the third most significant interactions on the surface account for approximately 18.7% of the Hirshfeld surfaces (Figure 5) and have an enrichment ratio higher than unit EH···S = 1.38 (Table 5). In addition, H···N contacts present the fourth most abundant interactions on the HS (12.8%), corresponding to the presence of weak C-H···N hydrogen bonding, which is represented by two large spikes pointed at de + di = 3.2 Å (Figure 5). These contacts are over-represented with an enrichment ratio EN···H = 1.22. Finally, C···C, N···C, N···S, C···S, and Co···H contacts all make minor contributions to the overall HS (3.2, 2.6, 2.3, 1.7, and 0.2% to the total HS, respectively). However, C···C, N···S, and Co···H contacts are more enriched at EC···C = 1.07, EN···S = 1.16 and ECo···H = 1.66 (Table 5).
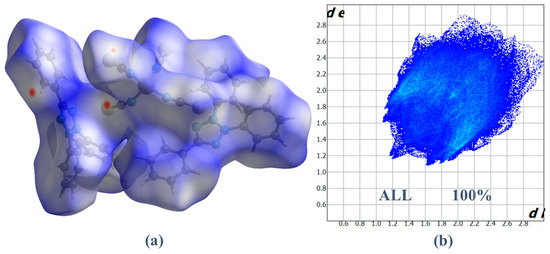
Figure 4.
(a) HS plotted over dnorm for (1) and (b) Fingerprint plot illustrating the total percentage contribution of various interactions to HS area.
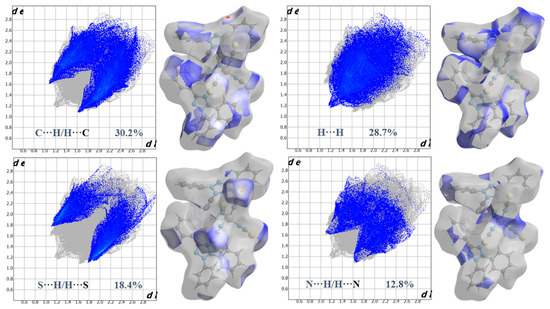
Figure 5.
Two-dimensional fingerprints made with standard HS surfaces of C-H, H-H, S-H, and N-H contacts in (1).
Table 5.
Hirshfeld contact surfaces and derived random contact and enrichment ratios calculations for (1).
3.4. Void Analysis
The mechanical characteristics of single crystals are strongly linked to the voids. If a single crystal has a very small percentage of voids, it has good mechanical properties such as stress response, melting temperature, and so on [43,44] In this light, we calculated voids in (1) by considering all atoms were spherically symmetric and by combining the electronic density of all atoms in the crystal structure. The volume of the crystal voids (Figure 6) and the percentage of free spaces in the unit cell are calculated as 352.86 Å3 and 15.84%, respectively. Therefore, the molecules are closely packed, and there are no large voids in the crystal packing. This higher value of volume occupied by voids reveals (1) is a hard crystal with good mechanical properties.
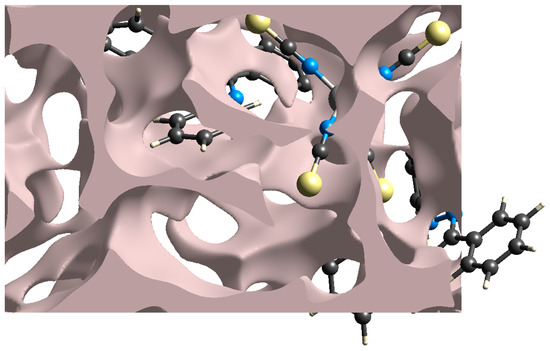
Figure 6.
Graphical representation of voids in the crystal packing of (1).
3.5. Growth Morphology Prediction by the AE Method
The crystal morphologies predicted by the BFDH and growth morphology (GM) models (Figure 7) reveal the main shape of as-grown crystals to be a trigonal plate shape, with a small deviation in the GM model. Both models expect a trigonal plate morphology, with (001) facets having the most morphological importance (MI) followed by (010) facets as the second most MI. However, the (GM) model indicates the (111) facet would be the third dominant facet, while the BFDH model predicts the (100) facet would be the third largest exposed face.
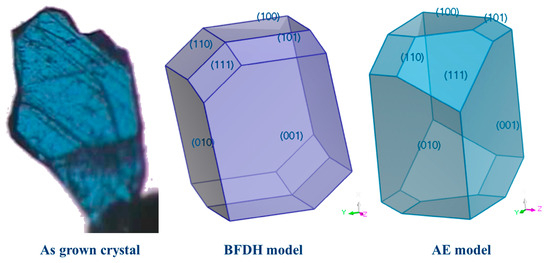
Figure 7.
As grown graph of synthetic crystal, growth morphology prediction by the AE method and BFDH model morphological predictions showing the major faces that are predicted by the models.
The surface structures of all important facets of (1) given by the GM model were studied. The (GM) model assumes the growth of the crystals to take place in a vacuum and at a low driving force. The significance of the (001) and (010) morphological facets, which account for almost 73% of the crystal surface, is apparent due to their limited interactions characterized by a small number of polar groups. The attachment energies of (001) and (010) are −42.3605 and −45.7329 kJ mol−1, respectively. The additional morphologically significant aspects, denoted as (100), (101), and (110), indicate the existence of more pronounced interactions, specifically the presence of polar functional groups. The estimates of attachment energy were conducted to elucidate the potential energetic interactions that occur during the process of crystal formation. According to the literature [35], when the attachment energy is at its minimum in a specific direction, the facet that plays a crucial role in morphology and bounds that development direction will exhibit the slowest rate of growth and hence have the smallest size. So, according to the Eatt values (Table 6), the (1 0 1), and (110) facets present smaller attachment energies and therefore slower growth rates and lower morphological importance (Figure 8).
Table 6.
Crystal facets and related parameters of (1) predicted by the BFDH and GM models.
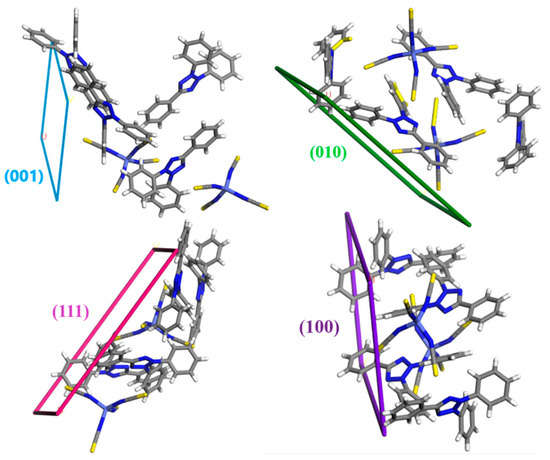
Figure 8.
The molecular arrangement of different crystal facets in (1).
3.6. Computational Results
3.6.1. Geometry Optimization
The geometry parameters and their error relative to the experimental values (Table 7) prove the method used in our study reproduces well crystallographic geometry, where the largest error is around 3.2% in Co1-N10 bond.
Table 7.
Selected theoretical and experimental equilibrium geometry parameters of (1) in Å.
3.6.2. Chemical Descriptors
The energy gap (Eg) between HOMO and LUMO plays a pivotal role in elucidating both the bioactivity and the intermolecular charge transfer processes [45]. The calculated energy gap of our crystal holds paramount importance in elucidating its electronic properties and potential applications. This modest Eg value of 0.13 eV categorizes the material as a semiconductor, providing strong evidence for the occurrence of intramolecular charge transfer (ICT) (Table S1). This noteworthy ICT phenomenon plays a central role in reinforcing and confirming the inherent antioxidant capabilities of the compound under examination. This particular Eg value falls within the range typically associated with certain types of semiconductors, making it particularly suitable not only for electronic and optoelectronic applications but also for use in biomedical sensing applications, where it can serve as a sensitive element for detecting biomolecules or environmental changes. The calculated electrophilicity (ω) value of the studied crystal (Table 8) suggests the crystal is highly electrophilic. This high electrophilicity value typically indicates the crystal has a strong tendency to accept electrons and engage in chemical reactions where it acts as an electron acceptor. This reactivity can make the crystal prone to forming chemical bonds or undergoing reactions with other molecules or ions that can donate electrons.
Table 8.
HOMO-LUMO energy and global reactivity descriptor values of (1) in (eV).
The contour surfaces of the frontier molecular orbitals (FMOs) calculations are shown in Figure 9. As depicted, the spatially occupied molecular orbital SOMO such as half-filled α-HOMO for the open shell system, SOMO-1 (α-HOMO-1) and LUMO (α-LUMO) predominantly reside within the inorganic component of the studied crystal. This observation highlights a significant and intriguing facet of the compound’s electronic structure, signifying that the inorganic portion plays a paramount role in facilitating intramolecular charge transfer (ICT) within the crystal.
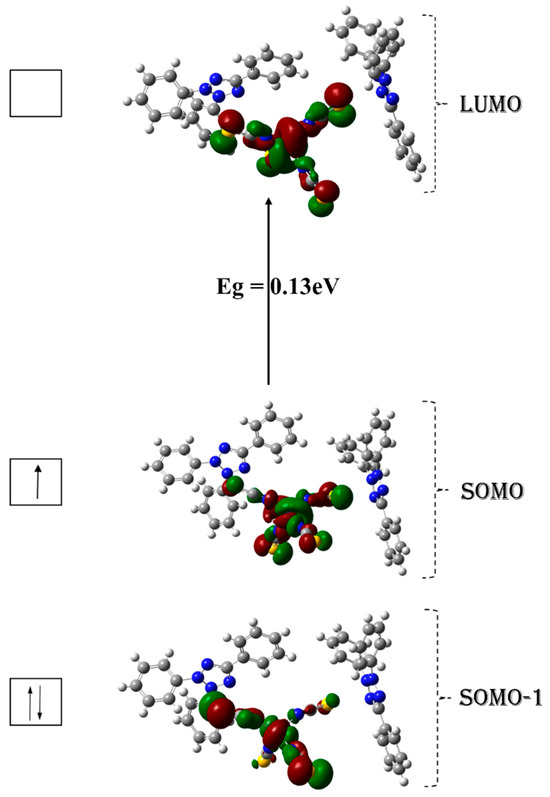
Figure 9.
Frontier molecular orbitals and the energy gap (Eg in electron volt) of (1) (Isosurface 0.05 e/Å3).
4. Conclusions
The crystal structure is determined by single crystal X-ray diffraction analysis. The molecular structure is composed of one tetrathiocyanatecobaltate [CoII(NCS)4]2− anionic complex and two triphenyltetrazolium (TPT)+ organic cations. The supramolecular assembly is mainly stabilized by C-H⋯N hydrogen bonding and S⋯π non-covalent interactions. The crystal packing of compound (1) was determined to be primarily influenced by C⋯H, H⋯H, S⋯H, and N⋯H contacts, as indicated by the analysis of Hirshfeld surface and enrichment ratio estimates. The study of the void revealed the absence of a significant cavity, indicating the compound is anticipated to possess favorable mechanical characteristics. The final crystal morphology of (1) was obtained using BFDH and growth morphology models. The results show that (1) crystals simulated in vacuum have six habit faces, of which the (0 0 1) and (0 1 0) faces are morphologically more important. Finally, in terms of electronic properties, the low energy gap (Eg = 0.13 eV), implies stability, high kinetics, and low chemical reactivity, as it is energetically unfavorable to add electrons to the LUMO or to extract electrons from the HOMO.
Supplementary Materials
The following supporting information can be downloaded at: https://www.mdpi.com/article/10.3390/cryst13111598/s1; Figure S1: The crystal packing of (1) along a axis; Table S1: Calculated UV-Vis spectrum, oscillator strength and the major contribution calculated using B3LYP functional.
Author Contributions
Formula analysis, investigation and writing—reviewer editing, E.A.A.; Investigation, software, visualization, data curation, writing the origin draft, and writing—reviewer editing, R.B.; Methodology, investigation and writing—reviewer editing, R.A.-S.; Investigation, methodology, A.S.M.A.-J.; Conceptualization, data curation, investigation and writing—reviewer editing, M.W.A. and G.A.E.M. All authors have read and agreed to the published version of the manuscript.
Funding
The research work was funded by researchers supporting project number (RSPD2023R1000), King Saud University, Riyadh, Saudi Arabia.
Data Availability Statement
All data are available within the manuscript.
Acknowledgments
The authors extend their appreciation to the researchers supporting project number (RSPD2023R1000), King Saud University, Riyadh, Saudi Arabia, for financial support.
Conflicts of Interest
The authors declare no conflict of interest.
References
- Peppel, T.; Hinz, A.; Thiele, P.; Geppert-Rybczyńska, M.; Lehmann, J.K.; Köckerling, M. Synthesis, Properties, and Structures of Low-Melting Tetraisocyanatocobaltate (II)-Based Ionic Liquids. Eur. J. Inorg. Chem. 2017, 2017, 885–893. [Google Scholar] [CrossRef]
- Triki, H.; Nagy, B.; Overgaard, J.; Jensen, F.; Kamoun, S. Structure, DFT Based Investigations on Vibrational and Nonlinear Optical Behavior of a New Guanidinium Cobalt Thiocyanate Complex. Struct. Chem. 2020, 31, 103–114. [Google Scholar] [CrossRef]
- Burmeister, J.L.; Al-Janabi, M.Y. Selenocyanate Complexes of Cobalt (III), Palladium (II), and Platinum (II). Inorg. Chem. 1965, 4, 962–965. [Google Scholar] [CrossRef]
- Poddar, R.K.; Parashad, R.; Agarwala, U. Linkage Isomerism of NCS− Group in Ruthenium Complexes. J. Inorg. Nucl. Chem. 1980, 42, 837–838. [Google Scholar] [CrossRef]
- Ferchichi, A.; Makhlouf, J.; El Bakri, Y.; Saravanan, K.; Valkonen, A.; Hashem, H.E.; Ahmad, S.; Smirani, W. Self-Assembly of New Cobalt Complexes Based on [Co (SCN)4], Synthesis, Empirical, Antioxidant Activity, and Quantum Theory Investigations. Sci. Rep. 2022, 12, 15828. [Google Scholar] [CrossRef]
- Golovanov, D.G.; Perekalin, D.S.; Yakovenko, A.A.; Antipin, M.Y.; Lyssenko, K.A. The Remarkable Stability of the Cl–···(π-System) Contacts in 2, 3, 5-Triphenyltetrazolium Chloride. Mendeleev Commun. 2005, 15, 237–239. [Google Scholar] [CrossRef]
- Gjikaj, M.; Xie, T.; Brockner, W. Uncommon Compounds in Antimony Pentachloride–Ionic Liquid Systems: Synthesis, Crystal Structure and Vibrational Spectra of the Complexes [TPT][SbCl6] and [Cl-EMIm][SbCl6]. Z. Anorg. Allg. Chem. 2009, 635, 1036–1040. [Google Scholar] [CrossRef]
- Benon, H.J.B.; Grace, G.S.; Stanley, B. Reduction of Nitro Blue Tetrazolium by CO2–and O2–Radicals. J. Phys. Chem. 1980, 84, 830–833. [Google Scholar]
- Předota, M.; Petříček, V.; Žák, Z.; Głowiak, T.; Novotný, J. Structure Du Perrhenate de Triphényl-2, 3, 5 Tétrazolium. Acta Crystallogr. Sect. C Cryst. Struct. Commun. 1991, 47, 738–740. [Google Scholar] [CrossRef]
- Gavazov, K.B.; Dimitrov, A.N.; Lekova, V.D. The Use of Tetrazolium Salts in Inorganic Analysis. Russ. Chem. Rev. 2007, 76, 169. [Google Scholar] [CrossRef]
- Mostafa, G.A.-H. PVC Matrix Membrane Sensor for Potentiometric Determination of Triphenyltetrazolium Chloride and Ascorbic Acid. Ann. Chim. 2007, 97, 1247–1256. [Google Scholar] [CrossRef]
- Hassanien, M.M.; Abou-El-Sherbini, K.S.; Mostafa, G.A.E. A Novel Tetrachlorothallate (III)-PVC Membrane Sensor for the Potentiometric Determination of Thallium (III). Talanta 2003, 59, 383–392. [Google Scholar] [CrossRef] [PubMed]
- Abbas, M.N.; Mostafa, G.A.E.; Homoda, A.M.A. PVC Membrane Ion Selective Electrode for the Determination of Pentachlorophenol in Water, Wood and Soil Using Tetrazolium Pentachlorophenolate. Talanta 2001, 55, 647–656. [Google Scholar] [CrossRef] [PubMed]
- Bruker, A. Bruker Advanced X-ray Solutions SAINT Software Reference Manual SAINT v8. 34A; Bruker AXS Inc.: Madison, WI, USA, 2013. [Google Scholar]
- Sheldrick, G.M. Crystal Structure Refinement with SHELXL. Acta Crystallogr. Sect. C Struct. Chem. 2015, 71, 3–8. [Google Scholar] [CrossRef] [PubMed]
- Sheldrick, G.M. SHELXT–Integrated Space-Group and Crystal-Structure Determination. Acta Crystallogr. Sect. A Found. Adv. 2015, 71, 3–8. [Google Scholar] [CrossRef] [PubMed]
- Macrae, C.F.; Sovago, I.; Cottrell, S.J.; Galek, P.T.A.; McCabe, P.; Pidcock, E.; Platings, M.; Shields, G.P.; Stevens, J.S.; Towler, M. Mercury 4.0: From Visualization to Analysis, Design and Prediction. J. Appl. Crystallogr. 2020, 53, 226–235. [Google Scholar] [PubMed]
- Spackman, M.A.; Jayatilaka, D. Hirshfeld Surface Analysis. CrystEngComm 2009, 11, 19–32. [Google Scholar] [CrossRef]
- Spackman, M.A.; McKinnon, J.J. Fingerprinting Intermolecular Interactions in Molecular Crystals. CrystEngComm 2002, 4, 378–392. [Google Scholar]
- Spackman, P.R.; Turner, M.J.; McKinnon, J.J.; Wolff, S.K.; Grimwood, D.J.; Jayatilaka, D.; Spackman, M.A. CrystalExplorer: A Program for Hirshfeld Surface Analysis, Visualization and Quantitative Analysis of Molecular Crystals. J. Appl. Crystallogr. 2021, 54, 1006–1011. [Google Scholar] [CrossRef]
- Bondi, A. Van Der Waals Volumes and Radii of Metals in Covalent Compounds. J. Phys. Chem. 1966, 70, 3006–3007. [Google Scholar] [CrossRef]
- Jelsch, C.; Ejsmont, K.; Huder, L. The Enrichment Ratio of Atomic Contacts in Crystals, an Indicator Derived from the Hirshfeld Surface Analysis. IUCrJ 2014, 1, 119–128. [Google Scholar] [CrossRef] [PubMed]
- Ferjani, H.; Chebbi, H.; Guesmi, A.; AlRuqi, O.S.; Al-Hussain, S.A. Two-Dimensional Hydrogen-Bonded Crystal Structure, Hirshfeld Surface Analysis and Morphology Prediction of a New Polymorph of 1H-Nicotineamidium Chloride Salt. Crystals 2019, 9, 571. [Google Scholar] [CrossRef]
- Miglani Bhardwaj, R.; Ho, R.; Gui, Y.; Brackemeyer, P.; Schneider-Rauber, G.; Nordstrom, F.L.; Sheikh, A.Y. Origins and Implications of Extraordinarily Soft Crystals in a Fixed-Dose Combination Hepatitis C Regimen. Cryst. Growth Des. 2022, 22, 4250–4259. [Google Scholar] [CrossRef]
- Studio, A.D. Accelrys Materials Studio 7.0. Available online: www.scientific-computing/com/press-release/accelrys-materials-Studio7.0 (accessed on 15 October 2023).
- Ferjani, H. Structural, Hirshfeld Surface Analysis, Morphological Approach, and Spectroscopic Study of New Hybrid Iodobismuthate Containing Tetranuclear 0D Cluster Bi4I16·4(C6H9N2) 2(H2O). Crystals 2020, 10, 397. [Google Scholar] [CrossRef]
- Frisch, M.J.; Trucks, G.W.; Schlegel, H.B.; Scuseria, G.E.; Robb, M.A.; Cheeseman, J.R.; Scalmani, G.; Barone, V.; Petersson, G.A.; Nakatsuji, H. Gaussian 16; Gaussian, Inc.: Wallingford, CT, USA, 2016. [Google Scholar]
- Becke, A.D. Density-functional exchange-energy approximation with correct asymptotic behavior. Phys. Rev. A At. Mol. Opt. Phys. 1988, 38, 3098–3100. [Google Scholar] [CrossRef]
- Lee, C.; Yang, W.; Parr, R.G. Development of the Colle-Salvetti Correlation-Energy Formula into a Functional of the Electron Density. Phys. Rev. B 1988, 37, 785. [Google Scholar] [CrossRef]
- Chiodo, S.; Russo, N.; Sicilia, E. LANL2DZ Basis Sets Recontracted in the Framework of Density Functional Theory. J. Chem. Phys. 2006, 125, 104107. [Google Scholar] [CrossRef]
- Zárate, X.; Schott, E.; Carey, D.M.-L.; Bustos, C.; Arratia-Pérez, R. DFT Study on the Electronic Structure, Energetics and Spectral Properties of Several Bis (Organohydrazido (2−)) Molybdenum Complexes Containing Substituted Phosphines and Chloro Atoms as Ancillary Ligands. J. Mol. Struct. THEOCHEM 2010, 957, 126–132. [Google Scholar] [CrossRef]
- Xu, Z.; Li, Y.; Zhang, W.; Yuan, S.; Hao, L.; Xu, T.; Lu, X. DFT/TD-DFT Study of Novel T Shaped Phenothiazine-Based Organic Dyes for Dye-Sensitized Solar Cells Applications. Spectrochim. Acta Part A Mol. Biomol. Spectrosc. 2019, 212, 272–280. [Google Scholar] [CrossRef]
- Wei, J.; Song, P.; Ma, F.; Saputra, R.M.; Li, Y. Tunable Linear and Nonlinear Optical Properties of Chromophores Containing 3, 7-(Di) Vinylquinoxalinone Core by Modification of Receptors Moieties. Opt. Mater. 2020, 99, 109580. [Google Scholar] [CrossRef]
- Wang, L.; Zhang, J.; Duan, Y.-C.; Pan, Q.-Q.; Wu, Y.; Geng, Y.; Su, Z.-M. Theoretical Insights on the Rigidified Dithiophene Effects on the Performance of Near-Infrared Cis-Squaraine-Based Dye-Sensitized Solar Cells with Panchromatic Absorption. J. Photochem. Photobiol. A Chem. 2019, 369, 150–158. [Google Scholar] [CrossRef]
- Ferjani, H.; Bechaieb, R.; Dege, N.; Abd El-Fattah, W.; Elamin, N.Y.; Frigui, W. Stabilization of Supramolecular Network of Fluconazole Drug Polyiodide: Synthesis, Computational and Spectroscopic Studies. J. Mol. Struct. 2022, 1263, 133192. [Google Scholar] [CrossRef]
- Ferjani, H.; Bechaieb, R.; Abd El-Fattah, W.; Fettouhi, M. Broad-Band Luminescence Involving Fluconazole Antifungal Drug in a Lead-Free Bismuth Iodide Perovskite: Combined Experimental and Computational Insights. Spectrochim. Acta Part A Mol. Biomol. Spectrosc. 2020, 237, 118354. [Google Scholar] [CrossRef] [PubMed]
- Ferjani, H.; Bechaieb, R.; Alshammari, M.; Lemine, O.M.; Dege, N. New Organic–Inorganic Salt Based on Fluconazole Drug: TD-DFT Benchmark and Computational Insights into Halogen Substitution. Int. J. Mol. Sci. 2022, 23, 8765. [Google Scholar] [CrossRef]
- Gümüş, H.P.; Tamer, Ö.; Avcı, D.; Atalay, Y. Quantum Chemical Calculations on the Geometrical, Conformational, Spectroscopic and Nonlinear Optical Parameters of 5-(2-Chloroethyl)-2, 4-Dichloro-6-Methylpyrimidine. Spectrochim. Acta Part A Mol. Biomol. Spectrosc. 2014, 129, 219–226. [Google Scholar] [CrossRef]
- Tamer, Ö.; Bhatti, M.H.; Yunus, U.; Avcı, D.; Atalay, Y.; Nadeem, M.; Shah, S.R.; Helliwell, M. Structural, Spectroscopic, Nonlinear Optical and Electronic Properties of Calcium N-Phthaloylglycinate: A Combined Experimental and Theoretical Study. J. Mol. Struct. 2016, 1125, 315–322. [Google Scholar] [CrossRef]
- Nakashima, K.; Kawame, N.; Kawamura, Y.; Tamada, O.; Yamauchi, J. Bis (2,3,5-Triphenyltetrazolium) Tetrathiocyanatocobaltate (II). Acta Crystallogr. Sect. E Struct. Rep. Online 2009, 65, m1406–m1407. [Google Scholar] [CrossRef]
- Hsieh, C.-H.; Brothers, S.M.; Reibenspies, J.H.; Hall, M.B.; Popescu, C.V.; Darensbourg, M.Y. Ambidentate Thiocyanate and Cyanate Ligands in Dinitrosyl Iron Complexes. Inorg. Chem. 2013, 52, 2119–2124. [Google Scholar] [CrossRef]
- Steiner, T. The Hydrogen Bond in the Solid State. Angew. Chemie Int. Ed. 2002, 41, 48–76. [Google Scholar] [CrossRef]
- Turner, M.J.; McKinnon, J.J.; Jayatilaka, D.; Spackman, M.A. Visualisation and Characterisation of Voids in Crystalline Materials. CrystEngComm 2011, 13, 1804–1813. [Google Scholar] [CrossRef]
- Setifi, Z.; Ferjani, H.; Smida, Y.B.; Jelsch, C.; Setifi, F.; Glidewell, C. A Novel CuII/8-Aminoquinoline Isomer Complex [Cu(H2O)2(C9H8N2)2]Cl2: Solvothermal Synthesis, Molecular Structure, Hirshfeld Surface Analysis, and Computational Study. Chem. Afr. 2023, 6, 891–901. [Google Scholar] [CrossRef]
- Hajji, M.; Kouraichi, C.; Guerfel, T. Modelling, Structural, Thermal, Optical and Vibrational Studies of a New Organic–Inorganic Hybrid Material (C5H16N2)Cd1.5Cl5. Bull. Mater. Sci. 2017, 40, 55–66. [Google Scholar] [CrossRef]
Disclaimer/Publisher’s Note: The statements, opinions and data contained in all publications are solely those of the individual author(s) and contributor(s) and not of MDPI and/or the editor(s). MDPI and/or the editor(s) disclaim responsibility for any injury to people or property resulting from any ideas, methods, instructions or products referred to in the content. |
© 2023 by the authors. Licensee MDPI, Basel, Switzerland. This article is an open access article distributed under the terms and conditions of the Creative Commons Attribution (CC BY) license (https://creativecommons.org/licenses/by/4.0/).