Article

Thermal Evaporation Synthesis, Optical and Gas-Sensing Properties of ZnO Nanowires

1
Faculty of Materials Technology, Ho Chi Minh City University of Technology (HCMUT), 268 Ly Thuong Kiet Street, District 10, Ho Chi Minh City 700000, Vietnam
2
Vietnam National University—Ho Chi Minh City (VNU-HCM), Linh Trung Ward, Thu Duc District, Ho Chi Minh City 700000, Vietnam
*
Author to whom correspondence should be addressed.
Crystals 2023, 13(9), 1380; https://doi.org/10.3390/cryst13091380
Submission received: 3 July 2023 / Revised: 5 September 2023 / Accepted: 11 September 2023 / Published: 17 September 2023
(This article belongs to the Special Issue 1D and 2D Nanomaterials for Sensor Applications)

Abstract

:
The purpose of this study is to synthesize and explore the relationship between the optical properties and gas-sensing performance of ZnO nanowires (NWs). Well-aligned ZnO nanowire (NW) arrays were synthesized on a silicon substrate using the thermal evaporation method without any catalyst or additive. The structures, surface morphologies, chemical compositions, and optical properties of the products were characterized using X-ray diffraction (XRD), field emission scanning electron microscopy (FESEM) together with energy-dispersive spectroscopy (EDS), high-resolution transmission electron microscopy (HRTEM), X-ray photoelectron spectroscopy (XPS), and photoluminescence (PL) spectroscopy, and their gas-sensing properties for NO2 were examined. The results showed that single-crystalline ZnO NWs with high density grow uniformly and vertically on a Si substrate. The FESEM and TEM images indicate that ZnO NWs have an average diameter of roughly 135–160 nm with an average length of roughly 3.5 μm. The results from XRD confirm that the ZnO NWs have a hexagonal wurtzite structure with high crystalline quality and are highly oriented in the [0001] direction (i.e., along the c-axis). The deconvoluted O 1s peak at ~531.6 eV (29.4%) is assigned to the oxygen deficiency, indicating that the ZnO NWs contain very few oxygen vacancies. This observation is further confirmed by the PL analysis, which showed a sharp and high-intensity peak of ultraviolet (UV) emission with a suppressed deep-level (DL) emission (very high: IUV/IDL > 70), indicating the excellent crystalline quality and good optical properties of the grown NWs. In addition, the gas-sensing properties of the as-prepared ZnO NWs were investigated. The results indicated that under an operating temperature of 200 °C, the sensor based on ZnO NWs is able to detect the lowest concentration of 1.57 ppm of NO2 gas.

1. Introduction

Nitrogen oxide (NO2) is a strong oxidizing gas that has become one of the extremely harmful gases that derive from combustion of fossil fuels and car exhaust [1,2]. Exposure to NO2 gas results in serious damage to lung tissues and reduces the fixation of O2 on red blood corpuscles, and the gas also contributes to acid rain as well as generating increased ozone in the lower atmosphere [3]. Nowadays, due to the increase in the numbers of cars, power plants, and factories, the concentration of NO2 gas in the air atmosphere has increased rapidly [4]. According to health and safety guidelines, humans should not be exposed to more than 2.5 ppm of NO2 [5,6]. Therefore, the development of gas sensors for the precise detection of NO2 is of great importance for environmental monitoring and human health protection.
In recent years, metal oxide semiconductors (MOSs) such as SnO2, ZnO, In2O3, WO3, Fe2O3, NiO, Cu2O, etc., have attracted tremendous attention in the field of gas sensing because of their low cost, simple fabrication methods, long life, high stability, and superior sensing performance [7,8,9,10,11,12,13]. Among them, zinc oxide (ZnO) is an n-type semiconductor with a wide direct band gap of 3.37 eV (at 300 K), possessing a large exciton binding energy (60 meV) and high electron mobility (100–200 cm2 V−1 s−1) [14,15], making it suitable not only for gas sensing [16] but also for potential applications in solar cells [17], electronic and optoelectronic devices [18], and catalysts [19]. In fact, due to its advantages of high sensitivity, good oxidation resistance, great chemical–thermal stability, environmental friendliness, and low cost, nanosized ZnO with different morphologies has been widely employed to detect various gases including H2, H2S, NO2, NH3, CH4, CO, ethanol, and acetone [16].
It is well known that gas-sensing performance strongly depends upon structural parameters including crystal size, specific surface area, microstructure, crystallographic planes and the crystallinity of sensing materials [20]. For instance, a decrease in crystal size, an increase in surface-to-volume ratio, and high crystallinity are required to enhance the sensitivity of gas sensors. Since sensing reactions take place mainly on the surface of the sensitive material [21,22,23,24], the control of the size of the semiconductor materials is one of the first requirements for enhancing the sensitivity of the sensor. Apart from these factors, morphology also plays a critical role in governing sensing performance [25,26,27,28,29]. Therefore, many efforts have been focused on the synthesis of ZnO nanostructures with different morphologies, such as nanoparticles [30], nanorods [31], nanowires [32], nanotubes [33], nanofibers [34], nanoflowers [35], and hierarchical nanostructures [36]. These nanostructured ZnO materials have higher surface-to-volume ratios compared with the bulk material, which leads to there being more active sites for gas absorption and facilitates charge transfer, thereby improving sensing performance. Recently, numerous efforts have been made to investigate the relationship between the morphology and sensing properties of ZnO nanostructures [37,38,39,40,41]. For example, Agarwal et al. [35] synthesized two types of ZnO nanostructures, ZnO nanorods and flower-like ZnO nanostructures, using a hydrothermal method. They reported that compared with nanorods, nanoflowers have a greater surface area and more surface defects. Due to these differences, flower-like ZnO is able to adsorb more target gas molecules, resulting in an enhanced gas response. Several researchers have studied the use of ZnO nanorods for monitoring H2S gas, and their findings indicate an improved capacity to detect H2S over other gases as well as showing an increased response and selectivity through the use of ZnO nanorods compared with bulk ZnO material [42,43]. In order to explore morphology-dependent gas-sensing properties, Zhang et al. [44] prepared ITO materials with various morphologies, including film, nanoparticles, nanorods, and nanowires, using a sputtering method. The results of this study indicated that compared with the other materials, the nanowires possess a larger specific surface area, a greater number of oxygen vacancies, and well-defined electron transport pathways, so their sensing properties are the best. Furthermore, by adjusting the density of nanowires, their sensing performance for ethanol gas was greatly enhanced. Compared with other morphologies of ZnO nanostructures, ZnO NWs have recently drawn a large amount of interest because of their distinctive geometric characteristics, high surface-to-volume ratio, well-defined electron transportation direction, and lower agglomeration tendency. These features are able to enhance the electron flow and affect the reaction between surface-adsorbed oxygen and gas molecules, thereby improving the sensing performance [45,46,47,48]. Up to now, there have been many reports on the gas-sensing behavior of ZnO NWs for various gases, which have exhibited excellent sensing performance [49,50,51,52]. The majority of these ZnO gas sensors, however, are based on a single NW or tangled NW membrane with no alignment. The vertically well-aligned NW arrays can provide a simple matrix for studying the average effect of assembled NWs. However, so far, to the best of our knowledge, little or no work has been reported on the application of vertical ZnO NWs on the Si substrate for NO2 sensing. Recently, various methods have been employed for the synthesis of ZnO NWs, including the hydrothermal [53], thermal evaporation [54,55], chemical vapor deposition (CVD) [49], physical vapor deposition [56], and metal organic chemical vapor deposition (MOCVD) methods [57,58]. Among these methods, thermal evaporation is frequently employed due to its ease of operation, environmental friendliness, ease of scaling up, relatively low-cost process, etc. Moreover, with the use of this technique, the as-prepared ZnO NWs show good quality [59,60]. Therefore, the purpose of this study is to synthesize and explore the relationship between the optical properties and gas-sensing performance of ZnO NWs using the thermal evaporation method.

2. Materials and Methods

2.1. Fabrication of ZnO Nanowires

The well-aligned ZnO NWs were grown via thermal evaporation deposition in a horizontal tube furnace (OTF-1200x-STM, MTI Corp., Richmond, CA, USA) with an inner diameter of 720 mm and a heating zone of 400 mm. Silicon wafers (Si (100)) with thickness of 500 μm (Okemetic Co., Ltd., Tokyo, Japan) and size of 1 cm × 1 cm were used as the substrate for the growth of ZnO NWs. Before the substrates were put inside the chamber for growth, they were chemically etched with H3PO4 (85%, Merck Chemicals Co., Ltd., Darmstadt, Germany) solution for 60 s to remove the native oxide layer (SiO2), then sonicated with a mixture of acetone, methanol, and deionized water in a sonication bath (Elma Select 60) for 10 min, and finally dried by air. The cleaned Si (1 cm × 1 cm) substrates were placed on top of an alumina boat with a diameter and length of 1.5 and 4 cm, respectively, containing about 0.25 g high-quality metallic zinc powder (75 μm, 99.99%, Sigma-Aldrich, Burlington, MA, USA), and then put at the center of the furnace, where the temperature is highest. The vertical distance between the zinc source and the substrate was about 2.5 mm, with a downstream separation of 15 mm. The temperature inside the furnace was raised from 20 °C to the reaction temperature of 620 °C at a rate of 20 °C per min with Ar (99.99%, Bao Khanh Co. Ltd., Ha Noi, Vietnam) at a flow rate of 350 mL/min The zinc source was thermally vaporized to grow ZnO NWs at atmospheric pressure under Ar at a flow rate of 350 mL/min for 90 min at 620 °C. After the reaction, the equipment was switched off and quartz tube was cooled naturally to room temperature under Ar at a flow rate of 100 mL/min.

2.2. Material Characterization

The crystal structure and phase composition of synthesized samples were determined via X-ray diffraction using a Bruker D8 Advanced diffractometer (Rigaku, Tokyo, Japan) with CuKα radiation at λ = 1.54178 Å, operating at 40 kV voltage and 200 mA current. Data were taken for the 2θ range of 25 to 75 degrees with a step of 0.02 degree and a scan step time of 25 s. The surface morphology and compositions of the ZnO NWs were examined using a scanning electron microscope (JEOL JSM-5900 LV SEM, Tokyo, Japan) operated at an accelerating voltage of 20 kV and equipped with an energy-dispersive spectroscopy (EDS) microanalysis. The microstructure of the NWs was observed with a high-resolution electron microscope (HRTEM, JEM-2010, JEOL Ltd., Tokyo, Japan) operated at an accelerating voltage of 200 kV. The elemental components and bonding configuration of the ZnO samples were investigated using an X-ray photoelectron spectroscope (XPS, VG Multilab ESCA 2000 system, East Grinstead UK) with a monochromatized Al K X-ray source (hv = 1486.6 eV). Data analysis was carried out with XPSPEAK41 software using mixed Gaussian–Lorentzian functions after Shirley background correction. The photoluminescence (PL) measurements were performed with a laser Raman spectrometer (HORIBA Jobin Yvon, iHR550) at room temperature, using a He-Cd laser-line with an excitation wavelength of 325 nm and at a laser power of 25 mW. For the sensing measurements, a thin (~100 nm) Au film was deposited on the ZnO NW samples via direct current (DC) magnetron sputtering to form electrodes using an interdigital electrode mask. The electrode pattern consisted of seven Au electrode fingers, each of them being 7 mm long and 0.5 mm wide, with 0.5 mm spacing. The gas-sensing characteristics were determined with a Keithley source-meter model no. 2400 connected to computer. Two mass flow controllers (MFC-3660) were applied to adjust the NO2 gas concentration and carrier gas (dry air). A precise concentration of NO2 was produced via dilution from the standard concentration of NO2 (0.1% NO2 + 99.9 N2), as shown in Table 1. The concentration of the diluted NO2 was calculated using Equation (1):
C d u l i t e d = C o F 1 F 1 + F 2
where F1 and F2 are flow rate of NO2 and carrier dry air, respectively, and C0 is 0.1%. Total gas flow (target gas and dry air) was kept constant at 500 ppm. The resistance of the sensor in dry air or in the target gas was measured at 200 °C when a potential difference of 1 V was applied between the Au (~100 nm) electrodes. Sensitivity is one of the important factors in determining gas-sensing performance. Mathematically, sensitivity (S) of the ZnO NW sensor is defined as (Rg/Ra), where Ra and Rg are the electrical resistances of the sensor in air and target gas, respectively. The response time (tresponse) is defined as the period in which the electrical resistance of the sensor reaches 90% of the response value upon exposure to the target gas, while the recovery time (trecovery) is defined as the period in which the electrical resistance of the sensor returns to 10% of the response value after the target gas is removed [61]. The sensing characteristics were investigated at NO2 concentrations of 2–10 pm, operating at temperature of 200 °C under atmospheric pressure.

3. Results and Discussion

The crystalline structure and phase composition of the synthesized samples were examined using powder X-ray diffraction. A typical XRD pattern of the obtained ZnO NWs is shown in Figure 1. From the pattern, it can be seen that all diffraction peaks at 2θ~31.8, 34.6, 36.4, 47.6, 56.7, 62.8, 67.8, and 72.5 can be indexed to the reflection from the 10 1 ¯ 0 , 0002 ,   10 1 ¯ 1 , 10 1 ¯ 2 ,   11 2 ¯ 0 ,   10 1 ¯ 3 ,   11 2 ¯ 2 , and (0004) crystal planes of the hexagonal wurtzite ZnO structure with the cell constants of a = 3.249 Å and c = 5.206 Å (JCPDS card number: 36-1451, P63mc space group) [62,63]. The lattice constants of the prepared ZnO NWs can be calculated as a = 3.249 Å and c = 5.185 Å with the c/a ratio = 1.5957. The unit cell volume for deposited ZnO NWs was estimated by using [64]: V = 3 2 a 2 c , where a and c are the lattice constants of the ZnO NWs. Accordingly, the calculated value of the unit cell volume for ZnO NWs is 47.4 Å3. Therefore, the lattice parameters (a = b, c, V) estimated for synthesized NWs are in good agreement with the reported crystallographic data for ZnO [62,63,65]. The strongest peak intensity at the (0002) plane suggests that the ZnO NWs are preferentially oriented in the c-axis direction or in a direction perpendicular to the substrate surface. No traces of zinc, impurities, or substrates are detected from this pattern, indicating that the ZnO NW samples were composed of a pure ZnO hexagonal phase. It is widely known that the hexagonal crystal structure of ZnO is composed of an alternating arrangement of tetrahedrally coordinated Zn2+ and O2− ions along the c-axis [66]. The most common crystal faces found on the one-dimensional ZnO nanostructures are polar Zn-terminated (0001) and O-terminated 000 1 ¯ as well as nonpolar 01 1 ¯ 0 and 2 1 ¯ 1 ¯ 0 facets [67]. Therefore, adjusting the growth rate along the different directions can induce anisotropic growth of ZnO. Kinetic studies have shown that incoming precursor species tend to preferentially adsorb on the polar surfaces to decrease the surface energy because the polar surfaces are less thermodynamically stable. Accordingly, the higher surface energy facets grow faster than the others, and they usually have a smaller surface area. The sequence of the surface energy (E) of the facets in different crystallographic directions of ZnO is commonly E[0001] > E 10 1 ¯ 1 ¯ > E 10 1 ¯ 0 > E 10 1 ¯ 1 ¯ > E [ 000 1 ¯ ] , which is the same order as the crystal growth velocity, indicating the fastest growth rate in the [0001] direction [68]. Thus, in the case of ZnO NWs, the fastest growth rate is along the c-axis, resulting in the anisotropic growth of nanowires. Meanwhile, ZnO NWs with large areas of nonpolar 01 1 ¯ 0 and 2 1 ¯ 1 ¯ 0 facets are more energetically favorable [67]. This explanation is supported by the XRD results, in which the (0002) peak intensity is much higher than the others, indicating that ZnO NWs were formed along the c-axis in the [0001] direction (i.e., with predominantly exposed polar (0001) facets).
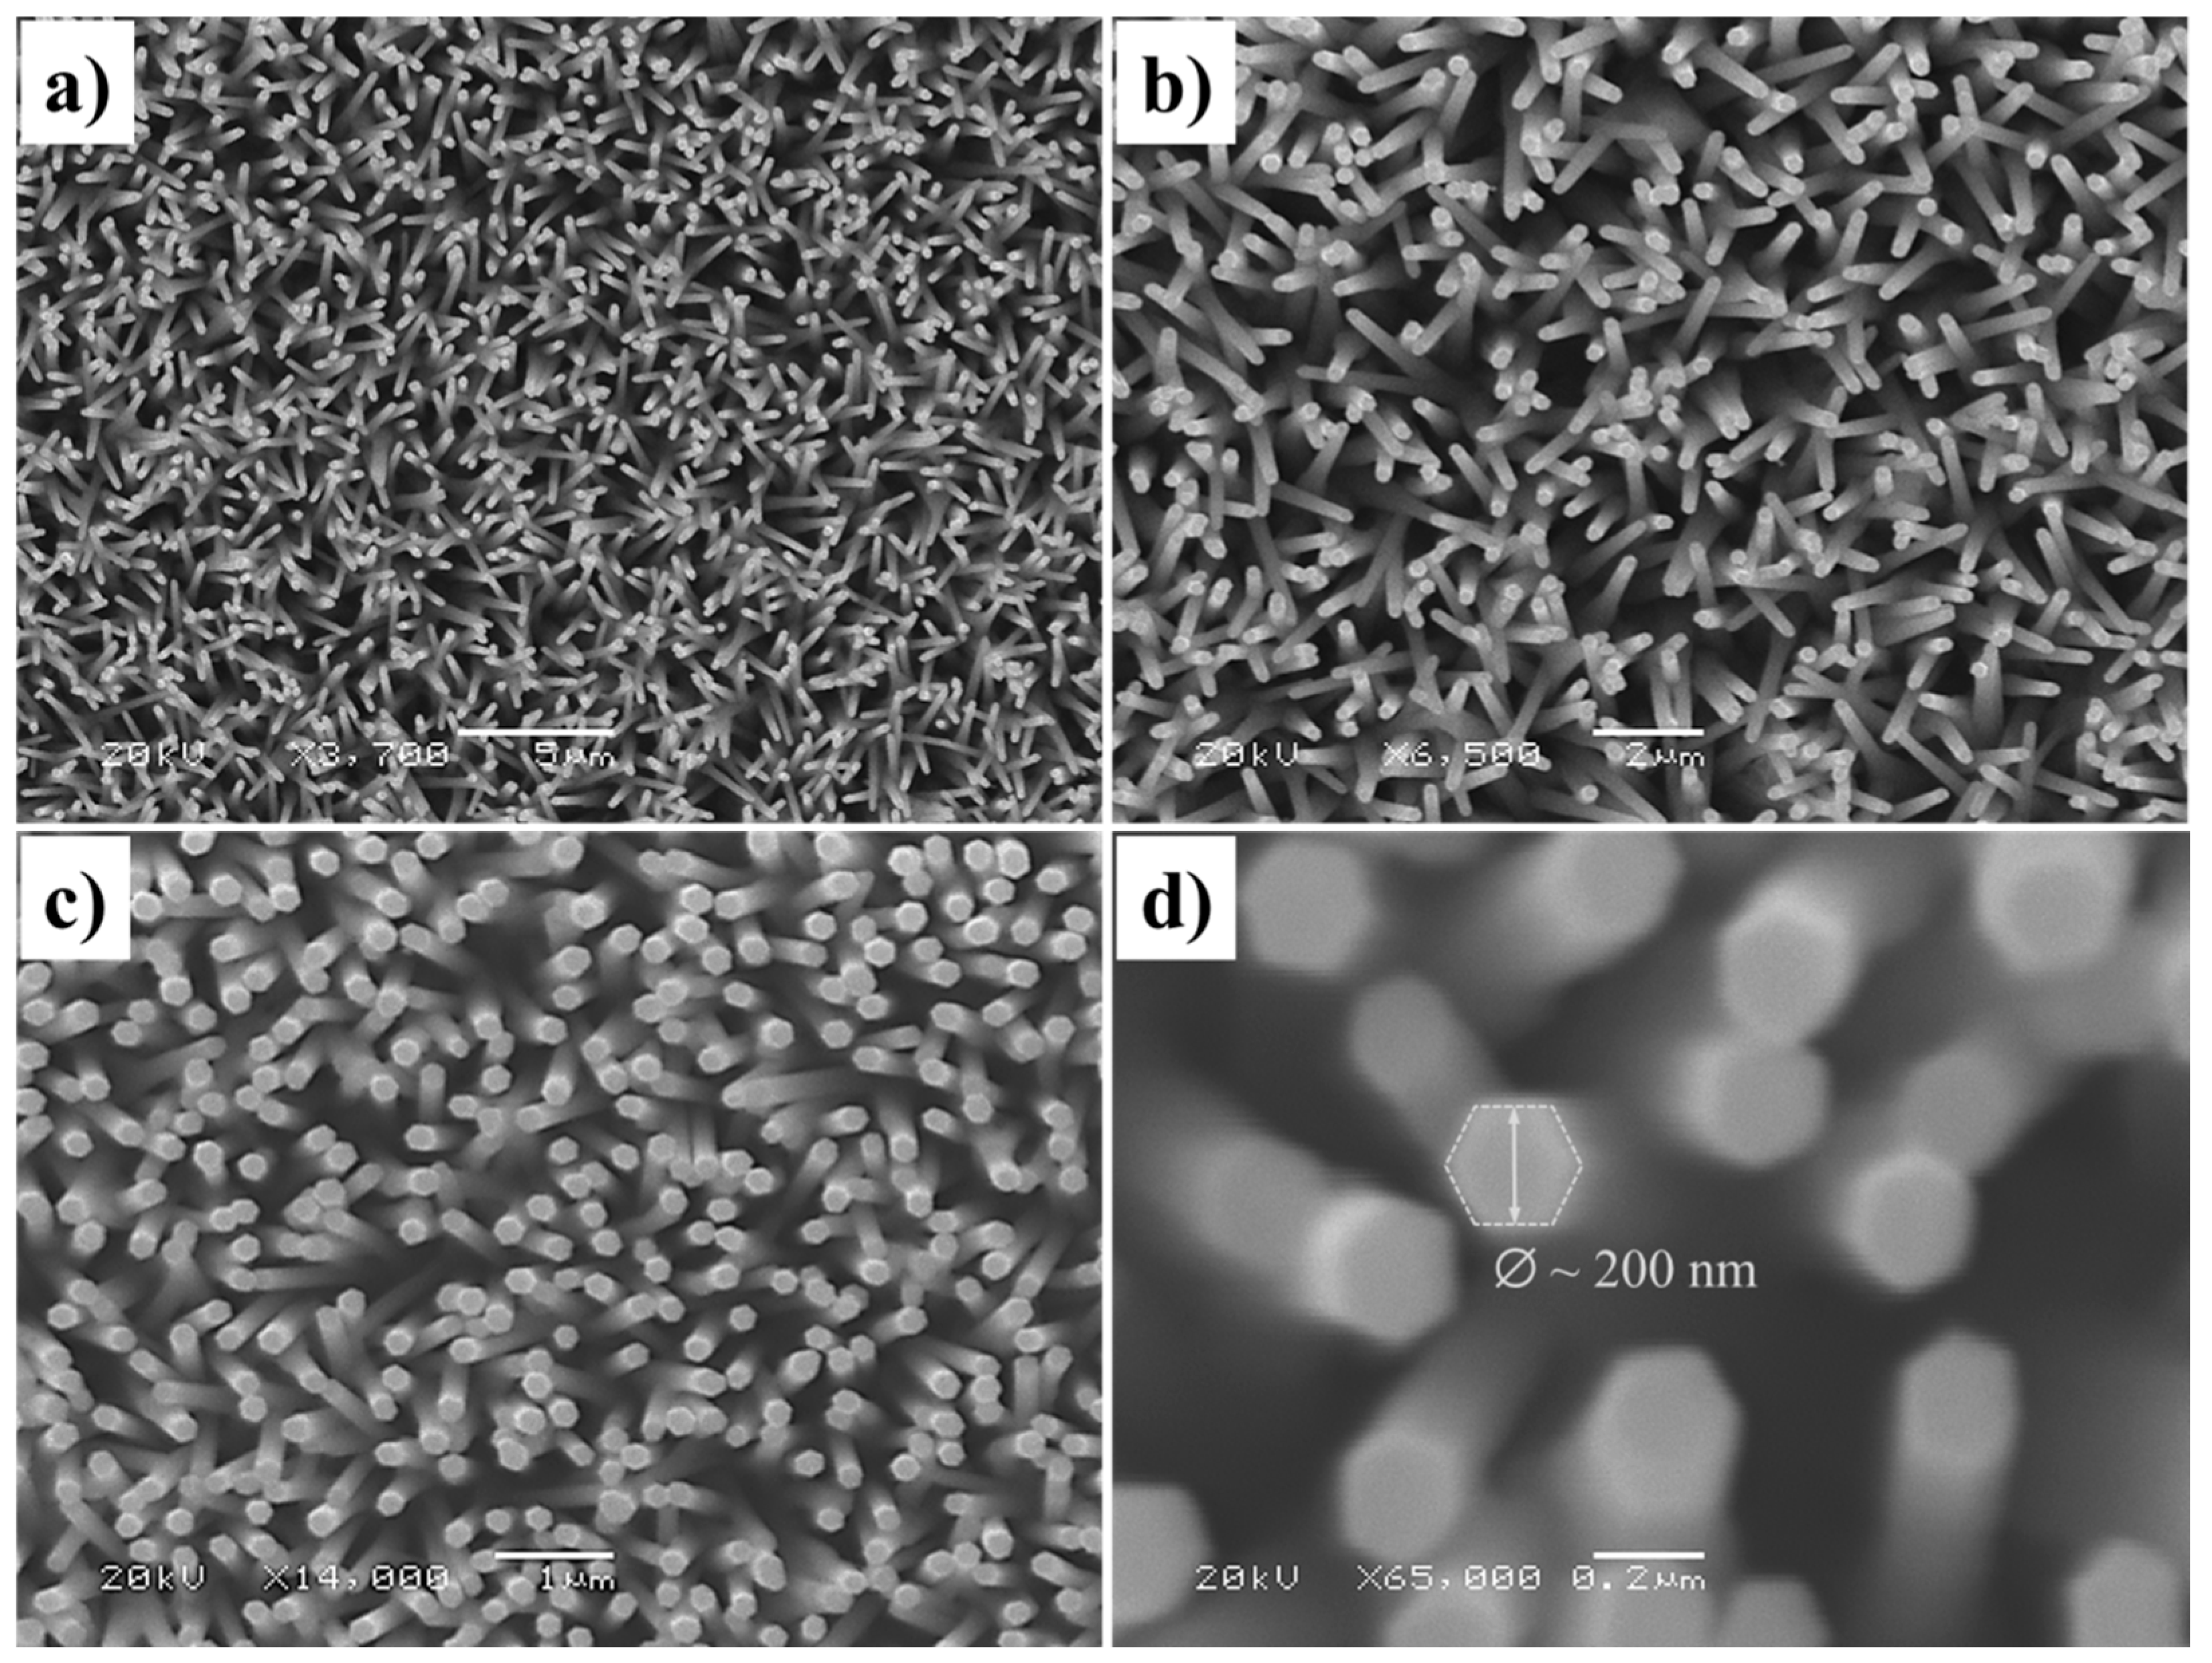
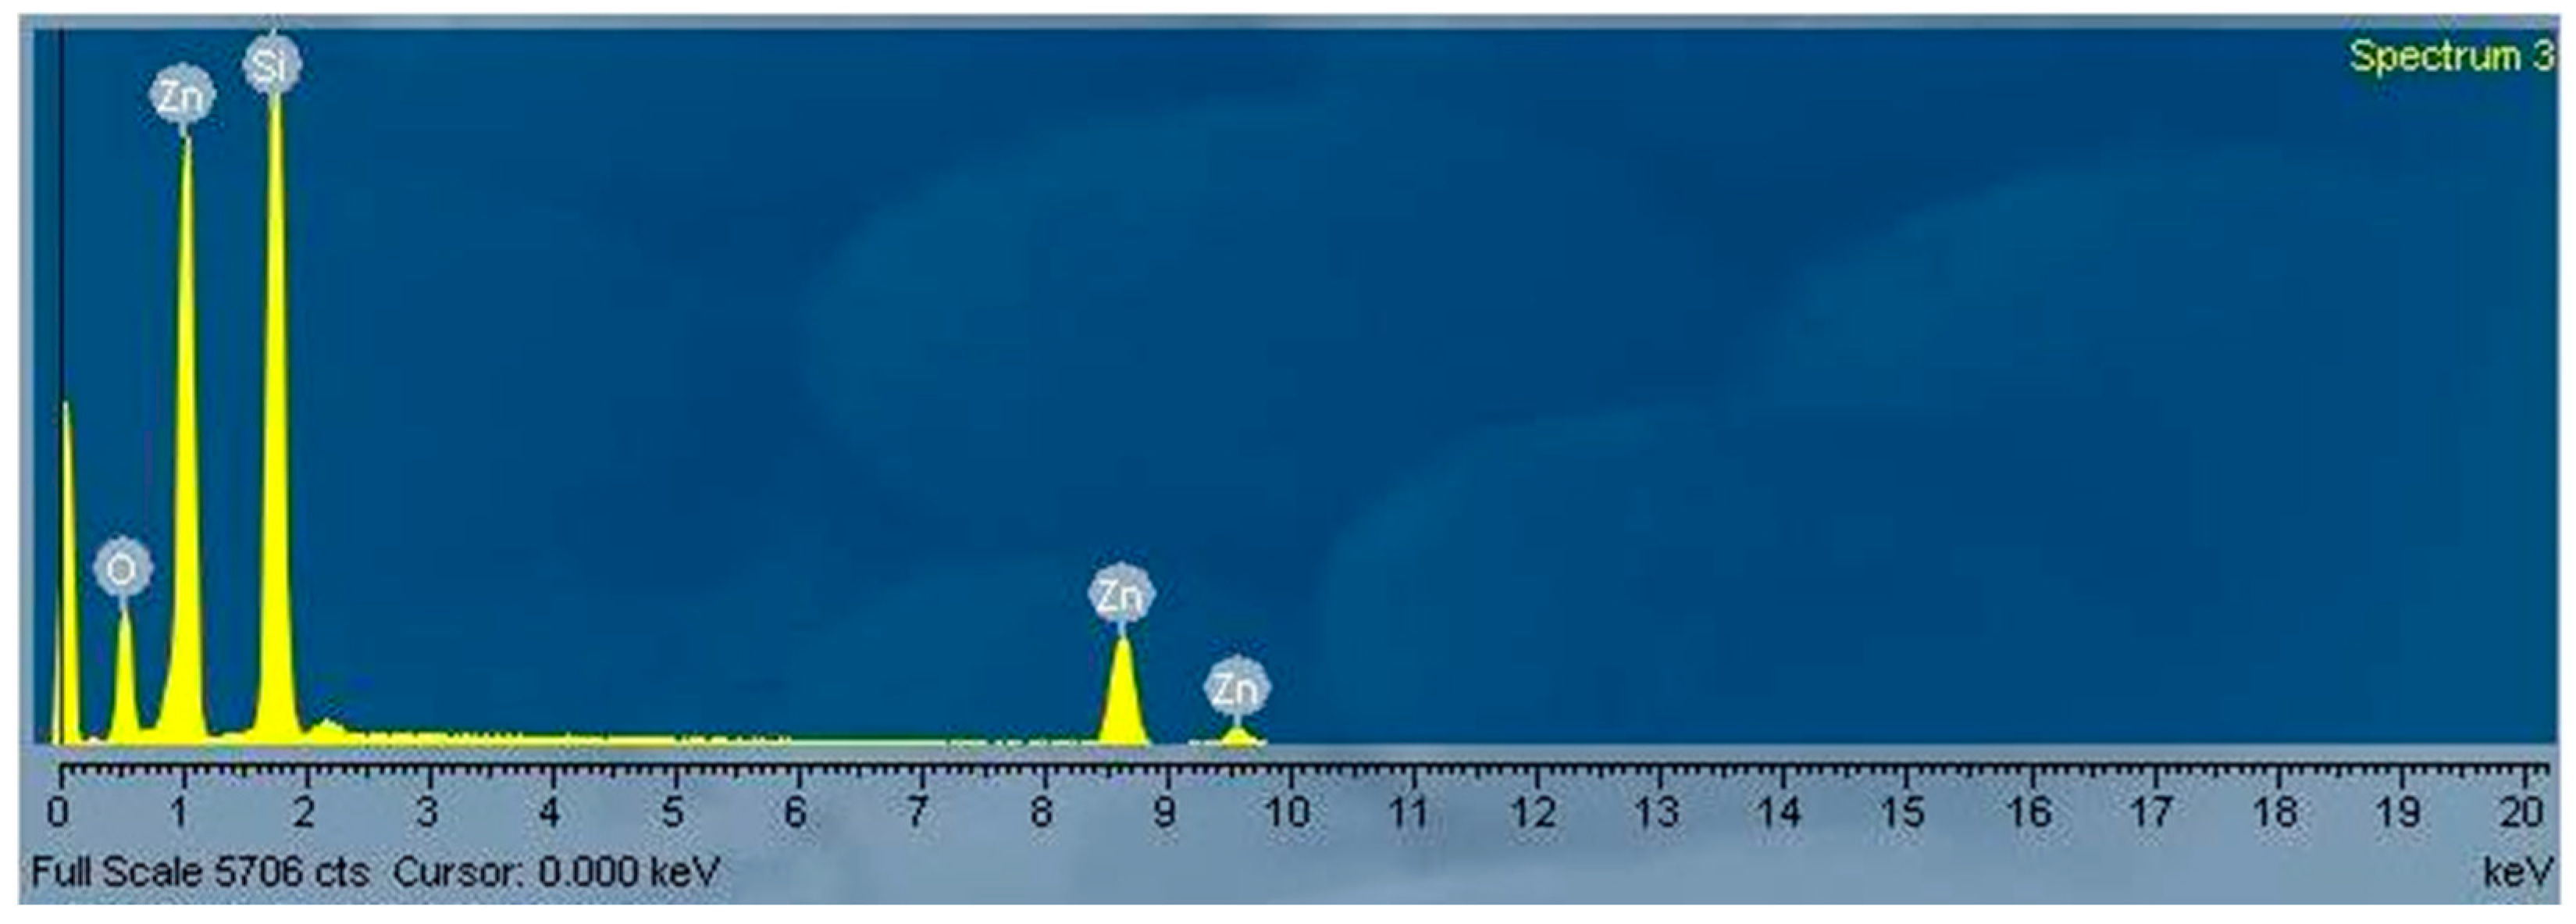
The morphology of the as-prepared samples was investigated using FESEM. Figure 2a–d show typical FESEM images of the obtained ZnO NWs at different magnifications. These sample ZnO NWs were synthesized at a temperature of 620 °C with a synthesis time of 90 min. Figure 2a,b show the low-magnification FESEM images of the deposited ZnO NWs and confirm that large-area, uniform, and dense NWs are vertically grown across the surface of the substrate. The NWs possess a smooth and clean surface along their entire lengths. Figure 2c,d reveal high-magnification images of ZnO NWs, indicating that the top of the NWs is completely flat with a perfect hexagonal structure and the diameter of the NWs is in the range of 160–200 nm with an area density of ~6.85/μm2. Figure 3 illustrates the typical EDS spectrum of the as-grown ZnO NWs, indicating that there is no evidence of metallic elements in the NWs, and the as-prepared ZnO NWs exclusively include zinc and oxygen components. The existence of a Si peak in the spectrum is attributable to the Si substrate.
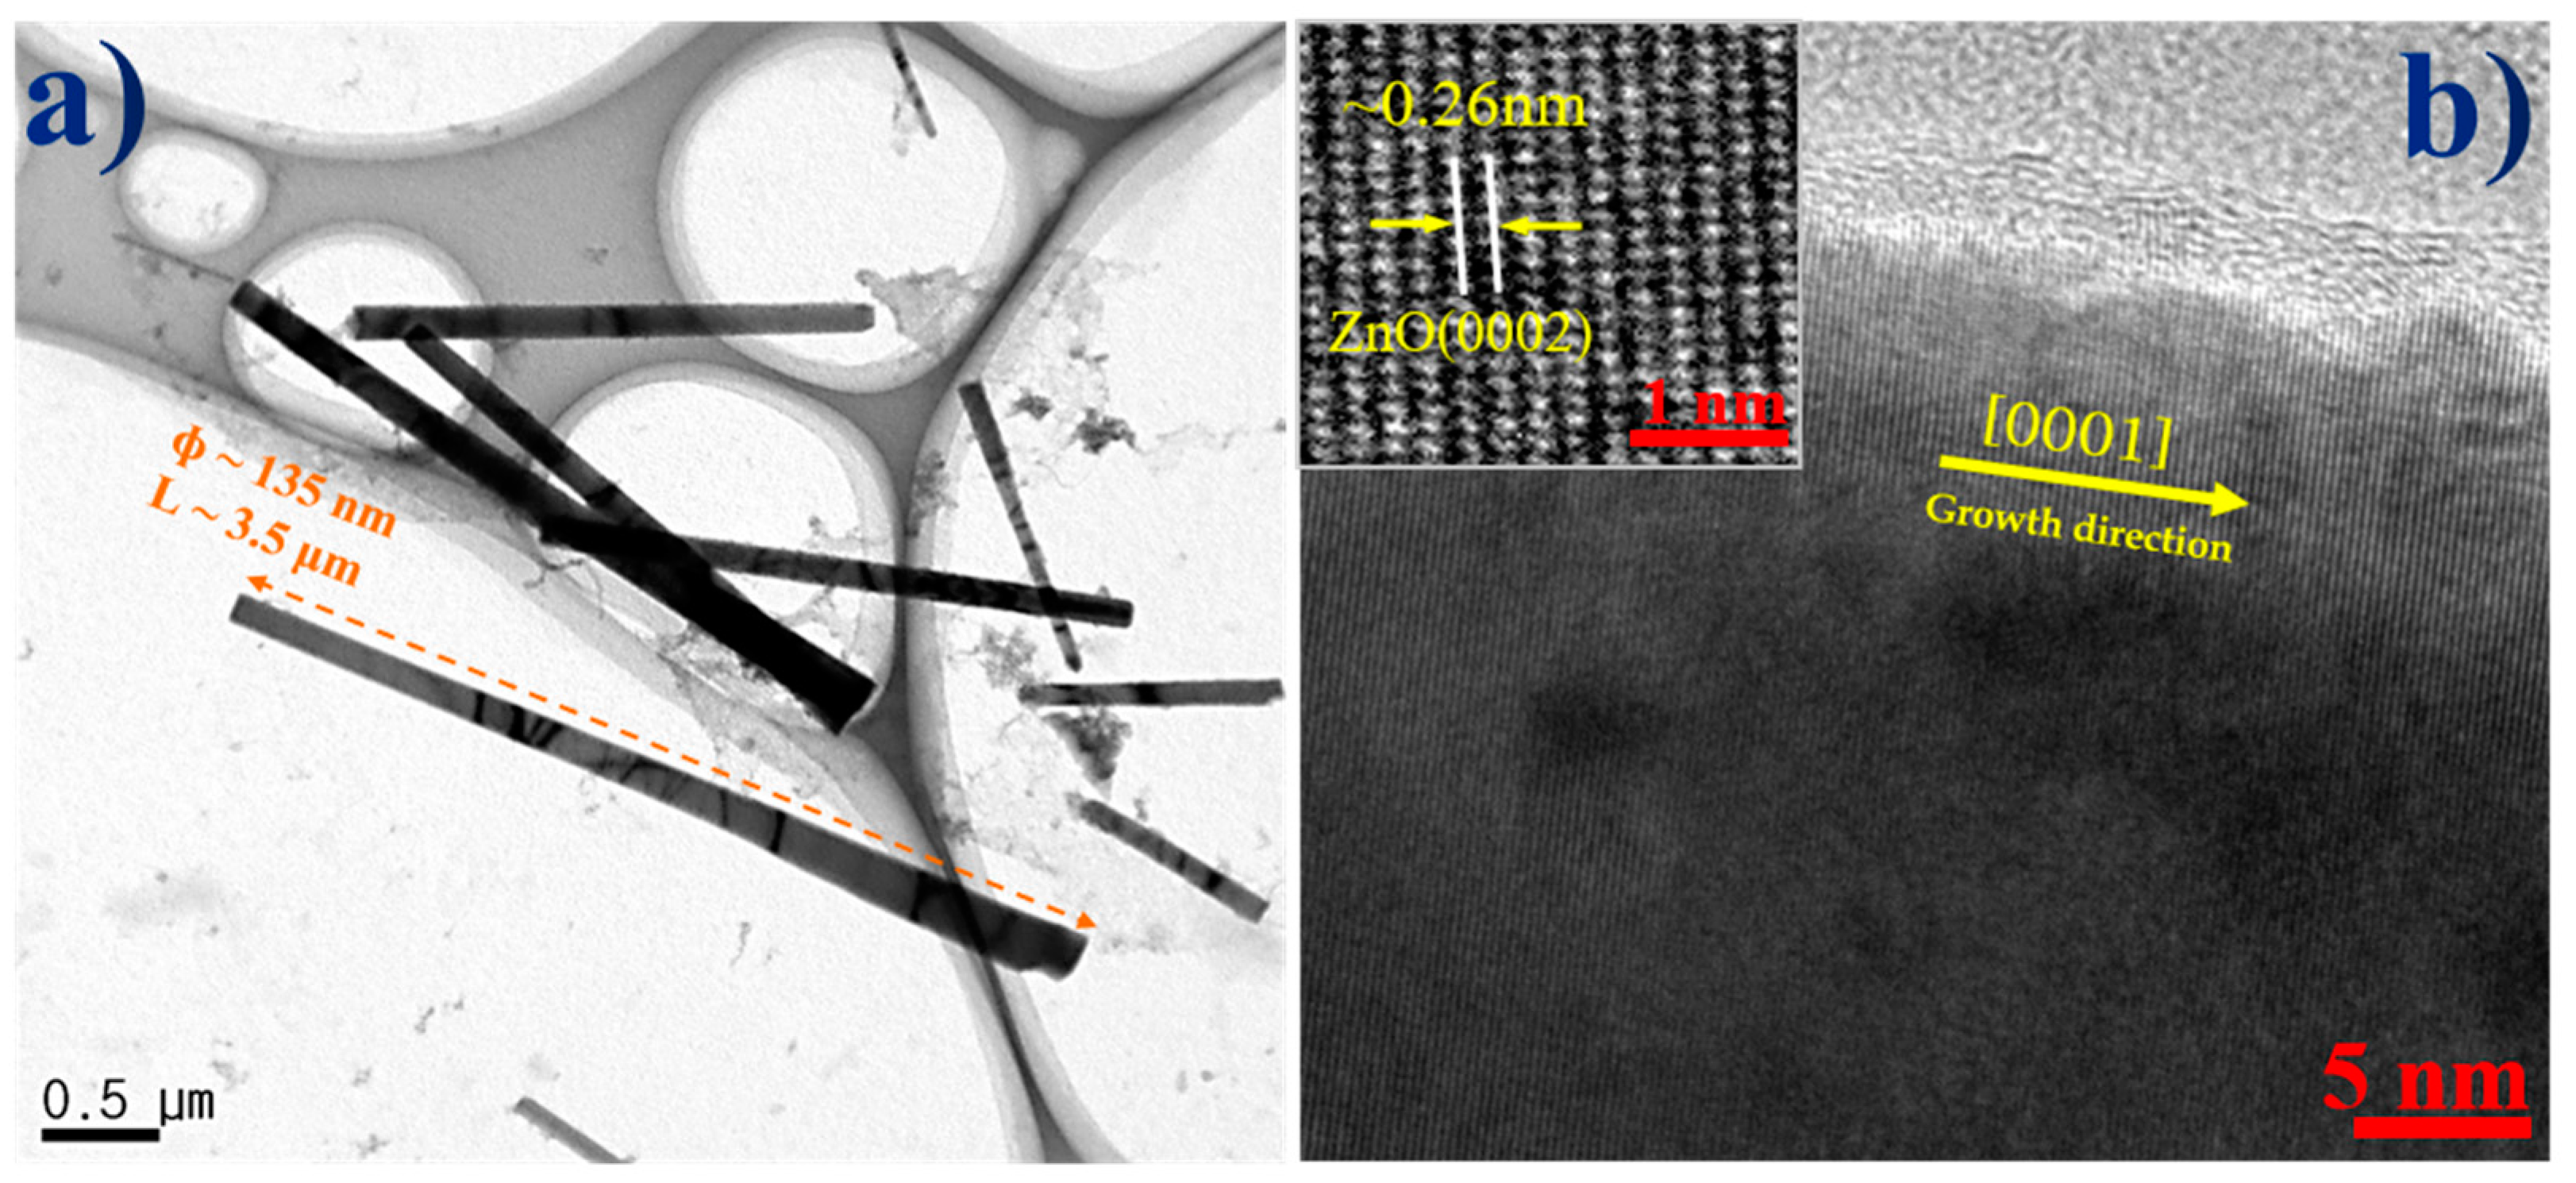
Detailed structural features of the as-prepared ZnO NWs are shown in Figure 4a,b. Figure 4a shows that the obtained ZnO NWs possess a very smooth surface and a relatively straight morphology with an average diameter of ~135–160 nm and a length of ~1.5–3.5 μm. A typical HRTEM image is shown in Figure 4b. It can be clearly observed that the ZnO NW contains no defects such as dislocations or stacking faults, indicating that it has a clean surface structure with excellent quality. The inset in Figure 4b is a lattice-resolved HRTEM image of a segment of a single ZnO NW. It can be clearly seen that the ZnO crystal lattice is well oriented and there are no noticeable structural defects throughout the region. This indicates that the obtained ZnO NWs are structurally uniform and defect-free. However, it should not be assumed that the as-synthesized ZnO NW arrays are free of other defects, such as vacancies and gaps, which may be invisible in HRTEM observations. As seen from the inset in Figure 4b, the measured lattice spacing of the ZnO NW was around 0.26 nm, corresponding to the distance between two (0002) crystal planes, indicating that the ZnO NWs are grown in the [0001] direction. This is consistent with the XRD results.
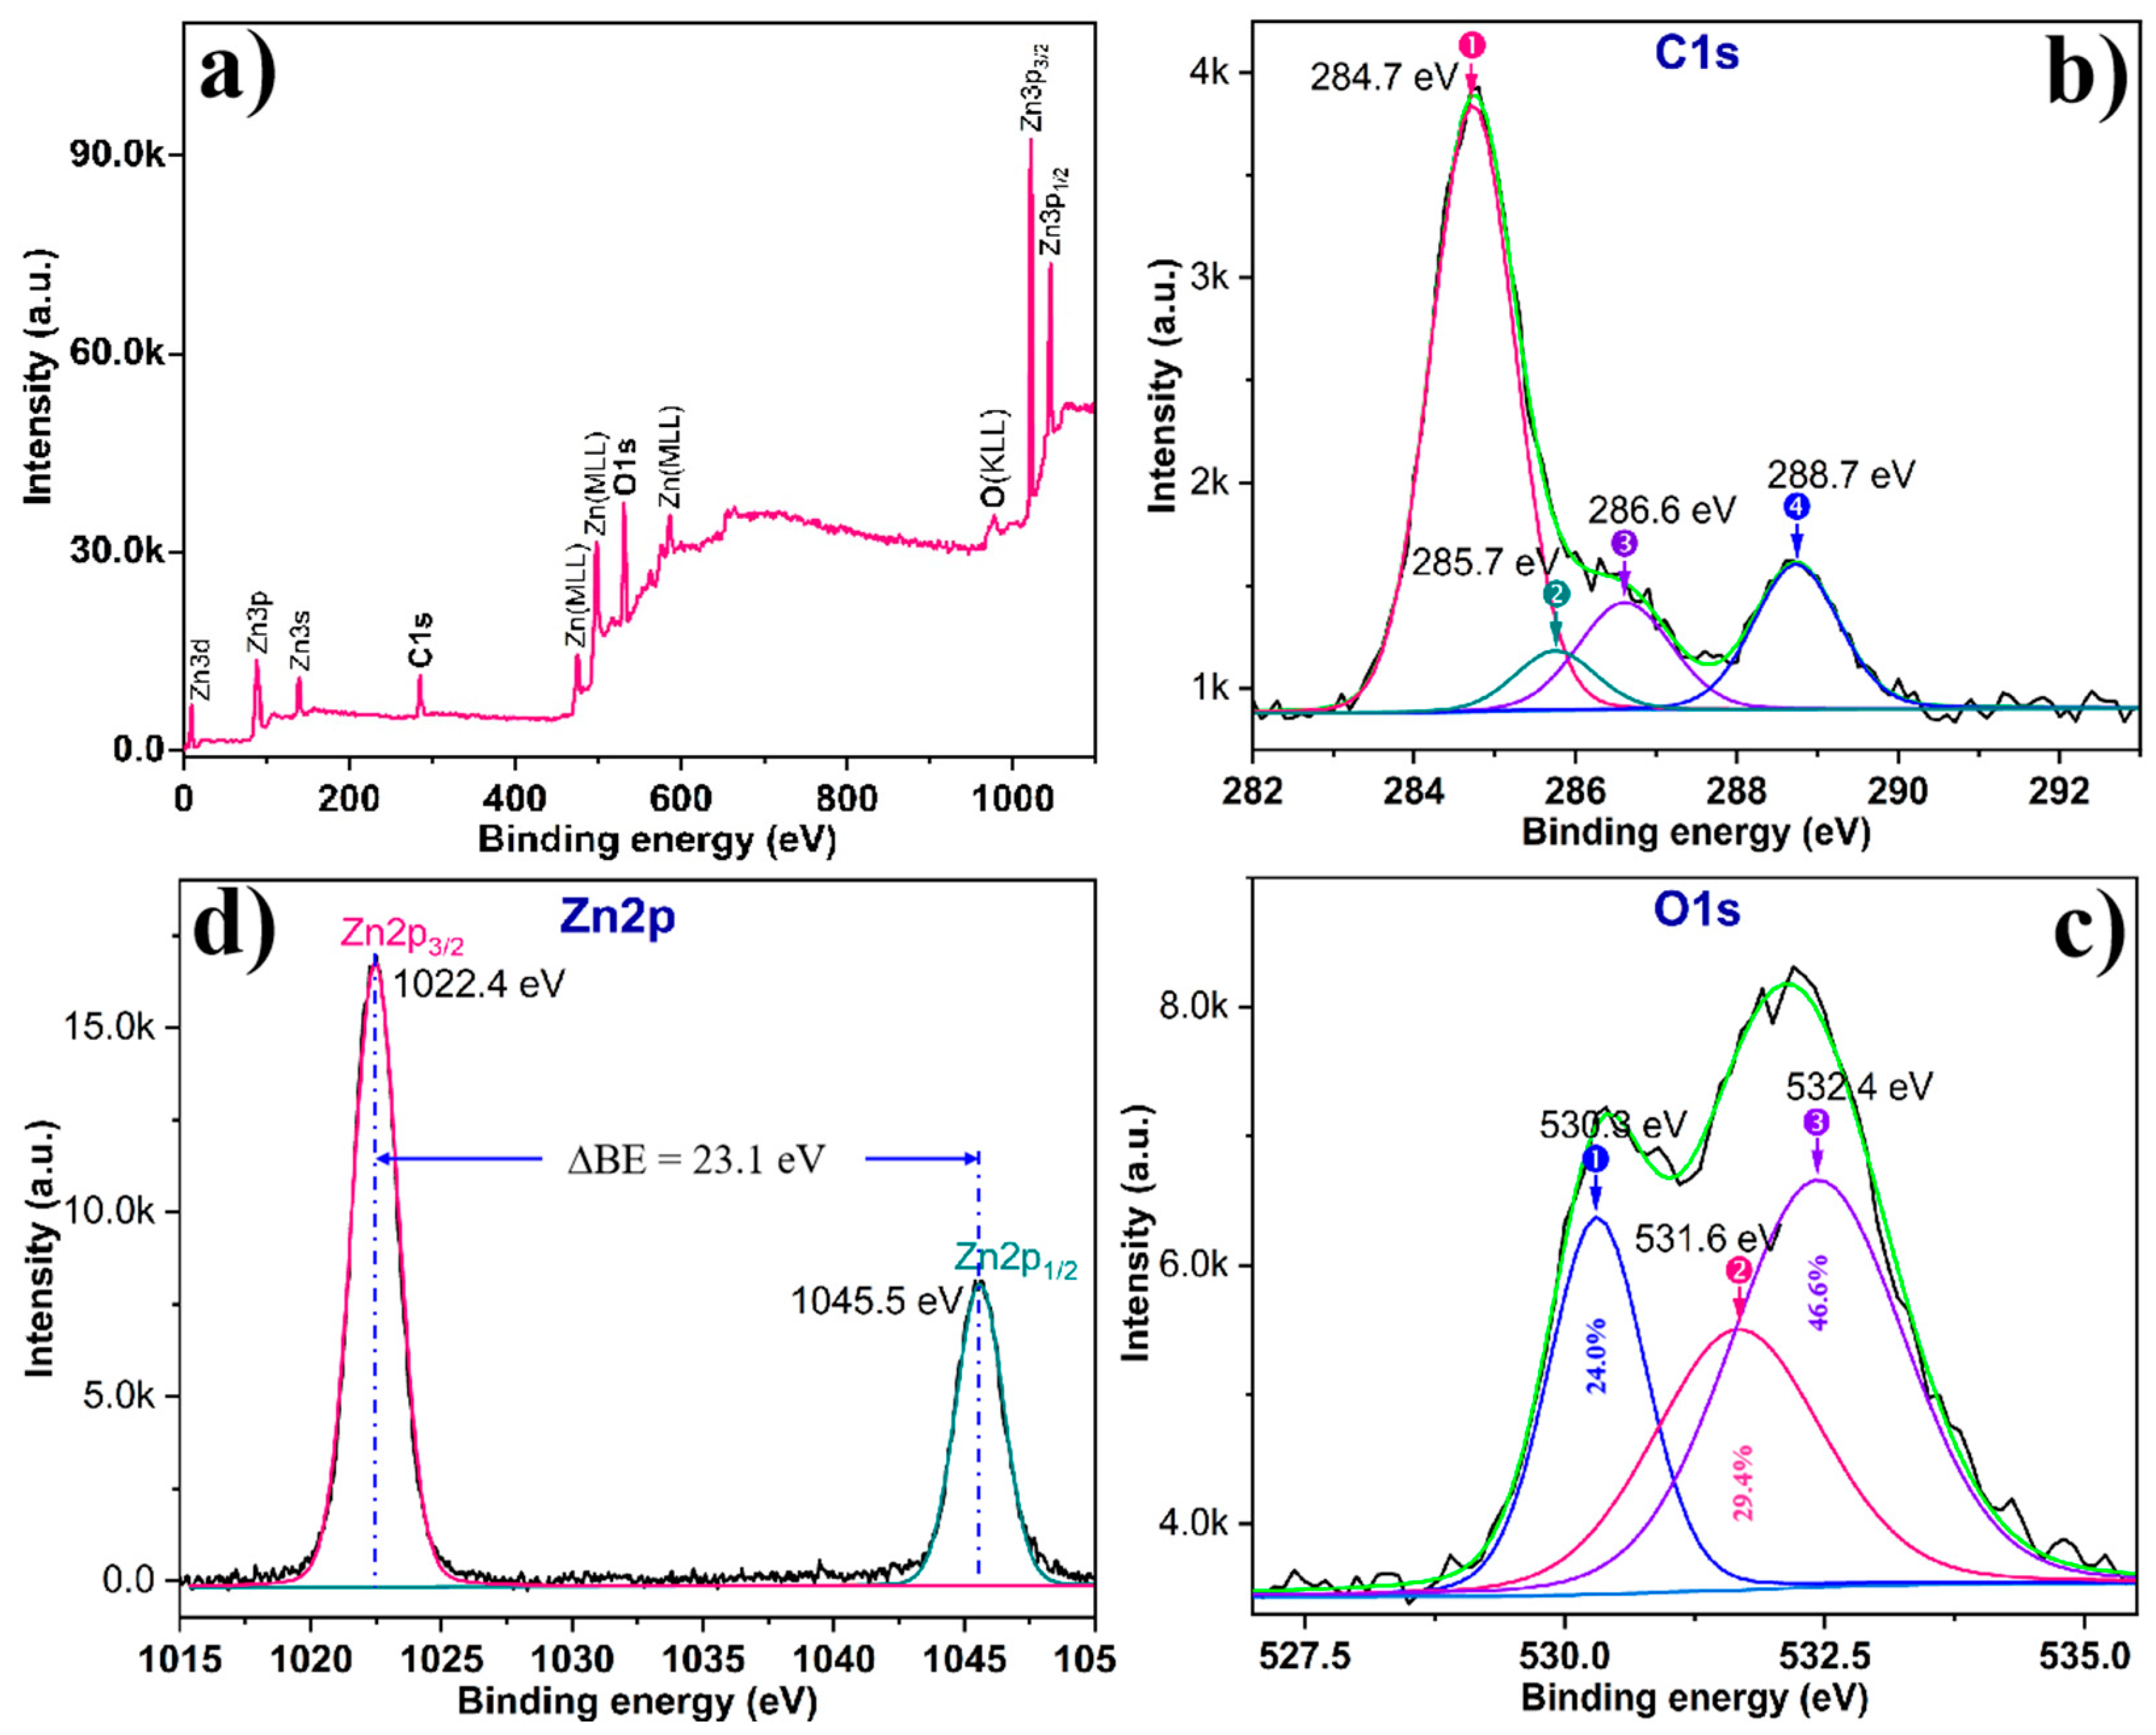
The surface chemical compositions and their corresponding valence states of the as-prepared ZnO NWs were further investigated via XPS, and the results are shown in Figure 5a–d. All of the binding energies in the XPS analysis were corrected for specimen charging by reflecting them to the C1s peak position at ~284.6 eV [69]. Figure 5a exhibits the wide-scan XPS spectrum, from which the peaks located at ~284.4, ~533.2, and ~1021.5–1045.5 eV, corresponding to the C1s, O1s, and Zn2p core levels, respectively, can be observed clearly. Here, the peaks for Zn and O are expected to be from the ZnO material, whereas the presence of the C peak is due to the adventitious carbon contamination as well as the chemisorbed CO2 on the surface of samples when exposed to air after the growth, before they are transferred to the XPS chamber (often observed in the XPS spectra of ZnO available in the literature) [70,71]. A more detailed investigation of the chemical states of Zn2p, O1s, and C1s was carried out, taking into consideration the high-resolution scans from core-level XPS, as shown in Figure 5b–d. The XPS spectra were fitted by Gaussian–Lorentzian functions after Shirley background correction using XPSPEAK41 software. Shown in Figure 5b is the high-resolution C1s core-level XPS spectrum, which can be fitted into four components. The main peak is centered at ~284.7 eV and represents C=C bonds due to the adventitious carbon, while the peaks located at ~285.7, ~286.6, and ~288.7 eV can belong to the C-OH group, C-O group, and carbonate phase (CO2), respectively. As recorded, the high-resolution O1s core-level XPS spectrum (Figure 5c) can be deconvoluted into three peaks with binding energies of ~530.3, ~531.6, and ~532.4 eV. The peak located at ~530.3 eV (~24%) is attributed to O2− species in the lattice (OLat) of the wurtzite structure of hexagonal ZnO [72,73,74,75,76], whereas the peak centered at ~531.6 eV (~29.4%) is assigned to the O2− state of oxygen defects such as oxygen vacancies (VÖ), oxygen interstitials (Oi), or surface oxygen atoms, suggesting the formation of the nonstoichiometric ZnO. Finally, the peaks at ~532.4 eV (~46.6%) are typically related to the chemisorbed or dissociated (OC) oxygen species on the surface, such as O2, H2O, and CO2 [77,78,79]. As shown in Figure 5d, the high-resolution Zn2p core-level XPS spectrum can be deconvoluted into two peaks at binding energies of ~1022.4 eV and ~1045.5 eV, which are attributed to the spin–orbits of Zn2p3/2 and Zn2p1/2 of tetrahedral Zn2+, respectively, confirming that the oxidation state of Zn is +2 in the ZnO NWs [80,81]. The binding energy splitting between these two components (ΔBE) is 23.1 eV, which is consistent with previous studies [72].
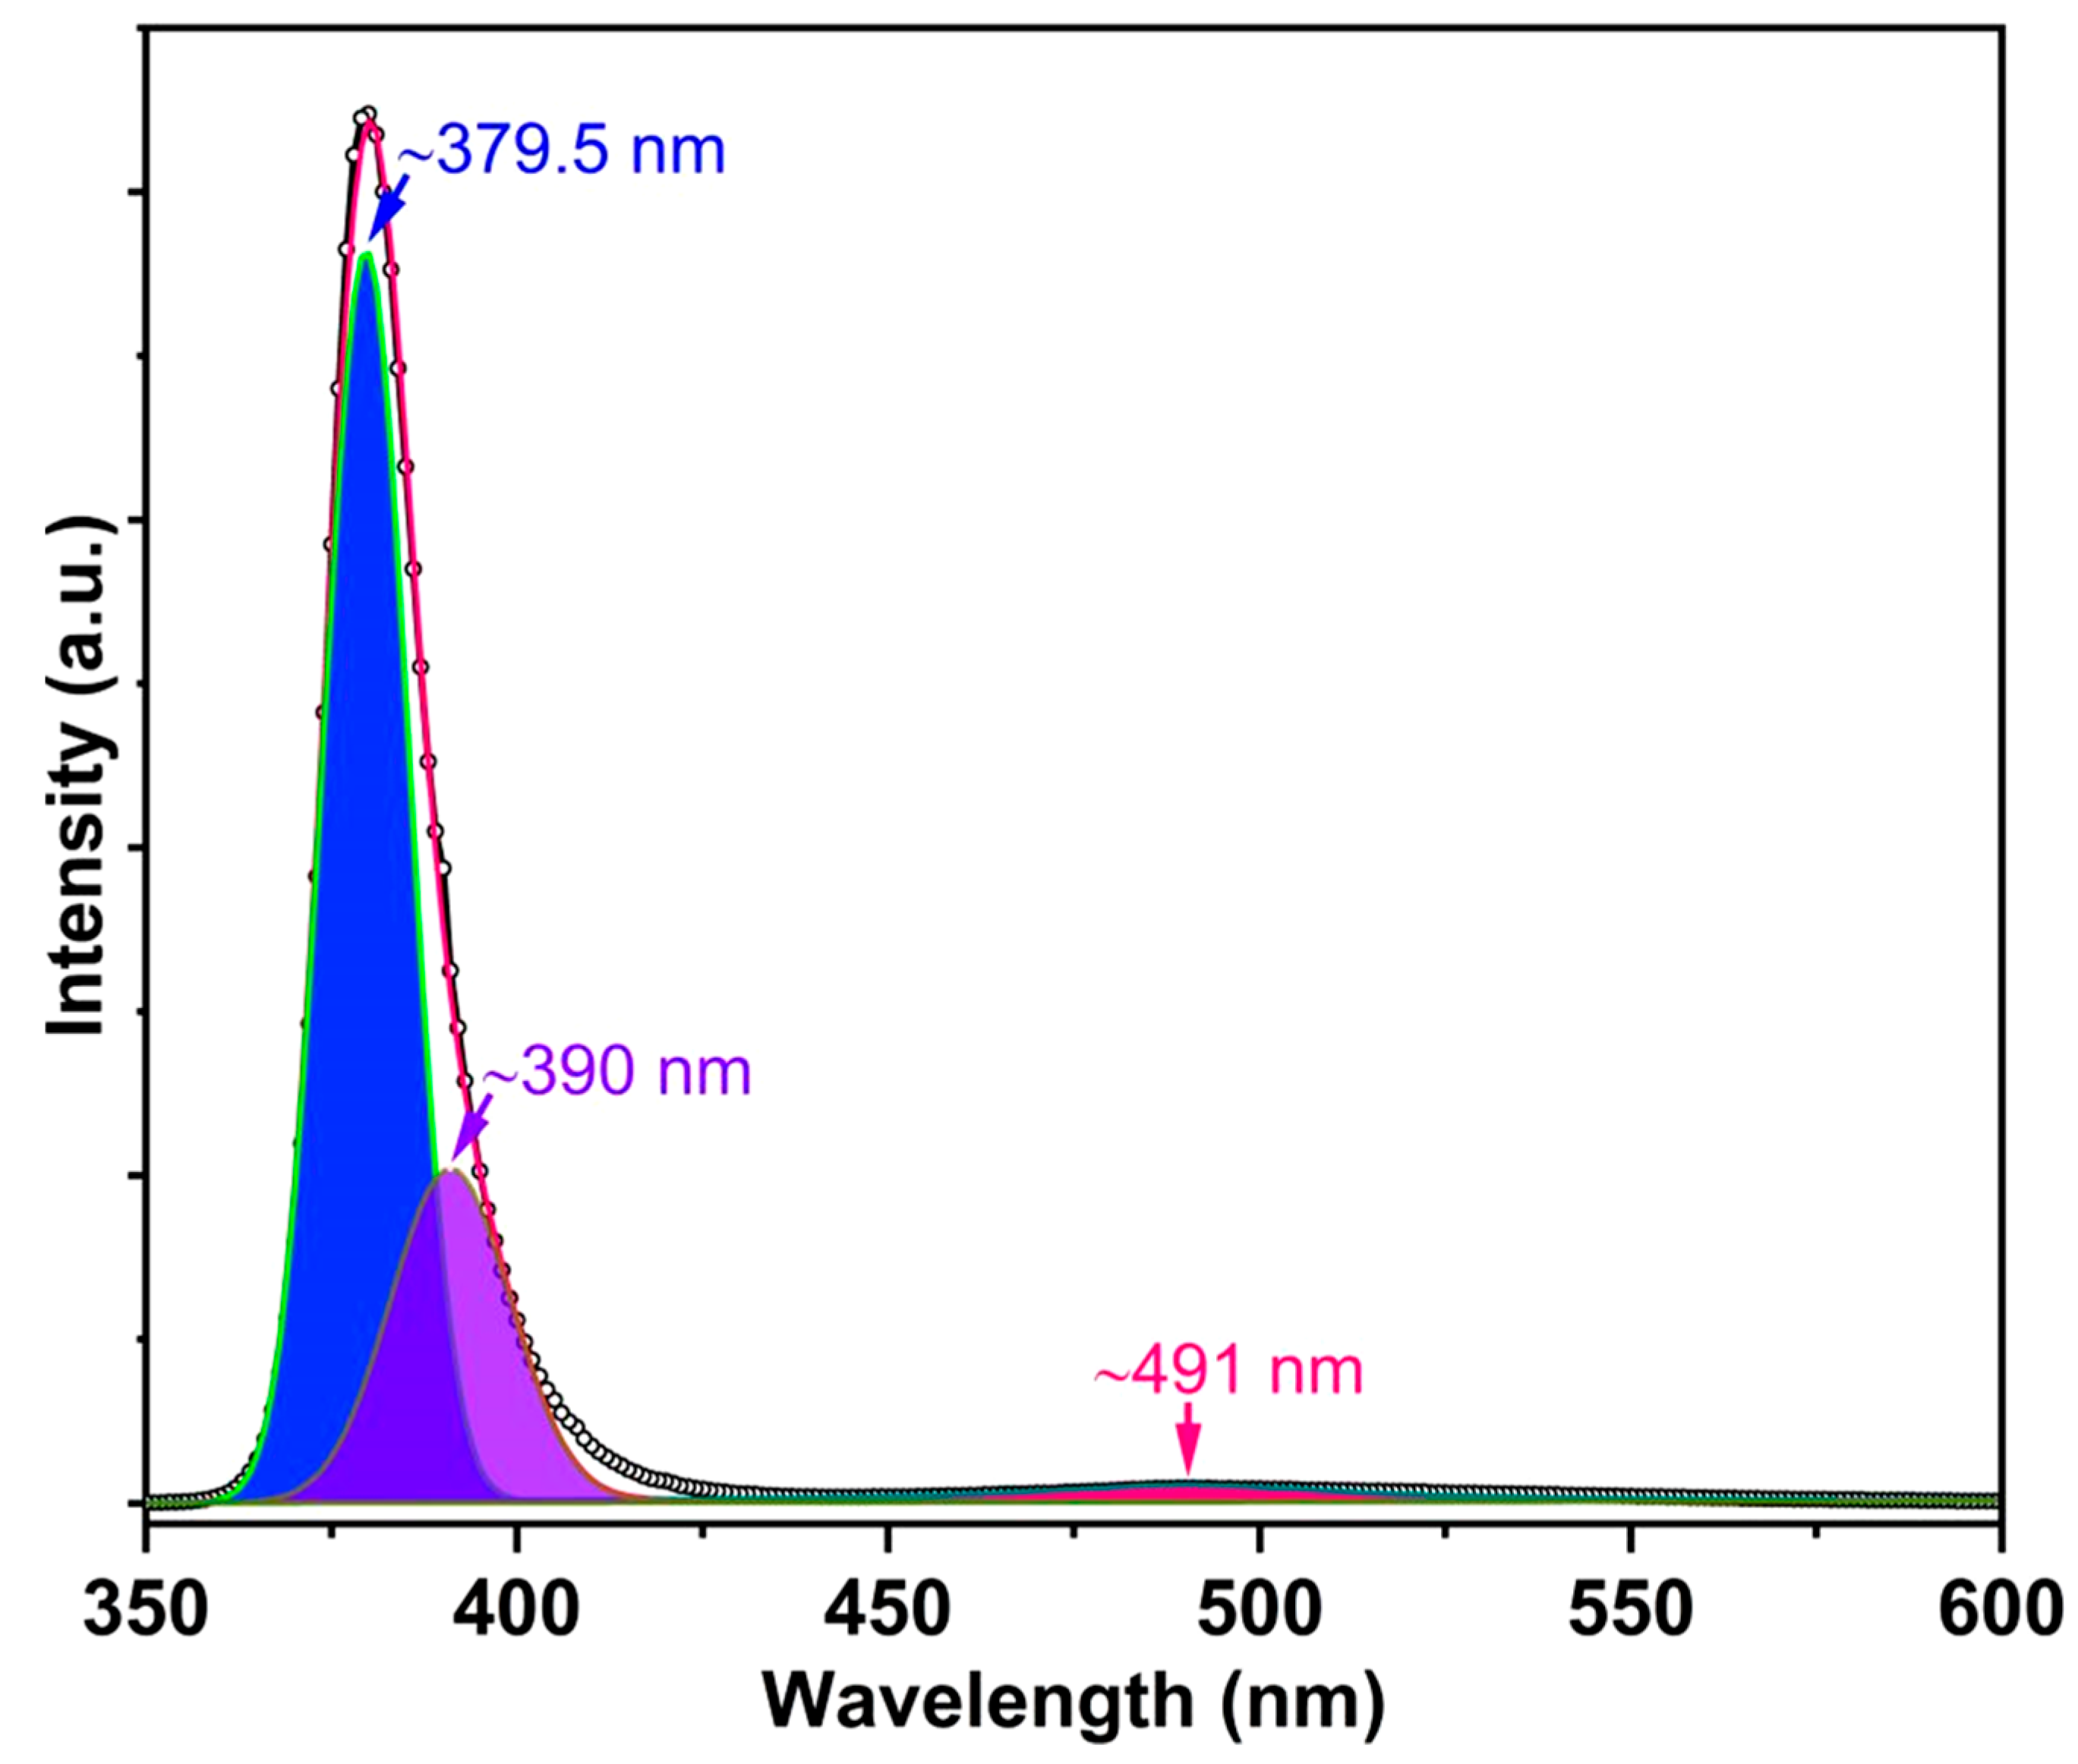
The room-temperature PL spectrum of the ZnO NWs is presented in Figure 6. The PL spectrum was deconvoluted via Gaussian–Lorentzian fitting. The PL spectrum is very useful for analyzing any possible point defects in the NWs. Figure 6 shows that ZnO NWs have a strong and narrow ultraviolet (UV) emission peak at ~379.5 nm (~3.27 eV) as well as a broad and weak visible emission band that peaks at ~491 nm (~2.53 eV). The UV emission is attributed to the recombination of free excitons between the conduction and valence bands and is called near-band-edge emission (NBE) [82]. On the other hand, the visible emission band is the so-called deep-level (DL) emission of ZnO, which consists of the emissions associated with different types of DL defects in ZnO as well as surface states of ZnO NWs, such as oxygen vacancies (VO) [83,84], zinc interstitials (Zni) [85], oxygen interstitials (Oi), zinc vacancies (VZn), and antisite oxygen (OZn) [86]. Additionally, there is a tiny PL peak at ~390 nm (~3.18 eV), which is caused by the electronic transition from Zni states to the valence band maximum [87,88,89]. The intensity ratio between the UV and DL peaks, IUV/IDL, is commonly used to estimate the defect density in ZnO [90]. Among various synthesis techniques, the ZnO NWs grown through thermal evaporation frequently reveal a very intense exciton emission [91,92,93]. The intensity ratio IUV/IDL recorded from our samples is more than 77, which is higher than those reported in most of the literature (see Table 2) [91,92,93,94,95,96,97,98,99], indicating that the prepared ZnO NWs have a high crystalline quality. The poor DL emission indicates a low concentration of DL defects in ZnO NWs produced by thermal evaporation.
The intrinsic point defects in nanostructured ZnO have been demonstrated to play a crucial role in determining the performance of electronic devices [100,101,102,103], in terms of doping control, free charge density, minority carrier lifetime, and luminescence efficiency [104]. For instance, it has been shown that by increasing the number of surface defects in ZnO NWs, highly sensitive UV sensors may be produced [102]. These surface defects can serve as trapping or recombination centers for the charge carriers and lead to the formation of a surface depletion region. A greater width of the depletion layer at the NW surface leads to higher UV sensitivity. However, a density of defects on the NW surface that is too high may cause negative effects on nanogenerator devices’ performance [100,101]. It has been reported that ZnO nanostructures with high crystalline quality are known to improve photocatalytic activity due to the enhanced separation efficiency of photogenerated electron–hole pairs [105,106]. In the study of nanostructured ZnO-based UV sensors, high electron mobility is considered to contribute to enhancing the photocurrent [107,108,109]. High electron mobility may be attained by improving the crystallinity of ZnO. Therefore, precisely controlling the quality of the produced ZnO nanomaterials is critical in the production of a high-performance electronic device. As mentioned above, the optical behavior of the ZnO NWs is studied by analyzing the defect-related deep-level (DL) emission and near-band-edge (NBE) UV emission in the PL spectrum of NWs. Two main features noted in the PL spectrum are located at ~379.5 eV (~3.27 eV) and ~491 nm (~2.53 eV), and respectively labeled as ultraviolet (UV) emission (IUV) and deep-level defect emission (IDL) peaks. The DL emissions are usually caused by oxygen and zinc vacancies (VO and VZn) and interstitials (Oi and Zni), antisites (OZn and ZnO), and hydrogen impurities [110]. The ratio IUV/IDL can provide a qualitative indicator of the number of radiation defects in the produced nanomaterial. The higher the IUV/IDL ratio, the lower the number of point defects. Therefore, controlling the defect states and entirely suppressing defect-related emissions have become the most important issues for improving UV emission efficiency. DL emission was believed to cause a decrease in UV emission intensity. Many studies have reported that ZnO nanostructures obtained through wet chemical methods [95,96,97,98] usually exhibit a low UV emission with relatively strong visible emission (IUV/IDL: ~0.3÷19), indicating the presence of a large number of defects in the ZnO nanostructures. This is attributed to the insufficient reaction caused by low synthesis temperature and residual precursors and/or the formation of by-products during the synthesis process. This restricts the application of these ZnO nanostructures in optoelectronic devices as well as biochemical sensors. Unlike those prepared via other methods, the ZnO NWs prepared via thermal evaporation show a very high ratio of IUV/IDL, over 77. This confirms the high crystallinity of the as-grown NWs and the existence of a very low number of defects. These properties, along with the lack of grain boundaries and the long-distance order, make ZnO NWs suitable for applications in electronics, optoelectronics, photonics, solar cells, photocatalysis, etc. [111].
Figure 7a indicates typical resistance curves of ZnO NW sensors for 2, 6, and 10 ppm NO2 gas. The NO2 sensing was measured at 200 °C, the moderate working temperature of ZnO-based sensor devices [46,112]. After exposure to NO2 gas, the resistance of the sensor increased, with the n-type behavior of the sensor being derived from the intrinsic n-type behavior of ZnO. The resistance increased upon exposure to NO2 gas and approximately recovered to the initial state after removal of NO2; variations in resistance were found to be reversible behaviors. Also, as predicted, the sensor sensitivities (S) increase when NO2 gas concentrations increase. As seen in Table 3, the sensitivity of ZnO NW sensors changes as a function of NO2 concentration. As the NO2 concentration rises from 2 to 10 ppm, the sensitivity rises from 1.02 to 1.15. Figure 7b displays a typical response and recovery curve of the ZnO NW sensor towards 2 ppm NO2 when operating at 200 °C. When the sensor is exposed to 2 ppm of NO2 gas, an apparent increase in resistance is detected. In this case, the sensor response and recovery times are recorded to be 340 and 760 s, respectively. It was found that trecovery is larger than tresponse; this could be due to the fact that NO2 is strongly bonded to oxygen vacancies on the ZnO NW surface, with almost three times the bond strength of lattice oxygen (Eads = −0.30 eV) [113]; as a result, its desorption occurs at a slower rate.
The NO2 gas-sensing mechanism of ZnO NWs (n-type semiconductor) is mainly based on the electric resistance change when NO2 gases make contact with the surface of the ZnO NWs. In particular, in the air atmosphere, oxygen molecules act as electron acceptors and are chemically adsorbed on the surface of ZnO NWs (see Equation (2)) [114,115,116]. By capturing electrons from the ZnO conduction band, oxygen molecules ionize on the surface material to form chemisorbed oxygen ions. As a result, an electron-depleted region develops on the ZnO surface, and a potential barrier is formed due to the decrease in electron density, leading to a decrease in the number of electrons in the conduction band of ZnO and an increase in resistance [117]. This is called the baseline resistance in air. The types of oxygen species adsorbed (O2−, O, and O2) on the ZnO surface depend on the ambient temperature, as can be expressed in Equations (3)–(5) below [118]:
O2(gas) ↔ O2(ads)
O2(ads) + e(surf) ↔ O2(ads), T < 100 °C
O2(ads) + e(surf) ↔ 2O(ads), 100 °C < T < 300 °C
O(ads) + e(surf) ↔ O2−(ads), T > 300 °C
O2−(ads) ↔ O2−(Lat)
At low temperatures, oxygen is commonly adsorbed in its molecular state O2, whereas at high temperatures it dissociates as atomic O and O2−. Thus, there are two types of oxygen species on the ZnO NW surface; one type is oxygen adsorption and the other is lattice oxygen (O2−(Lat)) (see Equation (6)). In this work, the sensors were operated at a low temperature of 200 °C. When the sensor is exposed to the atmosphere of NO2 (strong oxidizing gas), the NO2 molecules not only withdraw the electrons from the ZnO conduction band, but also interact with the oxygen species adsorbed on the ZnO surface because of their stronger electrophilic properties (2.28 eV) compared with oxygen (0.43 eV) [119,120,121]. This results in the increase in the width of the electron depletion layer and junction potential barriers, which eventually increase the sensor resistance and generate a sensing response [122]. The absorption of NO2 on the ZnO surface is complicated; however, it can be summarized by Equations (7)–(9) [123,124,125,126,127]. When NO2 gas supply is stopped and the sensor is exposed to air again, NO can readily react with dissociated oxygen species and releases the electrons back to the conduction band, causing NO2 to be released into the air and reducing the resistance (see Equations (10)–(13)).
NO2(gas) ↔ NO2(ads)
NO2(ads) + O2(ads) + e(surf) ↔ 2O(ads) + NO2(ads), T < 100 °C
NO2(ads) + O(ads) + 2e(surf) ↔ 2O2−(ads) + NO(gas), 100 °C < T < 300 °C
O2−(ads) + 1/2O2 ↔ 2O(ads)
2O(ads) ↔ O2(ads) + e
O2(ads) ↔ O2(gas) + e
NO(gas) + O(ads) ↔ NO2(gas) + e
It is known that point defects on ZnO surfaces play an important role in gas sensor applications since they strongly influence electrical properties. For example, it has been demonstrated that ZnO with a high density of oxygen vacancies has high electrical conductivity [128,129]. Furthermore, it has been demonstrated that increasing the number of defects or oxygen vacancies on the surface of sensing materials considerably improves reactivity, thereby enhancing the sensing performance [129,130]. It was believed that oxygen vacancies could act as favorable adsorption sites for NO2 molecules [131], leading to an increase in the electrostatic interaction of reactive NO2 molecules with the ZnO NW surface and consequently resulting in an increase in gas sensitivity. Indeed, several theoretical results suggest that surface defects such as oxygen vacancies can control the chemical/electronic properties and adsorption characteristics of metal oxide surfaces [132,133]. Very recently, using density functional theory (DFT) calculations, An et al. [113] determined that the adsorption energy of NO2 on the oxygen vacancy site is Eads = −0.98 eV, which is three times larger than that on the perfect site (Eads = −0.30 eV), and hence, it was expected that the charge transfer from the oxygen vacancy site to the NO2 adsorbate would be larger than that from the perfect site to the NO2 adsorbate. This means that oxygen vacancies form stronger bonds with NO2 molecules, attracting more charge from the ZnO surface than would occur with an oxygen-vacancy-free ZnO surface. This finding is consistent with the close correlation between the concentration of oxygen-vacancy-related defects and the sensitivity of ZnO-based NO2 sensors [129,130]. Since NO2 is a strong oxidizing gas with high electrophilicity (~2.28 eV), it directly chemisorbs on oxygen vacancy sites present on the sensor surface, such that the adsorbed NO2 molecules can readily dissociate into O adatoms and release NO gas, following the reaction shown in Equation (14) [134]. In such a case, one of the O atoms of NO2 fills the oxygen vacancy site, and the weakly bonded NO can desorb from the surface [113]. In addition to this, the NO2 adsorption can also occur on lattice oxygen (O2−(Lat)), which further contributes to the sensing performance.
NO2(ads) + VÖ ↔ (VÖ − O(ads)) + NO(gas)
It is evident from the XPS and PL results (see Figure 5 and Figure 6) that these ZnO NWs contained very few oxygen vacancies and very little deep interstitial oxygen on the surface, which may be considered as a factor contributing to the sensing performance. The more oxygen vacancies there are in the material, the more sensitive the sensor is. It should be noted here that the as-grown ZnO NWs possess excellent optical properties (i.e., a very high IUV/IDL ratio); however, they can suffer from low sensitivity when the gas concentration is at the ppb level. Recently, much effort has been carried out to correlate the gas sensitivity with the point defects commonly present in ZnO [129,130,135,136,137].
In the gas sensors field, it has been indicated that the specific surface area is the predominant factor in determining the sensing performance of a material. Generally, the increase in the specific surface area of the material is favorable for increasing the number of the adsorbed target gas molecules (e.g., NO2), thereby improving sensing performance. The specific surface area of the material is usually dependent on its morphological structure [138], which can be adjusted according to the method and conditions of preparation [40,41,139]. ZnO nanomaterials with a variety of sizes and shapes (including nanoparticles, nanorods, nanowires, nanotubes, nanofibers, nanoflowers, and hierarchical nanostructures) can be fabricated, and accordingly, their electrical and chemical properties as well as their specific surface area may be adjusted [139,140]. This is compatible with the gas-sensing characteristics of the material; the same materials with different morphologies can produce different gas-sensing properties [141,142,143,144,145]. It is anticipated that in addition to size/diameter [137] the length of nanowires can also have an impact on gas-sensing performance. For instance, Shooshtari et al. [146] investigated the effect of ZnO nanowire length on the sensing properties of CNT-ZnO samples. They indicated that as the lengths of the ZnO NWs increased from 0.5 to 1.5 um, the sensor response increased up to 30%, due to the adsorption site’s effects. Furthermore, by increasing the aspect ratio of ZnO nanorods (length/diameter), the response to liquefied petroleum gas is greatly enhanced [31].
At present, the characteristic parameters of gas sensors, such as sensitivity, selectivity, stability, response time, recovery time, analyte concentration, working temperature, power consumption, and detection limit, have been reported many times in the literature [147,148,149,150,151,152]. Among them, selectivity is commonly used to evaluate the sensing performance of materials. A sensor is called selective if it only reacts with the target analyte and not with other components in a mixture. Hence, high selectivity confirms that the sensor gives precise information about the presence and concentration of gases. The selectivity of micro/nanostructured ZnO-based sensors can be calculated using Equation (15), as follows [150]:
K = S target   S interference    
where Starget and Sinterference are the responses of a sensor towards target gas and interfering gas, respectively. Chougule et al. [150] fabricated a gas sensor based on ZnO film for detecting NO2, H2S, and NH3 and revealed high selectivity for NO2 over H2S in comparison with NH3. In another study, researchers selected seven different gases, including ethanol, toluene, methanol, NH3, acetone, CO, and isopropanol, as target gases to investigate the gas response of a single-crystalline ZnO NW sensor [153]. They demonstrated that the ZnO NW sensor exhibits a higher response to ethanol vapor as compared with the other interference gases. The findings of their study indicated that the ZnO NW sensor had superior selectivity towards ethanol vapor. The selectivity of the sensor based on our ZnO NWs/Si-substrate samples is expected to be presented in another work (in preparation). The limit of detection (LOD) is considered an important measure that reflects the sensing performance. For high-performance sensor applications, a sensor should be able to detect extremely low concentrations of the gases. The lowest concentration of an analyte or gas that can be detected by a sensor under operating conditions is called its limit of detection. The LOD is calculated using the following Formula (16) [154]:
LOD   = 3 S D   Slope
where SD is the intercept standard deviation, as given below (17):
Standard   deviation   ( S D ) = Standard   error   ×   N  
(here, N is the number of data points).
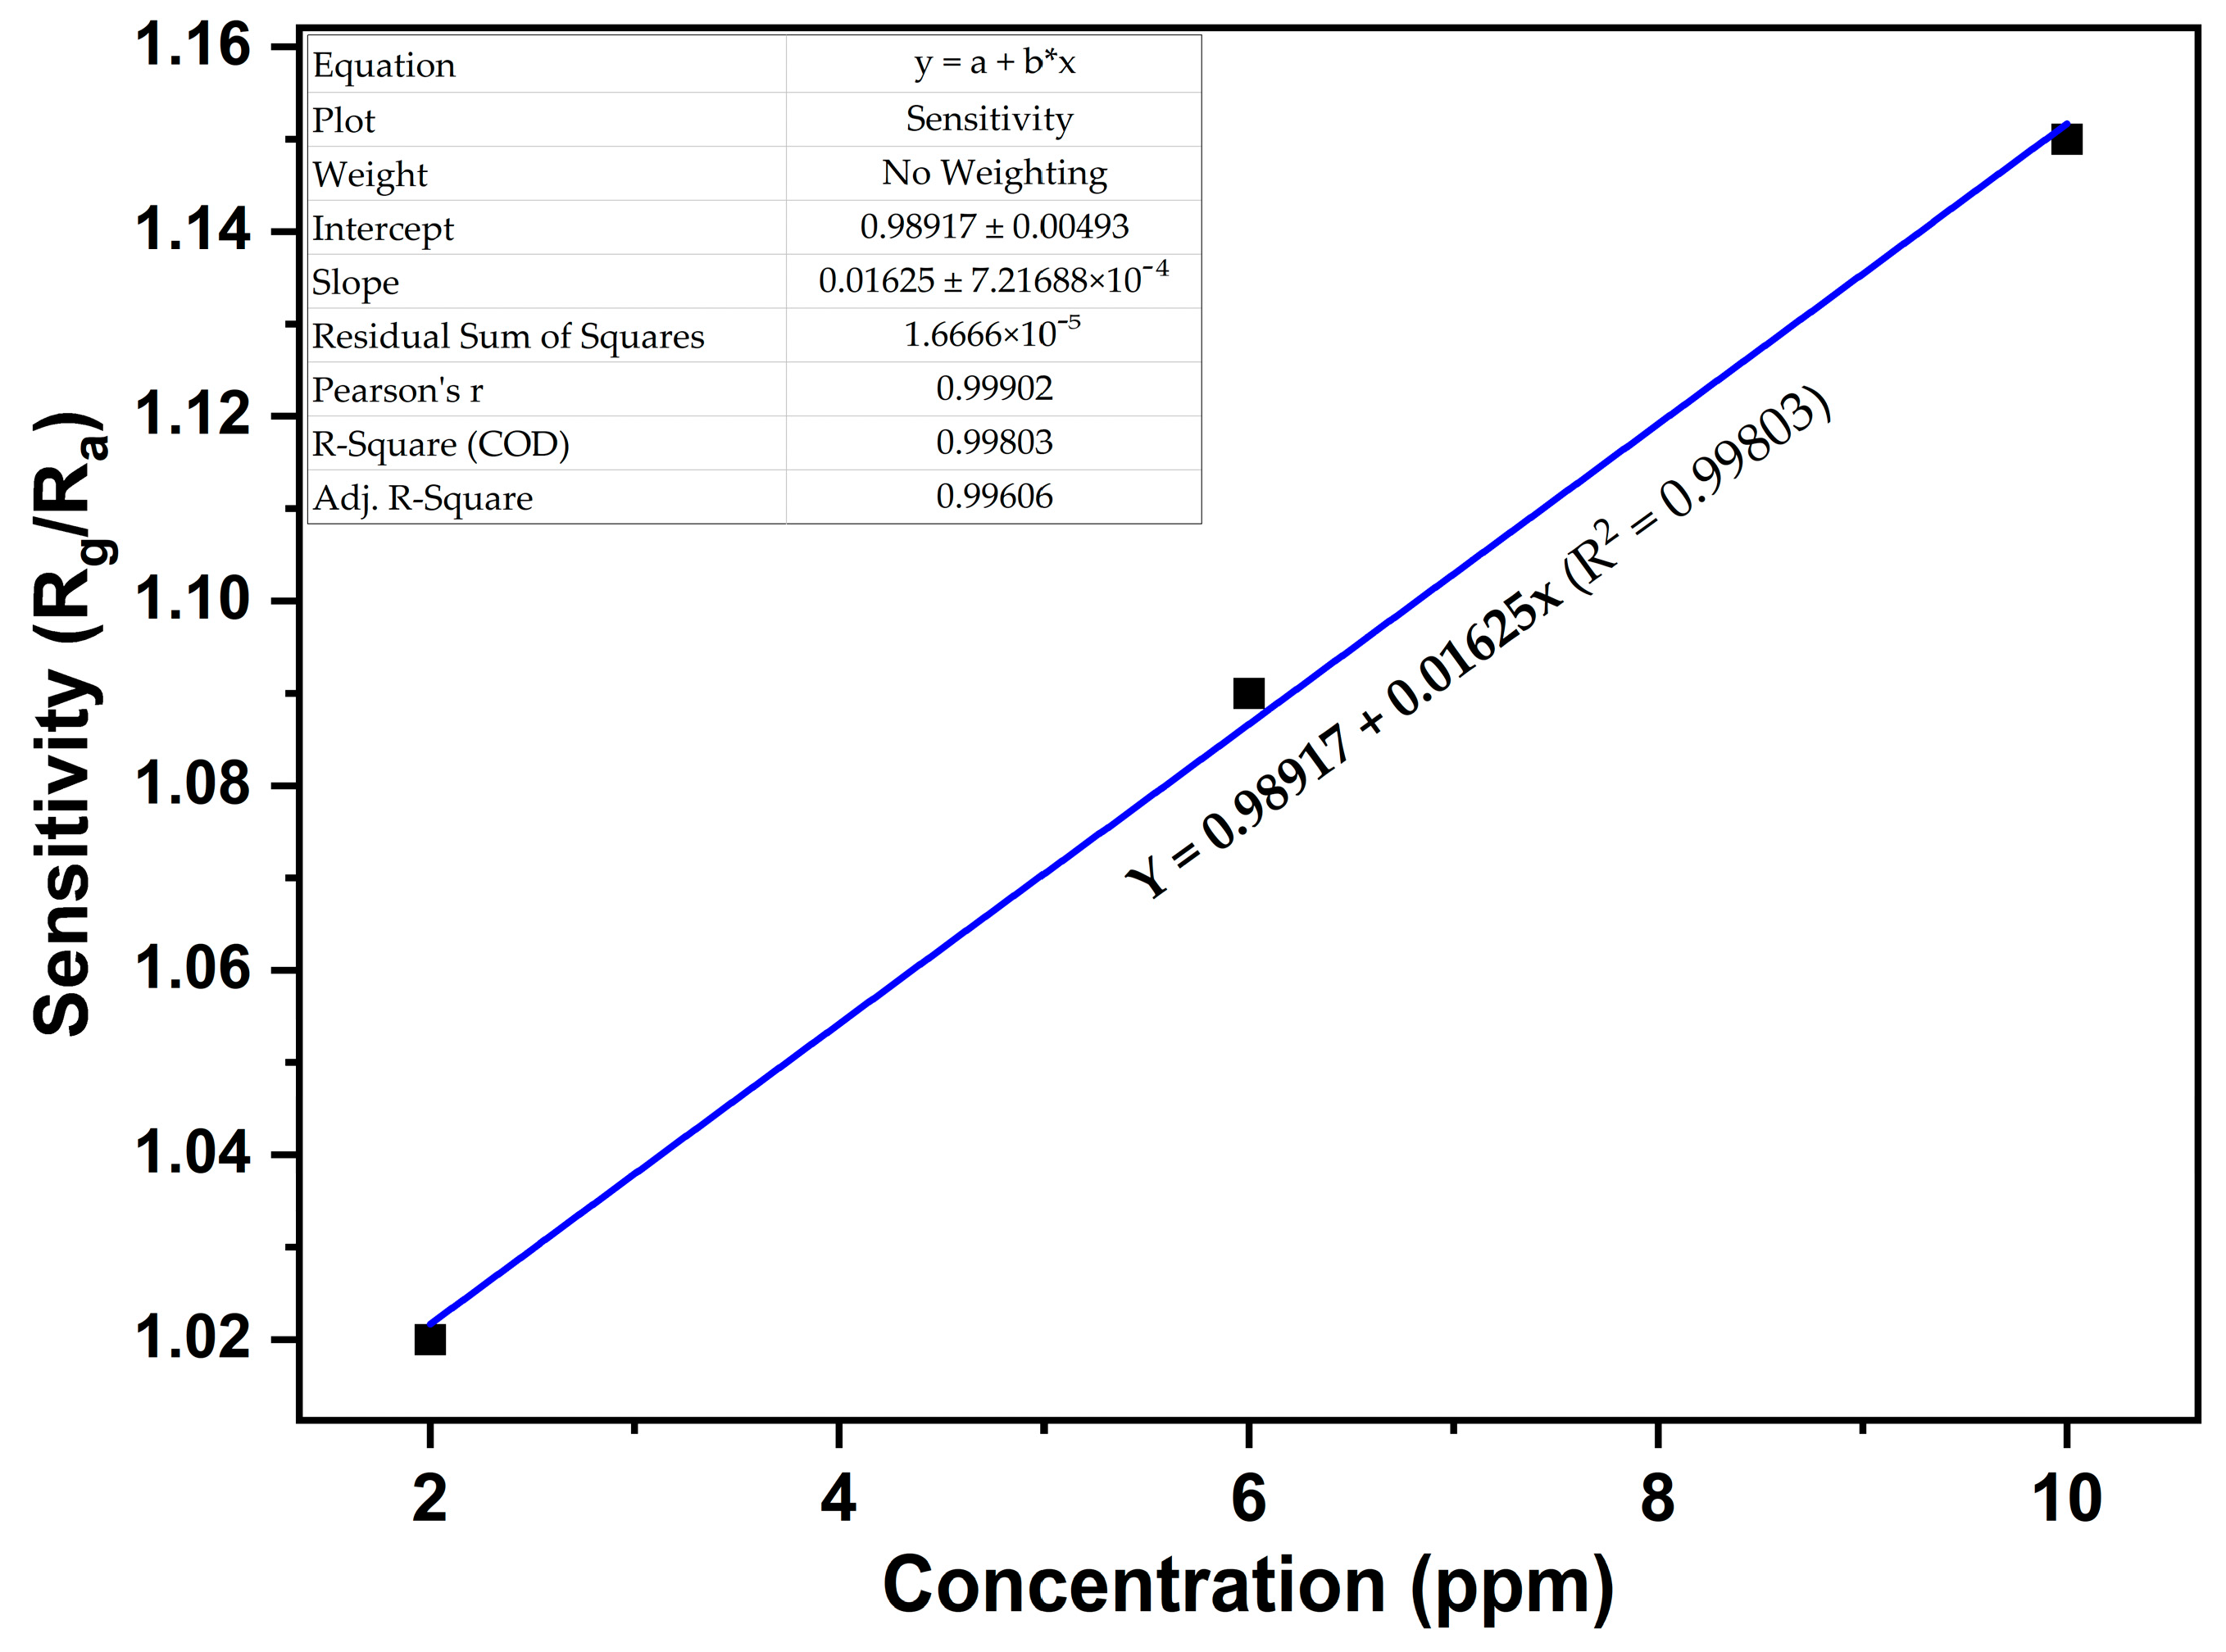
To calculate the LOD of the sensor, we plotted a graph of the sensitivity curve of the NO2 concentrations. Figure 8 displays the linear fitting curve to NO2 concentrations ranging from 2 to 10 ppm, indicating that the gas sensor has high linearity for NO2 concentrations ranging from 2 to 10 ppm. The calculated slope and standard error values are 0.01625 and 0.00493, respectively. According to the definition of LOD, the value of LOD for NO2 at 200 °C can be calculated using Equation (16):
LOD   = 3 S D   Slope = 3 0.00493 x 3 0.01625 = 1.57   ppm .
This result is comparable with previous findings for ZnO nanorod-based gas sensors, in which the lowest detection limits were estimated as 10 ppb at 250 °C [155], 50 ppb at 300 °C [156], and 100 ppb at 250 °C [151] for NO2 gas.

4. Conclusions

In summary, well-aligned ZnO NWs were synthesized via the simple thermal evaporation route without using any catalyst or additive. The obtained samples were analyzed through various techniques such as XRD, FESEM, TEM, EDS, XPS, and photoluminescence spectroscopy. The FESEM and TEM images indicated that the as-prepared ZnO NWs are single-crystalline with a diameter in the range of 135–160 nm and an average length of roughly 3.5 μm, and grow vertically on the Si substrates with homogeneous distribution. The XRD and HRTEM results demonstrated that the ZnO NWs have a hexagonal wurtzite structure and are grown preferentially along the c-axis (0002). The XPS and PL results confirmed that the as-grown ZnO NWs are of high crystalline quality with very few oxygen defects on the surface. The room-temperature PL spectrum of the as-prepared ZnO NWs exhibited a sharp and strong UV emission (~380 nm) with a weak deep-level emission (~491 nm), indicating good optical properties. These properties make ZnO NWs attractive for application in fabricating high-performance optoelectronic devices. Additionally, the ZnO NWs were used as a sensor, which exhibited good sensing performance for NO2 gas at an operating temperature of 200 °C; this was likely due to their high specific surface area and special atomic structure according to all the characteristics presented above.

Author Contributions

Conceptualization, T.V.K. and P.H.T.; methodology, T.V.K. and P.H.T.; software, T.V.K.; validation, T.V.K. and P.H.T.; formal analysis, P.H.T.; investigation, T.V.K.; resources, T.V.K. and P.H.T.; data curation, T.V.K.; writing—original draft preparation, T.V.K. and P.H.T.; writing—review and editing, T.V.K.; visualization, T.V.K. and P.H.T.; supervision, T.V.K.; project administration, T.V.K.; funding acquisition, T.V.K. All authors have read and agreed to the published version of the manuscript.

Funding

This research received no external funding.

Data Availability Statement

Not applicable.

Acknowledgments

We acknowledge the support of time and facilities from Ho Chi Minh City University of Technology (HCMUT), VNU-HCM for this study.

Conflicts of Interest

The authors declare no conflict of interest.

References

  1. Khaniabadi, Y.O.; Goudarzi, G.; Daryanoosh, S.M.; Borgini, A.; Tittarelli, A.; De Marco, A. Exposure to PM10, NO2, and O3 and Impacts on Human Health. Environ. Sci. Pollut. Res. Int. 2017, 24, 2781–2789. [Google Scholar] [CrossRef] [PubMed]
  2. Kwon, Y.J.; Mirzaei, A.; Na, H.G.; Kang, S.Y.; Choi, M.S.; Bang, J.H.; Oum, W.; Kim, S.S.; Kim, H.W. Porous Si nanowires for highly selective room temperature NO2 gas sensing. Nanotechnology 2018, 29, 294001. [Google Scholar] [CrossRef] [PubMed]
  3. Patnaik, P. A Comprehensive Guide to the Hazardous Properties of Chemical Substances, 3rd ed.; John Wiley & Sons: New York, NY, USA, 2007; p. 405. [Google Scholar]
  4. Brunet, J.; Talazac, L.; Battut, V.; Pauly, A.; Blanc, J.P.; Germain, J.P.; Pellier, S.; Soulier, C. Evaluation of Atmospheric Pollution by Two Semiconductor Gas Sensors. Thin Solid Films 2001, 391, 308–313. [Google Scholar] [CrossRef]
  5. National Research Council. Emergency and Continuous Exposure Guidance Levels for Selected Submarine Contaminants; National Academies Press: Washington, DC, USA, 2009; Volume 3. [Google Scholar]
  6. Drewniak, S.; Drewniak, Ł.; Pustelny, T. Mechanisms of NO2 Detection in Hybrid Structures Containing Reduced Graphene Oxide. Sensors 2022, 22, 5316. [Google Scholar] [CrossRef] [PubMed]
  7. Kamble, D.L.; Harale, N.S.; Patil, V.L.; Patil, P.S.; Kadam, L.D. Characterization and NO2 gas sensing properties of spray pyrolyzed SnO2 thin films. J. Anal. Appl. Pyrolysis 2017, 127, 38–46. [Google Scholar] [CrossRef]
  8. Sun, X.; Hao, H.; Ji, H.; Li, X.; Cai, S.; Zheng, C. Nanocasting Synthesis of In2O3 with Appropriate Mesostructured Ordering and Enhanced Gas-Sensing Property. ACS Appl. Mater. Interfaces 2014, 6, 401–409. [Google Scholar] [CrossRef]
  9. Kim, J.W.; Porte, Y.; Ko, K.Y.; Kim, H.; Myoung, J.M. Micropatternable Double-Faced ZnO Nanoflowers for Flexible Gas Sensor. ACS Appl. Mater. Interfaces 2017, 9, 32876–32886. [Google Scholar] [CrossRef]
  10. Boyadjiev, S.I.; Georgieva, V.; Stefan, N.; Stan, G.E.; Mihailescu, N.; Visan, A.; Mihailescu, I.N.; Besleaga, C.; Szilagyi, I.M. Characterization of PLD grown WO3 thin films for gas sensing. Appl. Surf. Sci. 2017, 417, 218–223. [Google Scholar] [CrossRef]
  11. Capone, S.; Benkovicova, M.; Forleo, A.; Jergel, M.; Manera, M.G.; Siffalovic, P.; Taurino, A.; Majkova, E.; Siciliano, P.; Vavra, I.; et al. Palladium/gamma-Fe2O3 nanoparticle mixtures for acetone and NO2 gas sensors. Sens. Actuators B 2017, 243, 895–903. [Google Scholar] [CrossRef]
  12. Luan, V.; Tien, H.N.; Hur, S.H.; Han, J.H.; Lee, W. Three dimensional porous nitrogen-doped NiO nanostructures as highly sensitive NO2 sensors. Nanomaterials 2017, 7, 313. [Google Scholar] [CrossRef]
  13. Deng, S.; Tjoa, V.; Fan, H.; Tan, H.; Sayle, D.C.; Olivo, M.; Mhaisalkar, S.; Wei, J.; Sow, C.H. Reduced Graphene Oxide Conjugated Cu2O Nanowire Mesocrystals for High-Performance NO2 Gas Sensor. J. Am. Chem. Soc. 2012, 134, 4905–4917. [Google Scholar] [CrossRef]
  14. Kumar, R.; Kumar, G.; Umar, A. Zinc Oxide Nanomaterials for Photocatalytic Degradation of Methyl Orange: A Review. Nanosci. Nanotechnol. Lett. 2014, 6, 631–650. [Google Scholar] [CrossRef]
  15. Hahn, Y.B. Zinc oxide nanostructures and their applications. Korean J. Chem. Eng. 2011, 28, 1797–1813. [Google Scholar] [CrossRef]
  16. Kumar, R.; Al-Dossary, O.; Kumar, G.; Umar, A. Zinc Oxide Nanostructures for NO2 Gas–Sensor Applications: A Review. Nano-Miro Lett. 2015, 7, 97–120. [Google Scholar] [CrossRef] [PubMed]
  17. Wibowo, A.; Marsudi, M.A.; Amal, M.I.; Ananda, M.B.; Stephanie, R.; Ardy, H.; Diguna, L.J. ZnO Nanostructured Materials for Emerging Solar Cell Applications. RSC Adv. 2020, 10, 42838–42859. [Google Scholar] [CrossRef]
  18. Wang, Z.L. ZnO Nanowire and Nanobelt Platform for Nanotechnology. Mater. Sci. Eng. R 2009, 64, 33–71. [Google Scholar] [CrossRef]
  19. Pascariu, P.; Tudose, I.V.; Suchea, M.; Koudoumas, E.; Fifere, N.; Airinei, A. Preparation and Characterization of Ni, Co Doped ZnO Nanoparticles for Photocatalytic Applications. Appl. Surf. Sci. 2018, 448, 481–488. [Google Scholar] [CrossRef]
  20. Wang, C.; Yin, L.; Zhang, L.; Xiang, D.; Gao, R. Metal Oxide Gas Sensors: Sensitivity and Influencing Factors. Sensors 2010, 10, 2088–2106. [Google Scholar] [CrossRef]
  21. Liu, L.; Li, S.; Zhuang, J.; Wang, L.; Zhang, J.; Li, H.; Liu, Z.; Han, Y.; Jiang, X.; Zhang, P. Improved selective acetone sensing properties of Co-Doped ZnO nanofibers by electrospinning. Sens. Actuators B 2011, 155, 782–788. [Google Scholar] [CrossRef]
  22. Tain, S.; Yang, F.; Zeng, D.; Xie, C. Solution-Processed Gas Sensors Based on ZnO Nanorods Array with an Exposed (0001) Facet for Enhanced Gas-Sensing Properties. J. Phys. Chem. C 2012, 116, 10586–10591. [Google Scholar]
  23. Batzill, M.; Diebold, U. The Surface and Materials Science of Tin Oxide. Prog. Surf. Sci. 2005, 79, 47–154. [Google Scholar] [CrossRef]
  24. Yamazoe, N.; Shimanoe, K. Theory of power laws for semiconductor gas sensors. Sens. Actuators B Chem. 2002, 128, 566–573. [Google Scholar] [CrossRef]
  25. Fioravanti, A.; Marani, P.; Morandi, S.; Lettieri, S.; Mazzocchi, M.; Sacerdoti, M.; Carotta, M.C. Growth Mechanisms of ZnO Micro-Nanomorphologies and Their Role in Enhancing Gas Sensing Properties. Sensors 2021, 21, 1331. [Google Scholar] [CrossRef] [PubMed]
  26. Rai, P.; Kwak, W.K.; Yu, Y.T. Solvothermal synthesis of ZnO nanostructures and their morphology-dependent gas-sensing properties. ACS Appl. Mater. Interfaces. 2013, 5, 3026–3032. [Google Scholar] [CrossRef] [PubMed]
  27. Obereggera, S.P.; Jonesb, O.A.H.; Spencer, M.J.S. Effect of nanostructuring of ZnO for gas sensing of nitrogen dioxide. Comput. Mater. Sci. 2017, 132, 104–115. [Google Scholar] [CrossRef]
  28. Carotta, M.C.; Cervi, A.; di Natale, V.; Gherardi, S.; Giberti, A.; Guidi, V.; Puzzovio, D.; Vendemiati, B.; Martinelli, G.; Sacerdoti, M.; et al. ZnO gas sensors: A comparison between nanoparticles and nanotetrapods-based thick films. Sens. Actuators B Chem. 2009, 137, 164–169. [Google Scholar] [CrossRef]
  29. Öztürk, S.; Kılınç, N.; Taşaltin, N.; Öztürk, Z.Z. A comparative study on the NO2 gas sensing properties of ZnO thin films, nanowires and nanorods. Thin Solid Films 2011, 520, 932–938. [Google Scholar] [CrossRef]
  30. Bai, S.; Hu, J.; Li, D.; Luo, R.; Chen, A.; Liu, C.C. Quantum-sized ZnO nanoparticles: Synthesis, characterization and sensing properties for NO2. J. Mater. Chem. 2011, 21, 12288–12294. [Google Scholar] [CrossRef]
  31. Gurav, K.V.; Gang, M.G.; Shin, S.W.; Patil, U.M.; Deshmukh, P.R.; Agawane, G.L.; Suryawanshi, M.P.; Pawar, S.M.; Patil, P.S.; Lokhande, C.D.; et al. Gas sensing properties of hydrothermally grown ZnO nanorods with different aspect ratios. Sens. Actuators B Chem. 2014, 190, 439–445. [Google Scholar] [CrossRef]
  32. Khai, T.V.; Thu, L.V.; Ha, L.T.T.; Thanh, V.M.; Lam, T.D. Structural, optical and gas sensing properties of vertically well-aligned ZnO nanowires grown on graphene/Si substrate by thermal evaporation method. Mater. Charact. 2018, 141, 296–317. [Google Scholar] [CrossRef]
  33. Huang, B.; Zhao, C.; Zhang, M.; Zhang, Z.; Xie, E.; Zhou, J.; Han, W. Doping effect of In2O3 on structural and ethanol-sensing characteristics of ZnO nanotubes fabricated by electrospinning. Appl. Surf. Sci. 2015, 349, 615–621. [Google Scholar] [CrossRef]
  34. Cao, Y.; Zou, X.; Wang, X.; Qian, J.; Bai, N.; Li, G.D. Effective detection of trace amount of explosive nitro-compounds by ZnO nanofibers with hollow structure. Sens. Actuators B Chem. 2016, 232, 564–570. [Google Scholar] [CrossRef]
  35. Agarwal, S.; Rai, P.; Gatell, E.N.; Llobet, E.; Güell, F.; Kumar, M.; Awasthi, K. Gas sensing properties of ZnO nanostructures (flowers/rods) synthesized by hydrothermal method. Sens. Actuators B Chem. 2019, 292, 24–31. [Google Scholar] [CrossRef]
  36. Liu, X.; Zhang, J.; Wang, L.; Yang, T.; Guo, X.; Wu, S.; Wang, S. 3D hierarchically porous ZnO structures and their functionalization by au nanoparticles for gas sensors. J. Mater. Chem. 2011, 21, 349–356. [Google Scholar] [CrossRef]
  37. Shouli, B.; Liangyuan, C.; Dianqing, L.; Wensheng, Y.; Pengcheng, Y.; Zhiyong, L.; Aifan, C.; Liu, C.C. Different morphologies of ZnO nanorods and their sensing property. Sens. Actuators B Chem. 2010, 146, 129–137. [Google Scholar] [CrossRef]
  38. Iversen, K.J.; Spencer, M.J.S. Effect of ZnO Nanostructure Morphology on the Sensing of H2S Gas. J. Phys. Chem. C 2013, 117, 26106–26118. [Google Scholar] [CrossRef]
  39. Zhang, S.; Nguyen, S.T.; Nguyen, T.H.; Yang, W.; Noh, J.S. Effect of the Morphology of Solution-Grown ZnO Nanostructures on Gas-Sensing Properties. J. Am. Ceram. Soc. 2017, 100, 5629–5637. [Google Scholar] [CrossRef]
  40. Gupta, S.K.; Joshi, A.; Kaur, M. Development of gas sensors using ZnO nanostructures. J. Chem. Sci. 2010, 122, 57–62. [Google Scholar] [CrossRef]
  41. Wei, S.; Wang, S.; Zhang, Y.; Zhou, M. Different morphologies of ZnO and their ethanol sensing property. Sens. Actuators B Chem. 2014, 192, 480–487. [Google Scholar] [CrossRef]
  42. Cao, Y.; Jia, D.; Wang, R.; Luo, J. Rapid One-Step Room-Temperature Solid-State Synthesis and Formation Mechanism of Zno Nanorods as H2S-Sensing Materials. Solid-State Electron. 2013, 82, 67–71. [Google Scholar] [CrossRef]
  43. Wang, C.; Chu, X.; Wu, M. Detection of H2S Down to ppb Levels at Room Temperature Using Sensors Based on ZnO Nanorods. Sens. Actuators B Chem. 2006, 113, 320–323. [Google Scholar] [CrossRef]
  44. Zhang, Y.; Li, Q.; Tian, Z.; Hu, P.; Qin, X.; Yun, F. Gas-sensing properties of ITO materials with different morphologies prepared by sputtering. SN Appl. Sci. 2020, 2, 264. [Google Scholar] [CrossRef]
  45. An, S.; Park, S.; Ko, H.; Jin, C.; Lee, W.I.; Lee, C. Enhanced Gas Sensing Properties of Branched ZnO Nanowires. Thin Solid Films 2013, 547, 241–245. [Google Scholar] [CrossRef]
  46. Ahn, M.W.; Park, K.S.; Heo, J.H.; Kim, D.W.; Choi, K.J.; Park, J.G. On-chip fabrication of ZnO-nanowire gas sensor with high gas sensitivity. Sens. Actuators B Chem. 2009, 138, 168–173. [Google Scholar] [CrossRef]
  47. Waclawik, E.R.; Chang, J.; Ponzoni, A.; Concina, I.; Zappa, D.; Comini, E.; Motta, N.; Faglia, G.; Sberveglieri Beilstein, G. Enhanced NO2 gas sensor response by chemical modification of nanowire surfaces. J. Nanotechnol. 2012, 3, 368–377. [Google Scholar]
  48. Cardoza-Contreras, M.N.; Romo-Herrera, J.M.; Ríos, L.A.; García-Gutiérrez, R.; Zepeda, T.A.; Contreras, O.E. Single ZnO Nanowire-Based Gas Sensors to Detect Low Concentrations of Hydrogen. Sensors 2015, 16, 30539–30544. [Google Scholar] [CrossRef]
  49. Lupan, O.; Emelchenko, G.A.; Ursaki, V.V.; Chai, G.; Redkin, A.N.; Gruzintsev, A.N.; Tiginyanu, I.M.; Chow, L.; Ono, L.K.; Roldan Cuenya, B.; et al. Synthesis and Characterization of ZnO Nanowires for Nanosensor Applications. Mater. Res. Bull. 2010, 45, 1026–1032. [Google Scholar] [CrossRef]
  50. Wan, Q.; Li, Q.H.; Chen, Y.J.; Wang, T.H.; He, X.L.; Li, J.P.; Lin, C.L. Fabrication and Ethanol Sensing Characteristics of ZnO Nanowire Gas Sensors. Appl. Phys. Lett. 2004, 84, 3654–3656. [Google Scholar] [CrossRef]
  51. Wu, W.Y.; Ting, J.M.; Huang, P.J. Electrospun ZnO nanowires as gas sensors for ethanol detection. Nanoscale Res. Lett. 2009, 4, 513–517. [Google Scholar] [CrossRef]
  52. Hieu, N.V.; Chien, N.D. Low-temperature growth and ethanol-sensing characteristics of quasi-one-dimensional ZnO nanostructures. Phys. B Condens. Matter 2008, 403, 50–56. [Google Scholar] [CrossRef]
  53. Pivert, M.L.; Martin, N.; Leprince-Wang, Y. Hydrothermally Grown ZnO Nanostructures for Water Purification via Photocatalysis. Crystals 2022, 12, 308. [Google Scholar] [CrossRef]
  54. Li, S.; Zhang, X.; Yan, B.; Yu, T. Growth mechanism and diameter control of well-aligned small-diameter ZnO nanowire arrays synthesized by a catalyst-free thermal evaporation method. Nanotechnology 2009, 20, 495604. [Google Scholar] [CrossRef] [PubMed]
  55. Xing, Y.J.; Xi, Z.H.; Zhang, X.D.; Song, J.H.; Wang, R.M.; Xu, J.; Xue, Z.Q.; Yu, D.P. Thermal evaporation synthesis of zinc oxide nanowires. Appl. Phys. A 2005, 80, 1527–1530. [Google Scholar] [CrossRef]
  56. Wang, L.; Zhang, X.; Zhao, S.; Zhou, G.; Zhou, Y.; Qi, J. Synthesis of well-aligned ZnO nanowires by simple physical vapor deposition on c-oriented ZnO thin films without catalysts or additives. Appl. Phys. Lett. 2005, 86, 024108. [Google Scholar] [CrossRef]
  57. Ashraf, S.; Jones, A.C.; Bacsa, J.; Steiner, A.; Chalker, P.R.; Beahan, P.; Hindley, S.; Odedra, R.; Williams, P.A.; Heys, P.N. MOCVD of vertically aligned ZnO nanowires using bidentate ether adducts of dimethylzinc. Chem. Vap. Depos. 2011, 17, 45–53. [Google Scholar] [CrossRef]
  58. Woong, L.; Min-Chang, J.; Jae-Min, M. Fabrication and application potential of ZnO nanowires grown on GaAs(002) substrates by metal–organic chemical vapour deposition. Nanotechnology 2004, 15, 254. [Google Scholar]
  59. Khai, T.V.; Maneeratanasarn, P.; Choi, B.G.; Ham, H.; Shim, K.B. Diameter-and density-controlled synthesis of well-aligned ZnO nanowire arrays and their properties using a thermal evaporation technique. Phys. Status Solidi A 2012, 209, 1498–1510. [Google Scholar] [CrossRef]
  60. Khai, T.V.; Thu, L.V.; Lam, T.D. Vertically well-aligned ZnO nanowire arrays directly synthesized from Zn vapor deposition without catalyst. J. Electron. Mater. 2016, 45, 2601–2607. [Google Scholar] [CrossRef]
  61. Yang, Z.; Dou, X.; Zhang, S.; Guo, L.; Zu, B.; Wu, Z.; Zeng, H. A High-Performance Nitro-Explosives Schottky Sensor Boosted by Interface Modulation. Adv. Funct. Mater. 2015, 25, 4039–4048. [Google Scholar] [CrossRef]
  62. Ham, H.; Shen, G.; Cho, J.; Lee, T.J.; Seo, S.; Lee, C. Vertically Aligned ZnO Nanowires Produced by a Catalyst-Free Thermal Evaporation Method and Their Field Emission Properties. Chem. Phys. Lett. 2005, 404, 69–73. [Google Scholar] [CrossRef]
  63. Kavakebi, M.; Jamali-sheini, F. Ultrasonic Synthesis of Zn-Doped CdO Nanostructures and Their Optoelectronic Properties. Trans. Nonferrous Met. Soc. China 2018, 28, 2255–2264. [Google Scholar] [CrossRef]
  64. Cullity, B.D.; Stock, S.R. Elements of X-ray Diffraction; Pearson Education Limited: London, UK, 2014. [Google Scholar]
  65. Thool, G.S.; Singh, A.K.; Singh, R.S.; Gupta, A.; Susan, A.B.H. Facile synthesis of flat crystal ZnO thin films by solution growth method: A micro-structural investigation. J. Saudi Chem. Soc. 2014, 18, 712–721. [Google Scholar] [CrossRef]
  66. Samadi, M.; Zirak, M.; Naseri, A.; Khorashadizade, E.; Moshfegh, A.Z. Recent Progress on Doped ZnO Nanostructures for Visible-Light Photocatalysis. Thin Solid Films 2016, 605, 2–19. [Google Scholar] [CrossRef]
  67. Wang, Z.L. Zinc oxide nanostructures: Growth, properties and applications. J. Phys. Condens. Matter 2004, 16, R829–R858. [Google Scholar] [CrossRef]
  68. Xu, L.; Hu, Y.L.; Pelligra, C.; Chen, C.H.; Jin, L.; Huang, H.; Sithambaram, S.; Aindow, M.; Joesten, R.; Suib, S.L. ZnO with Different Morphologies Synthesized by Solvothermal Methods for Enhanced Photocatalytic Activity. Chem. Mater. 2009, 21, 2875–2885. [Google Scholar] [CrossRef]
  69. Wagner, C.; Gale, L.; Raymond, R. Two-dimensional chemical state plots: A standardized data set for use in identifying chemical states by X-ray photoelectron spectroscopy. Anal. Chem. 1979, 51, 466–482. [Google Scholar] [CrossRef]
  70. Saha, T.; Achath Mohanan, A.; Swamy, V.; Guo, N.; Ramakrishnan, N. An Optimal Thermal Evaporation Synthesis of C-Axis Oriented ZnO Nanowires with Excellent UV Sensing and Emission Characteristics. Mater. Res. Bull. 2016, 77, 147–154. [Google Scholar] [CrossRef]
  71. Sahai, A.; Goswami, N. Probing the Dominance of Interstitial Oxygen Defects in ZnO Nanoparticles through Structural and Optical Characterizations. Ceram. Int. 2014, 40, 14569–14578. [Google Scholar] [CrossRef]
  72. Al-Gaashani, R.; Radiman, S.; Daud, A.R.; Tabet, N.; Al-Douri, Y. XPS and Optical Studies of Different Morphologies of ZnO Nanostructures Prepared by Microwave Methods. Ceram. Int. 2013, 39, 2283–2292. [Google Scholar] [CrossRef]
  73. Das, J.; Pradhan, S.K.; Sahu, D.R.; Mishra, D.K.; Sarangi, S.N.; Nayak, B.B.; Verma, S.; Roul, B.K. Micro-Raman and XPS Studies of Pure ZnO Ceramics. Phys. B Condens. Matter 2010, 405, 2492–2497. [Google Scholar] [CrossRef]
  74. Zheng, J.H.; Jiang, Q.; Lian, J.S. Synthesis and Optical Properties of Flower-like ZnO Nanorods by Thermal Evaporation Method. Appl. Surf. Sci. 2011, 257, 5083–5087. [Google Scholar] [CrossRef]
  75. Li, C.C.; Du, Z.F.; Li, L.M.; Yu, H.C.; Wan, Q.; Wang, T.H. Surface-Depletion Controlled Gas Sensing of ZnO Nanorods Grown at Room Temperature. Appl. Phys. Lett. 2007, 91, 032101. [Google Scholar] [CrossRef]
  76. Ghosh, B.; Ray, S.C.; Pattanaik, S.; Sarma, S.; Mishra, D.K.; Pontsho, M.; Pong, W.F. Tuning of the Electronic Structure and Magnetic Properties of Xenon Ion Implanted Zinc Oxide. J. Phys. D Appl. Phys. 2018, 51, 095304. [Google Scholar] [CrossRef]
  77. Tam, K.H.; Cheung, C.K.; Leung, Y.H.; Djurišic, A.B.; Ling, C.C.; Beling, C.D.; Fung, S.; Kwok, W.M.; Chan, W.K.; Phillips, D.L.; et al. Defects in ZnO Nanorods Prepared by a Hydrothermal Method. J. Phys. Chem. B 2006, 110, 20865–20871. [Google Scholar] [CrossRef]
  78. Karamat, S.; Rawat, R.S.; Lee, P.; Tan, T.; Ramanujan, R. Structural, Elemental, Optical and Magnetic Study of Fe Doped ZnO and Impurity Phase Formation. Prog. Nat. Sci. Mater. 2014, 24, 142–149. [Google Scholar] [CrossRef]
  79. Chen, Y.; Xu, X.L.; Zhang, G.H.; Xue, H.; Ma, S.Y. Blue shift of optical band gap in Er-doped ZnO thin films deposited by direct current reactive magnetron sputtering technique. Physica E Low Dimens. Syst. Nanostruct. 2010, 42, 1713–1716. [Google Scholar] [CrossRef]
  80. Chen, H.; Liu, W.; Qin, Z. ZnO/ZnFe2O4 Nanocomposite as a Broad-Spectrum Photo-Fenton-like Photocatalyst with near-Infrared Activity. Catal. Sci. Technol. 2017, 7, 2236–2244. [Google Scholar] [CrossRef]
  81. Papari, G.P.; Silvestri, B.; Vitiello, G.; de Stefano, L.; Rea, I.; Luciani, G.; Aronne, A.; Andreone, A. Morphological, Structural, and Charge Transfer Properties of F-Doped ZnO: A Spectroscopic Investigation. J. Phys. Chem. C. 2017, 121, 16012–16020. [Google Scholar] [CrossRef]
  82. Lisachenko, A.A. Study of self-sensitization of wide-gap oxides to visible light by intrinsic defects: From Terenin to the present days. J. Photochem. Photobiol. A Chem. 2018, 354, 47–60. [Google Scholar] [CrossRef]
  83. Studenikin, S.A.; Golego, N.; Cocivera, M. Fabrication of green and orange photoluminescent, undoped ZnO films using spray pyrolysis. J. Appl. Phys. 1998, 84, 2287–2294. [Google Scholar] [CrossRef]
  84. Hsu, N.E.; Hung, W.K.; Chen, Y.F. Origin of Defect Emission Identified by Polarized Luminescence from Aligned ZnO Nanorods. J. Appl. Phys. 2004, 96, 4671–4673. [Google Scholar] [CrossRef]
  85. Liu, M.; Kitai, A.H.; Mascher, P. Point Defects and Luminescence Centres in Zinc Oxide and Zinc Oxide Doped with Manganese. J. Lumin. 1992, 54, 35–42. [Google Scholar] [CrossRef]
  86. Lin, B.; Fu, Z.; Jia, Y. Green luminescent center in undoped zinc oxide films deposited on silicon substrates. Appl. Phys. Lett. 2001, 79, 943–945. [Google Scholar] [CrossRef]
  87. Ahn, C.H.; Kim, Y.Y.; Kim, D.C.; Mohanta, S.K.; Cho, H.K. A Comparative Analysis of Deep Level Emission in ZnO Layers Deposited by Various Methods. J. Appl. Phys. 2009, 105, 013502. [Google Scholar] [CrossRef]
  88. Zhao, S.; Zhou, Y.; Zhao, K.; Liu, Z.; Han, P.; Wang, S.; Xiang, W.; Chen, Z.; Lü, H.; Cheng, B.; et al. Violet luminescence emitted from Ag-nanocluster doped ZnO thin films grown on fused quartz substrates by pulsed laser deposition. Phys. B Condens. Matter 2006, 373, 154–156. [Google Scholar] [CrossRef]
  89. Khai, T.V.; Kwak, D.S.; Kwon, Y.J.; Shim, K.B.; Kim, H.W. Catalyst-free thermally-evaporated growth and optical properties of ZnO nanowires on Si, GaN and sapphire substrates. Cryst. Res. Technol. 2013, 48, 75–86. [Google Scholar] [CrossRef]
  90. Yousefi, R.; Zak, A.K. Growth and characterization of ZnO nanowires grown on the Si(111) and Si(100) substrates: Optical properties and biaxial stress of nanowires. Mater. Sci. Semicond. 2011, 14, 170–174. [Google Scholar] [CrossRef]
  91. Hassan, N.K.; Hashim, M.R.; Mahdi, M.A.; Allam, N.K. A catalyst-free growth of ZnO nanowires on Si (100) substrates: Effect of substrate position on morphological, structural and optical properties. ECS J. Solid State Sci. Technol. 2012, 1, P86–P89. [Google Scholar] [CrossRef]
  92. Umar, A.; Hahn, Y.B. Aligned hexagonal coaxial-shaped ZnO nanocolumns on steel alloy by thermal evaporation. Appl. Phys. Lett. 2006, 88, 173120. [Google Scholar] [CrossRef]
  93. Ahmad, N.F.; Yasui, K.; Hashim, A.M. Seed/catalyst-free growth of zinc oxide on graphene by thermal evaporation: Effects of substrate inclination angles and graphene thicknesses. Nanoscale Res. Lett. 2015, 10, 10. [Google Scholar] [CrossRef]
  94. ElZein, B.; Yao, Y.; Barham, A.S.; Dogheche, E.; Jabbour, G.E. Toward the Growth of Self-Catalyzed ZnO Nanowires Perpendicular to the Surface of Silicon and Glass Substrates, by Pulsed Laser Deposition. Materials 2020, 13, 4427. [Google Scholar] [CrossRef] [PubMed]
  95. Han, F.; Yang, S.; Jing, W.; Jiang, K.C.; Jiang, Z.; Liu, H.; Li, L. Surface Plasmon Enhanced Photoluminescence of ZnO Nanorods by Capping Reduced Graphene Oxide Sheets. Opt. Express 2014, 22, 11436–11445. [Google Scholar] [CrossRef] [PubMed]
  96. Khai, T.V.; Long, L.N.; Khoi, N.H.T.; Hoc Thang, N. Effects of Hydrothermal Reaction Time on the Structure and Optical Properties of ZnO/Graphene Oxide Nanocomposites. Crystals 2022, 12, 1825. [Google Scholar] [CrossRef]
  97. Li, L.; Yao, C.; Wu, L.; Jiang, K.; Hu, Z.; Xu, N.; Sun, J.; Wu, J. ZnS Covering of ZnO Nanorods for Enhancing UV Emission from ZnO. J. Phys. Chem. C 2021, 125, 13732–13740. [Google Scholar] [CrossRef]
  98. Yin, Y.; Sun, Y.; Yu, M.; Liu, X.; Yang, B.; Liu, D.; Liu, S.; Cao, W.; Ashfold, M.N.R. Controlling the hydrothermal growth and the properties of ZnO nanorod arrays by pre-treating the seed layer. RSC Adv. 2014, 4, 44452. [Google Scholar] [CrossRef]
  99. Shakti, N.; Prakash, A.; Mandal, T.; Katiyar, M. Processing Temperature Dependent Morphological and Optical Properties of ZnO Nanorods. Mater. Sci. Semicond. 2014, 20, 55–60. [Google Scholar] [CrossRef]
  100. Opoku, C.; Dahiya, A.S.; Cayrel, F.; Poulin-Vittrant, G.; Alquier, D.; Camara, N. Fabrication of Field-Effect Transistors and Functional Nanogenerators Using Hydrothermally Grown ZnO Nanowires. RSC Adv. 2015, 5, 69925–69931. [Google Scholar] [CrossRef]
  101. Sohn, J.I.; Cha, S.N.; Song, B.G.; Lee, S.; Kim, S.M.; Ku, J.; Kim, H.J.; Park, Y.J.; Choi, B.L.; Wang, Z.L.; et al. Engineering of Efficiency Limiting Free Carriers and an Interfacial Energy Barrier for an Enhancing Piezoelectric Generation. Energy Environ. Sci. 2012, 6, 97–104. [Google Scholar] [CrossRef]
  102. Kushwaha, A.; Aslam, M. Defect Induced High Photocurrent in Solution Grown Vertically Aligned ZnO Nanowire Array Films. J. Appl. Phys. 2012, 112, 054316. [Google Scholar] [CrossRef]
  103. Das, S.N.; Kar, J.P.; Choi, J.H.; Lee, T.I.; Moon, K.J.; Myoung, J.M. Fabrication and Characterization of ZnO Single Nanowire-Based Hydrogen Sensor. J. Phys. Chem. C 2010, 114, 1689–1693. [Google Scholar] [CrossRef]
  104. Selim, F.A.; Weber, M.H.; Solodovnikov, D.; Lynn, K.G. Nature of native defects in ZnO. Phys. Rev. Lett. 2007, 99, 085502. [Google Scholar] [CrossRef] [PubMed]
  105. Wang, Y.; Li, X.; Wang, N.; Quan, X.; Chen, Y. Controllable synthesis of ZnO nanoflowers and their morphology-dependent photocatalytic activities. Sep. Purif. Technol. 2008, 62, 727–732. [Google Scholar] [CrossRef]
  106. Baradaran, M.; Ghodsi, F.; Bittencourt, C.; Llobet, E. The role of Al concentration on improving the photocatalytic performance of nanostructured ZnO/ZnO:Al/ZnO multilayer thin films. J. Alloys Compd. 2019, 788, 289–301. [Google Scholar] [CrossRef]
  107. Goldberger, J.; Sirbuly, D.J.; Law, M.; Yang, P. ZnO Nanowire Transistors. J. Phys. Chem. B 2005, 109, 9–14. [Google Scholar] [CrossRef] [PubMed]
  108. Liu, J.; Wu, W.; Bai, S.; Qin, Y. Synthesis of High Crystallinity ZnO Nanowire Array on Polymer Substrate and Flexible Fiber-Based Sensor. ACS Appl. Mater. Interfaces 2011, 3, 4197–4200. [Google Scholar] [CrossRef] [PubMed]
  109. Das, S.N.; Moon, K.J.; Kar, J.P.; Choi, J.H.; Xiong, J.; Lee, T.I.; Myoung, J.M. ZnO Single Nanowire-Based UV Detectors. Appl. Phys. Lett. 2010, 97, 022103. [Google Scholar] [CrossRef]
  110. Janotti, A.; Van de Walle, C.G. Native Point Defects in ZnO. Phys. Rev. B 2007, 76, 165202. [Google Scholar] [CrossRef]
  111. Ding, M.; Guo, Z.; Zhou, L.; Fang, X.; Zhang, L.; Zeng, L.; Xie, L.; Zhao, H. One-demensional Zinc oxide nanomaterials for application in high-performance advanced opolectronic devices. Crystals 2018, 8, 223. [Google Scholar] [CrossRef]
  112. Nisha, R.; Madhusoodanan, K.N.; Vimalkumar, T.V.; Vijayakumar, K.P. Gas sensing application of nanocrystalline zinc oxide thin films prepared by spray pyrolysis. Bull. Mater. Sci. 2015, 38, 583–591. [Google Scholar]
  113. An, W.; Wu, X.; Zeng, X.C. Adsorption of O2, H2, CO, NH3, and NO2 on ZnO Nanotube:  A Density Functional Theory Study. J. Phys. Chem. C 2008, 112, 5747–5755. [Google Scholar] [CrossRef]
  114. Mirzaei, A.; Kim, J.-H.; Kim, H.W.; Kim, S.S. Resistive-Based Gas Sensors for Detection of Benzene, Toluene and Xylene (BTX) Gases: A Review. J. Mater. Chem. C 2018, 6, 4342–4370. [Google Scholar] [CrossRef]
  115. Mirzaei, A.; Kim, J.H.; Kim, H.W.; Kim, S.S. How Shell Thickness Can Affect the Gas Sensing Properties of Nanostructured Materials: Survey of Literature. Sens. Actuators B Chem. 2018, 258, 270–294. [Google Scholar] [CrossRef]
  116. Mirzaei, A.; Leonardi, S.G.; Neri, G. Detection of Hazardous Volatile Organic Compounds (VOCs) by Metal Oxide Nanostructures-Based Gas Sensors: A Review. Ceram. Int. 2016, 42, 15119–15141. [Google Scholar] [CrossRef]
  117. Al-Hardan, N.H.; Aziz, A.A.; Abdullah, M.J.; Ahmed, N.M. Conductometric Gas Sensing Based on ZnO Thin Films: An Impedance Spectroscopy Study. ECS J. Solid State Sci. Technol. 2018, 7, P487–P490. [Google Scholar] [CrossRef]
  118. Ding, J.; Chen, S.; Han, N.; Shi, Y.; Hu, P.; Li, H.; Wang, J. Aerosol assisted chemical vapour deposition of nanostructured ZnO thin films for NO2 and ethanol monitoring. Ceram. Int. 2020, 46, 15152–15158. [Google Scholar] [CrossRef]
  119. Chen, E.S.; Wentworth, W.E.; Chen, E.C.M. The electron affinities of NO and O2. J. Mol. Struct. 2002, 606, 1–7. [Google Scholar] [CrossRef]
  120. Zhou, Z.; Gao, H.; Liu, R.; Du, B. Study on the structure and property for the NO2 + NO2 electron transfer system. J. Mol. Struct. THEOCHEM 2001, 545, 179–186. [Google Scholar] [CrossRef]
  121. Šulka, M.; Pitoňák, M.; Neogrády, P.; Urban, M. Electron Affinity of the O2 Molecule: CCSD(T) Calculations Using the Optimized Virtual Orbitals Space Approach. Int. J. Quantum Chem. 2008, 108, 2159–2171. [Google Scholar] [CrossRef]
  122. Ganbavle, V.V.; Inamdar, S.I.; Agawane, G.L.; Kim, J.H.; Rajpure, K.Y. Synthesis of Fast Response, Highly Sensitive and Selective Ni:ZnO Based NO2 Sensor. Chem. Eng. J. 2016, 286, 36–47. [Google Scholar] [CrossRef]
  123. Barreca, D.; Bekermann, D.; Comini, E.; Devi, A.; Fischer, R.A.; Gasparotto, A.; Maccato, C.; Sada, C.; Sberveglieri, G.; Tondello, E. Urchin-like ZnOnanorod arrays for gas sensing applications. Cryst. Eng. Comm. 2010, 12, 3419–3421. [Google Scholar] [CrossRef]
  124. Zhu, L.; Zeng, W. Room-Temperature Gas Sensing of ZnO-Based Gas Sensor: A Review. Sens. Actuators A Phys. 2017, 267, 242–261. [Google Scholar] [CrossRef]
  125. Xiao, C.; Yang, T.; Chuai, M.; Xiao, B.; Zhang, M. Synthesis of ZnO nanosheet arrays with exposed (100) facets for gas sensing applications. Phys. Chem. Chem. Phys. 2016, 18, 325–330. [Google Scholar] [CrossRef] [PubMed]
  126. Choi, M.S.; Na, H.G.; Mirzaei, A.; Bang, J.H.; Oum, W.; Han, S.; Choi, S.W.; Kim, M.; Jin, C.; Kim, S.S.; et al. Room-temperature NO2 sensor based on electrochemically etched porous silicon. J. Alloys Compd. 2019, 811, 151975. [Google Scholar] [CrossRef]
  127. Parellada-Monreal, L.; Castro-Hurtado, I.; Martínez Calderón, M.; Presmanes, L.; Mandayo, G.G. Laser-induced periodic surface structures on ZnO thin film for high response NO2 detection. Appl. Surf. Sci. 2019, 476, 569–575. [Google Scholar] [CrossRef]
  128. Chang, P.C.; Fan, Z.; Wang, D.; Tseng, W.Y.; Chiou, W.A.; Hong, J.; Lu, J.G. ZnO Nanowires Synthesized by Vapor Trapping CVD Method. Chem. Mater. 2004, 16, 5133–5137. [Google Scholar] [CrossRef]
  129. Ahn, M.W.; Park, K.S.; Heo, J.H.; Park, J.G.; Kim, D.W.; Choi, K.J.; Lee, J.H.; Hong, S.H. Gas sensing properties of defect-controlled ZnO-nanowire gas sensor. Appl. Phys. Lett. 2008, 93, 263103–263105. [Google Scholar] [CrossRef]
  130. Li, G.; Zhang, H.; Meng, L.; Sun, Z.; Chen, Z.; Huang, X.; Qin, Y. Adjustment of Oxygen Vacancy States in ZnO and Its Application in Ppb-Level NO2 Gas Sensor. Sci. Bull. 2020, 65, 1650–1658. [Google Scholar] [CrossRef]
  131. Li, Y.; Zu, B.; Guo, Y.; Li, K.; Zeng, H.; Dou, X. Surface Superoxide Complex Defects-Boosted Ultrasensitive Ppb-Level NO2 Gas Sensors. Small 2016, 12, 1420–1424. [Google Scholar] [CrossRef]
  132. Henrich, V.E.; Cox, P.A. The Surface Science of Metal Oxides; Cambridge University Press: Cambridge, UK, 1994. [Google Scholar]
  133. Schaub, R.; Wahlström, E.; Rønnau, A.; Lagsgaard, E.; Stensgaard, I.; Besenbacher, F. Oxygen-Mediated Diffusion of Oxygen Vacancies on the TiO2(110) Surface. Science 2003, 299, 377–379. [Google Scholar] [CrossRef]
  134. Spencer, M.J.S.; Yarovsky, I. ZnO Nanostructures for Gas Sensing: Interaction of NO2, NO, O, and N with the ZnO 10 1 ¯ 0 Surface. J. Phys. Chem. C 2010, 114, 10881–10893. [Google Scholar] [CrossRef]
  135. Zou, C.; Liang, F.; Xue, S. Synthesis and oxygen vacancy related NO2 gas sensing properties of ZnO:Co nanorods arrays gown by a hydrothermal method. Appl. Surf. Sci. 2015, 353, 1061–1069. [Google Scholar] [CrossRef]
  136. Lee, B.W.; Kim, T.S.; Goswami, S.K.; Oh, E. Gas Sensitivity and Point Defects in Sonochemically Grown ZnO Nanowires. J. Korean Phys. Soc. 2012, 60, 415–419. [Google Scholar] [CrossRef]
  137. Lupan, O.; Ursaki, V.V.; Chai, G.; Chow, L.; Emelchenko, G.A.; Tiginyanu, I.M.; Gruzintsev, A.N.; Redkin, A.N. Selective Hydrogen Gas Nanosensor Using Individual ZnO Nanowire with Fast Response at Room Temperature. Sens. Actuators B Chem. 2010, 144, 56–66. [Google Scholar] [CrossRef]
  138. Choi, S.W.; Park, J.Y.; Kim, S.S. Dependence of Gas Sensing Properties in ZnO Nanofibers on Size and Crystallinity of Nanograins. J. Mater. Res. 2011, 26, 1662–1665. [Google Scholar] [CrossRef]
  139. Morandi, S.; Fioravanti, A.; Cerrato, G.; Lettieri, S.; Sacerdoti, M.; Carotta, M. Facile synthesis of ZnO nano-structures: Morphology influence on electronic properties. Sens. Actuators B Chem. 2017, 249, 581–589. [Google Scholar] [CrossRef]
  140. Righettoni, M.; Amann, A.; Pratsinis, S.E. Breath Analysis by Nanostructured Metal Oxides as Chemo-Resistive Gas Sensors. Mater. Today 2015, 18, 163–171. [Google Scholar] [CrossRef]
  141. Khatibani, A.B. Characterization and Ethanol Sensing Performance of Sol–Gel Derived Pure and Doped Zinc Oxide Thin Films. J. Electron. Mater. 2019, 48, 3784–3793. [Google Scholar] [CrossRef]
  142. Perekrestov, V.; Latyshev, V.; Kornyushchenko, A.; Kosminska, Y. Formation, Charge Transfer, Structural and Morphological Characteristics of ZnO Fractal-Percolation Nanosystems. J. Electron. Mater. 2019, 48, 2788–2793. [Google Scholar] [CrossRef]
  143. GuL, M.; Amin, M.; Abbas, M.; Ilyas, S.Z.; Shah, N.A. Synthesis and Characterization of Magnesium Doped ZnO Nanostructures: Methane (CH4) Detection. J. Mater. Sci. Mater. Electron. 2019, 30, 5257–5265. [Google Scholar] [CrossRef]
  144. Chetna; Kumar, S.; Garg, A.; Chowdhuri, A.; Jain, A.; Kapoor, A. A Novel Method of Electrochemically Growing ZnO Nanorods on Graphene Oxide as Substrate for Gas Sensing Applications. Mater. Res. Express 2019, 6, 075039. [Google Scholar] [CrossRef]
  145. Aydin, H.; Yakuphanoglu, F.; Aydin, C. Al-Doped ZnO as a Multifunctional Nanomaterial: Structural, Morphological, Optical and Low-Temperature Gas Sensing Properties. J. Alloys Compd. 2019, 773, 802–811. [Google Scholar] [CrossRef]
  146. Shooshtari, M.; Pahlavan, S.; Rahbarpour, S.; Ghafoorifard, H. Investigating organic vapor sensing properties of composite carbon nanotube-zinc oxide nanowire. Chemosensors 2022, 10, 205. [Google Scholar] [CrossRef]
  147. Shi, L.; Naik, A.J.T.; Goodall, J.B.M.; Tighe, C.; Gruar, R.; Binions, R.; Parkin, I.; Darr, J. Highly sensitive ZnO nanorod- and nanoprism-based NO2 gas sensors: Size and shape control using a continuous hydrothermal pilot plant. Langmuir 2013, 29, 10603–10609. [Google Scholar] [CrossRef] [PubMed]
  148. Han, H.V.; Hoa, N.D.; Tong, P.V.; Nguyen, H.; Hieu, N.V. Single-Crystal Zinc Oxide Nanorods with Nanovoids as Highly Sensitive NO2 Nanosensors. Mater. Lett. 2013, 94, 41–43. [Google Scholar] [CrossRef]
  149. Park, J.; Oh, J.Y. Highly-sensitive NO2 Detection of ZnO Nanorods Grown by a Sonochemical Process. J. Korean Phys. Soc. 2009, 55, 1119–1122. [Google Scholar] [CrossRef]
  150. Chougule, M.; Sen, S.; Patil, V. Fabrication of Nanostructured ZnO Thin Film Sensor for NO2 Monitoring. Ceram. Int. 2012, 38, 2685–2692. [Google Scholar] [CrossRef]
  151. Oh, E.; Choi, H.Y.; Jung, S.H.; Cho, S.; Kim, J.C.; Lee, K.H.; Kang, S.W.; Kim, J.; Yun, J.Y.; Jeong, S.H. High-Performance NO2 Gas Sensor Based on ZnO Nanorod Grown by Ultrasonic Irradiation. Sens. Actuators B Chem. 2009, 141, 239–243. [Google Scholar] [CrossRef]
  152. Bochenkov, V.E.; Sergeev, G.B. Sensitivity, selectivity, and stability of gas-sensitive metal-oxide nanostructures. In Metal Oxide Nanostructures and Their Applications; Umar, A., Hang, Y.B., Eds.; American Scientific Publishers: Valencia, CA, USA, 2010; pp. 31–35. [Google Scholar]
  153. Yuan, Z.; Yin, L.; Ding, H.; Huang, W.; Shuai, C.; Deng, J. One-step synthesis of single-crystalline ZnO nanowires for the application of gas sensor. J. Mater. Sci. Mater. Electron. 2018, 29, 11559–11565. [Google Scholar] [CrossRef]
  154. Priya, S.; Halder, J.; Mandal, D.; Chowdhury, A.; Singh, T.; Chandra, A. Hierarchical SnO2 nanostructures for potential VOC sensor. J. Mater. Sci. 2021, 56, 9883–9893. [Google Scholar] [CrossRef]
  155. Sahin, Y.; Öztürk, S.; Kılınç, N.; Käsemen, A.; Erkovane, M.; Ozturk, Z.Z. Electrical conduction and NO2 gas sensing properties of ZnO nanorods. Appl. Surf. Sci. 2014, 303, 90–96. [Google Scholar] [CrossRef]
  156. Öztürk, S.; Kılınç, N.; Öztürk, Z.Z. Fabrication of ZnO nanorods for NO2 sensor applications: Effect of dimensions and electrode position. J. Alloys Compd. 2013, 581, 196–201. [Google Scholar] [CrossRef]
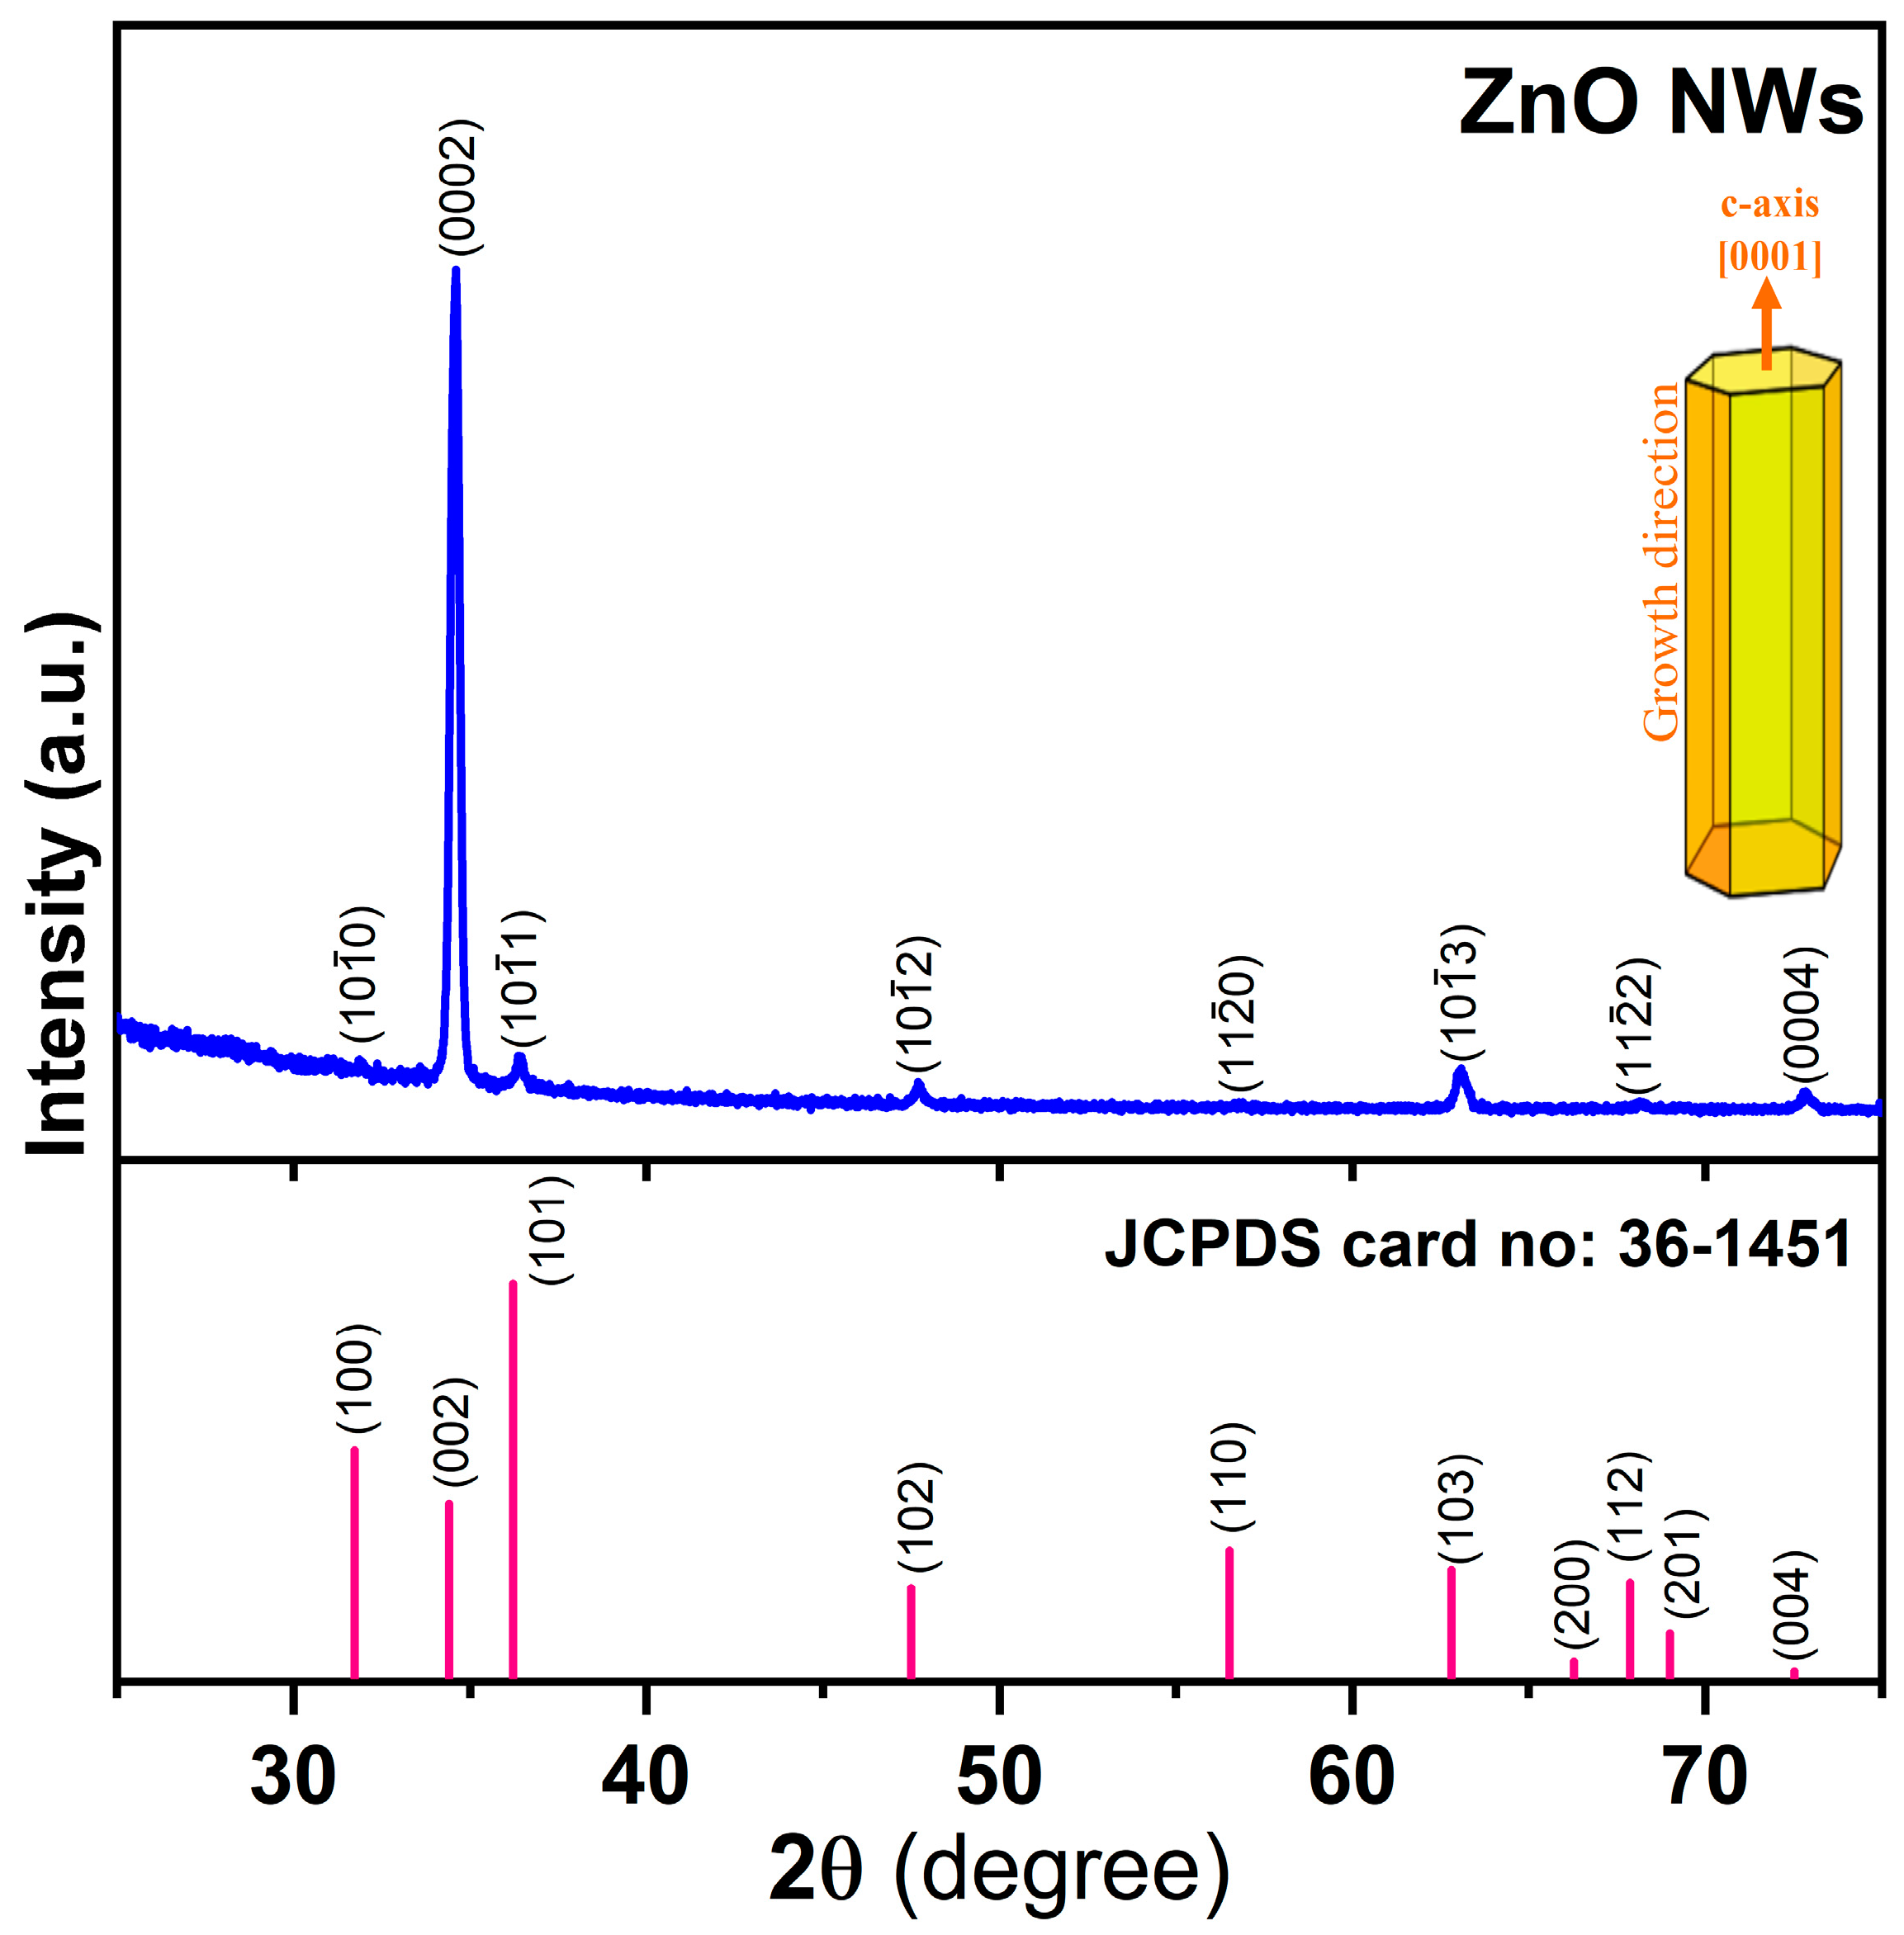
Figure 1. XRD pattern of ZnO NWs.
Crystals 13 01380 g001
Figure 2. FESEM images with different magnifications—(a) 3700×; (b) 6500×; (c) 14,000×; and (d) 65,000×—of ZnO NWs.
Crystals 13 01380 g002
Figure 3. The EDS spectrum of ZnO NWs.
Crystals 13 01380 g003
Figure 4. TEM images of the synthesized ZnO NWs: (a) conventional TEM; (b) HRTEM; the inset is a high-magnification TEM image revealing that the measured lattice spacing of 0.26 nm confirms the growth of ZnO NW in the [0001] direction.
Crystals 13 01380 g004
Figure 5. (a) Wide-scan XPS spectrum and high-resolution scan XPS of (b) C1s, (c) O1s, and (d) Zn2p of ZnO NWs. C1s peak position at ~284.6 eV is used as a binding energy reference to correct the XPS spectra in case of any charging effect.
Crystals 13 01380 g005
Figure 6. Room-temperate PL spectrum of as-prepared ZnO NWs.
Crystals 13 01380 g006
Figure 7. (a) The changes in the sensor resistance of the as-prepared ZnO NWs in various concentrations of NO2 at operating temperature of 200 °C. (b) Typical response and recovery times of the ZnO NW sensor when exposed to 2 ppm NO2 at 200 °C.
Crystals 13 01380 g007
Figure 8. Sensitivity curve of ZnO NWs with different concentrations of NO2 at 200 °C.
Crystals 13 01380 g008
Table 1. Volumetric flow rates of the target gas (NO2), dry air, and standard concentration of NO2 (Co = 0.1%).
MFC-1
NO2 (sccm)
MFC-2
Dry Air (sccm)
NO 2   Concentration   in   Tube :   C d u l i t e d (ppm)
14992
34986
549510
Table 2. Comparison of intensity ratios IUV/IDL of ZnO nanostructures synthesized using different methods.
MorphologySynthesis MethodIUV/IDLReferences
ZnO NWsPulsed laser deposition~11.9–45.4[94]
ZnO nanorodsHydrothermal~0.3[95]
ZnO nanorodsHydrothermal~0.6[96]
ZnO nanorodsHydrothermal>19[97]
ZnO nanorodsHydrothermal~0.6–10[98]
ZnO nanorodsThermal decomposition~1.8[99]
ZnO NWsPhysical vapor deposition2.5–4.7[90]
ZnO NWsThermal evaporation~1.4[91]
ZnO nanocolumnsThermal evaporation~2.4[92]
ZnO NWsThermal evaporation~16.2[93]
ZnO NWsThermal evaporation>77Present work
Table 3. Sensitivities measured at different NO2 concentrations for the ZnO NW sensor at temperature of 200 °C.
NO2 Conc. (ppm)Sensitivity (S)
21.02
61.09
101.15
Disclaimer/Publisher’s Note: The statements, opinions and data contained in all publications are solely those of the individual author(s) and contributor(s) and not of MDPI and/or the editor(s). MDPI and/or the editor(s) disclaim responsibility for any injury to people or property resulting from any ideas, methods, instructions or products referred to in the content.