Article

Effect of Mischmetal Addition on Microstructure and Mechanical Properties of As-Cast and As-Rolled Mg–Sn–Ca Alloys

1
Hunan Provincial Key Laboratory of Vehicle Power and Transmission System, Hunan Institute of Engineering, Xiangtan 411104, China
2
School of Mechanical Engineering, Hunan Institute of Engineering, Xiangtan 411104, China
*
Author to whom correspondence should be addressed.
Crystals 2023, 13(9), 1379; https://doi.org/10.3390/cryst13091379
Submission received: 24 August 2023 / Revised: 13 September 2023 / Accepted: 15 September 2023 / Published: 17 September 2023
(This article belongs to the Special Issue Micro-Structure and Mechanical Properties of Alloys)

Abstract

:
The microstructures and mechanical properties of Mg–3Sn–0.1Ca–xMM (mischmetal, x = 0.3, 0.6, and 0.9 wt.%) alloys were investigated. Optical microscopy (OM), scanning electron microscopy (SEM) and X-ray diffraction spectroscopy (XRD) were used to characterize the microstructures and phase constitutions of the cast and rolled alloys. Room temperature tensile tests were conducted to obtain the mechanical properties and macro-textures to evaluate the texture weakening effect results of the MM. The results show that an abundance of second phase formed, confirmed as the (Ca,MM)MgSn phase, and the volume fraction increased with the increasing MM addition. The tensile yield strength of the as-cast alloys increased with the MM addition, but the elongation decreased. All of the rolled Mg–3Sn–0.1Ca–xMM alloys showed a strong basal texture, and only slightly decreased in intensity after annealing treatment due to the particle-stimulated nucleation of recrystallization. The as-annealed Mg–3Sn–0.1Ca–0.6MM alloys exhibited the highest tensile strengths of 266.5 ± 3.3 MPa and 136.1 ± 3.7 MPa, which are mainly ascribed to grain refinement strengthening, Orowan strengthening and texture strengthening.

1. Introduction

Mg alloys have attracted interest in recent years due to their low density and high specific strength. Nevertheless, the main challenges for the applications of Mg wrought alloys are their poor ductility and low absolute strength at room temperature. It is known that the addition of Sn can obviously improve the strength of Mg alloys [1,2,3]. On the one hand, Sn shows high solid solubility in Mg and provides a solution strength effect based on the Mg–Sn binary phase diagram. On the other hand, fine stable Mg2Sn particles precipitated from the matrix can pin grain boundaries and prohibit the growth of the recrystallized grains due to their high melting temperature, and provide an extra strengthening effect. For example, Shi et al. [4] studied the solid solution effects of Mg–Sn binary alloys with various Sn contents and found that the tensile yield strength increased with the Sn concentration. Nayyeri et al. [5] investigated an Mg–Sn alloy with different Ca additions and suggested that thermally stable precipitates benefit the mechanical properties by hindering grain growth during the annealing process. Zhang et al. [6] developed a Mg–Sn–Ca-based extrusion alloy with ultrafine DRXed grains of about 0.35 μm and an excellent yield strength record of 450 MPa and ductility of 5%. Verma et al. [7] found that a hot-rolled Mg–Sn–Zn alloy exhibited a high yield strength of 315 MPa and elongation of 9%, and ascribed these results to the solid solution strengthening and fine grain size and RD-tilting texture. Therefore, Mg–Sn based alloys exhibit good potential for high performance Mg alloys with high tensile strength and ductility.
The addition of Ca and RE elements in Mg alloys are considered to be an effective texture modifier to improve the room temperature ductility of Mg alloys. Numerous studies have reported that adding dilute Ca or RE elements to Mg–Zn alloys can effectively tailor their basal texture, and hence increase their elongation [8,9,10,11]. Meanwhile, it was also reported that the addition of Ca and RE elements in Mg–Sn alloys, i.e., Mg–Sn–Ca alloy [6], Mg–Sn–Ce alloys [12,13,14] and Mg–Sn–Y [15,16] alloy, showed weak texture and a good balance of mechanical properties. However, high concentrations of Ca added to Mg–Sn alloys could result in phase constitution from the Mg2Sn to the CaMgSn phase, or combine with the Mg2Ca phase, with the coarse CaMgSn phase to deteriorate the mechanical properties [5,17]. Moreover, it was found that the Mg–Ca binary alloy and the Mg–Zn–Ca alloy both exhibited weak textures, even with the 0.1 wt.% Ca addition [18,19,20].
In contrast to the pure single RE elements such as Gd, Ce, Y, etc., misch metal (MM) is the residual ancillary product that is extracted out of high-value elements, and the cost of MM is much lower than that of a single RE element. Therefore, in this study, variants of MM were added to the Mg–3Sn–0.1Ca alloys to form Mg–3Sn–0.1Ca–xMM (x = 0.3, 0.6, and 0.9 wt.%) alloys, and the effects of the MM additions on the microstructures and mechanical properties of the three alloys at room temperature were investigated.

2. Materials and Methods

2.1. Billets Preparation

The Mg–3Sn–0.1Ca–xMM (x = 0.3, 0.6, and 0.9 wt.%) alloy ingots were prepared with the permanent mold-casting method with high purity Mg (99.9 wt.%) and pure tin (99.9 wt.%), Mg–20Ca (wt.%) master alloys and Ce-rich mischmetal (MM, mainly containing rare earth elements Ce and La), which were melted in a mild steel crucible at 780 °C under the protection of SF6 and a CO2 mixed gas atmosphere. Then, the melt was stirred equably, held for 30 min and poured into a cuboid permanent mold with the dimensions of 100 mm × 100 mm × 50 mm, at 730 °C. For simplicity, these alloys were denoted as 0.3MM, 0.6MM and 0.9MM alloys.

2.2. Hot Rolling Process

The 20 mm thickness hot rolling samples were machined from the cast ingots and homogenized at 480 °C for 600 min, and then quenched in hot water. A double roller rolling mill with a roller diameter of 350 mm and a rolling speed of about 16 m/min was used. Neither heating nor lubrication of the roller was conducted during the rolling process. Six rolling passes and rolling reductions of about 15–40% were carried out at 350–400 °C to obtain the final 2.5 mm (total rolling reduction of about 87.5%) thickness rolled sheets. Between each pass, the samples were reheated for 30 min to maintain the rolling temperature of 350 °C. An annealing treatment for 60 min was performed for the rolled samples, in order to obtain fully recrystallized microstructures.

2.3. Microstructure Characterization and Mechanical Properties Testing

Inductively coupled plasma-atomic emission spectroscopy (ICP-AES) was used to measure the actual chemical composition of the ingots, as listed in Table 1. X-ray diffractometer (Rigaku D/Max 2400, Applied Rigaku Technologies, Inc., Cedar Park, TX, USA) with Cu Kα radiation was employed to analyze the phase constitution. The microstructures were characterized with optical microscopy (OM, Leica DM 3000, Leica Microsystems Pty Ltd., North Ryde, Australia) and a scanning electron microscope (SEM, ZEISS EVOMA10, ZEISS Microscopy, Macquarie Park, Australia) equipped with an X-ray energy-dispersive spectrometer (EDS) operating at 20 kV. Metallographic observations were conducted in the as-cast and as-rolled specimens after they were etched with a 4% nitric acid alcohol solution and acetic picral solution (mixture of 4.2 g of picric acid, 10 mL of acetic acid, 10 mL of water and 70 mL of ethanol), respectively. Three incomplete {0002}, {10 1 ¯ 0} and {10 1 ¯ 1} pole figures were measured with an X-ray diffractometer (Brucker D8 DISCOVER) with Cu Kα radiation at the RD–TD planes, and then DIFFRACplus TEXEVAl software was used to calculate the macro-texture.
Tensile tests under the conditions of room temperature and an initial strain rate of 10−3 s−1 were conducted on a Sans 5105 universal tensile testing machine for the purpose of evaluating the mechanical properties of the cast and rolled alloys. Dog bone specimens with a gauge length of 20 mm and sectional dimensions of 3.5 mm × 2 mm were cut off from the cast ingots and rolled sheets, respectively, using a wire electrode cutting machine. To ensure the repeatability of the data, three specimens were used for each experimental condition.

3. Results

3.1. Microstructure of the As-Cast Alloys

Figure 1 shows the OM and SEM microstructures of the as-cast Mg–3Sn–0.1Ca–xMM alloys. Typical dendritic microstructures (highlighted with red dash lines) consist of an α-Mg and eutectic phase can be discerned, as shown in Figure 1a–c. The 0.6MM alloy showed relatively fine and uniform equiaxial dendrites among the three alloys, while the 0.9MM alloy still contained large dendrites compared with the 0.3MM alloy. The average sizes of the dendrites were approximately 284 ± 5 μm, 257 ± 2 μm and 302 ± 8 μm. Moreover, the quantity and size of the interdendritic eutectic phase gradually increased from the 0.3MM alloy to the 0.9MM alloy (Figure 1d–i). Meanwhile, the second phase changed from round and short rod-shaped to rod and feathery-shaped, and even fibrous-shaped, as shown in Figure 1g–i. In order to further verify the phase types of the particles with different shapes, typical points A, B and C in Figure 1j–l were selected and the EDS results were obtained, as shown in Figure 1m–o. The round particles marked as point A mainly contain Sn and could be identified as the Mg2Sn phase, although there is still some Ca (Figure 1j). Similar Mg2Sn phase particles were also found in the 0.6MM and 0.9MM alloys; nevertheless, the number fraction decreased with increasing MM addition. This result agrees with the phase constitution reported in the Mg–Sn–Ce alloy [13]. Due to the coexistence of all of the elements, the feathery- and fibrous-shaped phases indicated by points B and C, respectively, were difficult to judge solely on the basis of the EDS results.
In order to further discern the phase constitution in the studied alloys, XRD was used and the XRD patterns of the as-cast alloys are shown in Figure 2. It can be seen that all of the three alloys presented the characteristic peaks of the α-Mg phase (PDF#35-0821) and the Mg2Sn phase (PDF#7-0274), while the alloys with more MM showed a lower peak height of the Mg2Sn phase (see green arrows in Figure 2). This reflected the decreased Mg2Sn phase, and it coincides with the results of the SEM images in Figure 1. However, there still remained some peaks that belong to an unknown phase according to the database of the Jade 6 software. As reported in the literature, Mg–Sn–Ca alloys may contain a CaMgSn phase when alloyed with dilute Ca [21,22], and Mg–Sn–RE alloys may exist with Mg12RE, Mg17RE2 or RE5Sn3 phases [23], and an REMgSn intermetallic compound [12,24] with the addition of RE elements, including La or Ce, etc. It was difficult to discern the detailed phases in this study, especially the alloys added with both Ca and RE elements. Fortunately, Kozlov et al. [25] investigated the phase formations in Mg–Sn–Ce and Mg–Sn–Ce–Ca alloys, and found that the quaternary Mg–Ca–Ce–Sn system exhibited high solid solubility of Ca and the existence of a (Ca,Ce)MgSn intermetallic phase with the same crystal structure. Du et al. [26] also provided similar results with Mg–Sn–Ca–La alloys. They found that the dissolution of Ca converts the LaMgSn phase to form the (La,Ca)MgSn phase based on cooling curve thermal analyses and SAED via TEM assisted with FIB [24,26]. According to the calculated pattern of the (La,Ca)MgSn phase [26] and phase diagrams of Mg–Sn–Ca–Ce alloys [25], the unknown phase was identified as a (Ca,MM)MgSn phase, as shown in Figure 2. It can be seen that the peak height of the (Ca,MM)MgSn phase increased with the MM addition (see pink arrows). Moreover, the EDS results of points B and C in Figure 1m–o revealed that the the Sn/(Ca + La + Ce) atom ratios were close to 1:1. It means that those short rod- or feathery- and fibrous-shaped phases belong to the (Ca,MM)MgSn phase. Due to the lower addition of MM (less than 1 wt.%), no Mg12MM phase was found based on extra EDS results, and agree with the study of Du et al. [24]. Thus, the phase constitution of the three alloys were α-Mg + Mg2Sn + (Ca,MM)MgSn.

3.2. Microstructure and Texture of the Rolled Sheets

Figure 3a–c illustrate the OM images of the as-rolled alloys. Many twins and some fine recrystallized (RX) grains (indicated by black arrows) can be seen in all of the alloys, as demonstrated in Figure 3a–c. It should be noted that the fractions of twins increased while the fractions of RX grains decreased with the increasing MM addition. Meanwhile, the second phase particles elongated along the rolling direction, as can be discerned in Figure 3d–f. Moreover, the rolled alloys still exhibited a lot of the second phase after multi-pass hot rolling, even though the volume fraction was lower than that of the as-cast alloys. Chai et al. [12] also showed that the Mg–Sn–Ca–Ce alloy still exhibited a lot of the (Ca,Ce)MgSn phase, in spite of the high-temperature severe extrusion (430 °C, extrusion ratio of 32:1). It means that the (Ca,MM)MgSn phase is thermally stable, as suggested by Kozlov et al. [25] and Du et al. [26]. The OM maps of the as-annealed alloys are shown in Figure 4. A fully recrystallized microstructure can be found, as shown in Figure 4a–c. Meanwhile, it can be discerned that a typical bimodal microstructure exists, with coarse grains (indicated by green arrows) larger than 50 μm and fine grains (indicated by green arrows) smaller than 20 μm for all of the alloys. Moreover, most of the fine grains are located at the sites around the second phase particles, which can be considered to be the result of particle stimulated nucleation (PSN) during recrystallization. The white rectangle area in Figure 4c was selected and rephotographed with a higher magnification to show the fine grain structure in the 0.9MM alloys, as shown in Figure 4d, which illustrates fine RX grains with an average grain size about 7.8 μm. According to the microstructures of the three alloys, it can be found that the average grain size of the 0.3MM, 0.6MM and 0.9MM alloys were approximately 44 ± 3 μm, 32 ± 2 μm and 25 ± 2 μm, respectively. Thus, the increasing MM addition decreased the grain size of the as-annealed alloys.
A typically strong basal texture can be found based on the (0002) pole figures of the rolled alloys, as shown in Figure 5. However, the intensity of the basal texture gradually decreased with the increased MM concentration, i.e., 20.31 m.r.d., 17.40 m.r.d. and 13.58 m.r.d. for the 0.3MM, 0.6MM and 0.9MM alloys, respectively, as presented in Figure 5a–c. Figure 5d–f show the macro-textures of the as-annealed alloys. Compared with the as-rolled alloys, the as-annealed alloys show the relative lower texture intensity. It indicates that the Mg–3Sn–0.1Ca–xMM alloys showed a texture weakening effect due to MM addition. Meanwhile, the 0.9MM alloy showed the lowest basal texture intensity of 11.92 m.r.d., and this demonstrates that the increased MM addition enhanced the texture weakening effect.

3.3. Mechanical Properties and Fracture Analysis

Figure 6 demonstrates the representative tensile curves of the as-cast and as-annealed alloys. The detailed data of the mechanical properties are summarized in Table 2. Based on the experimental results of the as-cast alloys, it can be found that the 0.3MM alloy shows the highest elongation of 10.2 ± 0.5% but the lowest ultimate tensile strength (UTS) of 130.3 ± 1.3 MPa and a yield strength (YS) of 43.4 ± 1.6 MPa. Meanwhile, the 0.6MM alloy presents a moderate elongation of 8.7 ± 0.3% and a YS of 45.3 ± 1.6 MPa. Moreover, the 0.9MM alloy shows the lowest elongation of 6.6 ± 0.4% but the highest YS of 53.8 ± 2.0 MPa. It should be mentioned that the 0.6MM alloy illustrates a UTS of 141.6 ± 2.8 MPa, which is a little higher than that of the 0.9MM alloy with a UTS of 138.7 ± 3.3 MPa. It can be found from Figure 6b that the rolled alloys show much higher strength than the as-cast alloys. The as-annealed 0.3MM alloy shows a UTS of 245.8 ± 1.2 MPa, a YS of 125.2 ± 2.8 MPa and an elongation of 12.3 ± 0.3%. In contrast, the as-annealed 0.6MM alloy shows a UTS of 266.5 ± 3.3 MPa, a YS of 136.1 ± 3.7 MPa and an elongation of 12.1 ± 0.5%. Similar to the as-cast alloys, the as-annealed 0.9MM alloy shows the worse tensile ductility with an elongation of 8.3 ± 0.4%. Meanwhile, it shows a UTS of 229.0 ± 2.3 MPa and a YS of 123.4 ± 3.2 MPa.
Fracture morphologies of the as-annealed tensile test samples were selected to analyze the detailed differences in mechanical properties of the Mg–3Sn–0.1Ca–xMM alloys, as shown in Figure 7. An obvious crack in a large-sized second phase particle can be found in the 0.3MM alloy, as indicated by the yellow arrows in Figure 7a. In addition, some tearing ridges can also be found in the fracture surface, as shown by orange arrows (Figure 7a). In contrast to the 0.3MM alloy, there exist a lot second phase induced cracks due to the large number of second phase particles in the 0.6MM and 0.9MM alloys, as shown in Figure 7b,c. Meanwhile, the same tearing ridges still can be seen in the 0.6MM alloy, but are nearly absent in the 0.9MM alloy. Instead of of tearing ridges, many cleavage planes (indicated by red arrows) and grain boundaries can be found in the 0.9MM alloy, as shown in Figure 7c, and this indicates that the 0.9MM alloy presented an intergranular brittle fracture manner. The above details of the fracture morphologies reflected that the fracture mode transformed from quasi-cleavage fracture to a mixture of cleavage fracture and intergranular brittle fracture with the increasing MM concentration. Figure 7d–f shows the side plane of the alloy samples under the fracture stain. Many broken large second phase particles can be seen in all of the alloys (indicated by green arrows). However, for the 0.6MM and 0.9MM alloys, typical cracks can be seen with lengths larger than 20 μm. Moreover, those cracks are near the high density of second phase particles. It can be deduced that the second phase could be one of the reasons for the lower elongation of the 0.9MM alloys.

4. Discussion

4.1. Effect of MM Addition on the Microstructure and Texture of the Mg–Sn–Ca Alloys

Usually, RE elements obviously affect the grain size, particle size and shape of the second phase of Mg alloys. Research has shown that minor additions of Ce in ternary Mg–Sn–Ca alloys can lead to grain refinement of the both as-cast and as-deformed alloys, as well as refine the CaMgSn phase [12,27]. In the present study, all of the as-cast Mg–3Sn–0.1Ca–xMM alloys presented a typical dendritic morphology, and the as-cast 0.6MM alloy illustrated the smallest dendrite sizes (Figure 1a–c), which are different from the reported Mg–1Sn–0.6Ca–xCe alloy [12]. A similar phenomenon was found in the as-cast Mg–3Sn–xGd alloys [28] and Mg–0.5Sn–0.3Y alloy [16], where minor RE addition coarsened the grain size of the as-cast alloys. In addition, E.Karakulak et al. [29] summarized that Ca showed a controversial effect in Mg alloys. S.H. Kim et al. [30] illustrated that co-alloyed Ca and Y could coarsen the grain size of the as-cast AZ31 alloy. Thus, the above difference may be ascribed to both the Ca and RE concentrations. The other significant impact of MM on the Mg–3Sn–0.1Ca–xMM alloys was that the Mg2Sn phase decreased and the CaMgSn phase transformed to a (Ca,Ce)MgSn phase with the increasing MM concentration. Meanwhile, the (Ca,Ce)MgSn phase particles were refined (Figure 1j–l). Moreover, the increasing MM addition augmented the volume fraction of the second phase. Figure 8 displays the variation trend of the quantity of the second phase in the as-cast and as-annealed alloys. The result shows that the volume fraction of the second phase in the as-cast 0.3MM alloy is approximately 2.75 ± 0.15%. For the 0.6MM alloy, the fraction is approximately 3.92 ± 0.21%. Further additions of MM result in an obvious improvement in volume fraction of the second phase, approximately 7.61 ± 0.44% in the as-cast 0.9MM alloys. Due to the repeated hot rolling and intermediate annealing procedure, the quantity of the second phase decreased in the as-annealed alloys when compared with the as-cast alloys. However, the as-annealed 0.9MM alloy still presents a lot of the second phase, approximately 5.43 ± 0.36%, which is much higher than the rest of the alloys. The large amount of reserved second phase in the 0.9MM played a important role on the microstructure. On the one hand, the high density of micro-sized second phase particles accumulated larger strain after the rolling deformation, and facilitated recrystallization nucleation during the annealing treatment. In this study, PSN induced fine grains (Figure 4) that generated the decreasing average grain size of the as-annealed 0.6MM and 0.9MM alloys. On the other hand, the micro-sized (Ca,MM)MgSn phase particles containing a lot of RE elements showed a high thermal stability [25,26]. According to the classical Zener drag theory, the Zener drag pressure induced by the second phase particles was proportional to the volume fraction and inversely proportional to the particle size [31]. Therefore, grain growth was suppressed in the 0.9MM alloy and resulted in fine grains in the annealed samples. Thus, the decreased grain size of the as-annealed alloys with the increasing MM concentration mainly resulted from the abundance of reserved second phase particles.
It is known that RE and Ca elements weaken the basal texture of Mg alloys after hot deformation and recrystallization, and then improve the room temperature ductility of Mg alloys [8,11]. Reports show that adding rare earth elements can weaken the texture of Mg–Sn alloys. Wang et al. [15] found that Mg–0.4Sn–0.7Y (wt.%) extruded sheet presented a splitting texture and illustrated a good balance of ductility and formability. Chai et al. [12] reported a weak texture in the extrusion of Mg–1.0Sn–0.6Ca alloys with minor Ce element addition. The above extruded alloys both showed a two-peak texture with peaks tilting towards ED, which was similar to the rolled Mg–Zn–RE alloys [10]. However, both of the as-rolled and as-annealed alloys in the present study still showed a strong basal texture (Figure 5) rather than the reported two-peak texture, and the texture intensity was comparable to the commercial rolled AZ31 alloys [32]. Considering the dramatic texture change in Mg–Zn alloys with trace RE or Ca addition, and the sluggish texture modification in the Mg–3Sn–0.1Ca–xMM alloys, it can be deduced that MM does not weaken the texture of Mg–3Sn–0.1Ca alloys, although the texture intensity decreased with the increasing MM addition and further decreased during the annealing treatment. Compared to the results of the above studies, this different texture may come from the concentration of Sn. In this study, the Sn concentration was about 3.0 wt.%, and the maximum addition of MM was only about 0.9 wt.%, and nearly all of the MM elements combined with Sn or Mg and formed the second phase. Meanwhile, Mg2Sn phase particles can be observed among the 0.3MM, 0.6MM and 0.9MM alloys (Figure 1g–i), which proves Sn was superfluous. In contrast, the abovementioned Mg–0.4Sn–0.7Y (wt.%) or Mg–1.0Sn–0.6Ca–xCe (wt.%) alloys presented lower Sn concentrations and more Y or Ce. Meanwhile, no Mg2Sn phase particles existed, but extra Y or Ce solute atoms were reserved. The prevailing viewpoint of texture weakening mechanisms caused by RE in Mg alloys is mainly the segregation and clustering of RE atoms [33]. For the Mg–Zn–RE alloys, the facilitated formation of Zn–RE co-segregation resulted in the two-peak RE texture [34]. Thus, for the Mg–3Sn–0.1Ca–xMM alloys in this study, the formed strong basal texture can be responsible to the lack of sufficient MM solute atoms, while the two-peak texture in the abovementioned studies resulted from there being enough RE. On the other hand, particles (>1 μm) could act as nucleation sites for recrystallization, known as PSN, finally leading to texture weakening [35]. As shown in Figure 1g–i and Figure 4, the large amount and appropriate size of the second phase particles, resulting from high contents of Sn and MM, may have weakened the rolled and annealed texture of the studied alloys, which coincided with the measured texture results (Figure 5). Therefore, the decreasing intensity of Mg–3Sn–0.1Ca–xMM alloys with increasing MM addition in the as-rolled and as-annealed states were more likely attributed to the PSN effect.

4.2. Effect of MM Addition on the Mechanical Properties of the Mg–Sn–Ca Alloys

As mentioned above, MM addition resulted in a lot of second phase in the microstructures of the studied alloys. Since the brittle second phase is incompatible with the deformation strain of the Mg matrix during the tensile test, the brittle (Ca,MM)MgSn phase particles are harmful to the tensile ductility. Thus, the as-cast 0.3MM alloy showed the highest tensile elongation due to the lower fraction of second phase particles. On the other hand, a lot of the (Ca,MM)MgSn phase acts as a strong obstacle to the dislocation motion, and consequently improves the yield strength. In addition, grain refinement can also improve the yield strength. Thus, the 0.6MM alloy, which presented the related uniform fine equiaxial dendrites and moderated the volume fraction of the second phase when compared with the other two alloys, showed a balance of strength and ductility, approximately 141.6 ± 2.8 MPa, 45.3 ± 1.8 MPa and 8.7 ± 0.3% for the UTS, YS and tensile elongation, respectively. The mechanical properties of the as-cast 0.6MM alloy are much higher than the reported Mg–4Sn–2.34La–0.68Ca alloy, which showed a UTS of 102 MPa and an elongation of 4.3% [26]. It should be mentioned that the as-cast 0.9MM alloy showed a comparable UTS with the as-cast 0.6MM alloy, but an obviously higher YS. Therefore, the mechanical properties of the as-cast alloys related to the dendritic size and second phase. In the present study, the YS of the as-cast Mg–3Sn–0.1Ca–xMM alloys increased with the increasing MM addition.
For the wrought Mg alloy, the room temperature mechanical properties mainly related to grain size, texture and the second phase. Usually, a fine grain size and homogeneously distributed small second phase give rise to high strength, and a weak texture as well as less second phase facilitate ductility [8,22]. Due to the strong basal texture, all of the as-annealed alloys show poor ductility (Figure 6b), and the tensile elongation was even lower than that of the commercial AZ31 rolled sheet. In contrast with the as-annealed 0.3MM and 0.6MM alloys, the as-annealed 0.9MM alloys with the lowest basal texture intensity (still high) illustrated the lowest elongation, about 8.3%, and this can be mostly ascribed to the largest amount of the residual second phase (Figure 3 and Figure 8). Studies proved that a brittle second phase can lead to premature failure during tensile tests, and be harmful to the ductility [36]. The reported high ductile Mg–Sn–RE-based alloys mainly showed a weak texture and decreased second phase [12,15,16]. It is worth mentioning that traditional rolling technology is not an effective way to crushing the bulky second phase and controlling its morphology in Mg alloys when compared with extrusion. Similar low ductility has also been found in rolled Mg–Zn–Ca alloys with a bulky second phase and even weak non-basal texture [8]. Zha et al. [37] achieved high strength and ductility in an Mg–Al–Sn–Ca alloy by nodulizing and refining the coarse CaMgSn phase. In this study, the as-annealed 0.6MM alloy presented the highest UTS of 266.5 ± 3.3 MPa and YS of 136.1 ± 3.7 MPa. The first reason for this is that the as-annealed 0.6MM alloy has a smaller grain size and higher fraction of the second phase than the as-annealed 0.3MM alloy. According to the grain refinement strengthening and Orowan strengthening, the strengthening effect of the as-annealed 0.6MM is higher than that of the as-annealed 0.3MM alloy. The second reason is that the basal texture intensity of the 0.6MM alloy is much higher than that of the 0.9MM alloy. A strong basal texture means grains with hard orientation for deformation that give rise to high strength, which is known as texture strengthening. It should be mentioned that the as-annealed 0.9MM alloy exhibited the lowest YS, although it showed the smallest grain size. This may due to texture softening.

5. Conclusions

In this study, the effects of mischmetal addition on the microstructure and mechanical properties of as-cast and as-rolled Mg–3Sn–0.1Ca–xMM (x = 0.3, 0.6, and 0.9 wt.%) alloys were investigated, and the conclusions can be summarized as follows:
(1)
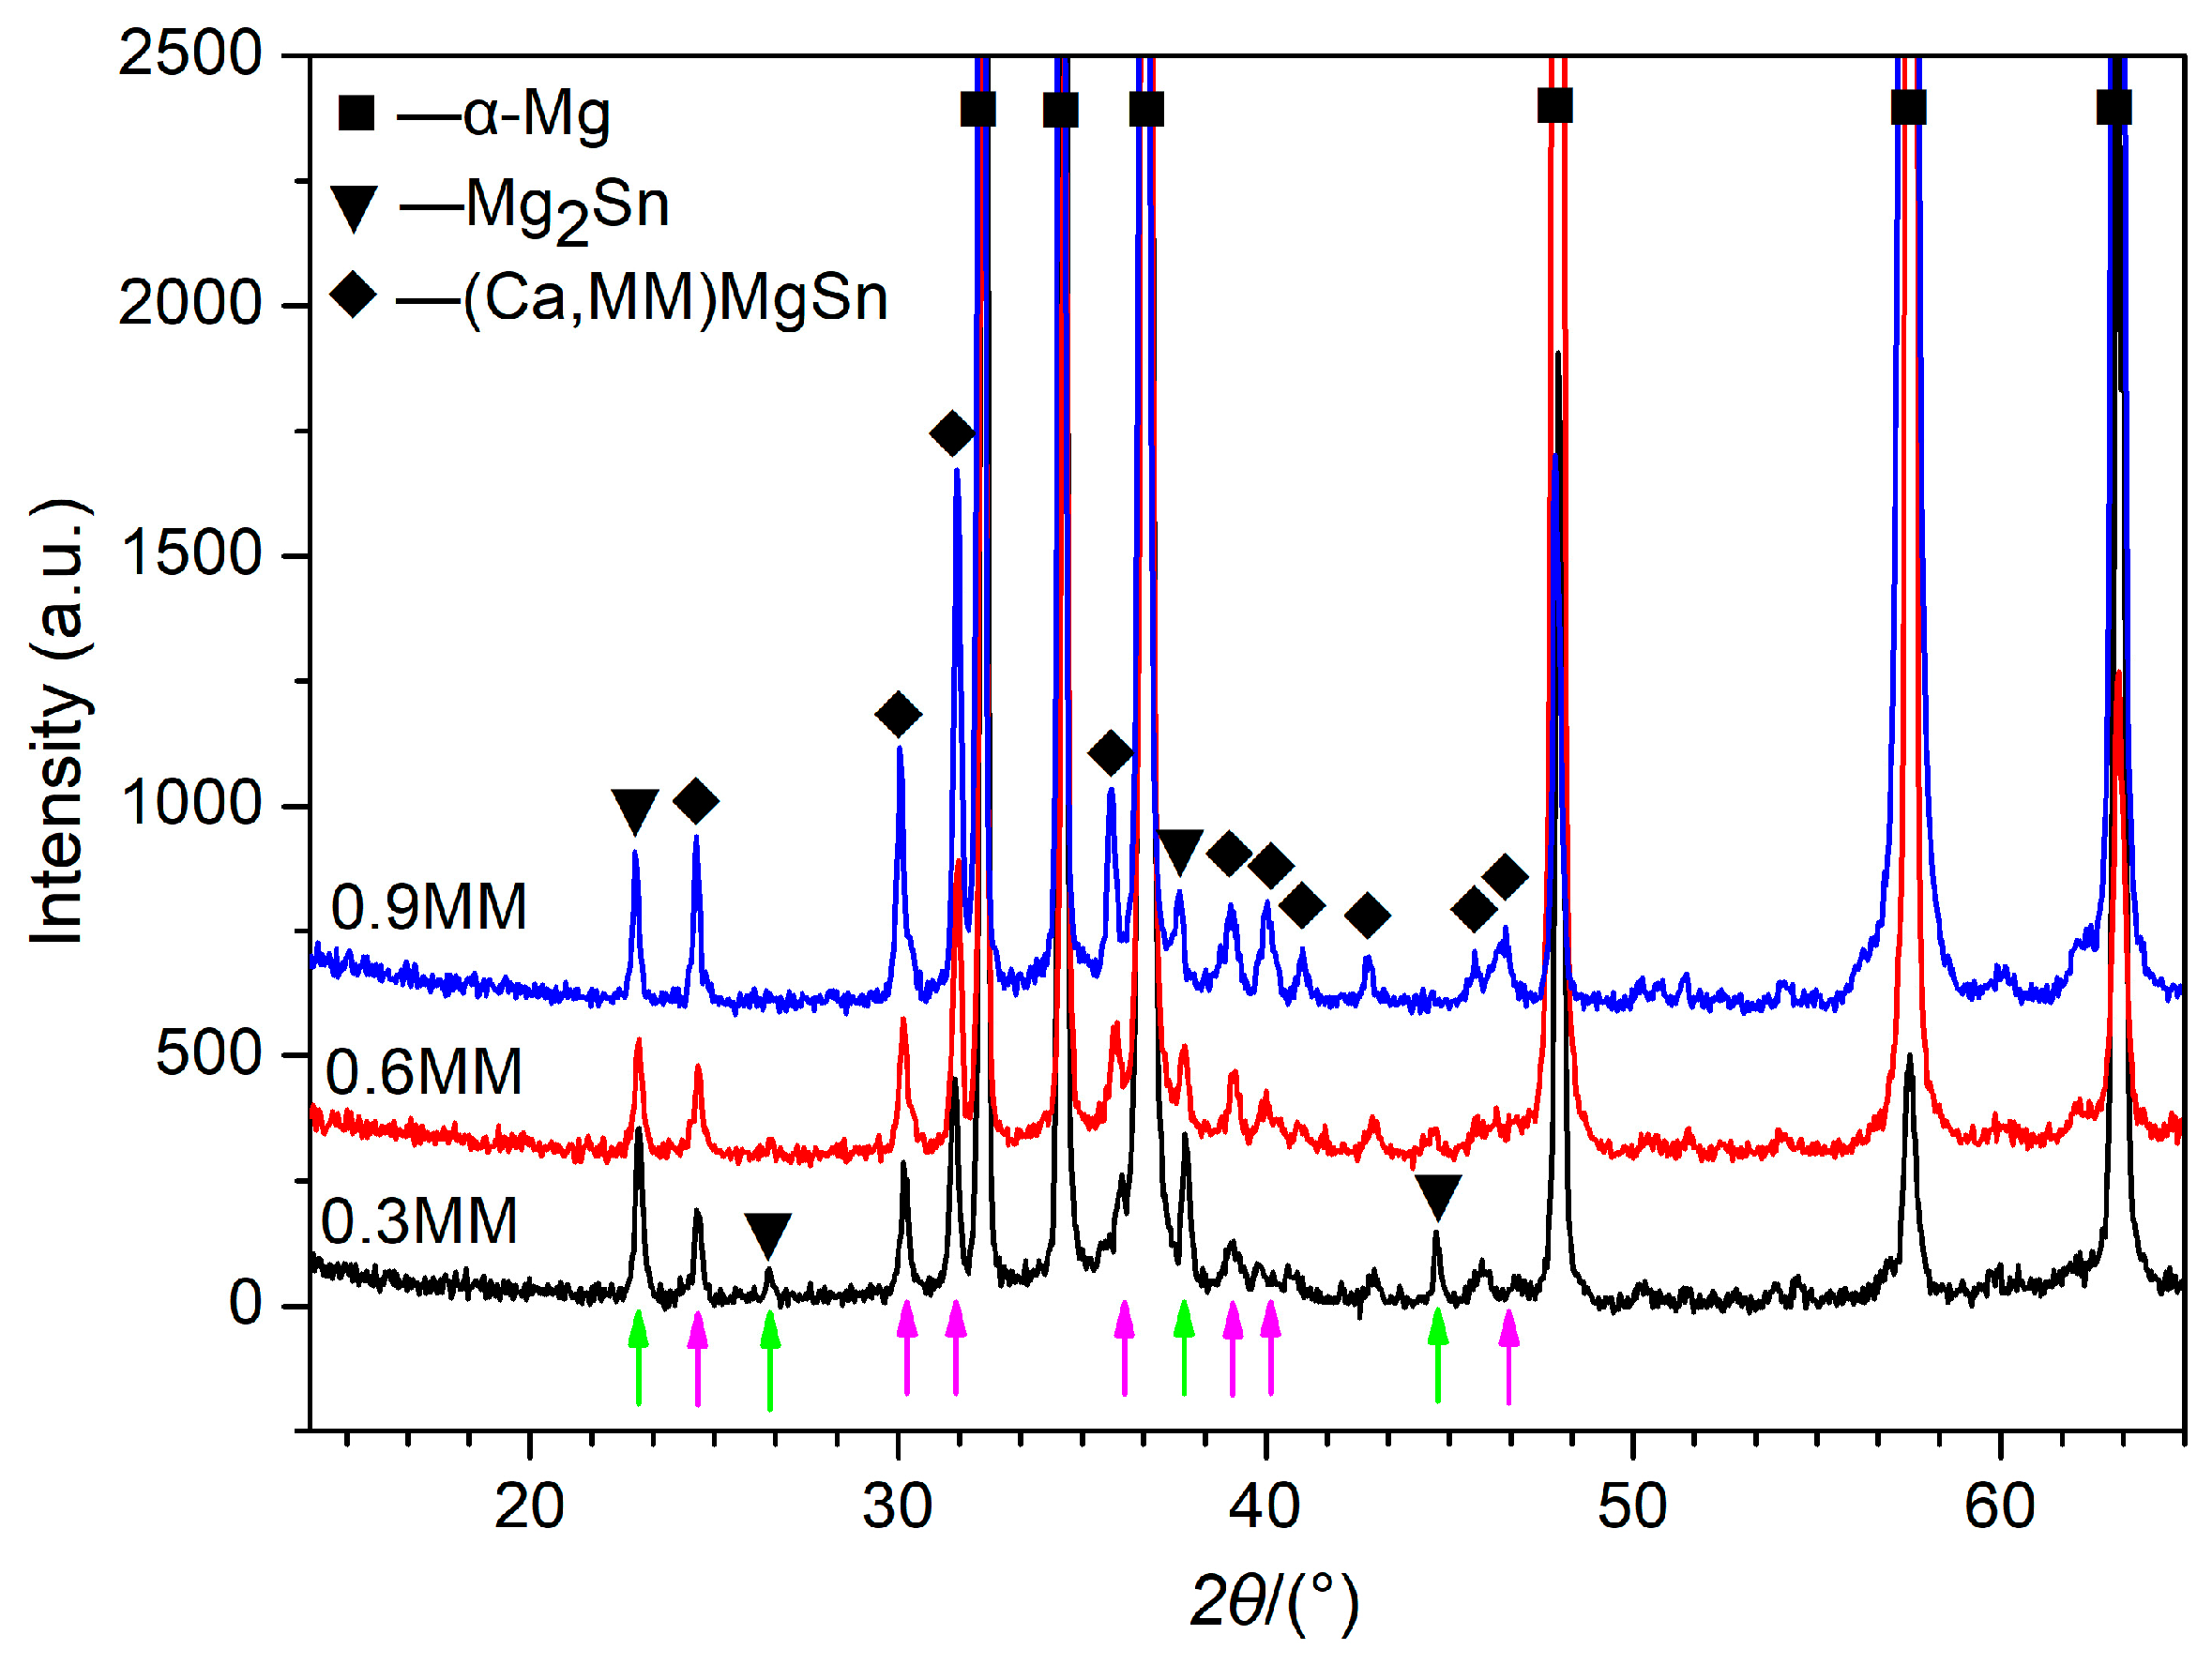
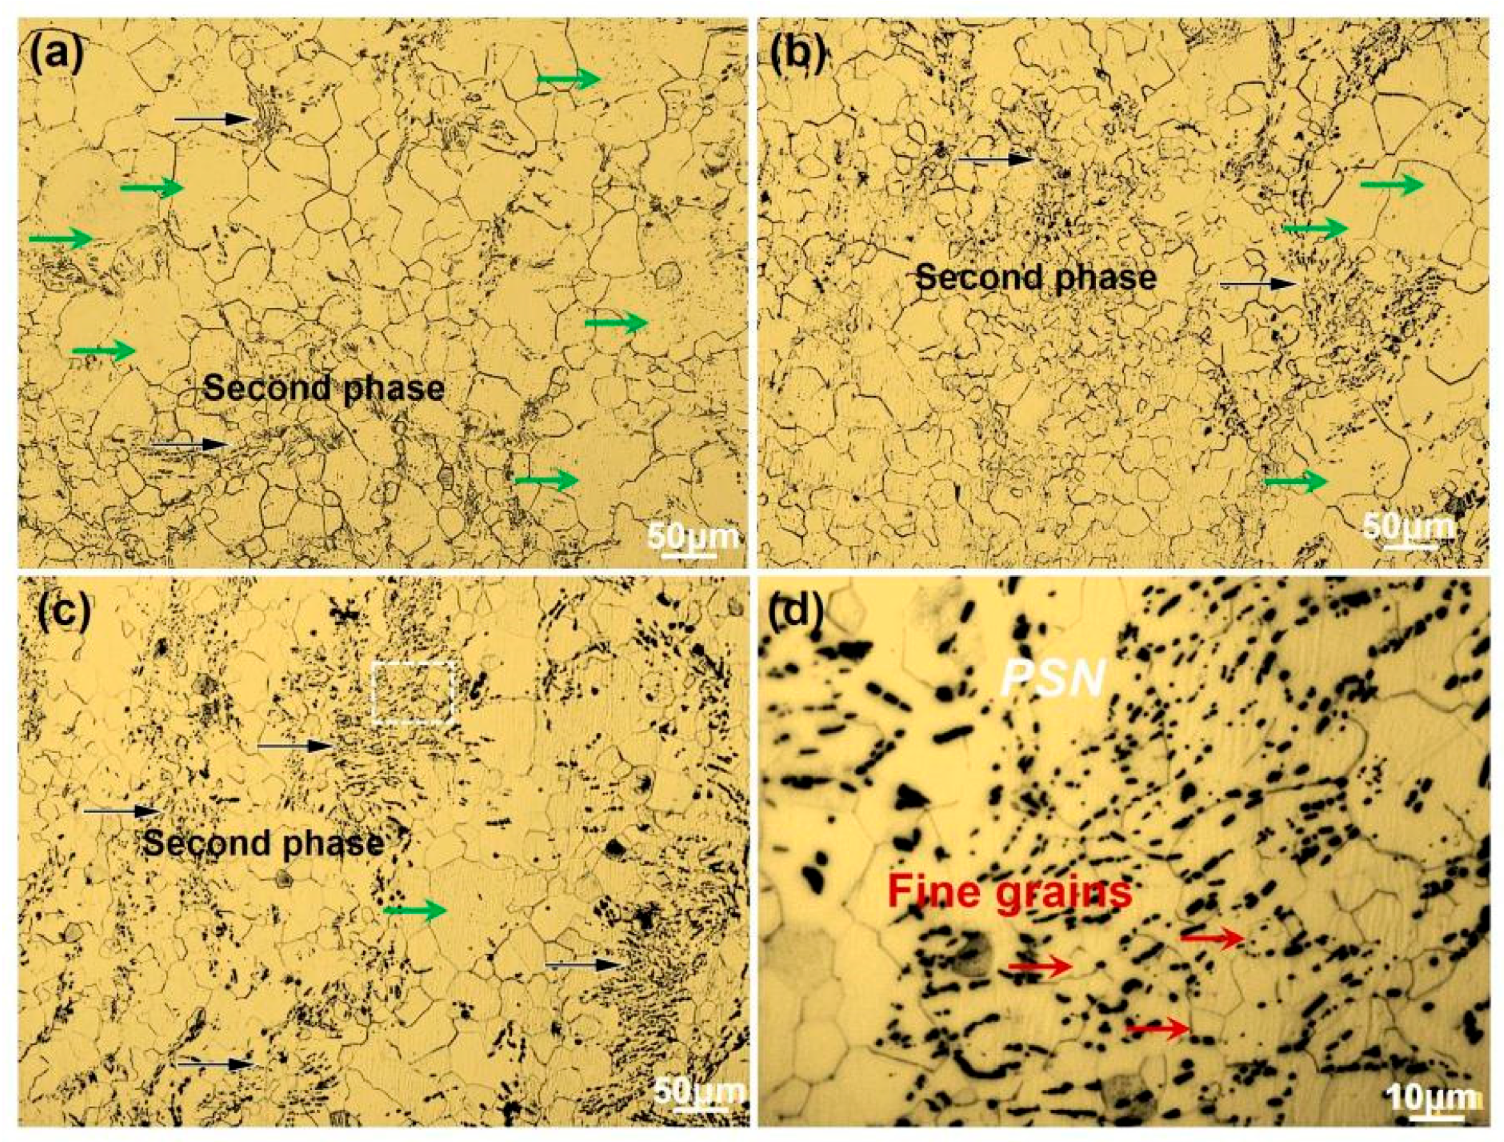
MM alloying promoted the formation of a (Ca,MM)MgSn phase, and the volume fraction of the second phase increased while the average grain size of the as-annealed alloys decreased with the increasing MM concentration.
(2)
The Mg–3Sn–0.1Ca–xMM alloys presented strong basal textures, although the texture intensities of the as-rolled and as-annealed alloys decreased with the increasing MM addition. This slightly decreased the texture intensity after annealing treatment of the Mg–3Sn–0.1Ca–xMM alloys, mainly due to the PSN effect of a lot of tiny second phase particles.
(3)
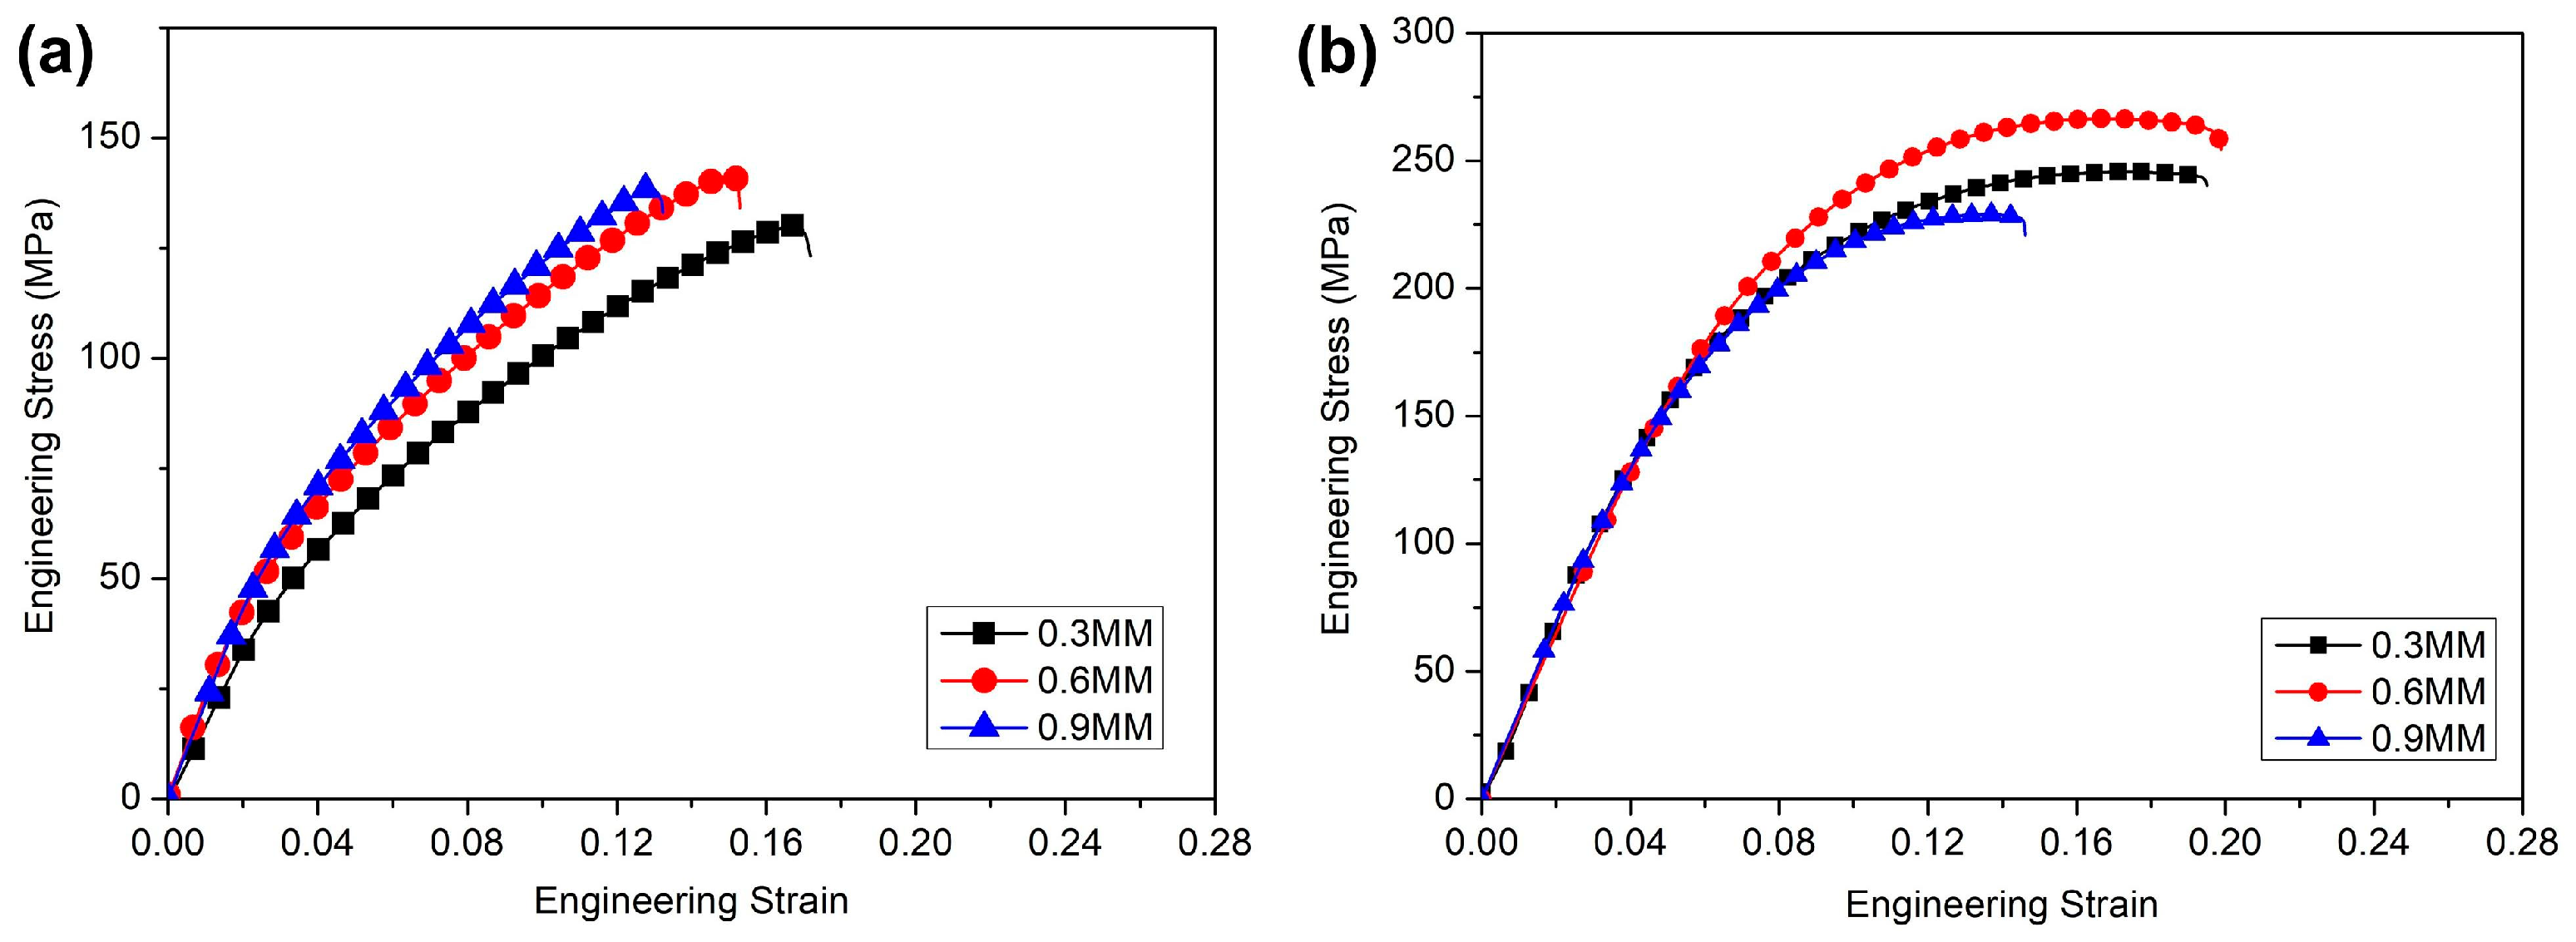
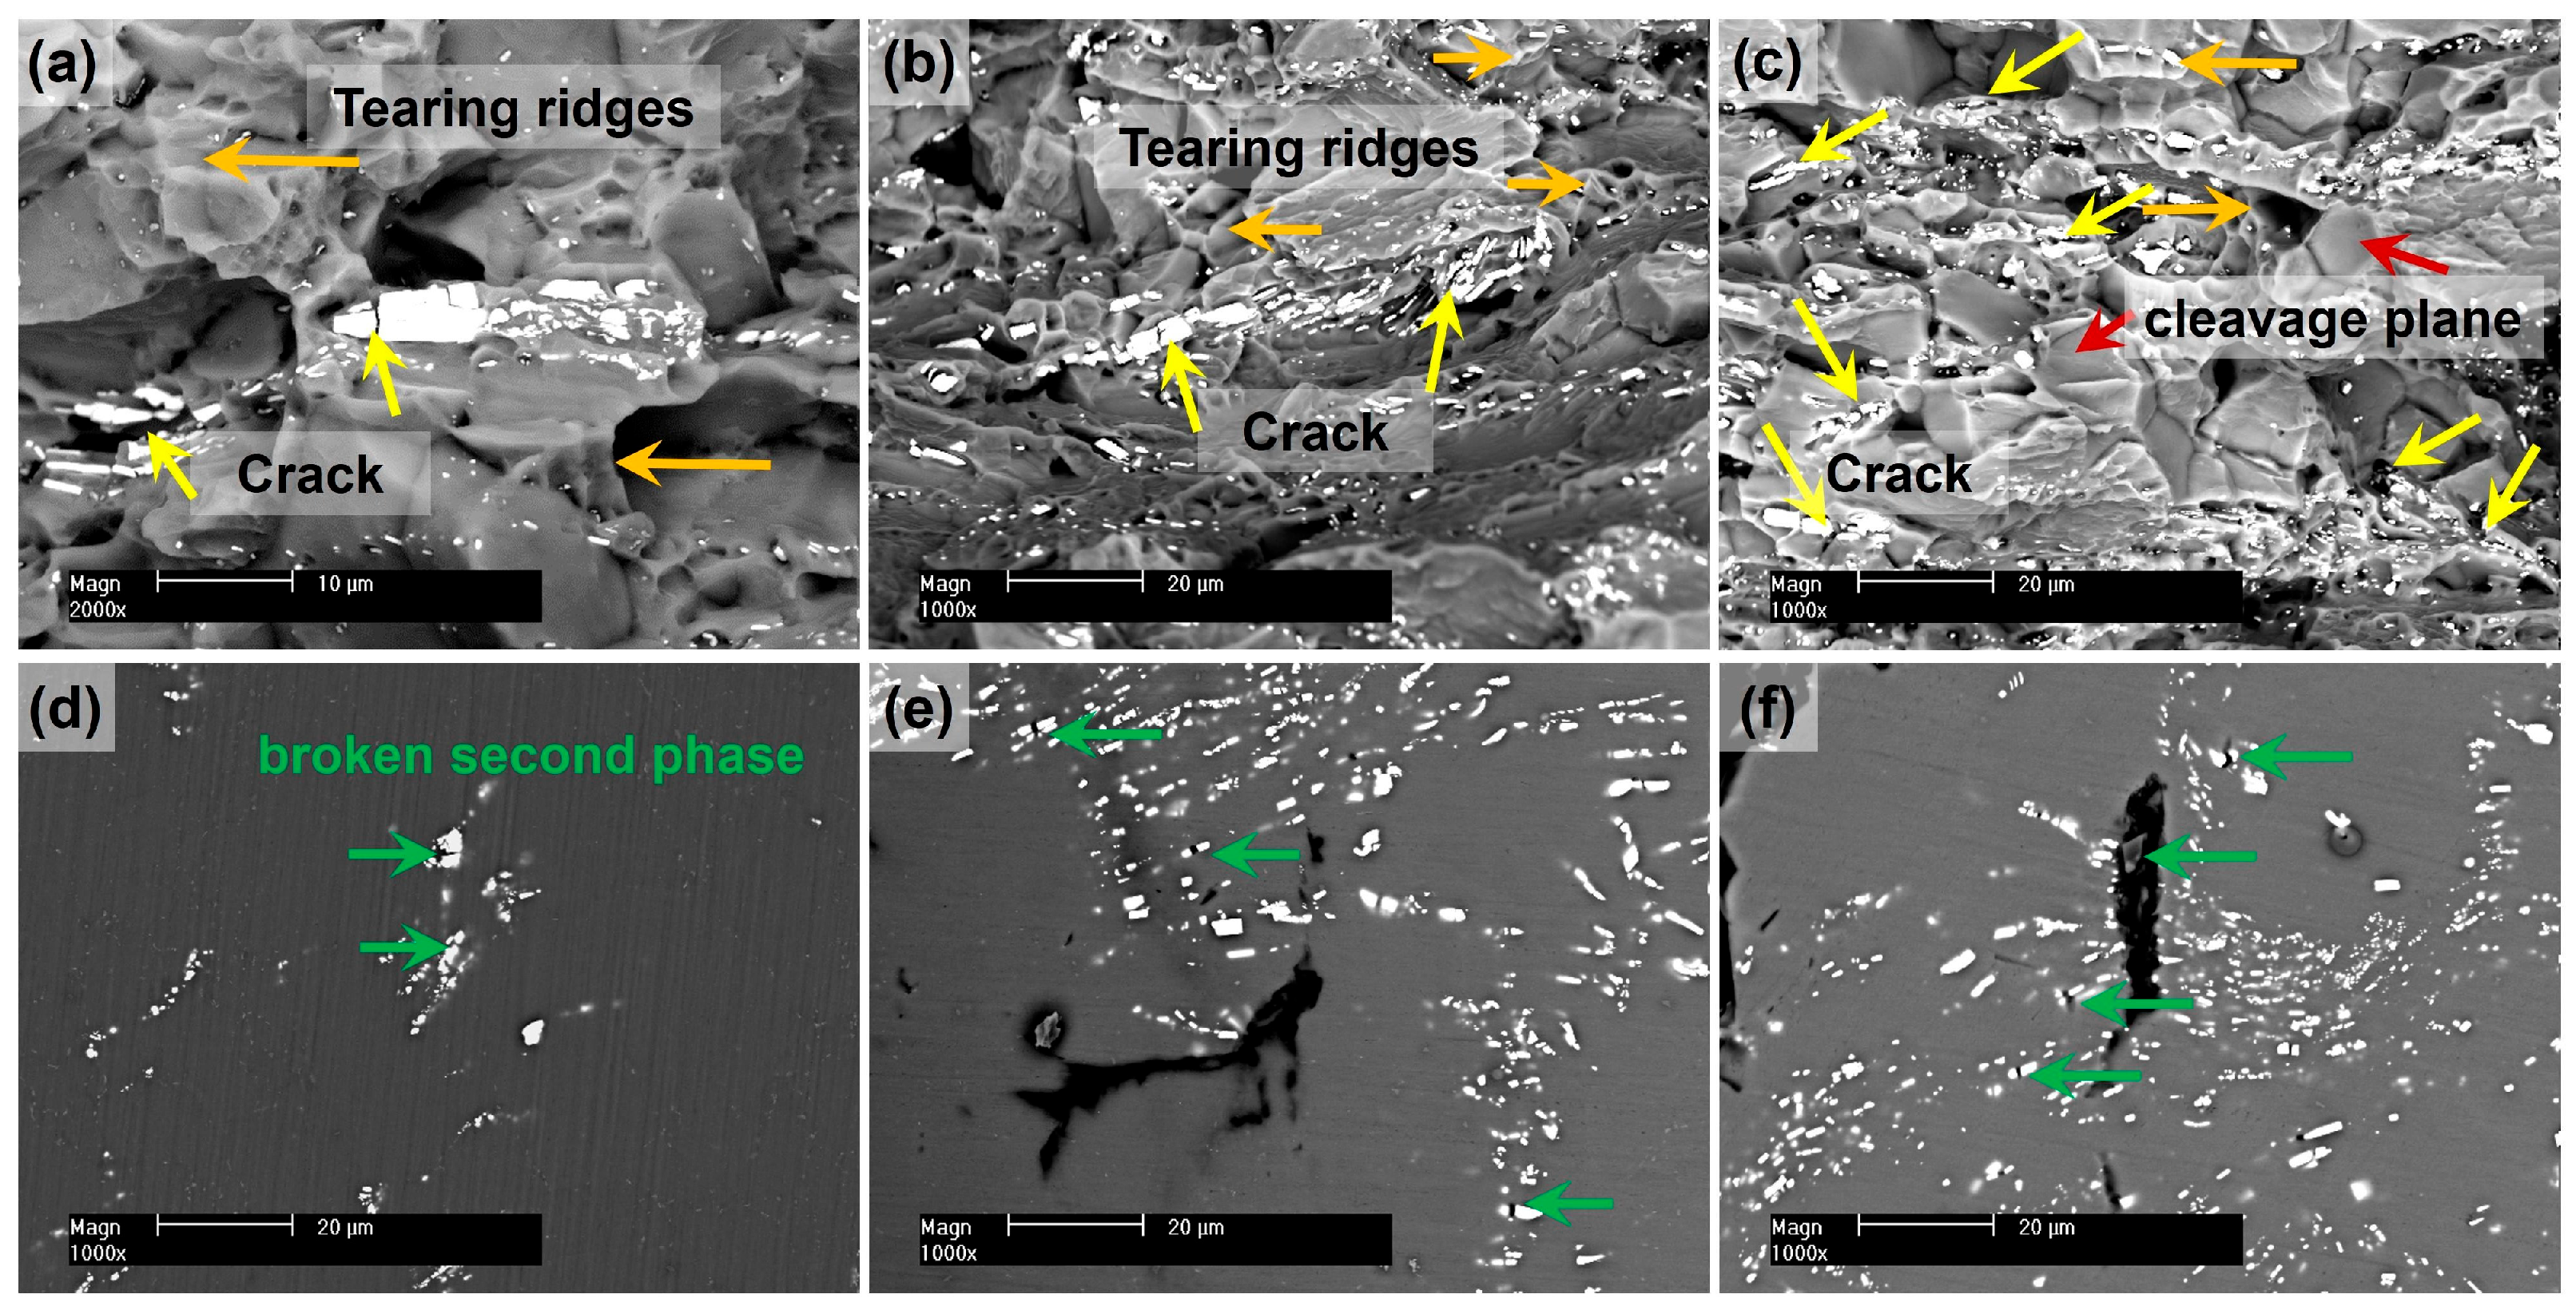
The tensile yield strength of the as-cast Mg–3Sn–0.1Ca–xMM alloys increased with MM addition, but the elongation decreased. All of the as-annealed alloys exhibited low tensile elongations due to the strong basal texture and abundant brittle second phase particles. The as-annealed 0.6MM alloy showed the highest tensile strengths of 266.5 ± 3.3 MPa and 136.1 ± 3.7 MPa, which are mainly ascribed to grain refinement strengthening, Orowan strengthening and texture strengthening.

Author Contributions

Conceptualization, J.L. and L.D.; methodology, J.L. and A.W.; validation, L.D. and Z.D.; formal analysis, L.D. and A.W.; resources, G.Z. and Z.D.; writing—original draft preparation, G.Z. and L.D.; writing—review and editing, J.L. and A.W.; visualization, S.C.; supervision, A.W.; project administration, J.L. and L.D. All authors have read and agreed to the published version of the manuscript.

Funding

This research was financially supported by the Provincial Natural Science Foundation of Hunan (Grant No.2023JJ50225 & 2018JJ3101), and the Scientific Research Fund of Hunan Provincial Education Department (Grant No.19A118 & 17B059).

Data Availability Statement

The data presented in this study are available on request from the corresponding author.

Conflicts of Interest

The authors declare no conflict of interest.

References

  1. Tie, D.; Zhang, B.; Yan, L.; Guan, R.; Ji, Z.; Liu, H.; Zhang, D.; Liu, D.; Chen, M. Rheological Solidification Behavior and Mechanical Properties of AZ91-Sn Alloys. Crystals 2019, 9, 641. [Google Scholar] [CrossRef]
  2. Jiang, W.; Yu, W. In Vitro Degradation Behavior, Mechanical Properties, and Cytocompatibility of Biodegradable Mg-1Zn-xSn Alloys. Crystals 2022, 12, 1219. [Google Scholar] [CrossRef]
  3. Zou, C.; Zhang, R.; Wei, Z.; Wang, H. Microstructure Evolution of Mg-Sn-Y Alloy Solidified under High Pressure and Temperature Gradient. Crystals 2022, 12, 149. [Google Scholar] [CrossRef]
  4. Shi, B.; Chen, R.; Ke, W. Solid solution strengthening in polycrystals of Mg–Sn binary alloys. J. Alloys Compd. 2011, 509, 3357–3362. [Google Scholar] [CrossRef]
  5. Nayyeri, G.; Mahmudi, R. Effects of Ca additions on the microstructural stability and mechanical properties of Mg–5%Sn alloy. Mater. Des. 2011, 32, 1571–1576. [Google Scholar] [CrossRef]
  6. Zhang, A.; Kang, R.; Wu, L.; Pan, H.; Xie, H.; Huang, Q.; Liu, Y.; Ai, Z.; Ma, L.; Ren, Y.; et al. A new rare-earth-free Mg-Sn-Ca-Mn wrought alloy with ultra-high strength and good ductility. Mater. Sci. Eng. A 2019, 754, 269–274. [Google Scholar] [CrossRef]
  7. Verma, K.K.; Kumar, S.; Suwas, S. Evolution of microstructure and texture during hot rolling and subsequent annealing of the TZ73 magnesium alloy and its influence on tensile properties. Mater. Sci. Eng. A 2021, 821, 141480. [Google Scholar] [CrossRef]
  8. Luo, J.; Yan, H.; Zheng, N.; Chen, R.S. Effects of Zinc and Calcium Concentration on the Microstructure and Mechanical Prop-erties of Hot-Rolled Mg–Zn–Ca Sheets. Acta Metall. Sin. 2016, 29, 205–216. [Google Scholar] [CrossRef]
  9. Luo, J.; Yan, H.; Zheng, N.; Chen, R.S. Effects of Gd concentration on microstructure, texture and tensile properties of Mg–Zn–Gd alloys subjected to large strain hot rolling. Mater. Sci. Eng. A 2014, 614, 88–95. [Google Scholar] [CrossRef]
  10. Luo, J.; Yan, H.; Lu, L.W.; Chen, R.S.; Wu, A.R.; Yin, F.C. Cold rollability improvement by twinning and twin–slip synergy in an Mg–Zn–Gd alloy with rare earth texture. J. Alloys Compd. 2021, 883, 160813. [Google Scholar] [CrossRef]
  11. Yan, H.; Shao, X.; Li, H.; Chen, R.; Cui, H.; Han, E.-H. Synergization of ductility and yield strength in a dilute quaternary Mg-Zn-Gd-Ca alloy through texture modification and Guinier–Preston zone. Scr. Mater. 2021, 207, 114257. [Google Scholar] [CrossRef]
  12. Chai, Y.; He, C.; Jiang, B.; Fu, J.; Jiang, Z.; Yang, Q.; Sheng, H.; Huang, G.; Zhang, D.; Pan, F. Influence of minor Ce additions on the microstructure and mechanical properties of Mg-1.0Sn-0.6Ca alloy. J. Mater. Sci. Technol. 2019, 37, 26–37. [Google Scholar] [CrossRef]
  13. Özarslan, S.; Şevik, H.; Sorar, I. Microstructure, mechanical and corrosion properties of novel Mg-Sn-Ce alloys produced by high pressure die casting. Mater. Sci. Eng. C 2019, 105, 110064. [Google Scholar] [CrossRef]
  14. Yarkadaş, G.; Kumruoğlu, L.C.; Şevik, H. The effect of Cerium addition on microstructure and mechanical properties of high pressure die cast Mg-5Sn alloy. Mater. Charact. 2018, 136, 152–156. [Google Scholar] [CrossRef]
  15. Wang, Q.; Shen, Y.; Jiang, B.; Tang, A.; Chai, Y.; Song, J.; Yang, T.; Huang, G.; Pan, F. A good balance between ductility and stretch formability of dilute Mg-Sn-Y sheet at room temperature. Mater. Sci. Eng. A 2018, 736, 404–416. [Google Scholar] [CrossRef]
  16. Qian, X.; Zeng, Y.; Jiang, B.; Yang, Q.; Wan, Y.; Quan, G.; Pan, F. Grain refinement mechanism and improved mechanical properties in Mg–Sn alloy with trace Y addition. J. Alloys Compd. 2019, 820, 153122. [Google Scholar] [CrossRef]
  17. Chai, Y.; Jiang, B.; Song, J.; Wang, Q.; Gao, H.; Liu, B.; Huang, G.; Zhang, D.; Pan, F. Improvement of mechanical properties and reduction of yield asymmetry of extruded Mg-Sn-Zn alloy through Ca addition. J. Alloys Compd. 2018, 782, 1076–1086. [Google Scholar] [CrossRef]
  18. Zeng, Z.R.; Zhu, Y.M.; Xu, S.W.; Bian, M.Z.; Davies, C.H.J.; Birbilis, N.; Nie, J.F. Texture evolution during static recrystallization of cold-rolled magnesium alloys. Acta Mater. 2016, 105, 479–494. [Google Scholar] [CrossRef]
  19. Matsuoka, Y.; Bian, M.; Huang, X.; Tsukada, Y.; Koyama, T.; Chino, Y. Simulation-aided analysis on mechanical properties of dilute Mg-Zn-Ca alloy sheets. J. Alloys Compd. 2022, 906, 164285. [Google Scholar] [CrossRef]
  20. Shou, H.; He, L.; Zheng, J.; Li, T.; Xia, L.; Yin, D. The effect of grain size on deformation modes and deformation heterogeneity in a rolled Mg–Zn–Ca alloy. J. Mater. Res. Technol. 2023, 22, 1723–1736. [Google Scholar] [CrossRef]
  21. Jia, Z.; Yu, B.; Wang, Z.; Han, X.; Fu, L. Effects of Zn on Corrosion Properties of Homogenized Mg-3Sn-1Ca-1Cu Alloy. Crystals 2022, 12, 660. [Google Scholar] [CrossRef]
  22. Pan, H.; Qin, G.; Huang, Y.; Ren, Y.; Sha, X.; Han, X.; Liu, Z.-Q.; Li, C.; Wu, X.; Chen, H.; et al. Development of low-alloyed and rare-earth-free magnesium alloys having ultra-high strength. Acta Mater. 2018, 149, 350–363. [Google Scholar] [CrossRef]
  23. Guan, R.G.; Shen, Y.F.; Zhao, Z.Y.; Misra, R.D.K. Nanoscale precipitates strengthened lanthanum-bearing Mg-3Sn-1Mn alloys through continuous rheo-rolling. Sci. Rep. 2016, 6, 23154. [Google Scholar] [CrossRef] [PubMed]
  24. Zhou, X.; Mo, L.; Du, J.; Luo, G. Microstructure evolution and improvement of thermal conductivity in Mg–2Sn alloy induced by La addition. J. Mater. Res. Technol. 2022, 17, 1380–1389. [Google Scholar] [CrossRef]
  25. Kozlov, A.; Gröbner, J.; Schmid-Fetzer, R. Phase Formation in Mg-Sn Alloys Modified by Ca and Ce. J. Phase Equilibria Diffus. 2014, 35, 502–517. [Google Scholar] [CrossRef]
  26. Zhou, X.; Mo, L.; Du, J. Phase characterization and properties regulation of Mg-4Sn-La-Ca alloy. Mater. Charact. 2022, 194, 112274. [Google Scholar] [CrossRef]
  27. Wang, C.; Zeng, L.; Zhang, W.; Tang, F.; Ding, W.; Xiao, S.; Liang, T. Enhanced mechanical properties and corrosion resistance of rolled Mg-1.5Sn-0.5Ca alloy by Ce microalloying. Mater. Charact. 2021, 179, 111325. [Google Scholar] [CrossRef]
  28. Luo, J.; Chen, R.S.; Han, E.H. Effects of Gd on the Microstructure and Mechanical Properties of Mg-3Sn Alloys. Mater. Sci. Forum 2013, 747–748, 245–250. [Google Scholar] [CrossRef]
  29. Karakulak, E. A review: Past, present and future of grain refining of magnesium castings. J. Magnes. Alloys 2019, 7, 355–369. [Google Scholar] [CrossRef]
  30. Kim, S.-H.; Bae, S.W.; Lee, S.W.; Moon, B.G.; Kim, H.S.; Kim, Y.M.; Yoon, J.; Park, S.H. Microstructural evolution and improvement in mechanical properties of extruded AZ31 alloy by combined addition of Ca and Y. Mater. Sci. Eng. A 2018, 725, 309–318. [Google Scholar] [CrossRef]
  31. Hadorn, J.P.; Hantzsche, K.; Yi, S.; Bohlen, J.; Letzig, D.; Agnew, S.R. Effects of Solute and Second-Phase Particles on the Texture of Nd-Containing Mg Alloys. Met. Mater. Trans. A 2012, 43, 1363–1375. [Google Scholar] [CrossRef]
  32. Wang, X.; Guan, D. The evolution of coarse grains and its effects on weakened basal texture during annealing of a cold-rolled magnesium AZ31B alloy. J. Magnes. Alloys 2021, 10, 1235–1241. [Google Scholar] [CrossRef]
  33. Barrett, C.D.; Imandoust, A.; El Kadiri, H. The effect of rare earth element segregation on grain boundary energy and mobility in magnesium and ensuing texture weakening. Scr. Mater. 2018, 146, 46–50. [Google Scholar] [CrossRef]
  34. Basu, I.; Al-Samman, T. Triggering rare earth texture modification in magnesium alloys by addition of zinc and zirconium. Acta Mater. 2014, 67, 116–133. [Google Scholar] [CrossRef]
  35. Al-Samman, T. Modification of texture and microstructure of magnesium alloy extrusions by particle-stimulated recrystalliza-tion. Mater. Sci. Eng. A 2013, 560, 561–566. [Google Scholar] [CrossRef]
  36. Pineau, A.; Benzerga, A.A.; Pardoen, T. Failure of metals I: Brittle and ductile fracture. Acta Mater. 2016, 107, 424–483. [Google Scholar] [CrossRef]
  37. Zha, M.; Liang, J.-W.; Xing, H.; Xu, H.; Jiang, B.; Wang, C.; Jia, H.-L.; Wang, H.-Y. Spheroiding and refining of coarse CaMgSn phase in Mg–Al–Sn–Ca alloys for simultaneously improved strength and ductility via sub-rapid solidification and controlled rolling. Mater. Sci. Eng. A 2022, 834, 142598. [Google Scholar] [CrossRef]
Figure 1. Microstructures of the as-cast alloys (a,d,g) 0.3MM, (b,e,h) 0.6MM and (c,f,i) 0.9MM, as well as (mo) the EDS results of the points A, B and C, respectively.
Crystals 13 01379 g001
Figure 2. XRD patterns of the as-cast alloys. Green arrows illustrate the peaks of the Mg2Sn phase, and pink arrows show the peaks of the (Ca,MM)MgSn phase.
Crystals 13 01379 g002
Figure 3. OM images of the as-rolled alloys (ac) and SEM images of the second phase distribution in the as-annealed alloys (di). (a,d,g) 0.3MM, (b,e,h) 0.6MM and (c,f,i) 0.9MM.
Crystals 13 01379 g003
Figure 4. OM images of the as-annealed alloys: (a) 0.3MM, (b) 0.6MM and (c,d) 0.9MM. Here, black arrows indicate the second phase, green arrows show the coarse grains and red arrows show the fine grains; the white rectangle (c) indicates the PSN.
Crystals 13 01379 g004
Figure 5. Macro-textures of the as-rolled (ac) and as-annealed (df) alloys. (a,d) 0.3MM, (b,e) 0.6MM and (c,f) 0.9MM.
Crystals 13 01379 g005
Figure 6. The representative tensile curves of the (a) as-cast and the (b) as-annealed alloys.
Crystals 13 01379 g006
Figure 7. Fracture morphologies of the as-annealed alloys. (a,d) 0.3MM, (b,e) 0.6MM and (c,f) 0.9MM. Here, yellow arrows show the second phase induced cracks; orange arrows show the tearing ridges; red arrows show the cleavage planes; green arrows show the broken second phase.
Crystals 13 01379 g007
Figure 8. Volume fractions of second phase in the as-cast and as-annealed alloys.
Crystals 13 01379 g008
Table 1. The chemical compositions of as-cast Mg–3Sn–0.1Ca–xMM alloys (wt.%).
Nominal AlloysMgSnCaCeLaTotal MM (Ce + La)
Mg–3Sn–0.1Ca–0.3MMBal.3.190.100.180.100.28
Mg–3Sn–0.1Ca–0.6MMBal.3.120.110.340.190.53
Mg–3Sn–0.1Ca–0.9MMBal.3.100.120.540.330.87
Table 2. Summary of mechanical properties of the studied alloys.
StateAlloyUTS
(MPa)
YS
(MPa)
Elongation
(%)
As-cast0.3MM130.3 ± 1.343.4 ± 1.610.2 ± 0.5
0.6MM141.6 ± 2.845.3 ± 1.88.7 ± 0.3
0.9MM138.7 ± 3.353.8 ± 2.06.6 ± 0.4
As-annealed0.3MM245.8 ± 1.2125.2 ± 2.812.3 ± 0.3
0.6MM266.5 ± 3.3136.1 ± 3.712.1 ± 0.5
0.9MM229.0 ± 2.3123.4 ± 3.28.3 ± 0.4
Disclaimer/Publisher’s Note: The statements, opinions and data contained in all publications are solely those of the individual author(s) and contributor(s) and not of MDPI and/or the editor(s). MDPI and/or the editor(s) disclaim responsibility for any injury to people or property resulting from any ideas, methods, instructions or products referred to in the content.

