Abstract
High-quality single crystals with empirical composition Y2.96Sm0.04Ga5O12 (YGG: Sm3+) were successfully prepared by the optical floating zone method for the first time and compared with related single crystals of Y2.96Sm0.04Al5O12 (YAG: Sm3+). With both crystals, XRD showed that Sm3+ entered the cubic-phase structure. Optical absorption spectra produced a series of peaks from Sm3+ in the 250 nm to 550 nm range, and photoluminescence excitation (PLE) spectra detected at 613 nm showed strong excitation peaks at 407 nm and 468 nm. A strong emission peak at 611 nm (orange-red light) was observed in the photoluminescence (PL) spectra under excitations at both 407 and 468 nm, respectively, but it was much brighter under excitation at 407 nm. Furthermore, with both emission spectra, the peaks from the YGG: Sm3+ crystal were significantly more intense than those from the YAG: Sm3+ crystal, and both experienced a blue shift. In addition, under excitation at 407 nm, the color purity of the emitted orange-red light of YGG: Sm3+ was higher than that of the YAG: Sm3+ crystal, and the fluorescence lifetime for the 4G5/2 → 6H7/2 transition of YGG: Sm3+ was longer than that of the YAG: Sm3+ crystal. The optical properties of the YGG: Sm3+ crystal are better than those of the YAG: Sm3+ crystal.
1. Introduction
Rare-earth-based luminescent materials have been widely studied for their excellent spectral properties, which include a high and adjustable luminescence, long fluorescence lifetime, and large Stokes shift [1,2]. Consequently, they have extensive uses in light-emitting diodes (LEDs), lasers, optical temperature sensors, optical communications, display panels, luminescence dosimeters, and biomedical diagnostics [3,4,5,6]. Nevertheless, considerable efforts are still being employed to improve the luminescence properties of such rare-earth-doped materials [7,8,9], and the color, intensity, and luminescence efficiency have been shown to strongly depend on the structure and composition of the luminescent center [8,10]. Furthermore, the crystal structure, ionic radius, luminescence efficiency, refractive index, and phonon energy are key factors in determining the suitability of hosts and dopants, and the usefulness of certain fluorescent materials is dependent on their unique compositions [11].
Oxides with a garnet structure are commonly used as hosts for rare-earth-doped luminescent materials, and commercial w-LED lamps are currently manufactured using a combination of YAG: (Ce3+, Sm3+) yellow and red phosphors [12,13]. However, there are manufacturing problems associated with the use of these materials, including an uneven dispersion of the phosphor particles, short lifetimes, and low thermal conductivity [13,14], and the search for new white LED fluorescent materials to replace traditional phosphors is an ongoing research topic [15,16]. Furthermore, although rare-earth-doped materials with a garnet structure have desirable properties, including high excitation and emission efficiency, uniform distributions of rare-earth ions, a physical and chemical stability, long life, and high thermal conductivity, which are suitable for use in high-quality w-LEDs [17], there is still a need to improve the color temperature and color purity of white light by obtaining more efficient red light emission [18,19]. Thus, the fact that Sm3+ can achieve efficient orange-red light emission as a result of high absorptions near 404 nm and 468 nm, and thus can be efficiently excited by InGaN-based blue or UV LEDs, indicates that Sm3+-doped materials with a garnet structure could be appropriate for use in w-LED devices [18,20].
Recently, it has been reported that Eu3+ transitions in Eu3+-doped YAG are enhanced by replacing the Al3+ with Ga3+ [21] and that the luminescence intensity in YGG crystals is stronger than in YAG [22]. Furthermore, doping of YGG with other rare-earth ions, such as Er3+ and Tm3+, has also been described [23], but we are unaware of any reports on the fluorescence properties of Sm3+-doped YGG crystals.
Compared with ceramics and polycrystalline materials, single crystals have a greater atomic uniformity, better mechanical properties, and a higher electrochemical and thermal stability [24,25]. Furthermore, garnet single crystals are transparent materials, have a low defect density, no grain boundaries that affect the properties of ceramics, and negligible surface effects that influence the properties of powders. As a consequence, they have high photoluminescence quantum yields [26,27], and their use can improve the power and lifetime of w-LEDs [18,28]. Additionally, although traditional high-temperature methods for obtaining single crystals often suffer from contamination from crucibles, this problem is overcome with the optical floating zone method [29,30], which does not require a crucible and has a rapid crystal production cycle [31], which is advantageous for investigating the properties of new crystal materials [32,33].
Sm3+-doped yttrium gallium garnet single crystals were prepared by the optical floating zone method, and their physical and optical properties were compared with those of YAG: Sm3+ crystals. These materials were then characterized by XRD, photoluminescence (PL) spectroscopy, and fluorescence lifetime measurements.
2. Materials and Methods
2.1. Crystal Preparation
Nanometer-size powders of Ga2O3 (99.99%, Maklin), Sm2O3 (99.99%, Aladdin), Y2O3 (99.99%, Maklin) and Al2O3 (99.99%, Maklin) were purchased in China and used to produce crystals with the empirical composition Y2.96Sm0.04Ga5O12 and Y2.96Sm0.04Al5O12 by the optical floating zone (OFZ) method. A more detailed description of the preparative procedures has been presented in previous work [34,35,36].
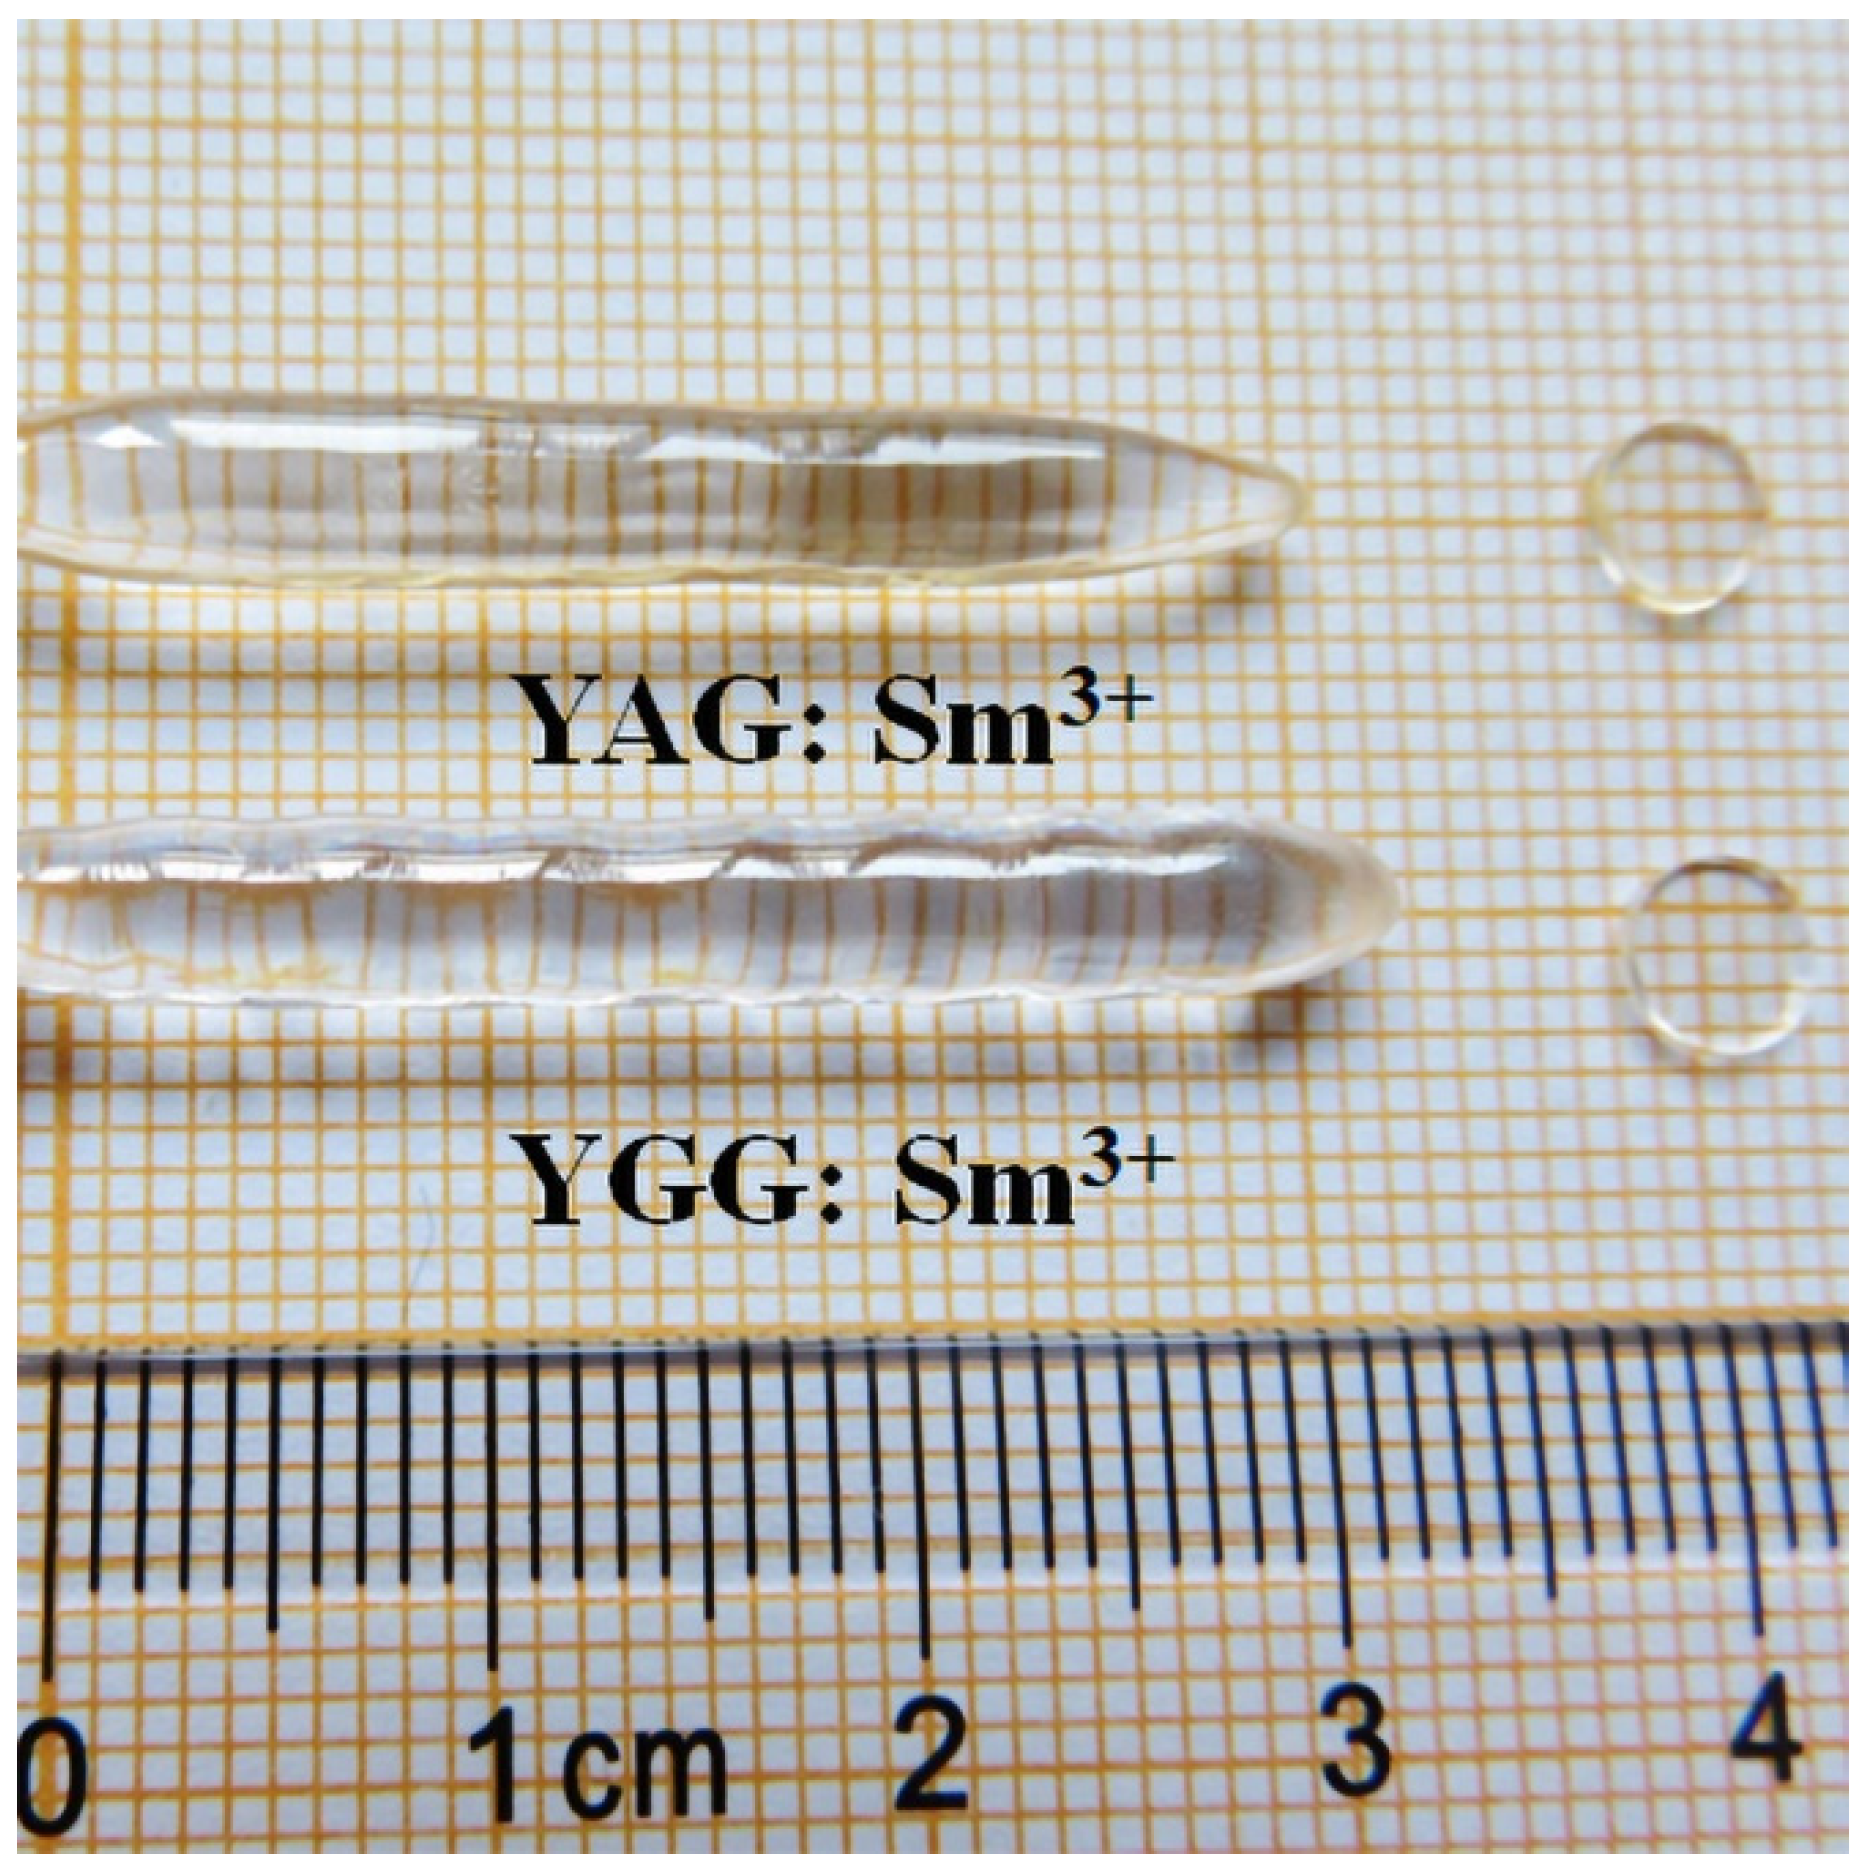
As shown in Figure 1, the prepared samples were light yellow in color and had no cracks or inclusions. Slices were cut and polished on both sides to produce 1.0 mm thick discs for spectroscopic measurements. In addition, crystal fragments were ground in an agate mortar to produce fine powders for X-ray diffraction (XRD) measurements (Dandong Hao Yuan Company, Dandong City, Liaoning Province, China).

Figure 1.
YGG: Sm3+ and YAG: Sm3+ single crystal rods along with cut and polished crystal slices.
2.2. Physical Measurements
Powder samples ground from crystal were measured by XRD (DX-2700, Dandong Hao Yuan Company, Dandong City, Liaoning Province, China) at room temperature using Cu-Kα radiation (λ = 1.54060 nm). Measurements were performed over the range 10–90° 2θ in steps of 0.02° with sampling times of 3 s, and the resulting XRD patterns were analyzed using Jade software (MDI Jade 6.0).
Crystal densities were measured by a high-precision density tester (DE-120M, Daho Meter Company, Dongguan, Guangdong Province, China). By measuring the weight of YGG: Sm3+ and YAG: Sm3+ single crystal rods in air and pure water, respectively, the volume of the crystal V can be obtained based on the Archimedes principle:
where M is the weight of the crystal in air (in grams), F is the weight of the crystal in pure water (in grams), and w is the density of pure water at room temperature, which is 1.0 g/cm3. The density of the crystal can be calculated by the following formula:
Absorption spectra were obtained in the 250–550 nm range with a UV-Vis Spectrophotometer (UV-2700, Shimadzu, Kyoto, Japan).
A photoluminescence spectrometer (ZLF-325, Zolix Instruments Co., Ltd., Beijing, China) was used to measure the photoluminescence emission (PL) and excitation spectra (PLE), with a 150 W xenon lamp as the excitation light source.
Fluorescence lifetimes were obtained with an Edinburgh steady/transient fluorescence spectrometer (FLS1000, Edinburgh, UK) under excitation with 407 nm light, and then the average lifetime of the samples was determined by tri-exponential fitting.
3. Results and Discussion
3.1. X-ray Diffraction
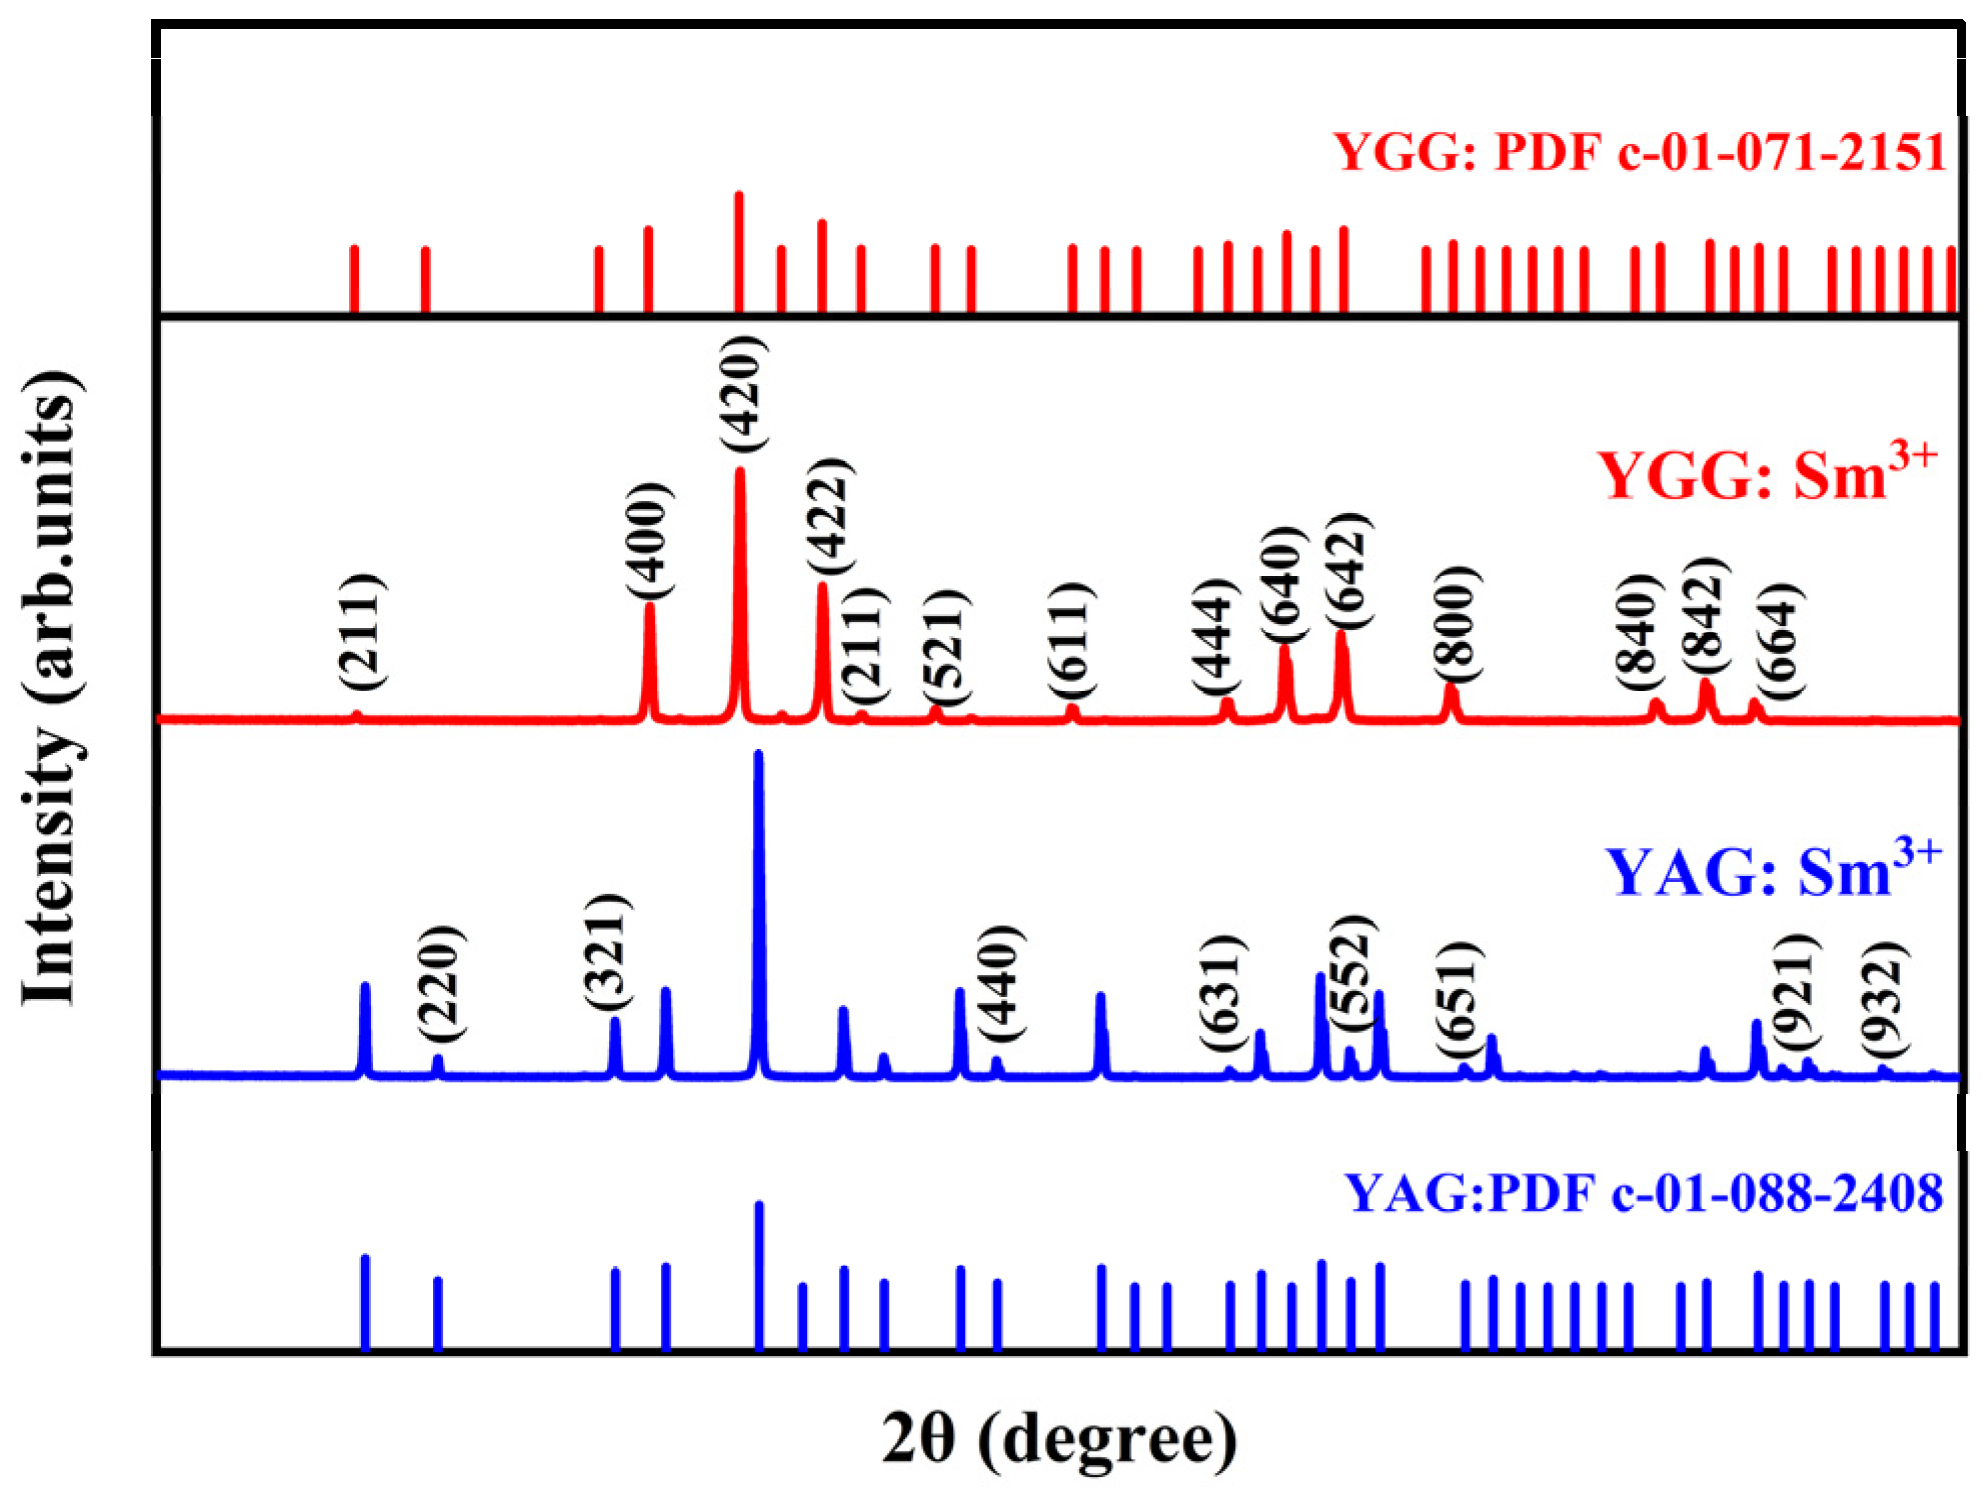
The XRD patterns of powders ground from YGG: Sm3+ and YAG: Sm3+ single crystals (Figure 2) are consistent with the diffraction peaks of the YGG standard card (PDF c-01-071-2151) and YAG standard card (PDF c-01-088-2048), respectively. The diffraction peaks for both samples are narrow and demonstrate that the crystals have a good crystallinity. One can also see in Figure 2 that the YGG: Sm3+ crystal peaks are shifted to lower angles compared to the YAG: Sm3+ samples, thus confirming that replacing Al3+ by Ga3+ increases the lattice parameter, as expected from its larger size.

Figure 2.
XRD patterns of powders ground from YGG: Sm3+ and YAG: Sm3+ single crystals.
The cell dimensions and cell volumes of the YGG: Sm3+ and YAG: Sm3+ crystals calculated using Jade software are shown in Table 1 and demonstrate that the substitution of Ga3+ (ionic radius 0.61 Å) for Al3+ (ionic radius 0.53 Å) [37] results in an increase in the lattice constant from 1.201 nm to 1.230 nm and in the cell volume from 1.732 nm3 to 1.860 nm3.

Table 1.
Lattice constants and cell volumes for YGG: Sm3+ and YAG: Sm3+ crystals.
3.2. Density Measurement
The measured densities of the YGG: Sm3+ and YAG: Sm3+ single crystals are shown in Table 2, where M is the weight of the crystal in air and V is the volume of the crystal. The densities of Y2.96Sm0.04Ga5O12 and Y2.96Sm0.04Al5O12 crystals obtained from the present work (ρ) are 5.756 and 4.533 g/cm3, respectively, which are very close to the densities of crystals calculated by Jade (ρcal in Table 2), indicating that our experimental data are effective and reliable. The density of YGG: Sm3+ crystal is higher than that of YAG: Sm3+ crystal because the atomic mass of Ga (69.72) is greater than that of Al (26.98).
Table 2.
The densities of Y2.96Sm0.04Ga5O12 and Y2.96Sm0.04Al5O12 single crystals.
3.3. Absorption Spectra
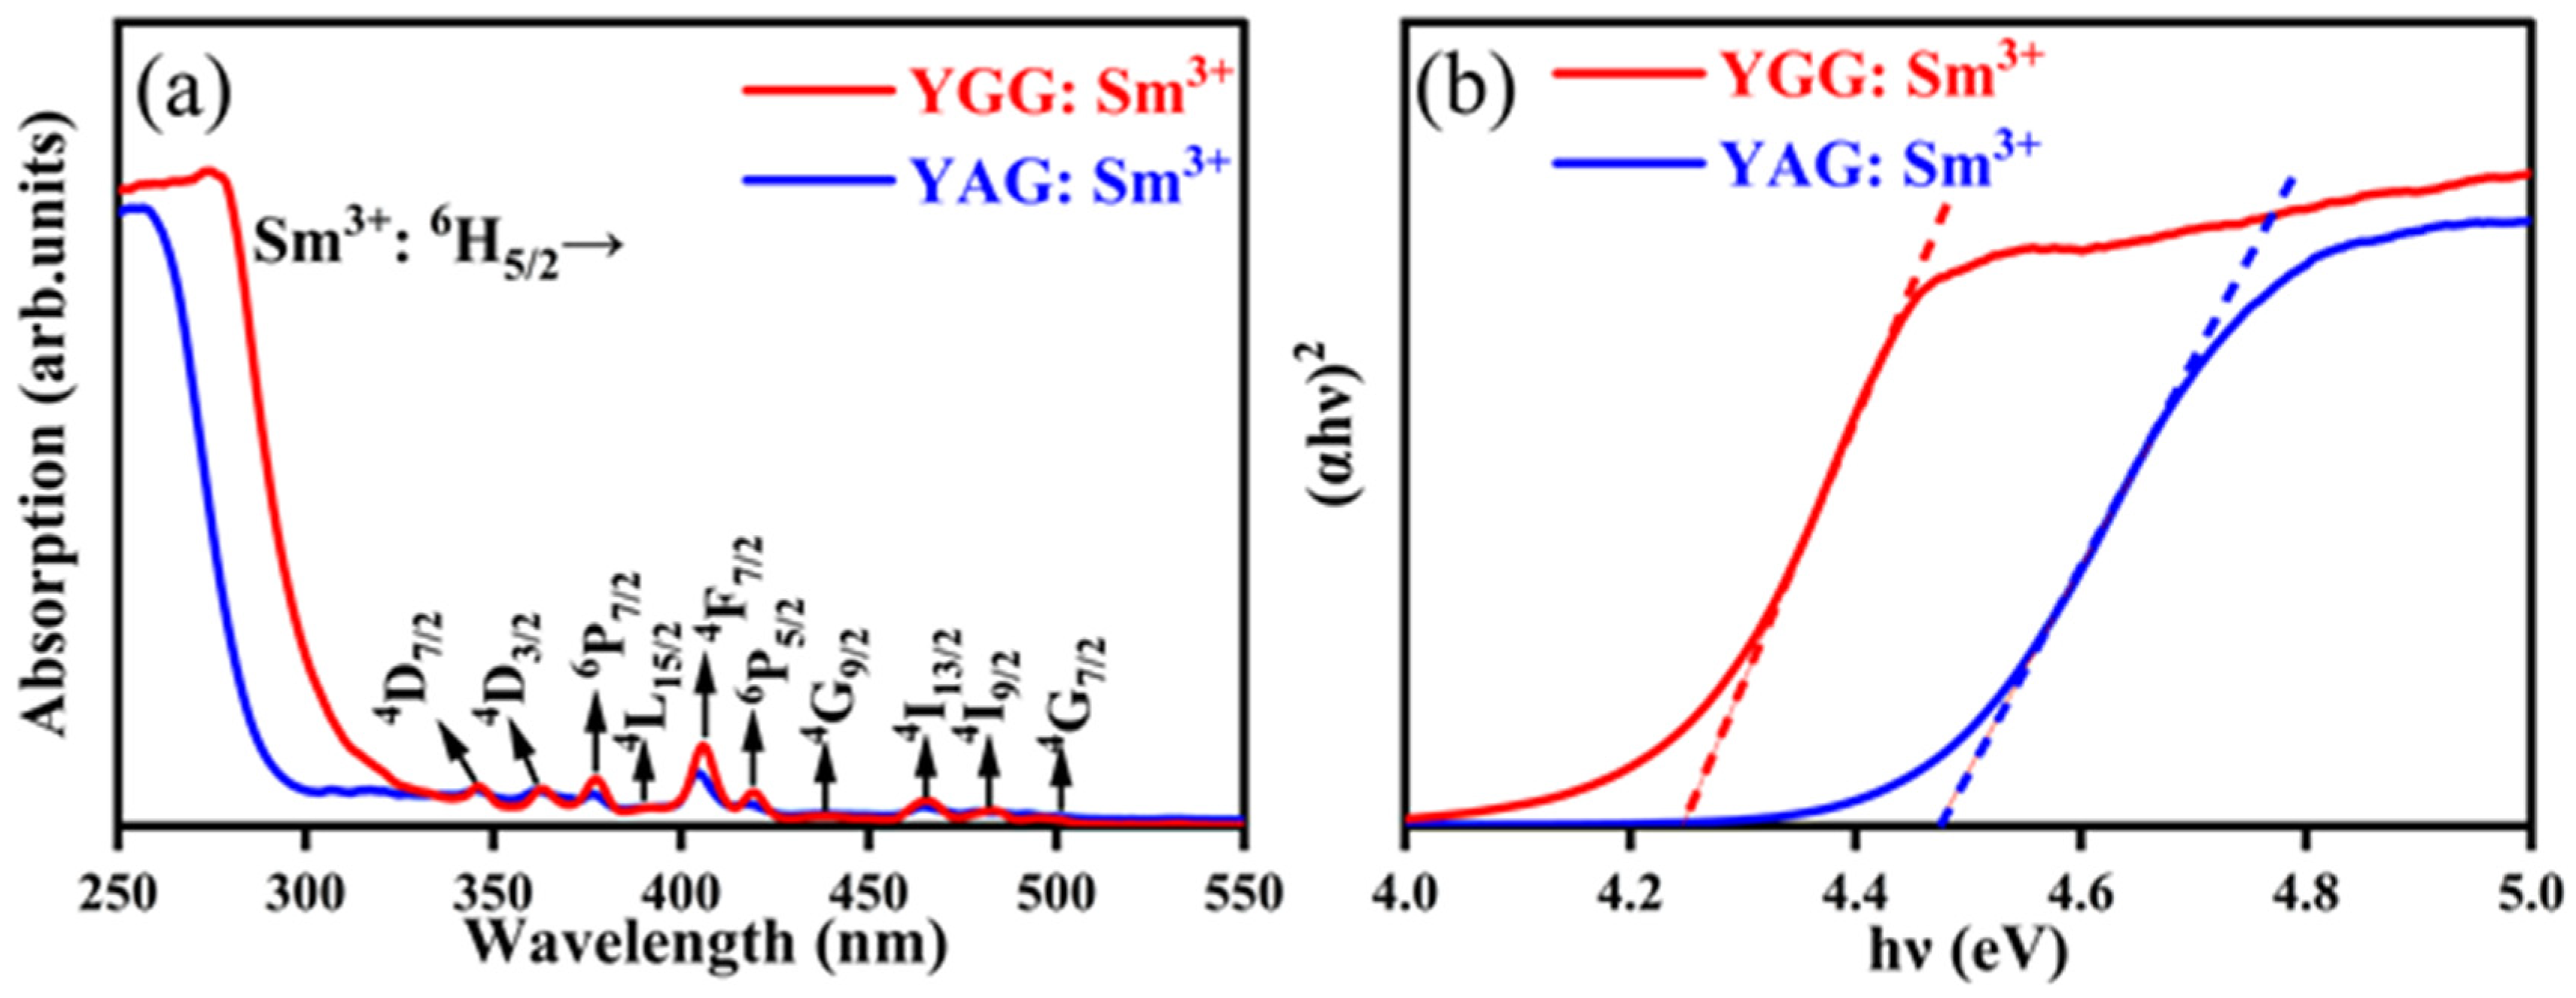
Figure 3a shows the absorption spectra of YGG: Sm3+ and YAG: Sm3+ crystals, and Figure 3b shows the optical band gaps of YGG: Sm3+ and YAG: Sm3+ crystals. The absorption spectra of YGG: Sm3+ and YAG: Sm3+ single crystals in the range of 250 nm to 550 nm (Figure 3a) are similar because they are derived from transitions between Sm3+ 4f electronic energy levels, which are largely shielded from external structural effects. Ten absorption peaks were observed at 345, 362, 377, 390, 407, 419, 439, 468, 482 and 495 nm, corresponding to 6H5/2 → 4D7/2, 4D3/2, 6P7/2, 4L15/2, 4F7/2, 6P5/2, 4G9/2, 4I13/2, 4I9/2 and 4G7/2 transitions, respectively [38]. The transition 6H5/2 → 4F7/2 (407 nm) appears to be stronger than other transitions and is more intense in the YGG: Sm3+ crystal than in the YAG: Sm3+ crystal, thus demonstrating that crystal density and differences in the ionic radii of Al3+ and Ga3+ in YAG and YGG can affect the intensity of the Sm3+ electronic absorption transitions. Moreover, the absorptions at 407 and 468 nm indicate that YGG: Sm3+ crystals can be excited by InGaN-based light-emitting diodes and are thus fluorescent materials for manufacturing white LEDs [39]. The absorption peak in the range of 250 nm to 330 nm (Figure 3a) corresponds to the absorption of the matrix, and the absorption edge of YGG: Sm3+ single crystal shifts to a longer wavelength than YAG: Sm3+ single crystal, which is because YGG and YAG crystals are different substrates and have different band gaps [40].
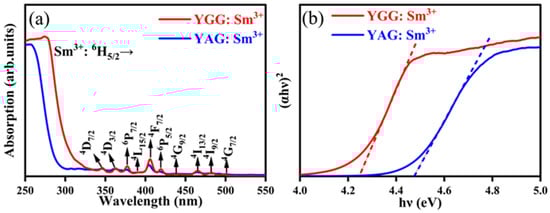
Figure 3.
(a) UV-Vis absorption spectra of YGG: Sm3+ and YAG: Sm3+ single crystals; (b) determination of Eg (the optical band gap) in YGG: Sm3+ and YAG: Sm3+ single crystals.
The optical band gaps (Eg) of the YGG: Sm3+ and YAG: Sm3+ single crystals were determined from the position of the charge transfer transition using the Tauc equation [41]:
where α and hv are the absorption coefficients and phonon energy of the sample, respectively, and A is a constant. The relationship (αhv)2 versus hv is indicated in Figure 3b, and Eg is the position of the intersection of the linear part of the curve with the hv axis. The optical band gaps in YGG: Sm3+ and YAG: Sm3+ single crystals are 4.25 and 4.47 eV, respectively, showing that YGG: Sm3+ single crystal has a narrower optical band gap than YAG: Sm3+ single crystal.
3.4. Luminescence Properties
3.4.1. PLE Spectrum
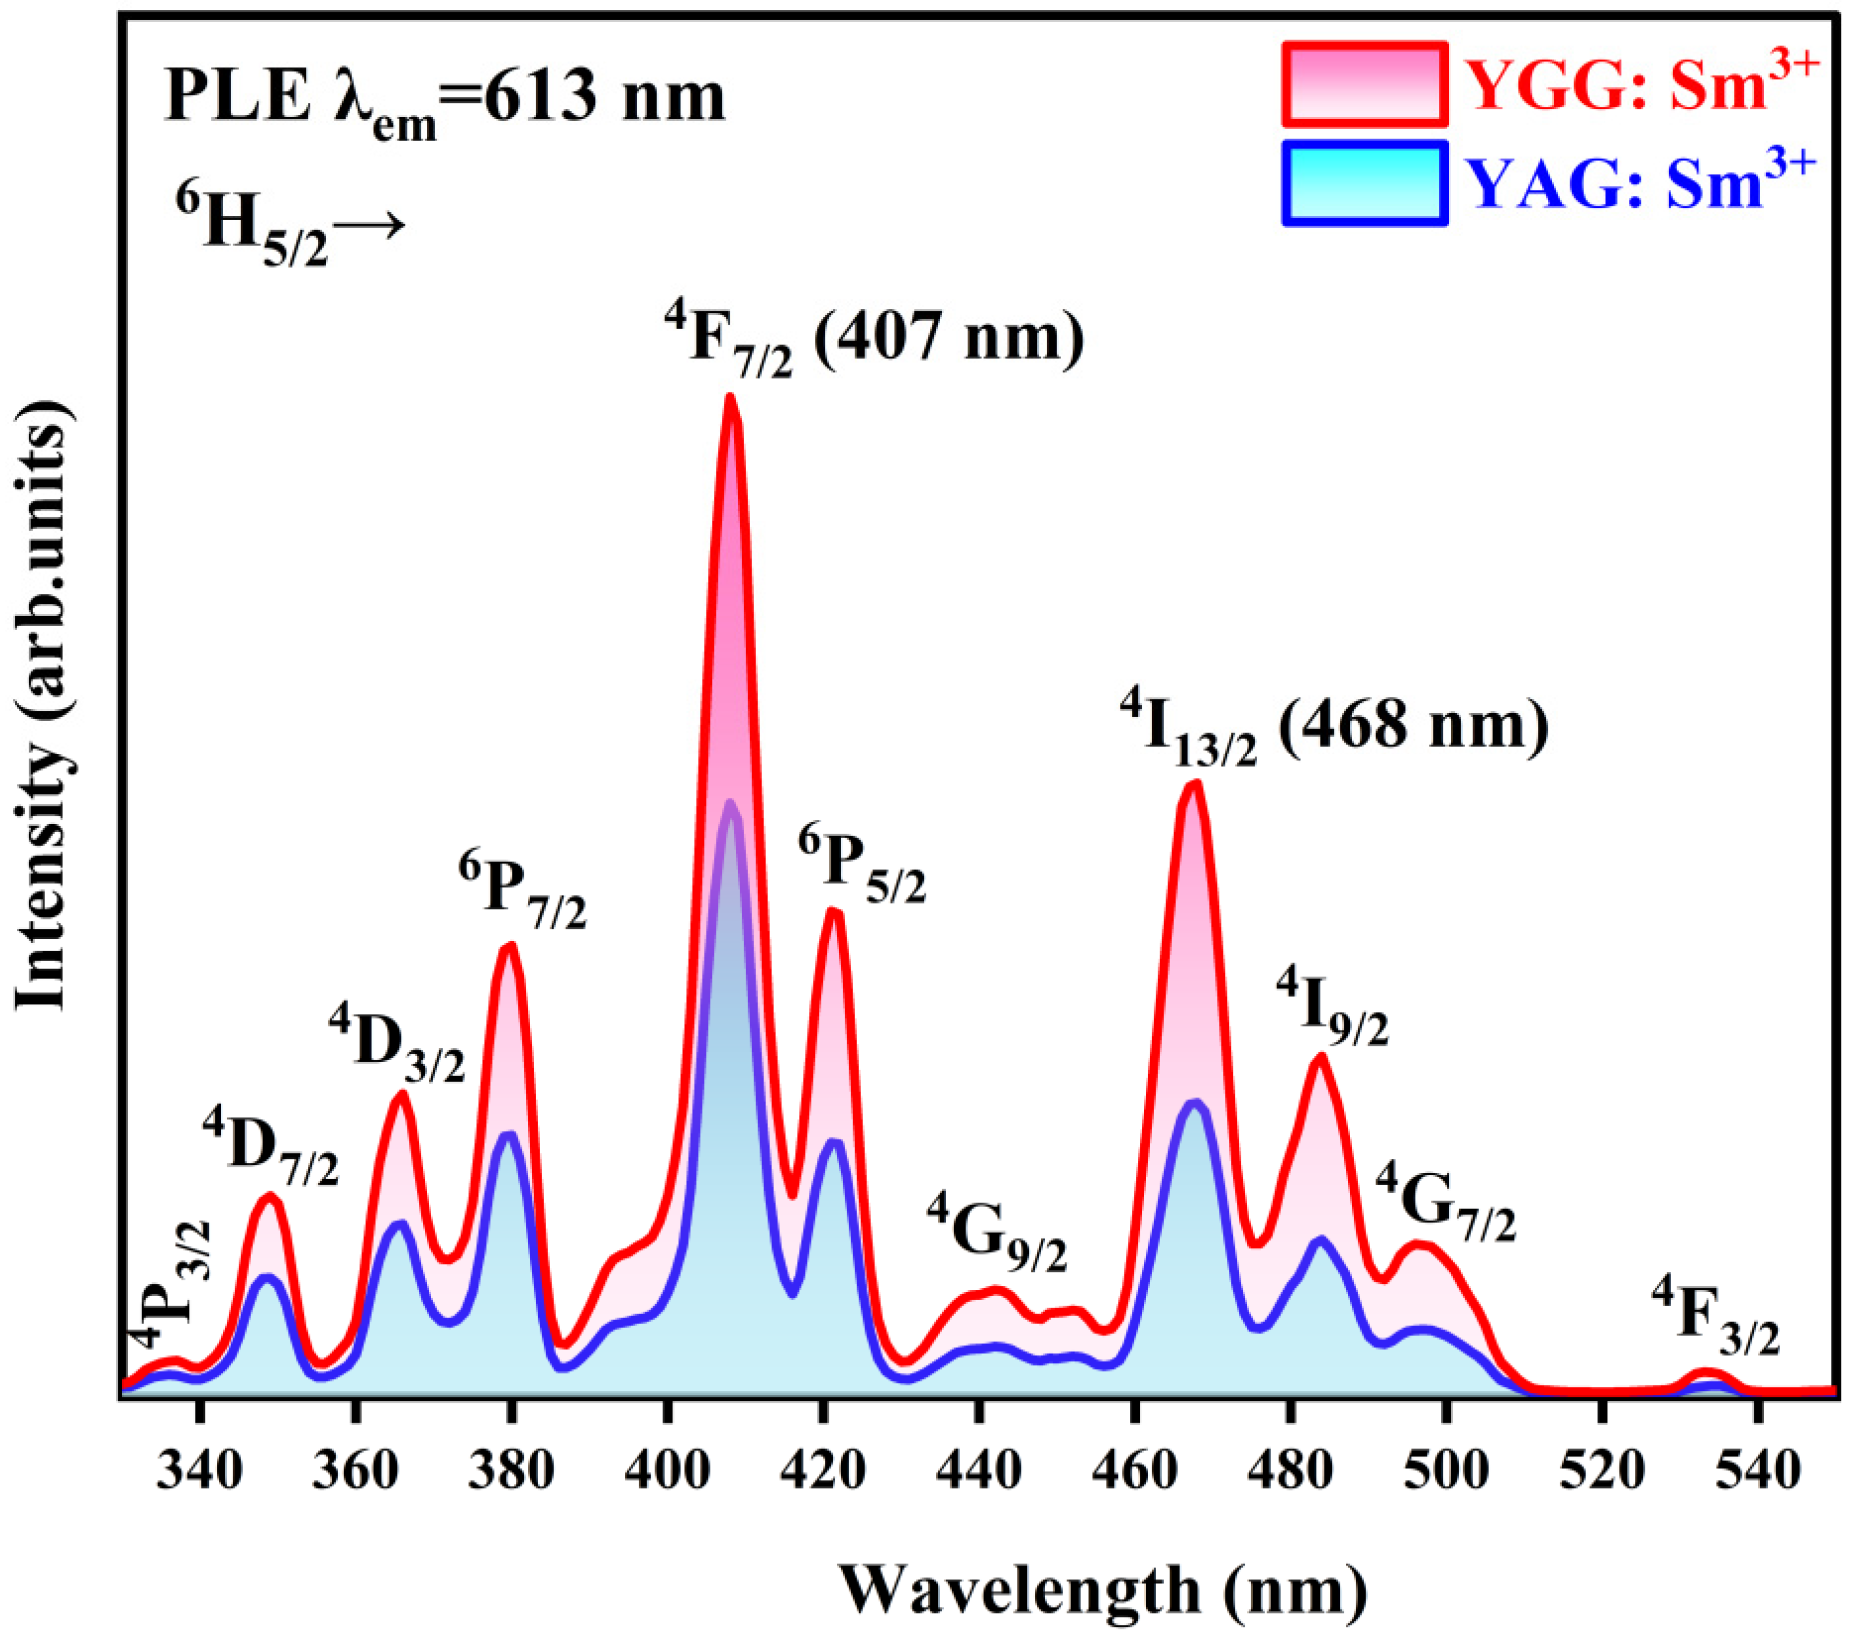
The photoluminescence excitation (PLE) spectra detected at 613 nm for YGG: Sm3+ and YAG: Sm3+ single crystals are shown in Figure 4. The peaks at 336 nm, 348 nm, 365 nm, 379 nm, 407 nm, 420 nm, 440 nm, 468 nm, 482 nm, 493 nm, and 543 nm correspond to transitions from the Sm3+ 6H5/2 ground state to the 4P3/2, 4D7/2, 4D3/2, 6P7/2, 4F7/2, 6P5/2, 4G9/2, 4I13/2, 4I9/2, 4G7/2, and 4F3/2 excited states, respectively [18]. The excitation peaks of the YGG: Sm3+ crystal at 407 nm and 468 nm are strong; thus, these two wavelengths of light are selected to excite this crystal to study the PL spectrum.
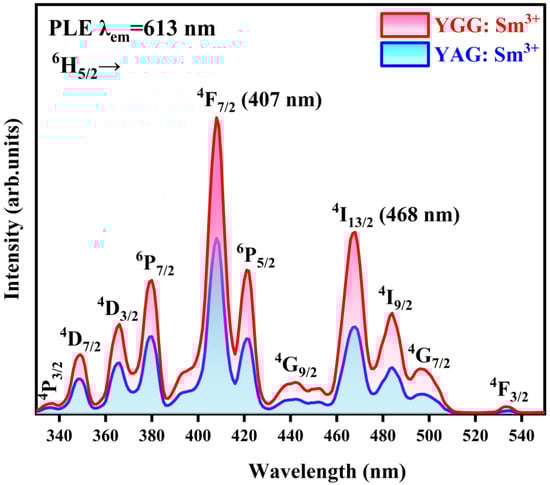
Figure 4.
Photoluminescence excitation (PLE) spectra detected at 613 nm for YGG: Sm3+ and YAG: Sm3+ single crystals.
3.4.2. PL Spectrum
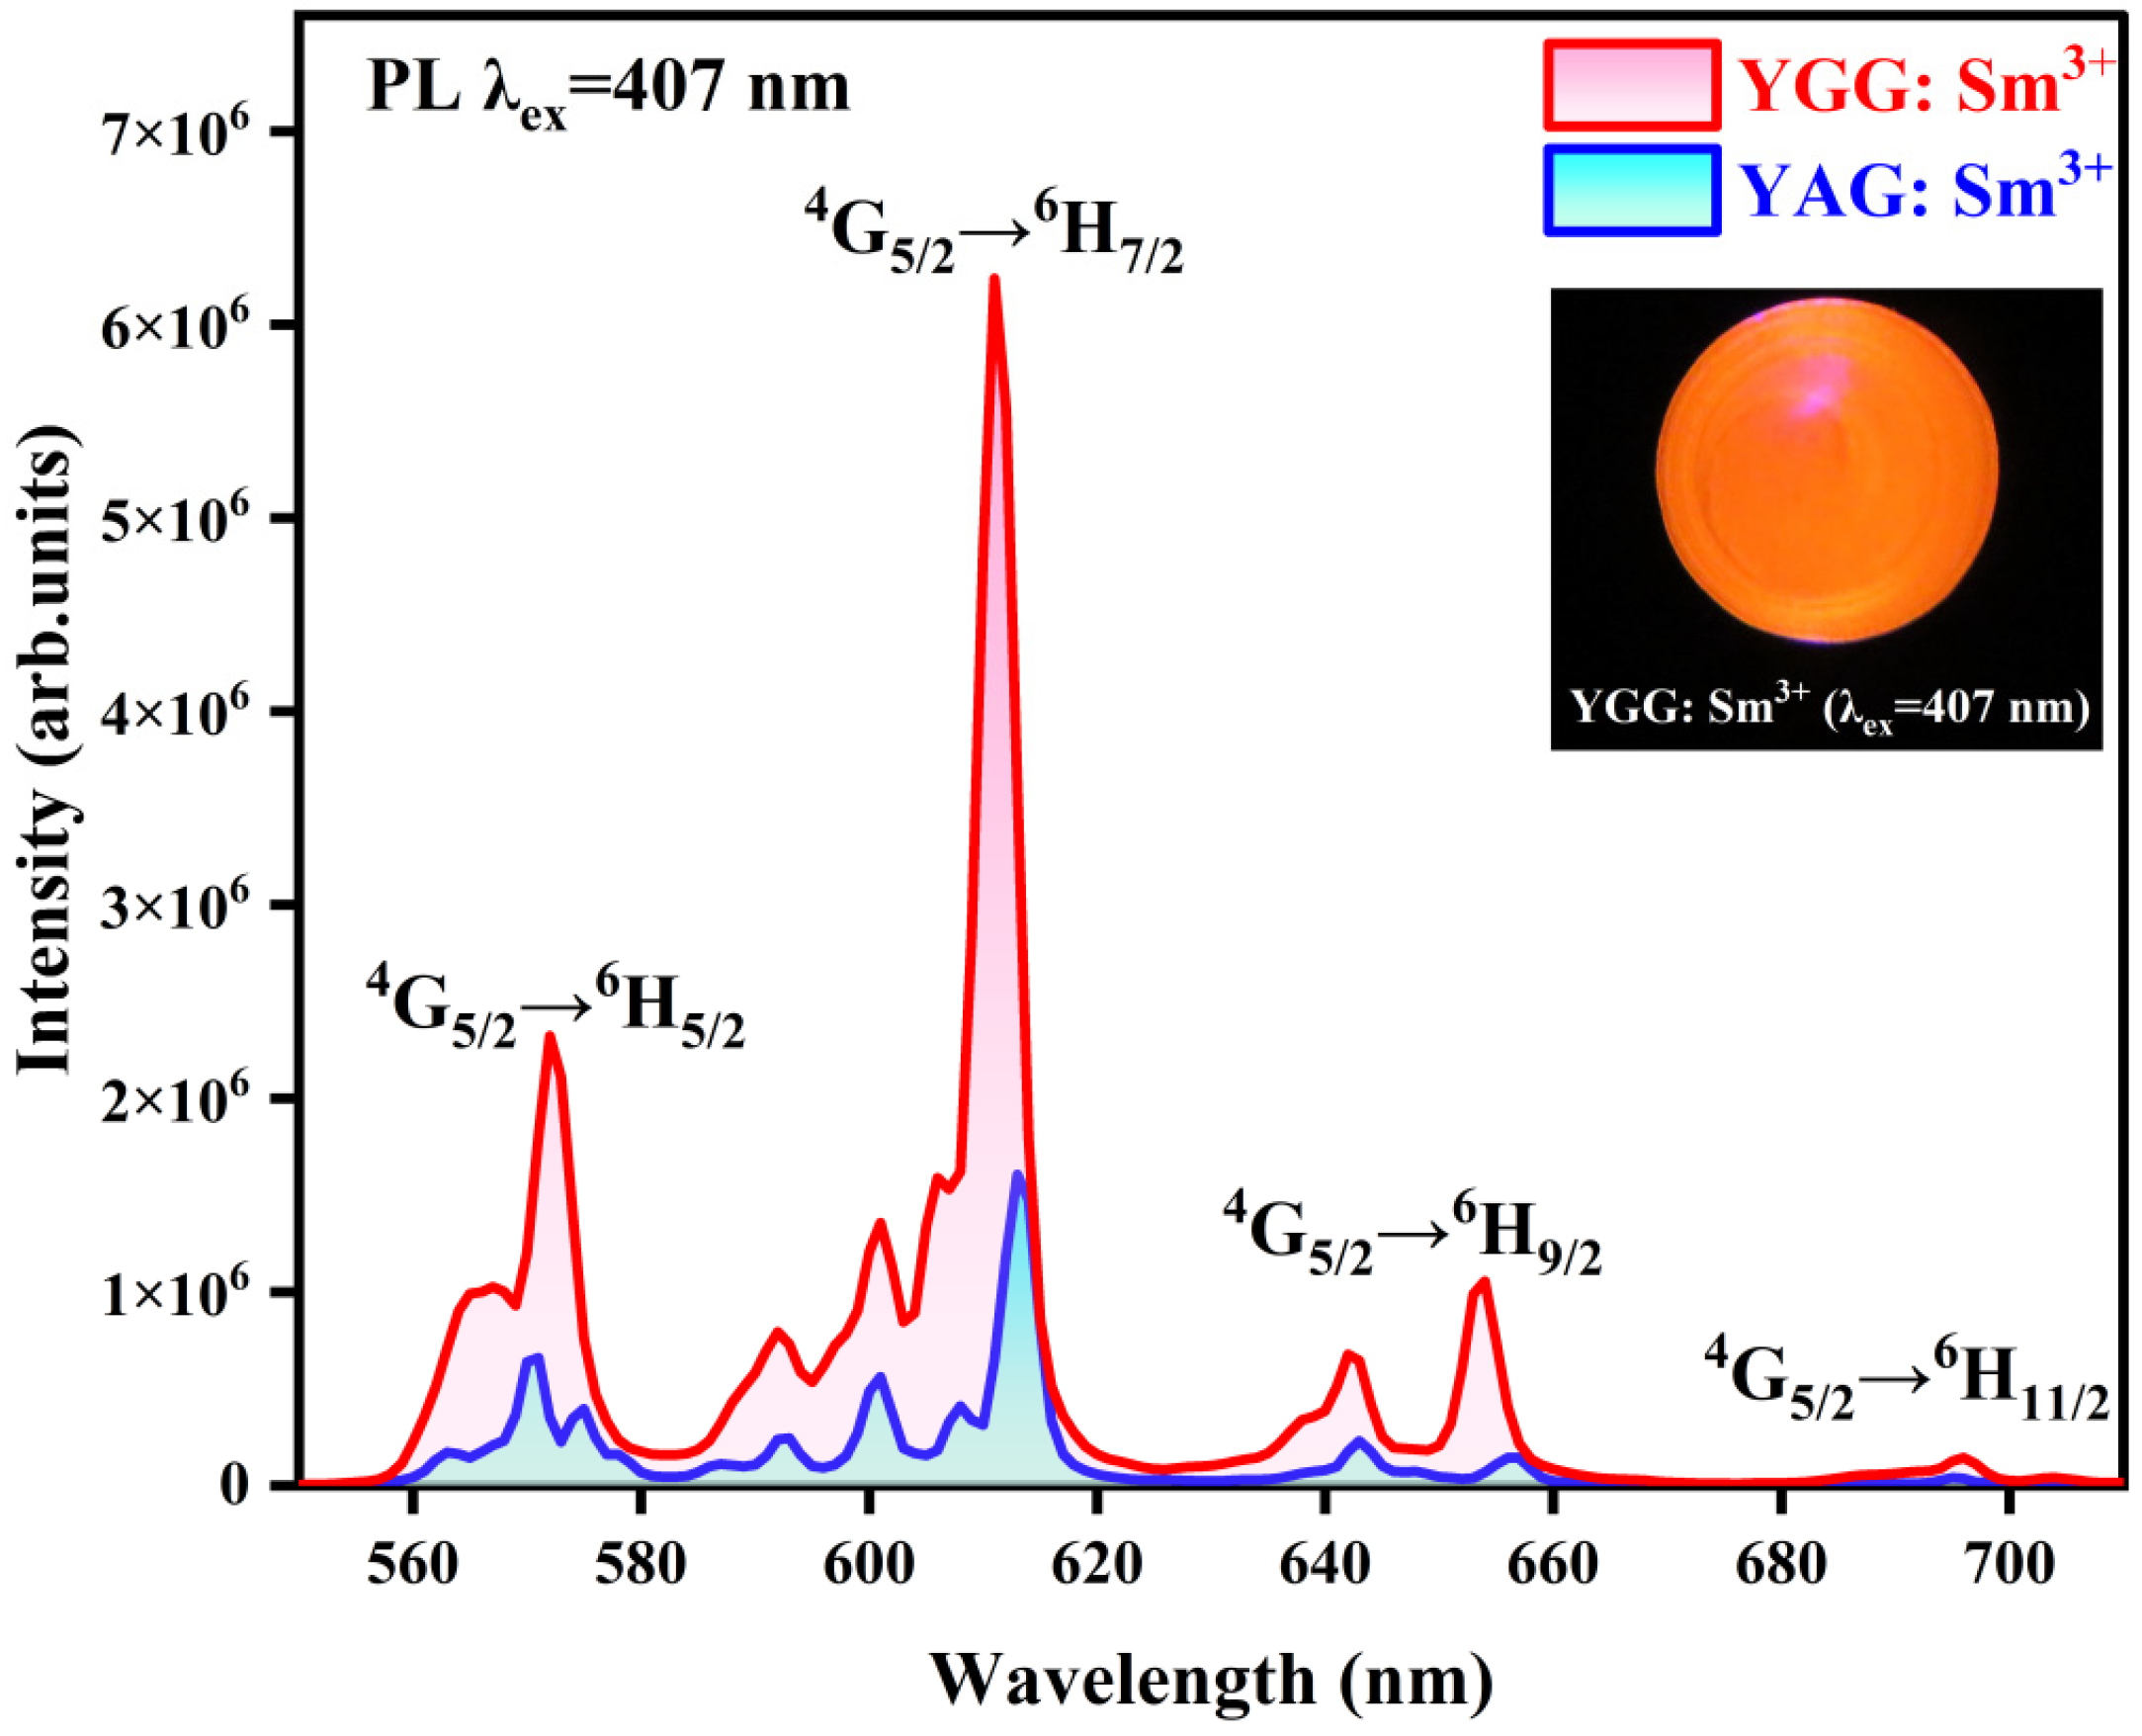
Photoluminescence (PL) spectra of YGG: Sm3+ and YAG: Sm3+ crystals under excitation at 407 nm and 468 nm are shown in Figure 5 and Figure 6, respectively, and consist of three strong bands and one weak band with centers at about 572 nm, 611 nm, 654 nm and 696 nm corresponding to the Sm3+ 4G5/2 → 6Hj (j = 5/2, 7/2, 9/2, 11/2) transitions, respectively [18]. Intensities are in the order 6H7/2 > 6H5/2 > 6H9/2 > 6H11/2 in both YGG: Sm3+ and YAG: Sm3+ crystals.
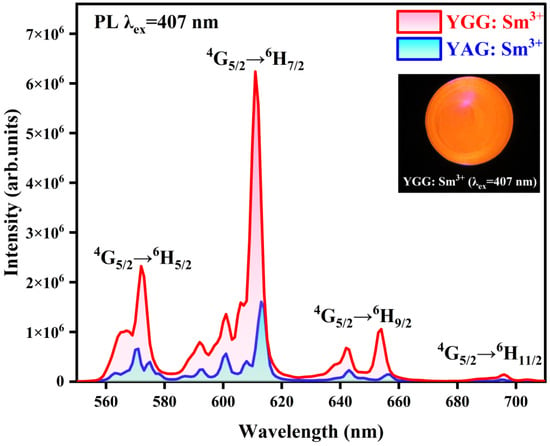
Figure 5.
Photoluminescence (PL) spectra of YGG: Sm3+ and YAG: Sm3+ single crystals under excitation at 407 nm.
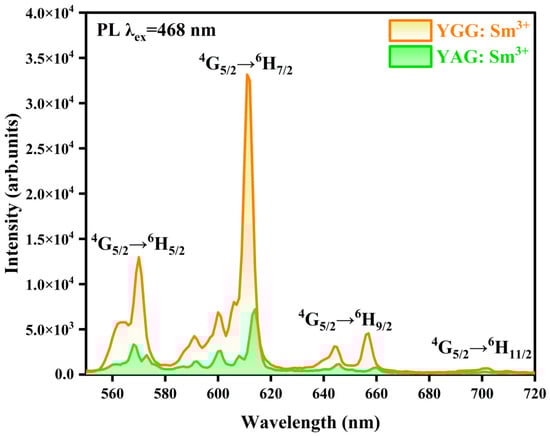
Figure 6.
Photoluminescence (PL) spectra of YGG: Sm3+ and YAG: Sm3+ single crystals under excitation at 468 nm.
Under excitation at 407 nm, the YGG: Sm3+ crystal emits bright orange-red light, as shown in Figure 5, and the intensity of YGG: Sm3+ crystal is obviously higher than that of YAG: Sm3+ crystal. Additionally, the emission spectrum of YGG: Sm3+ is blue-shifted relative to the YAG: Sm3+ crystal, with maxima at 611 and 613 nm, and the FWHM are 4.1 and 3.8 nm, respectively.
Under excitation at 468 nm (Figure 6), the YGG: Sm3+ crystal also emits orange-red light but is two orders of magnitude weaker than under excitation at 407 nm. Furthermore, the luminescence intensity of YGG: Sm3+ crystal is higher than that of YAG: Sm3+, and the emission spectrum of YGG: Sm3+ is blue-shifted relative to the YAG: Sm3+ crystal, with maxima at 611 and 613 nm and FWHM of 4.2 nm.
These results may be a consequence of changing Al3+ in the YAG lattice to Ga3+, and Ga3+ has a greater atomic mass than Al3+ and results in the YGG: Sm3+ crystal having a higher density (Table 2) and smaller phonon energy than YAG: Sm3+ [42]. The phonon energy directly affects the luminescence efficiency [23]; as a consequence, the emission peak of the YGG: Sm3+ crystal is much stronger than that of the YAG: Sm3+. In addition, the crystal fields of YGG and YAG crystals are different, which affects the 4f energy level position and linewidth of Sm3+ [43], resulting in a shorter emission wavelength and a blue shift of YGG: Sm3+ emission spectra compared with YAG: Sm3+ crystals. Thus, YGG represents an improvement over YAG as a crystal matrix for observing the luminescence of rare-earth ions, and at the same time, the YGG: Sm3+ crystal has a highly efficient orange-red emission (as shown in Figure 5) and has a potential use in w-LEDs and as orange-red solid-state lasers.
3.5. Chromaticity Coordinates
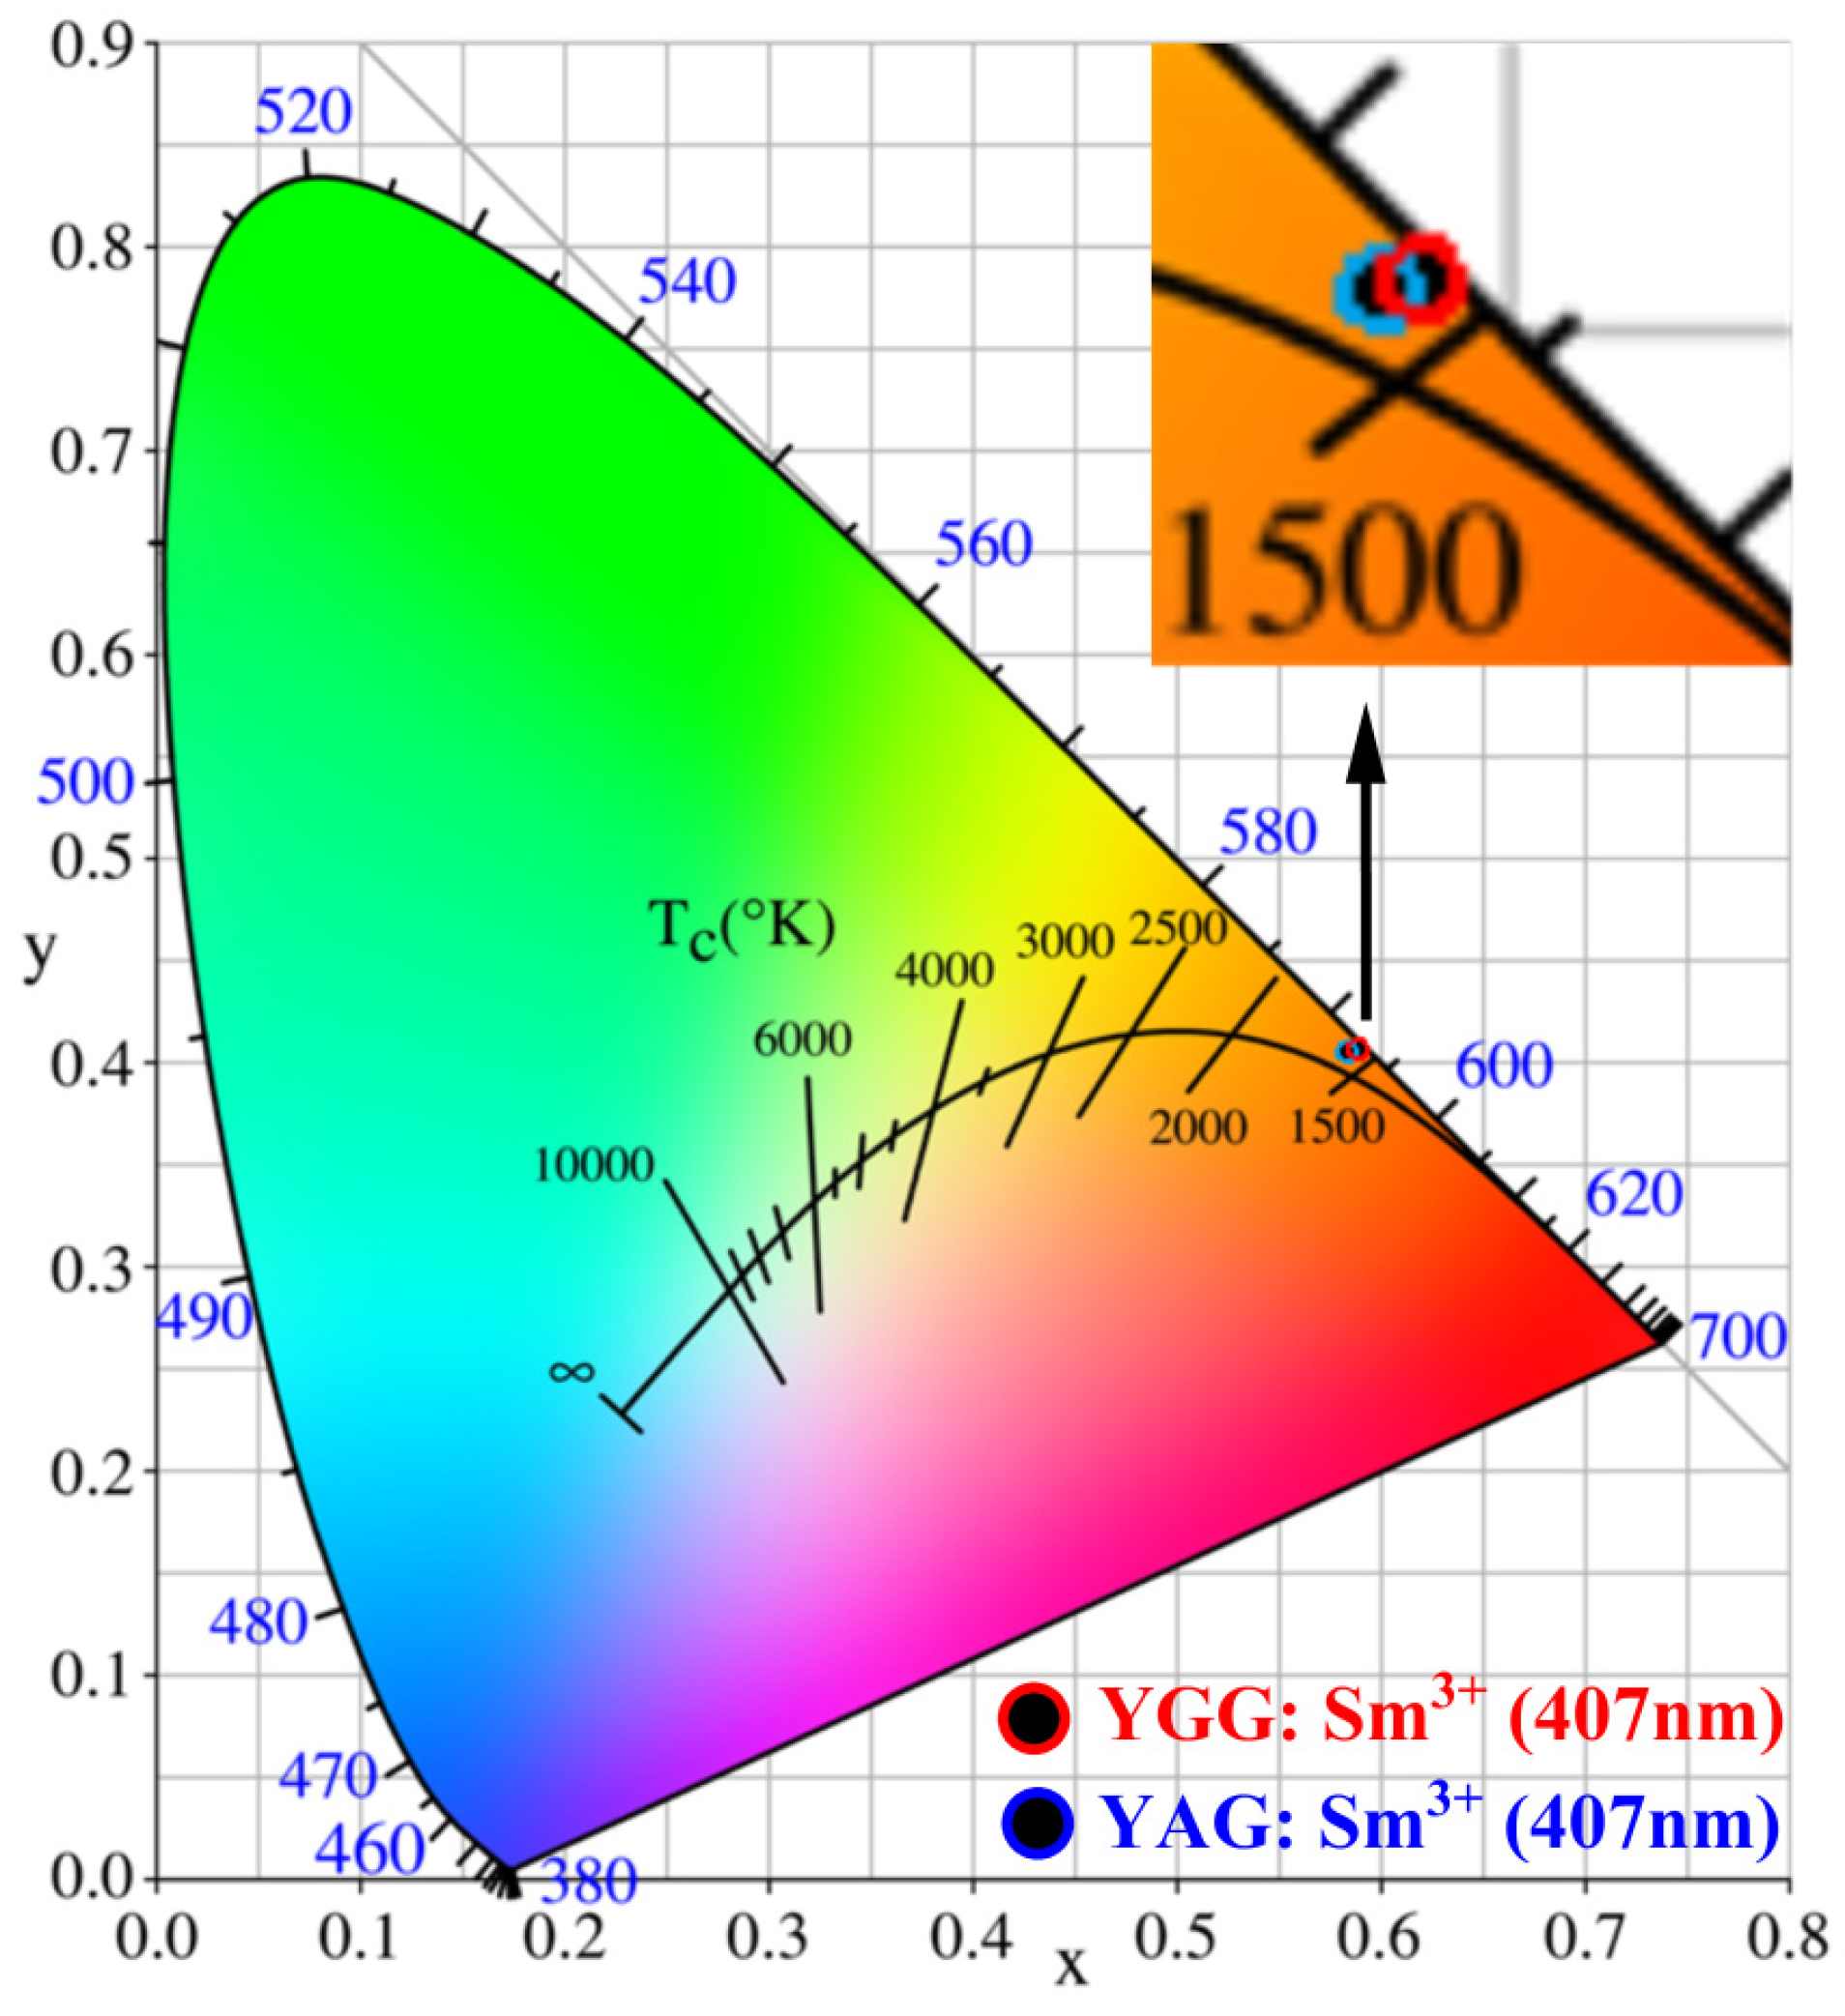
The luminescence color and color purity are important parameters for evaluating the quality and potential uses of luminescent materials [22,44]. CIE-1931 [45] was used to calculate the chromaticity coordinates for the emission spectra of YGG: Sm3+ and YAG: Sm3+ single crystals under excitation at 407 nm. As shown in Figure 7 and Table 3, the color coordinates for the spectra from both crystals are located in the orange-red light region, and their color purity was calculated by the following formula [46,47]:
where (xs, ys), (xi, yi), and (xd, yd) are the color coordinates of the crystals, the color coordinates of isoenergetic white light (0.333, 0.333), and the color coordinates of the main peak of the emission spectrum, respectively. As shown in Table 3, under excitation at 407 nm, the color purity is around 85% for the YGG: Sm3+ crystal and around 83% for YAG: Sm3+. Thus, YGG: Sm3+ single crystals are high-quality materials that emit orange-red light, with notable improvements in efficiency over YAG: Sm3+.
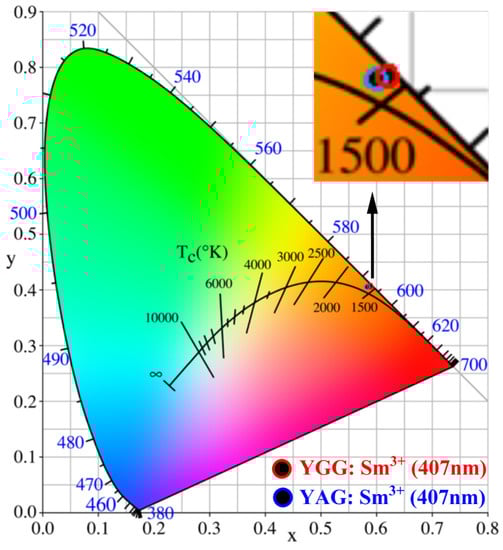
Figure 7.
Chromaticity diagram for YGG: Sm3+ crystal and YAG: Sm3+ crystal with their positions shown in expanded form in the insert.
Table 3.
Values of CIE coordinates (xs, ys) and color purities calculated for YGG: Sm3+ and YAG: Sm3+ crystals.
3.6. Fluorescence Lifetime Measurements
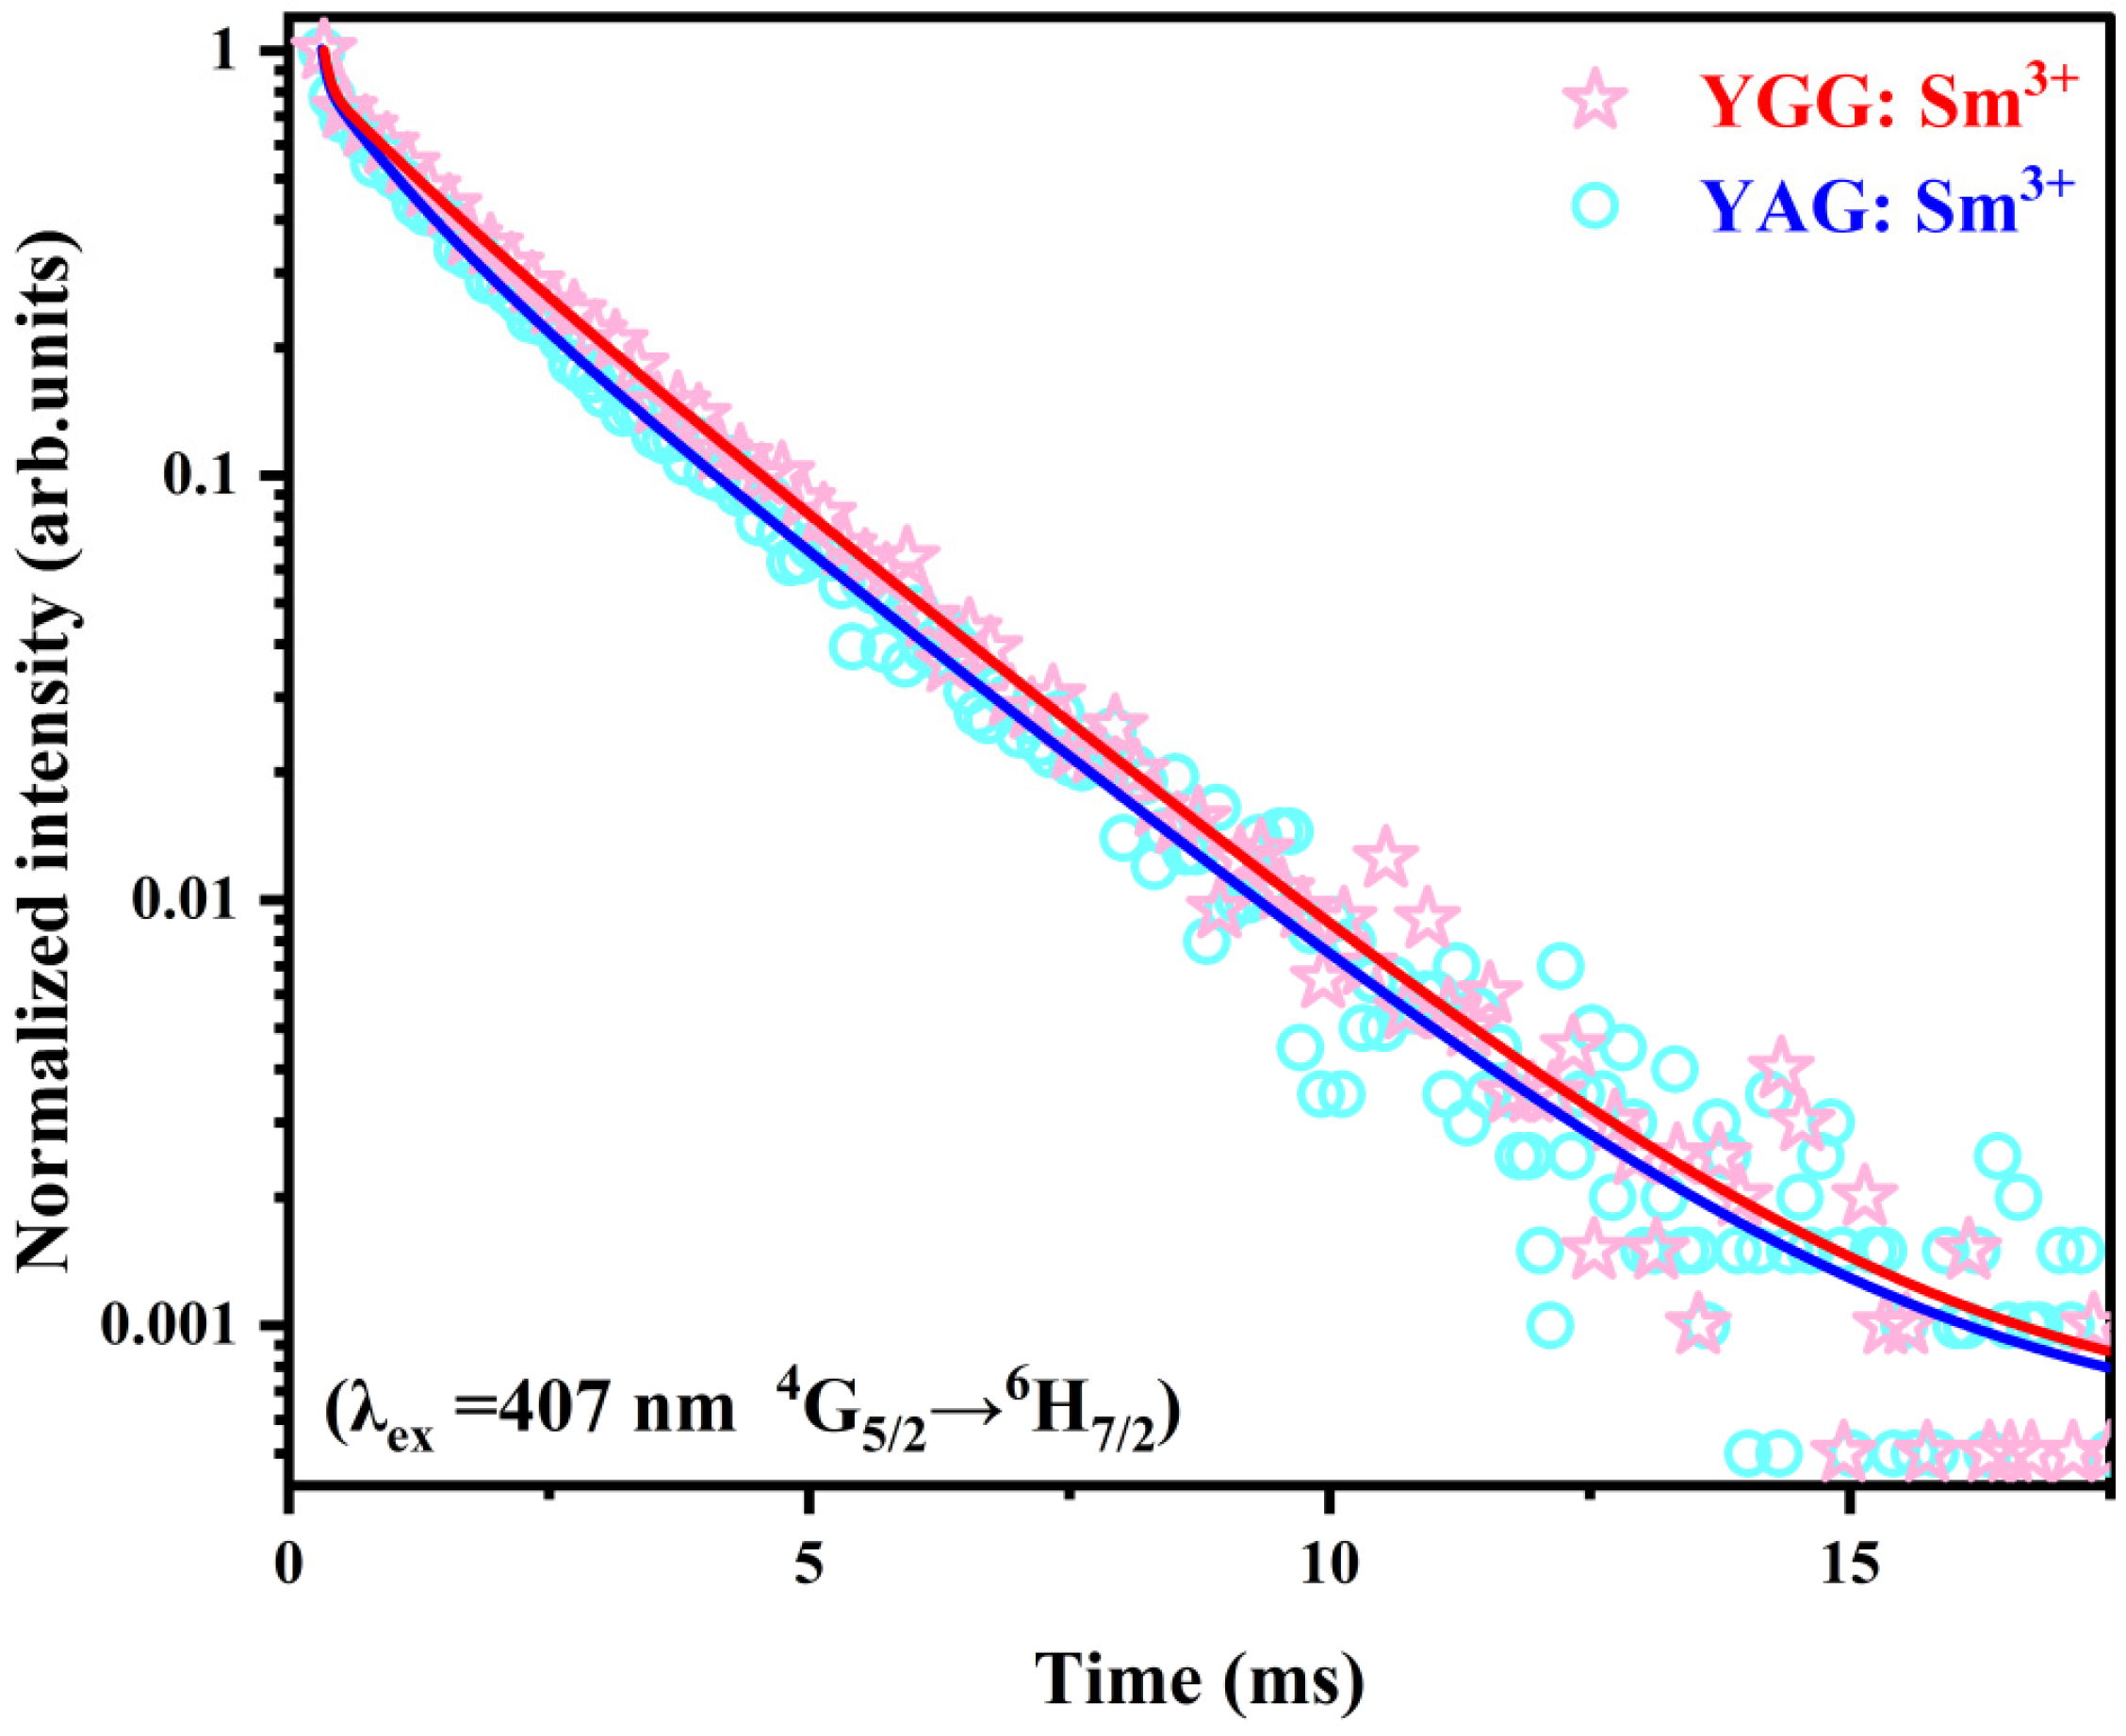
The fluorescence lifetime () is defined as the time required after ceasing excitation for the fluorescence intensity to drop to 1/e of its maximum [48]. The fluorescence decay curves (Figure 8) for the Sm3+ 4G5/2 → 6H7/2 transition in YGG: Sm3+ and YAG: Sm3+ crystals under excitation at 407 nm are similar and were fitted with a three-exponential function [49]:
where I(t) is the luminescence intensity as a function of time t, and A1, A2, and A3 are the pre-exponential factors of the three lifetimes τ1, τ2 and τ3 (Table 4) [49]. This indicates that there are three decay behaviors. The first component (τ1) is dominant and could be attributed to the Sm3+ ions [50]. The second (τ2) and third (τ3) components are longer than the first component (τ1); therefore, τ2 and τ3 could be related to the flicker light emitted by excitons associated with antisite defects in the matrix [51]. The average decay time of the sample is then defined by (6) [49]:
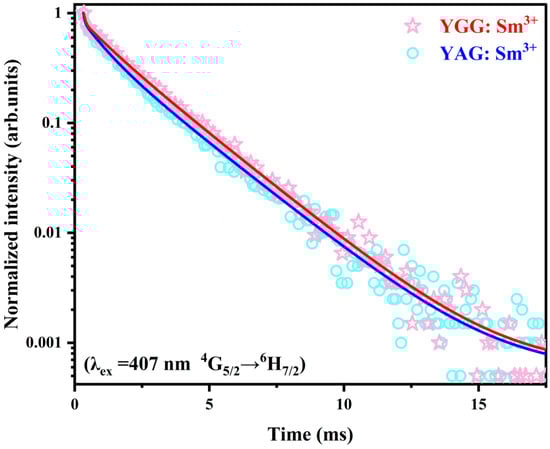
Figure 8.
Fluorescence decay curves for the YGG: Sm3+ and YAG: Sm3+ single crystals.
Table 4.
Pre-exponential factors (A) and individual lifetimes (τ) for YGG: Sm3+ and YAG: Sm3+ single crystals.
The fluorescence lifetimes for the 4G5/2 → 6H7/2 emission peak from YGG: Sm3+ and YAG: Sm3+ single crystals were then calculated to be 0.705 ms and 0.466 ms, respectively (Table 4). Thus, the fluorescence lifetime of YGG: Sm3+ is not only longer than that of the YAG: Sm3+ crystal, but it is also longer than those of CaGdAlO4: Sm3+ (0.69 ms) and NaGd(MnO4): Sm3+ crystals (0.5574 ms) [18,52,53]; this is probably the consequence of the greater intensity of its 4G5/2 → 6H7/2 emission peak, which allows for a greater participation of Sm3+ ions in this transition and results in a longer fluorescence lifetime [54,55].
4. Conclusions
High-quality Y2.96Sm0.04Ga5O12 (YGG: Sm3+) single crystals were successfully prepared for the first time by the optical floating zone method and were compared with Y2.96Sm0.04Al5O12 (YAG: Sm3+) single crystals. The density of Y2.96Sm0.04Ga5O12 single crystal (5.756 g/cm3) is larger than that of Y2.96Sm0.04Al5O12 single crystal (4.481 g/cm3), because of the larger atomic mass of Ga compared with Al. XRD analysis showed that Sm3+ successfully entered into the cubic-phase structure of the garnet crystals. Ten absorption peaks were observed at 345, 362, 377, 390, 407, 419, 439, 468, 482 and 495 nm, corresponding to 6H5/2 → 4D7/2, 4D3/2, 6P7/2, 4L15/2, 4F7/2, 6P5/2, 4G9/2, 4I13/2, 4I9/2 and 4G7/2 transitions of Sm3+, respectively. Excitation peaks at similar wavelengths were observed in the PLE spectra detected at 613 nm, including strong peaks at 407 nm and 468 nm. Both YGG: Sm3+ and YAG: Sm3+ crystals emit orange-red light with a wavelength of about 611 nm under excitation at 407 and 468 nm, respectively, and the luminescence intensity is much stronger with 407 nm excitation. Furthermore, with both PL spectra, the emission peaks from YGG: Sm3+ crystal are both significantly more intense than those from YAG: Sm3+, and both experience a blue shift. The YGG: Sm3+ crystal has a highly efficient orange-red emission. In addition, under the excitation of 407 nm, the color purity of the orange-red light emitted by the YGG: Sm3+ crystal (85%) is higher than that emitted by the YAG: Sm3+ crystal (83%). Additionally, the fluorescence lifetime at the 4G5/2 → 6H7/2 transition of the YGG: Sm3+ crystal (0.705 ms) is longer than that of the YAG: Sm3+ crystal (0.466 ms). This shows that the optical properties of YGG: Sm3+ crystal are better than those of YAG: Sm3+ crystal and that they have a potential use in w-LEDs and as orange-red solid-state lasers. In other words, YGG: Sm3+ crystals are promising new materials for use in w-LEDs and orange-red solid-state lasers.
Author Contributions
Conceptualization, H.Z.; methodology, H.Z.; software, H.Z., Z.Z. and S.T.; validation, H.Z., S.X. and W.D.; formal analysis, H.Z., N.Z. and L.W.; investigation, H.Z. and W.W.; resources, W.D.; data curation, H.Z., Z.Z. and P.Z.; writing—original draft preparation, H.Z.; writing—review and editing, H.Z., B.A.G. and W.D.; visualization, B.A.G., W.D. and S.X.; supervision, S.X. and W.D.; project administration W.D.; funding acquisition, W.D.; All authors have read and agreed to the published version of the manuscript.
Funding
This work was supported by the National Natural Science Foundations of China under Grant Nos. 12175047 and 11975004, and the Science and Technology Foundation of Guangxi University, China under Grant No. 2023BZXM003.
Data Availability Statement
The data presented in this study are available on reasonable request from the corresponding author.
Acknowledgments
The authors gratefully thank Dingkang Xiong and Yuyang Huang for useful discussions on the subject matter of this paper.
Conflicts of Interest
The authors declare no conflict of interest.
References
- Wang, Y.; Zhu, Z.; Ta, S.; Cheng, Z.; Zhang, P.; Zeng, N.; Goodman, B.A.; Xu, S.; Deng, W. Optical Properties of Yttria-Stabilized Zirconia Single-Crystals Doped with Terbium Oxide. Crystals 2022, 12, 1081. [Google Scholar] [CrossRef]
- Yu, Z.; Zhang, C.; Lou, X.; Zuo, R.; Yang, Y.; Jia, G. Rare earth ions doped Bi2MoO6 luminescent materials: Pechini sol-gel synthesis, down-conversion and up-conversion multicolor emissions, and potential applications. Ceram. Int. 2023, 49, 25987–25997. [Google Scholar] [CrossRef]
- Jamalaiah, B.C.; Rasool, S.N. Luminescence properties of GdAl3(BO3)4: Dy3+ phosphors for white-LEDs. Mater. Today 2016, 3, 4019–4022. [Google Scholar] [CrossRef]
- Kumar, V.; Som, S.; Dutta, S.; Das, S.; Swart, H.C. Influence of Ho3+ doping on the temperature sensing behavior of Er3+–Yb3+ doped La2CaZnO5 phosphor. RSC Adv. 2016, 6, 84914–84925. [Google Scholar] [CrossRef]
- Chen, Y.F.; Tsai, S.W. Diode-pumped Q-switched Nd: YVO4 yellow laser with intracavity sum-frequency mixing. Opt. Lett. 2002, 27, 397–399. [Google Scholar] [CrossRef] [PubMed]
- Yang, Y.; Xu, S.; Li, S.; Wu, W.; Pan, Y.; Wang, D.; Hong, X.; Cheng, Z.; Deng, W. Luminescence Properties of Ho2O3-Doped Y2O3 Stabilized ZrO2 Single Crystals. Crystals 2022, 12, 415. [Google Scholar] [CrossRef]
- Yousif, A.; Abbas, B.H.; Vijay, K.; Anurag, P.; Swart, H.C. Luminescence properties of Eu3+ activated Y2O3 red phosphor with incorporation of Ga3+ and Bi3+ trace hertero-cations in the Y2O3 lattice. Vacuum 2018, 155, 73–75. [Google Scholar] [CrossRef]
- Pandey, A.; Kumar, V.; Som, S.; Yousif, A.; Kroon, R.E.; Coetsee, E.; Swart, H.C. Photon and electron beam pumped luminescence of Ho3+ activated CaMoO4 phosphor. Appl. Surf. Sci. 2017, 423, 1169–1175. [Google Scholar] [CrossRef]
- Liu, R.; Wang, D.; Chen, M.; Liu, L.; Zhou, Y.; Zeng, F.; Su, Z. Luminescence, energy transfer properties of Dy3+/Eu3+ coactivated neutral and warm white emissions GSBG glasses. J. Lumin. 2021, 237, 118180. [Google Scholar] [CrossRef]
- Çelik Gül, G.; Kurtuluş, F. RE (Y, Er, Gd, La, Nd, Sm, Dy)-doped SrBPO5 colorful phosphors: Definition of structural unit cell parameters and optical properties. Optik 2017, 139, 265–271. [Google Scholar] [CrossRef]
- Pandey, A.; Kumar, V.; Kroon, R.E.; Swart, H.C. Temperature induced upconversion behaviour of Ho3+-Yb3+ codoped yttrium oxide films prepared by pulsed laser deposition. J. Alloys Compd. 2016, 672, 190–196. [Google Scholar] [CrossRef]
- Gao, T.; Tian, J.; Liu, Y.; Liu, R.; Zhuang, W. Garnet phosphors for white-light-emitting diodes: Modification and calculation. Dalton Trans. 2021, 50, 3769–3781. [Google Scholar] [CrossRef] [PubMed]
- Hu, S.; Lu, C.; Zhou, G.; Liu, X.; Qin, X.; Liu, G.; Wang, S.; Xu, Z. Transparent YAG:Ce ceramics for WLEDs with high CRI: Ce3+ concentration and sample thickness effects. Ceram. Int. 2016, 42, 6935–6941. [Google Scholar] [CrossRef]
- Du, Q.; Feng, S.; Qin, H.; Hua, H.; Ding, H.; Jia, L.; Zhang, Z.; Jiang, J.; Jiang, H. Massive red-shifting of Ce3+ emission by Mg2+ and Si4+ doping of YAG: Ce transparent ceramic phosphors. J. Mater. Chem. C 2018, 6, 12200–12205. [Google Scholar] [CrossRef]
- Gu, C.; Wang, X.-J.; Xia, C.; Li, S.; Liu, P.; Li, D.; Li, H.; Zhou, G.; Zhang, J.; Xie, R.-J. A new CaF2-YAG: Ce composite phosphor ceramic for high-power and high-color-rendering WLEDs. J. Mater. Chem. C 2019, 7, 8569–8574. [Google Scholar] [CrossRef]
- Yao, Q.; Hu, P.; Sun, P.; Liu, M.; Dong, R.; Chao, K.; Liu, Y.; Jiang, J.; Jiang, H. YAG: Ce3+ transparent ceramic phosphors brighten the next-generation laser-driven lighting. Adv. Mater. 2020, 32, 1907888. [Google Scholar] [CrossRef] [PubMed]
- Zhang, J.F.; Gu, G.R.; Di, X.X.; Xiang, W.D.; Liang, X.J. Optical characteristics of Ce, Eu: YAG single crystal grown by Czochralski method. J. Rare Earths 2019, 37, 145–150. [Google Scholar] [CrossRef]
- Tan, X.; Xu, S.; Wang, X.; Liu, F.; Goodman, B.A.; Xiong, D.; Deng, W. Preparation and optical properties of samaria-doped yttria-stabilized zirconia single crystals. J. Am. Ceram. Soc. 2019, 102, 6863–6871. [Google Scholar] [CrossRef]
- Gu, G.; Xiang, W.; Yang, C.; Liang, X. Synthesis and luminescence properties of a H2 annealed Mn-doped Y3Al5O12: Ce3+ single crystal for WLEDs. CrystEngComm 2015, 17, 4554–4561. [Google Scholar] [CrossRef]
- Demesh, M.; Dernovich, O.; Gusakova, N.; Yasukevich, A.; Kornienko, A.; Dunina, E.; Fomicheva, L.; Pavlyuk, A.; Kuleshov, N. Growth and spectroscopic properties of Sm3+: KY(WO4)2 crystal. Opt. Mater. 2018, 75, 821–826. [Google Scholar] [CrossRef]
- Rezende, M.V.d.S.; Paschoal, C.W.A. Radioluminescence enhancement in Eu3+-doped Y3Al5O12 phosphors by Ga substitution. Opt. Mater. 2015, 46, 530–535. [Google Scholar] [CrossRef]
- Yousif, A.; Som, S.; Kumar, V.; Swart, H. Comparison and analysis of Eu3+ luminescence in Y3Al5O12 and Y3Ga5O12 hosts material for red lighting phosphor. Mater. Chem. Phys. 2015, 166, 167–175. [Google Scholar] [CrossRef]
- You, L.; Zhao, Y.; Lu, D.; Liang, F.; Li, L.; Chen, Y.; Liu, J.; Wang, J.; Yu, H.; Zhang, H. High-efficiency Er-doped yttrium gallium garnet laser resonantly pumped by a laser diode at 1.47 µm. Opt. Lett. 2020, 45, 4361–4364. [Google Scholar] [CrossRef] [PubMed]
- Zeng, W.; Xia, F.; Tian, W.; Cao, F.; Chen, J.; Wu, J.; Song, R.; Mu, S. Single-crystal high-nickel layered cathodes for lithium-ion batteries: Advantages, mechanism, challenges and approaches. Curr. Opin. Electrochem. 2022, 31, 100831. [Google Scholar] [CrossRef]
- Lou, Y.; Zhang, S.; Gu, Z.; Wang, N.; Wang, S.; Zhang, Y.; Song, Y. Perovskite single crystals: Dimensional control, optoelectronic properties, and applications. Mater. Today 2023, 62, 225–250. [Google Scholar] [CrossRef]
- Kataoka, K.; Akimoto, J. Lithium-ion conductivity and crystal structure of garnet-type solid electrolyte Li7−xLa3Zr2−xTaxO12 using single-crystal. J. Ceram. Soc. 2019, 127, 521–526. [Google Scholar] [CrossRef]
- Han, Z.; Sun, D.; Zhang, H.; Luo, J.; Quan, C.; Hu, L.; Dong, K.; Cheng, M.; Chen, G.; Hang, Y. Investigation on the growth and properties of six garnet single crystals with large lattice constants. Cryst. Res. Technol. 2021, 56, 2000221. [Google Scholar] [CrossRef]
- Hong, X.; Zhang, L.; Xu, S.; Cheng, Z.; Wang, Y.; Goodman, B.A.; Xiong, D.; Deng, W. White light luminescence in Dy/Tm co-doped yttria stabilized zirconia single crystals. J. Rare Earths 2022. [Google Scholar] [CrossRef]
- Koohpayeh, S.M.; Fort, D.; Abell, J.S. The optical floating zone technique: A review of experimental procedures with special reference to oxides. Prog. Cryst. Growth Charact. Mater. 2008, 54, 121–137. [Google Scholar] [CrossRef]
- Li, S.; Xu, S.; Wang, X.; Wang, D.; Goodman, B.A.; Hong, X.; Deng, W. Optical properties of gadolinia-doped cubic yttria stabilized zirconia single crystals. Ceram. Int. 2021, 47, 3346–3353. [Google Scholar] [CrossRef]
- Wolff, N.; Schwaigert, T.; Siche, D.; Schlom, D.G.; Klimm, D. Growth of CuFeO2 single crystals by the optical floating-zone technique. J. Cryst. Growth 2020, 532, 125426. [Google Scholar] [CrossRef]
- Xu, B.; Yang, X.; Cheng, H.; Zhao, J.; Wang, Y.; Zhu, E.; Zhang, J. Preparation, characterization and property of high-quality LaB6 single crystal grown by the optical floating zone melting technique. Vacuum 2019, 168, 108845. [Google Scholar] [CrossRef]
- Tang, H.; Zhang, X.; Cheng, L.; Xie, J.; Yu, X.; Mi, X.; Liu, Q. Broadband emission of Lu3Mg2GaSi2O12: Ce3+, Sm3+ phosphors and their potential application for w-LEDs. Ceram. Int. 2021, 47, 26410–26420. [Google Scholar] [CrossRef]
- Wu, T.; Wang, L.; Shi, Y.; Xu, T.; Wang, H.; Fang, J.; Ni, J.; He, H.; Wang, C.; Wan, B.; et al. Fast (Ce,Gd)3Ga2Al3O12 Scintillators Grown by the Optical Floating Zone Method. Cryst. Growth Des. 2022, 22, 180–190. [Google Scholar] [CrossRef]
- Xu, S.; Tan, X.; Liu, F.; Zhang, L.; Huang, Y.; Goodman, B.A.; Deng, W. Growth and optical properties of thulia-doped cubic yttria stabilized zirconia single crystals. Ceram. Int. 2019, 45, 15974–15979. [Google Scholar] [CrossRef]
- Wu, W.; Wang, D.; Pan, Y.; Yang, Y.; Zhang, P.; Xu, S.; Goodman, B.A.; Deng, W. Characterization of interactive up-conversion luminescence mechanisms in Tm3+/Ho3+/Yb3+ doped yttria stabilized zirconia single crystals. Opt. Mater. 2022, 123, 111827. [Google Scholar] [CrossRef]
- Shannon, R.D. Revised effective ionic radii and systematic studies of interatomic distances in halides and chalcogenides. Acta Crystallogr. A 1976, 32, 751–767. [Google Scholar] [CrossRef]
- Brito, D.R.N.; Queiroz, M.N.; Barboza, M.J.; Steimacher, A.; Pedrochi, F. Investigation of optical and spectroscopic properties of Sm3+ ions in CaBAl glasses. Opt. Mater. 2017, 64, 114–120. [Google Scholar] [CrossRef]
- Liu, W.; Zhang, Q.; Sun, D.; Luo, J.; Gu, C.; Jiang, H.; Yin, S. Crystal growth and spectral properties of Sm: GGG crystal. J. Cryst. Growth 2011, 331, 83–86. [Google Scholar] [CrossRef]
- Jubu, P.R.; Yam, F.K.; Chahrour, K.M. Enhanced red shift in optical absorption edge and photoelectrochemical performance of N-incorporated gallium oxide nanostructures. Vacuum 2020, 182, 109704. [Google Scholar] [CrossRef]
- Makuła, P.; Pacia, M.; Macyk, W. How To Correctly Determine the Band Gap Energy of Modified Semiconductor Photocatalysts Based on UV–Vis Spectra. J. Phys. Chem. Lett. 2018, 9, 6814–6817. [Google Scholar] [CrossRef] [PubMed]
- Kittel, C. Introduction to Solid State Physics; John Wiley & Sons, Inc: Hoboken, NJ, USA, 2005. [Google Scholar]
- Pirri, A.; Maksimov, R.N.; Shitov, V.A.; Osipov, V.V.; Sani, E.; Patrizi, B.; Vannini, M.; Toci, G. Continuously tuned (Tm0.05Sc0.252Y0.698)2O3 ceramic laser with emission peak at 2076 nm. J. Alloys Compd. 2021, 889, 161585. [Google Scholar] [CrossRef]
- Han, L.; Hu, Y.; Pan, M.; Xie, Y.; Liu, Y.; Li, D.; Dong, X. A new tactic to achieve Y2O2S: Yb3+/Er3+ up-conversion luminescent hollow nanofibers. CrystEngComm 2015, 17, 2529–2535. [Google Scholar] [CrossRef]
- Wang, D.; Wu, W.; Tan, X.; Goodman, B.A.; Xu, S.; Deng, W. Upconversion Visible Light Emission in Yb/Pr Co-Doped Yttria-Stabilized Zirconia (YSZ) Single Crystals. Crystals 2021, 11, 1328. [Google Scholar] [CrossRef]
- Wu, G.; Xue, J.; Li, X.; Bi, Q.; Sheng, M.; Leng, Z. A novel red-emitting Na5W3O9F5: Eu3+ phosphor with high color purity for blue-based WLEDs. Ceram. Int. 2023, 49, 10615–10624. [Google Scholar] [CrossRef]
- Liu, G.; Zhou, H.; Che, Q.; Liu, B.; Li, J.; Cao, B.; Liu, Z. A novel phosphor of Cu+-doped PbBrOH: Preparation, luminescence mechanism, and outstanding properties. J. Mater. Chem. C 2021, 9, 9178–9187. [Google Scholar] [CrossRef]
- Naresh, V.; Buddhudu, S. Analysis of energy transfer based emission spectra of (Sm3+, Dy3+): Li2O–LiF–B2O3–CdO glasses. J. Lumin. 2014, 147, 63–71. [Google Scholar] [CrossRef]
- Naresh, V.; Gupta, K.; Parthasaradhi Reddy, C.; Ham, B.S. Energy transfer and colour tunability in UV light induced Tm3+/Tb3+/Eu3+: ZnB glasses generating white light emission. Acta A Mol. Biomol. Spectrosc. 2017, 175, 43–50. [Google Scholar] [CrossRef]
- Skaudžius, R.; Enseling, D.; Skapas, M.; Selskis, A.; Pomjakushina, E.; Jüstel, T.; Kareiva, A.; Rüegg, C. Europium–enabled luminescent single crystal and bulk YAG and YGG for optical imaging. Opt. Mater. 2016, 60, 467–473. [Google Scholar] [CrossRef]
- Luque, A.; Martí, A.; Antolín, E.; Tablero, C. Intermediate bands versus levels in non-radiative recombination. Phys. Rev. B Condens. Matter 2006, 382, 320–327. [Google Scholar] [CrossRef]
- Xu, X.; Hu, Z.; Li, R.; Li, D.; Di, J.; Su, L.; Yang, Q.; Sai, Q.; Tang, H.; Wang, Q. Polarized spectral properties of Sm: CaGdAlO4 crystal for reddish-orange laser. Opt. Mater. 2017, 69, 333–338. [Google Scholar] [CrossRef]
- Huang, J.; Huang, J.; Lin, Y.; Gong, X.; Chen, Y.; Luo, Z.; Huang, Y. Spectroscopic properties of Sm3+-doped NaGd(MoO4)2 crystal for visible laser application. J. Lumin. 2017, 187, 235–239. [Google Scholar] [CrossRef]
- Qiao, Z.; Qin, C.; He, W.; Gong, Y.; Li, B.; Zhang, G.; Chen, R.; Gao, Y.; Xiao, L.; Jia, S. Robust micropatterns on graphene oxide films based on the modification of fluorescence lifetime for multimode optical recording. Carbon 2019, 142, 224–229. [Google Scholar] [CrossRef]
- Green, D.C.; Holden, M.A.; Levenstein, M.A.; Zhang, S.; Johnson, B.R.G.; Gala de Pablo, J.; Ward, A.; Botchway, S.W.; Meldrum, F.C. Controlling the fluorescence and room-temperature phosphorescence behaviour of carbon nanodots with inorganic crystalline nanocomposites. Nat. Commun. 2019, 10, 206. [Google Scholar] [CrossRef]

Disclaimer/Publisher’s Note: The statements, opinions and data contained in all publications are solely those of the individual author(s) and contributor(s) and not of MDPI and/or the editor(s). MDPI and/or the editor(s) disclaim responsibility for any injury to people or property resulting from any ideas, methods, instructions or products referred to in the content. |
© 2023 by the authors. Licensee MDPI, Basel, Switzerland. This article is an open access article distributed under the terms and conditions of the Creative Commons Attribution (CC BY) license (https://creativecommons.org/licenses/by/4.0/).