Article

Facile Synthesis of Ni-Doped ZnO Nanostructures via Laser-Assisted Chemical Bath Synthesis with High and Durable Photocatalytic Activity

by
Samer H. Zyoud
1,2,3,4,*,
Vanga Ganesh
5,
Che Azurahanim Che Abdullah
6,7,
Ibrahim S. Yahia
3,
Ahed H. Zyoud
8,
Atef F. I. Abdelkader
1,2,
Malek G. Daher
9,
Mohamed Nasor
3,10,
Moyad Shahwan
3,11,
Heba Y. Zahran
5,12,13,
Mahmoud S. Abd El-sadek
14,
Elbadawy A. Kamoun
15,16,
Saleh M. Altarifi
17 and
Mohamed Sh. Abdel-wahab
18
1
Department of Mathematics and Sciences, Ajman University, Ajman P.O. Box 346, United Arab Emirates
2
Nonlinear Dynamics Research Center (NDRC), Ajman University, Ajman P.O. Box 346, United Arab Emirates
3
Center of Medical and Bio-Allied Health Sciences Research (CMBHSR), Ajman University, Ajman P.O. Box 346, United Arab Emirates
4
School of Physics, Universiti Sains Malaysia (USM), Penang 11800, Malaysia
5
Laboratory of Nano-Smart Materials for Science and Technology (LNSMST), Department of Physics, Faculty of Science, King Khalid University, P.O. Box 9004, Abha 61421, Saudi Arabia
6
Nanomaterial Synthesis and Characterization Laboratory, Institute of Nanoscience and Nanotechnology, Universiti Putra Malaysia, Serdang 43400, Malaysia
7
Biophysics Laboratory, Faculty of Science, Universiti Putra Malaysia, Serdang 43400, Malaysia
8
Department of Chemistry, SSERL, An-Najah National University, Nablus P.O. Box 7, Palestine
9
Physics Department, Islamic University of Gaza, Gaza P.O. Box 108, Palestine
10
Department of Biomedical Engineering, Ajman University, Ajman P.O. Box 346, United Arab Emirates
11
Department of Clinical Sciences, College of Pharmacy and Health Sciences, Ajman University, Ajman P.O. Box 346, United Arab Emirates
12
Research Center for Advanced Materials Science (RCAMS), King Khalid University, P.O. Box 9004, Abha 61413, Saudi Arabia
13
Nanoscience Laboratory for Environmental and Biomedical Applications (NLEBA), Semiconductor Lab., Metallurgical Lab. 1., Department of Physics, Faculty of Education, Ain Shams University, Roxy, Cairo 11757, Egypt
14
Physics Department, Faculty of Science, Galala University, Galala City 15888, Egypt
15
Polymeric Materials Research Department, Advanced Technology and New Materials Research Institute (ATNMRI), City of Scientific Research and Technological Applications (SRTA-City), New Borg Al-Arab City 21934, Egypt
16
Nanotechnology Research Center (NTRC), The British University in Egypt (BUE), El-Sherouk City 11837, Egypt
17
Department of Physics, College of Science, Qassim University, Buraydah Almolaydah, P.O. Box 6644, Qassim 51452, Saudi Arabia
18
Materials Science and Nanotechnology Department, Faculty of Postgraduate Studies for Advanced Sciences, Beni-Suef University, Beni-Suef 62511, Egypt
*
Author to whom correspondence should be addressed.
Crystals 2023, 13(7), 1087; https://doi.org/10.3390/cryst13071087
Submission received: 5 May 2023 / Revised: 26 June 2023 / Accepted: 27 June 2023 / Published: 12 July 2023
(This article belongs to the Special Issue Advanced Nanomaterials for Photocatalytic Technologies)

Abstract

:
Pure and Ni-doped (1%, 2%, and 3%) nanostructures were synthesized using a novel laser-assisted chemical bath synthesis (LACBS) technique. For the first time, LACBS was used to create a doping solution utilizing a 7 W blue laser with a 444.4 nm wavelength and a continuous beam. The Ni-doping concentration was varied by changing the amount of Ni precursor added. All samples were analyzed using XRD, SEM, EDX, FTIR, UV–Vis, and photocatalysis tests for photodegradation under blue laser illumination. XRD was used to confirm that the tested ZnO had a hexagonal wurtzite structure. The crystallite size decreased as the Ni-doping concentration rose. EDX experiments were conducted to analyze the elemental characteristics of the pure and Ni-doped (1%, 2%, and 3%) nanostructures. The existence of nanoscale hexagonal structures was confirmed through SEM studies. The band gap values of the pure and Ni-doped ZnO nanostructures decreased as the doping concentration increased. FTIR studies were conducted to examine the functional groups of the pure and doped samples. The produced materials exhibited excellent photocatalytic performance toward the degradation of MB organic dye, an example of a pollutant found in wastewater.

1. Introduction

Water scarcity is currently the greatest threat to the global climate system. The optimal solution is to treat wastewater containing complex organic compounds. Due to the importance of this issue, numerous methods for eliminating organic pollutants have been sought [1,2]. Organic pollutants are carbon-based chemicals that are insoluble in the environment and cannot be eliminated by conventional treatment methods [3]. The presence of these substances in the water used in various activities poses a significant threat to both humans and wildlife. Therefore, water treatment has garnered global attention, primarily due to the poor management of available water resources [4]. The poor management of water resources is exemplified by the difficulty of gaining access to resources and the fact that demand exceeds supply. Due to the state of the global economy and significant population growth, this topic has also garnered considerable interest. Improving and purifying wastewater for reuse and ensuring sustainable water development are among the best solutions to the problem of water scarcity. Nevertheless, it is feared that several organic pollutants could remain in treated water. The widely used water treatment methods include coagulation, adsorption, and membrane separation [5,6]. The problem with these methods is that they convert pollutants into solids and only partially remove them.
Consequently, the water treatment procedure necessitates a secondary treatment, which incurs additional expenses [7]. Therefore, slow oxidation processes are one of the most promising methods for removing organic pollutants from wastewater. Among the benefits of oxidation processes are the conversion of organic compounds into green products, the rapid decomposition of pollutants, the reduction in the toxicity of organic substances, and the ability to prepare products under ambient pressure and temperature conditions [8,9,10].
The solar photocatalytic process has attracted significant global interest due to research demonstrating its effectiveness in removing organic pollutants, its environmentally friendly qualities, and its ability to enhance water purification [11,12,13]. There are numerous methods for the photocatalytic degradation of dyes. Nonetheless, studies have revealed that semiconductors perform exceptionally well for various applications, including when doped, defect-induced, used alone, or combined with another material. In the past few decades, zinc oxide (ZnO) nanostructures in bulk form have been extensively studied due to their exceptional properties (e.g., thermal, mechanical, and optoelectronic properties), which make them one of the most versatile and advantageous materials [14,15]. ZnO is a biosafe and biocompatible semiconductor with a large band gap of 3.37 eV and a high excitation binding energy of 60 meV [16]. Nanostructured ZnO is a material with a wide range of technological applications. It is utilized in numerous fields and applications, such as energy applications, photoconductive sensors, gas sensors, solar cells, photodetectors, and various forms of environmental and biomedical research [17,18,19,20,21].
Additionally, ZnO, in the form of nanorods, nanobelts, nanotubes, and nanowires, is synthesized with specific methods and under particular conditions. The ability to control ZnO’s geometry further amplifies its versatility. Varying the morphology of ZnO—ranging from nanoparticles and nanorods to nanowires and thin films—can influence its surface-to-volume ratio, crystallinity, and orientation, all of which critically affect its performance in different applications. The morphologically dependent properties of ZnO enable the design of more efficient and optimized devices for specific roles [22,23,24,25,26,27]. Using ZnO nanostructures in photocatalysis applications has shown promising results with respect to water treatment [28,29]. Oxidizing agents, such as the reactive oxygen species photogenerated in ZnO, can successfully degrade organic dye substances. The doping of materials with elements such as Ni, Ag, Mg, Al, Mn, Au, etc., used in the photocatalysis method allows for the effective development of semiconductor oxides by improving their efficiency or shifting their activity to specific wavelength regions. Additionally, the properties and performance of ZnO can be further modified and enhanced by introducing defects alongside the doping process. Intrinsic defects, including vacancies and interstitials, and extrinsic doping, typically with transition metals or non-metals, can profoundly impact ZnO’s electrical, optical, and magnetic behavior. These manipulations can alter charge carrier concentrations, modify band structures, and tune ZnO’s physical and chemical properties, making it suitable for many applications [30,31,32]. Through the deposition of metallic dopants on the surface of ZnO, new energy levels can be generated to produce a photogenerated electron from the conduction band and thus reduce the recombination effects [33,34].
Photodegradation was examined to measure the efficiency of using ZnO and TiO2 in the photocatalyst technique. The technique was applied to fungicides in contaminated water under solar exposure, and it was found to be nonstoichiometric when using ZnO, making it a more effective photocatalyst than TiO2 [35]. Khatamian et al. [36] applied La3+, Sm3+, and Nd3+ doping to ZnO to enhance its photoactivity toward the degradation of 4-nitrophenol. At the same time, Sin et al. [37] used Ce/ZnO to improve ZnO’s photocatalytic destruction performance under sunny conditions.
ZnO doped by Ni materials exhibited high photocatalytic efficiency equal to 96.9% toward the degradation of RhB and that of 99.8% for 4-NP. This enhanced performance can be related to a band structure that allows for the greater separation of e- /h+ pairs, thereby lowering the recombination rate and generating levels that efficiently boost photocarrier transport [38]. Jolaei, S. et al. [39] prepared ZnO NPs, NiO NPs, and ZnO/NiO nanocomposites that showed excellent photocatalytic activity. However, ZnO/NiO nanocomposites provided better removal (93.8%) efficiency compared to ZnO NPs (86.1%) and NiO NPs (81.5%) toward acid violet after 75 min of irradiation. Thus, it can be surmised from the previous studies that the use of doped ZnO as a photocatalyst either yielded high efficiency at a longer exposure time or low efficiency.
Modern laser technology and a better understanding of the interaction between lasers and target materials are required to facilitate rapid processing and technological advances that can produce excellent nanomaterials. Laser-assisted systems run in pulse mode or continuous wave mode with wavelengths differing from UV to IR. In the manufacture of metal oxide nanoparticles, the application of a laser can induce heating effects, provide controllable chemical reactions, and generate other complicated nucleation and particle enhancement phenomena. These affordances are due to this technique’s simplicity, expandability, high returns, and inexpensiveness [40,41]. Laser-assisted chemical bath synthesis (LACBS) technology began to be widely used because it facilitates the production of nanomaterials in several forms and can be used as a mechanism to sense the elements in manufacturing. The essential step of this technique is the photothermal effect from exposure by a focused laser on the target while ensuring that it has high temperature control resulting from the exposure. The synthesis parameters and physical properties are carefully controlled, and the efficiency of the synthesis of metal oxides using the LACBS technique has shown considerable improvement [41,41].
In this work, LACBS was used as a simple, catalyst-free hydrothermal technique for producing pure ZnO and ZnO: Ni at a low temperature. LACBS has emerged as a viable technique for producing nanostructures or nanoparticles with multiple morphologies. It constitutes a critical element in sensing mechanisms due to its simplicity, ability to be quickly conducted, ability to produce high yields, inexpensiveness, ability to yield products with large surface-to-volume ratios, and adaptability for scaling up. In this method, synthesized nanopowders were collected to produce nanorods and nanotubes with high crystallinity, which were used in photodegradation. Undoped and Ni-doped ZnO nanostructures, prepared using the LACBS technique, were used as photocatalysts for degrading MB by exposing it to a blue laser. This research aimed to determine the effects induced by certain experimental parameters, such as the Ni-doping ZnO concentration, the light source, and direct exposure time. ZnO: Ni nanoflakes are necessary for improving photodegradation under blue laser irradiation.

2. Methodology

The enhancement of the photodegradation process using Ni-doped ZnO nanostructures is the primary focus of our investigation. Additionally, a comparative evaluation was conducted to assess this technique’s efficacy by comparing it with the results obtained when using pristine ZnO.

2.1. Materials

High-purity zinc acetate dihydrate [Zn(CH3COO)2.(H2O)2 (≥99.99%)] and hexamethylenetetramine [C6H12N4, (99.9%)] were procured from Sigma-Aldrich and employed in their as-received condition without further purification. Nickel (II) chloride [NiCl2] was obtained from Pub-Chem, which is based in the United States. A simulated wastewater containing methylene blue (MB) [C16H18CIN3C, (sourced from Merck, Rahway, NJ, USA)] was utilized to evaluate degradation performance.

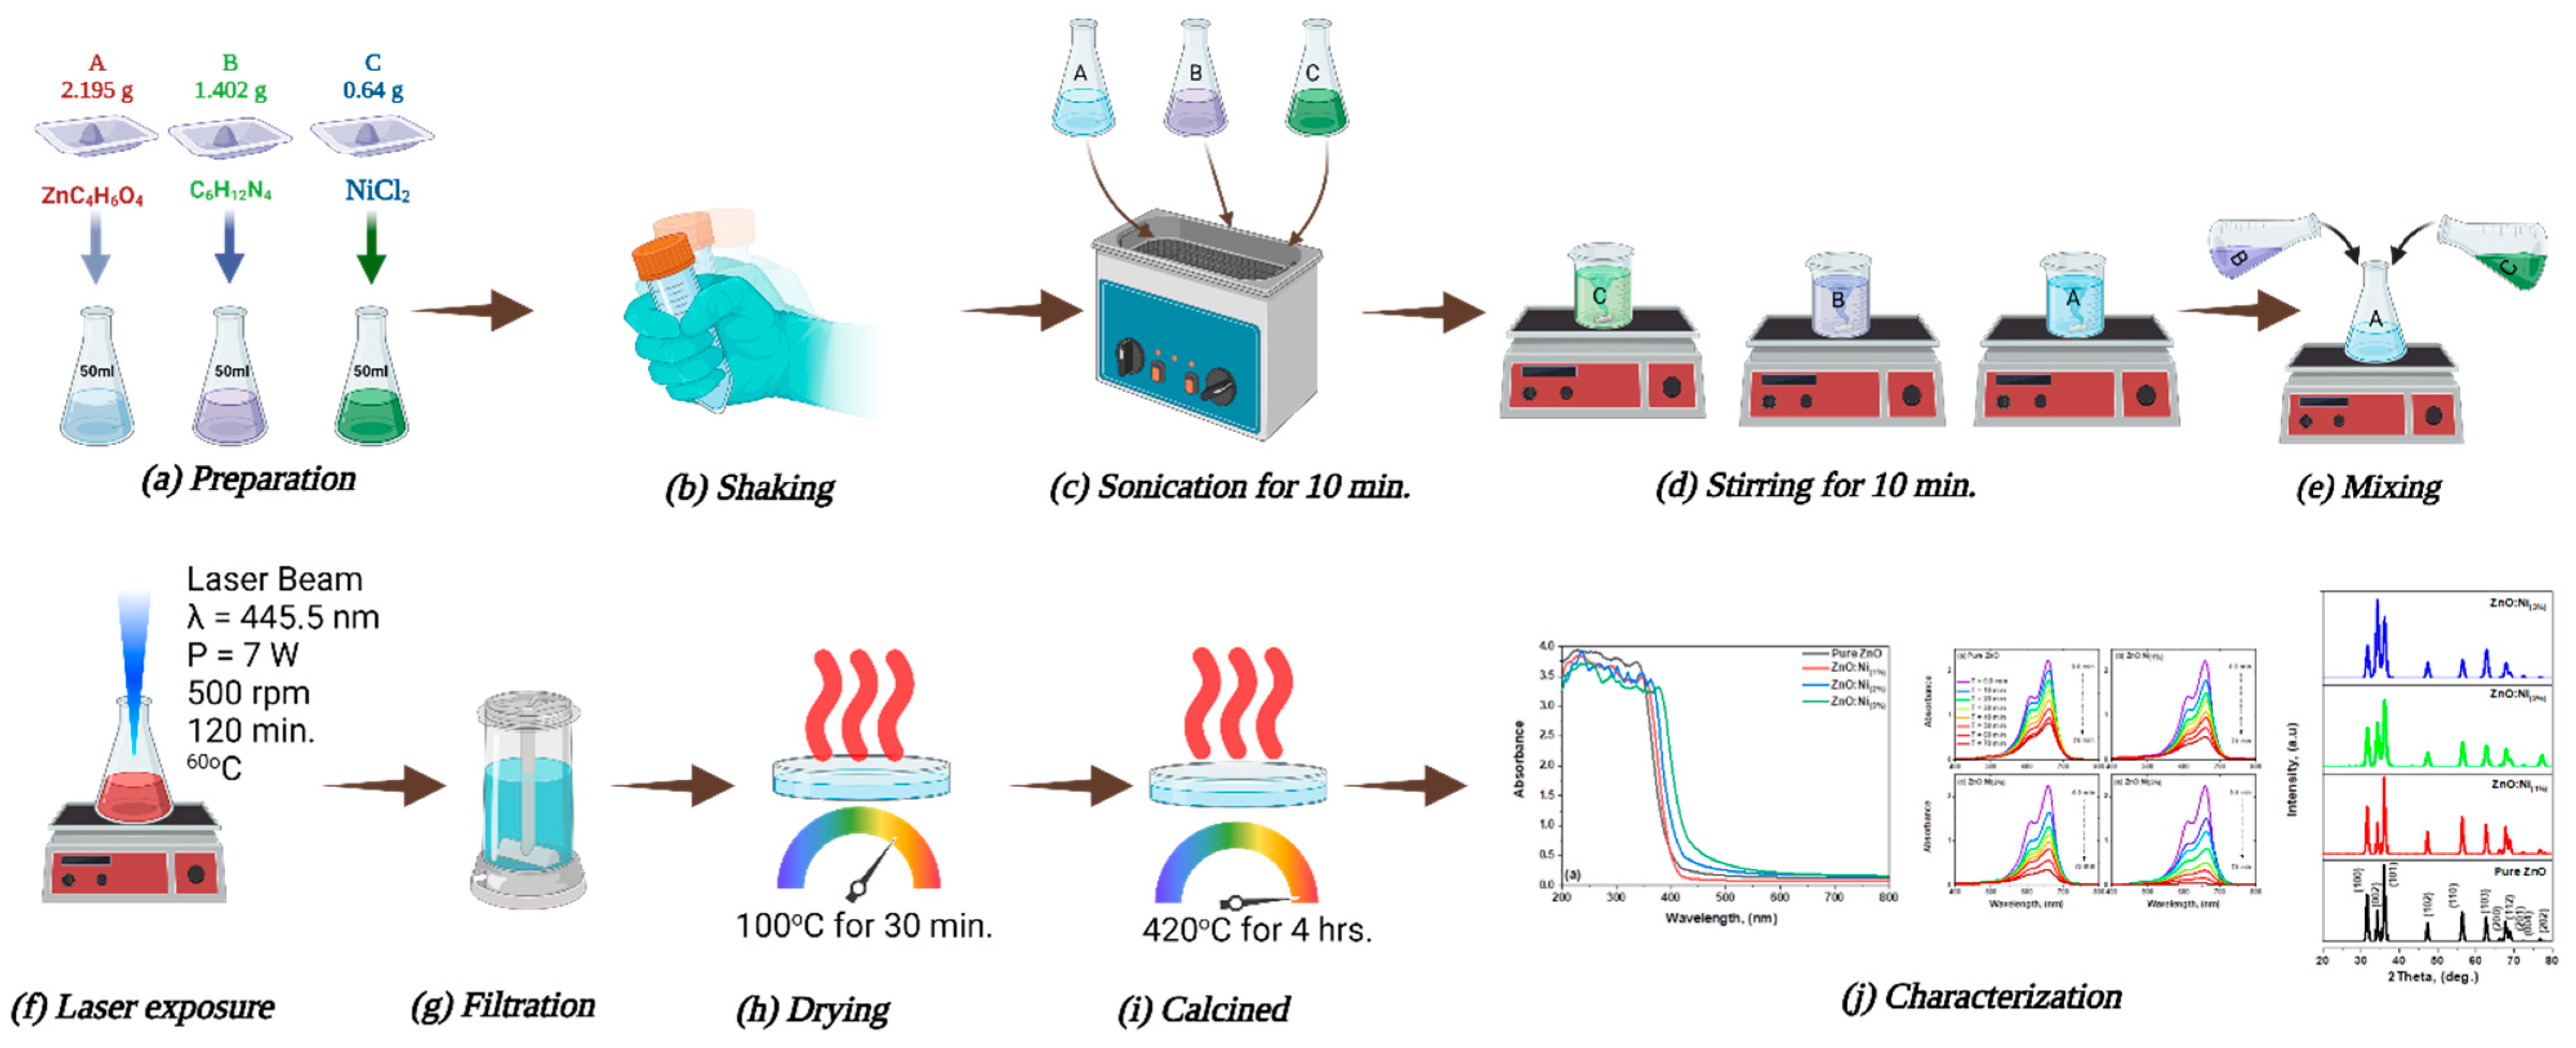
2.2. Preparation of Stock Solutions

Specific antecedent solutions were synthesized, for which ultra-pure water was used as the deposition medium. In the fabrication process, ethanol, acetone, and deionized water were employed as cleaning agents. Preparations of reagents consisting of Zinc Oxide (ZnO, 0.1 M): solution A (zinc acetate (ZnC4H6O4)): 2.195 g of ZnC4H6O4 were combined with 50 mL of ultra-pure water, serving as the deposition medium, and thoroughly agitated using a digital stirrer (200 rpm). The mixture was sonicated to facilitate dissolution. Solution B ((hexamethylenetetramine (C6H12N4)): 1.402 g of C6H12N4) was incorporated into 50 mL of ultra-pure water, followed by sonication and rigorous stirring to achieve a uniform composition. Preparations of metal salt solutions ((0.1 M): Solution C (nickel (II) chloride (NiCl2)): 0.648 g of NiCl2) were blended with 50 mL of ultra-pure water using a stirring device and subsequently sonicated to attain homogeneity (Table 1).

2.3. Synthesis of ZnO Nanoparticles

The LACBS technique was employed to synthesize high-purity ZnO nanopowder. Solution B was gradually introduced into solution A through a dropwise approach while maintaining persistent agitation at a rate of 200 rotations per minute (rpm) for a duration of 25 min at an ambient temperature of 28 °C. Subsequently, the resulting mixture was subjected to continuous-wave semiconductor blue laser irradiation, characterized by a wavelength (λ) of 444.4 nm and a power of 7 W, oriented vertically toward the solution for an extended period of 130 min at an elevated temperature of 60 °C.
Post-irradiation, the residual matter was isolated from the mixture via a filtration process, followed by a triple rinse using ethanol as the solvent. The isolated zinc oxide was then dried for 35 min at a temperature of 100 °C. As a final step, the gathered nanopowder was annealed in a controlled-temperature oven for a period of 4 h at an approximate temperature of 400 °C, thus ensuring thorough decomposition and the removal of any remaining organic impurities.
Laser irradiation facilitates a controlled, high-temperature environment, which promotes the efficient synthesis of high-quality ZnO crystals. The process involves using a high-power laser beam focused onto a mixture of zinc and nickel precursors, which leads to the evaporation and subsequent condensation of the precursor materials, thereby producing pure ZnO and Ni-doped ZnO particles. Incorporating Ni ions into the ZnO lattice during the synthesis process allows for the doping of ZnO with Ni.

2.4. Synthesis of Ni-Doped ZnO Nanoflakes

LACBS-synthesized Ni-doped ZnO was generated through the gradual integration of solutions B and C into solution A while maintaining continuous agitation (at 200 revolutions per minute) for a duration of 30 min at a temperature of 28 °C. Initially, one should adhere to the methodologies outlined in Section 2.3. Subsequently, one should perform the procedures described above using an assortment of Nickel (II) Chloride (NiCl2) concentrations (1%, 2%, and 3% of Ni-doped ZnO), as depicted in Figure 1.

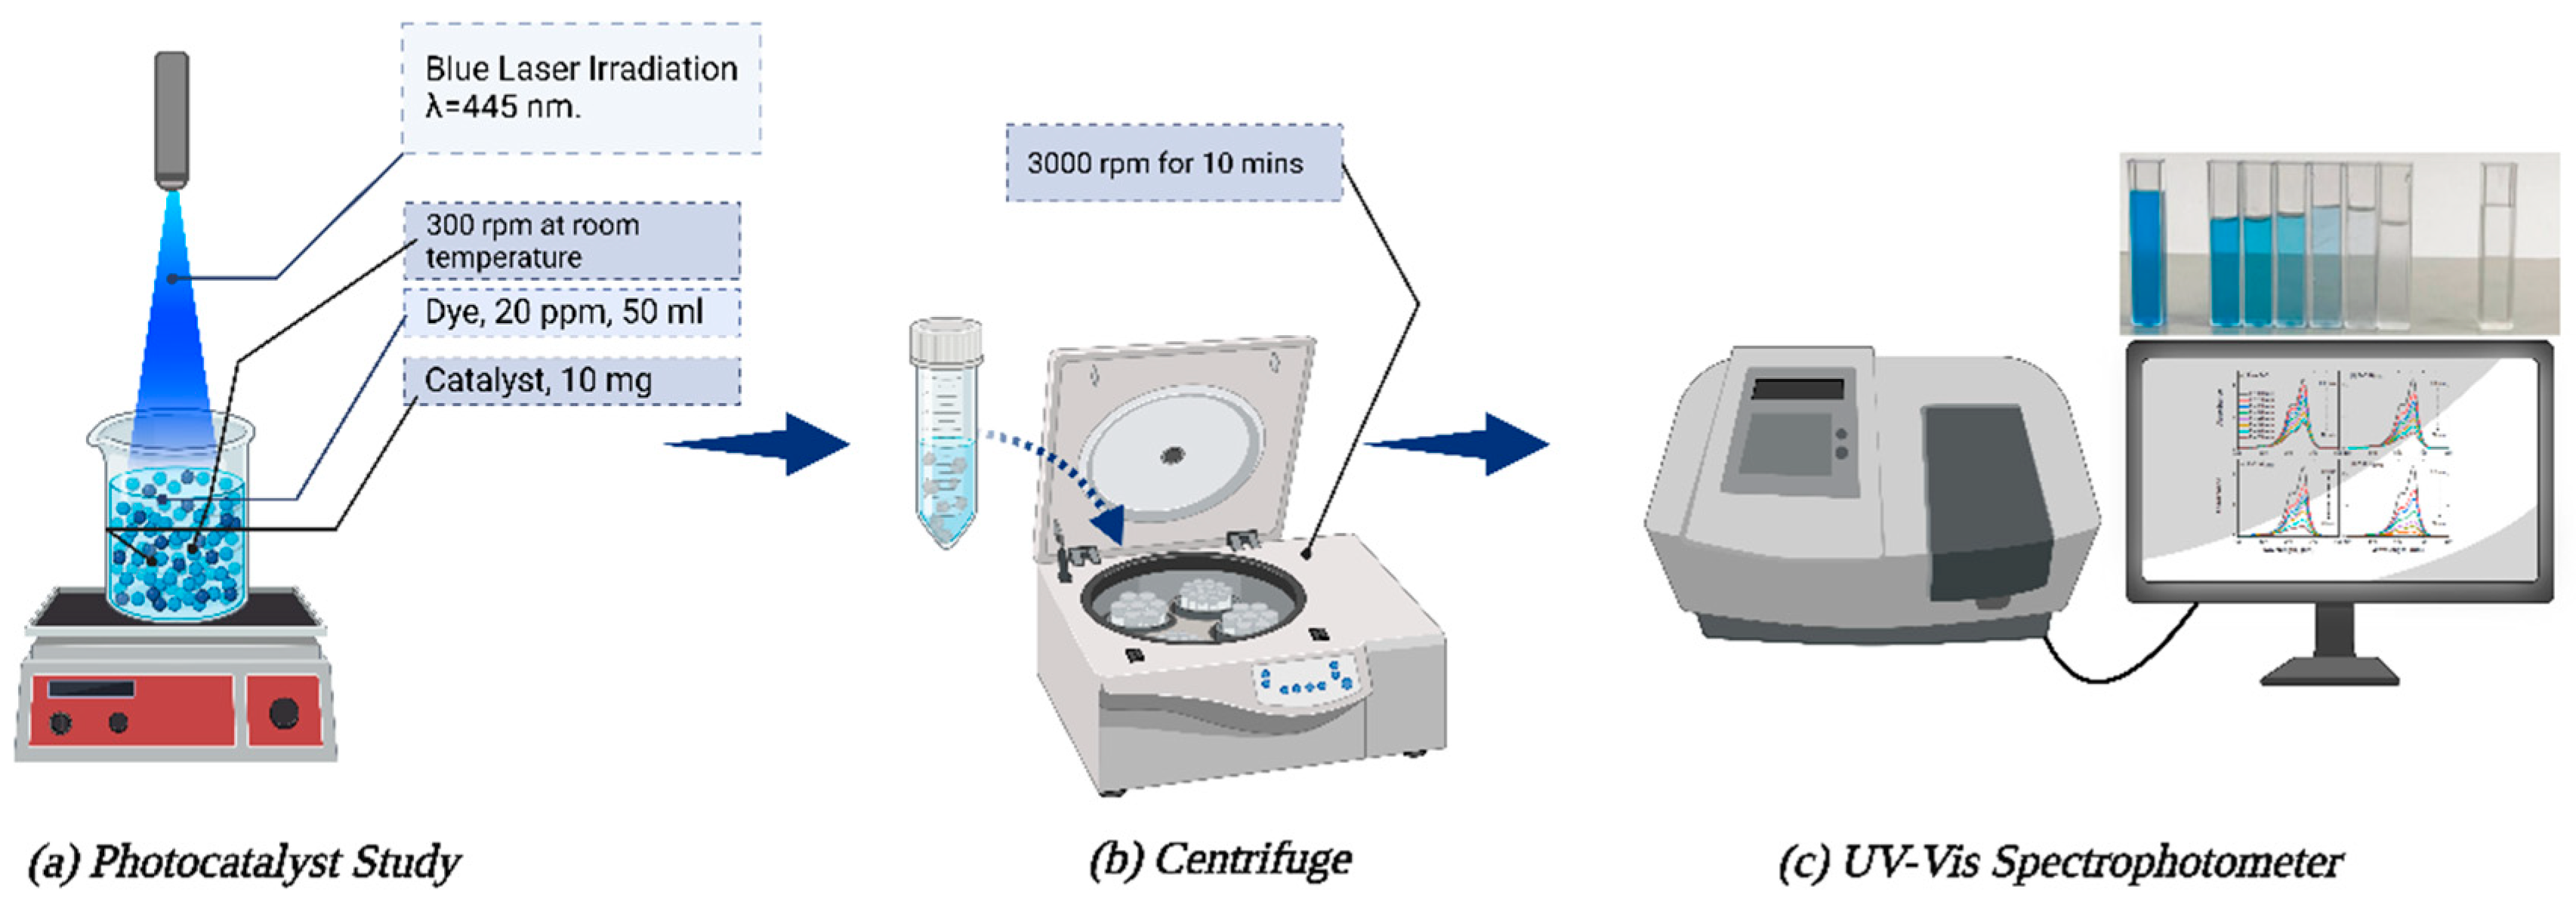
2.5. Photocatalytic Degradation Study

An MB solution with a concentration of 20 parts per million (ppm) was investigated under blue laser light irradiation (λ = 444.4 nm wavelength) during the photocatalytic degradation process at ambient temperature within a shielded evacuator to eliminate any thermal catalytic influence. A predetermined quantity (10 mg) of synthesized catalysts, including pure ZnO, ZnO:Ni(1%), ZnO:Ni(2%), and ZnO:Ni(3%), was combined with the 20 ppm MB solution and stirred continuously under dark conditions. To achieve adsorption–desorption equilibrium between water, catalysts, and MB, the mixture was agitated for 15 min. Subsequently, the reaction mixture was exposed to blue laser light for the degradation of MB. During the irradiation process, a specific volume (5 mL) of the solution was sampled every 5 min for analysis. The absorption spectra of the samples at the maximum absorption wavelength (λ = 656.4 nm) were determined using a UV–Vis spectrophotometer. The effectiveness of dye degradation was assessed using the following equations [32]:
C C o = A A o ,
l n C o C = k a p p t ,
P D E % = 1 C C o × 100 % ,
where C o denotes the initial concentration of MB prior to any exposure to light, while C signifies the MB concentration at a specific time point following light irradiation. Moreover, Ao refers to the highest absorption peak observed before irradiation, whereas A represents the corresponding peak after irradiation has occurred. P D E % represents the photodegradation efficiency, while k a p p represents the rate of degradation. Figure 2 illustrates the schematic representation of the photocatalytic investigation being conducted.

2.6. Characterization

An X-ray diffractometer produced by Rigaku, Japan, was employed to investigate the crystallinity of both pristine and nickel-doped ZnO nanostructures. These synthesized nanostructures’ morphological characteristics and elemental compositions were examined through field-emission scanning electron microscopy (FE-SEM, JEOL JSM-7600F) in conjunction with the use of an energy-dispersive X-ray (EDX) detector. The optical properties of the materials were probed utilizing a UV–Visible spectrometer, specifically the P.E. Lambda 750S model. Additionally, the optical absorption spectra of the specimens were corroborated using a UV–Vis spectrum analyzer. To gain insight into the products’ molecular structures, Fourier-transform infrared spectroscopy (FTIR) was employed.

3. Results and Discussion

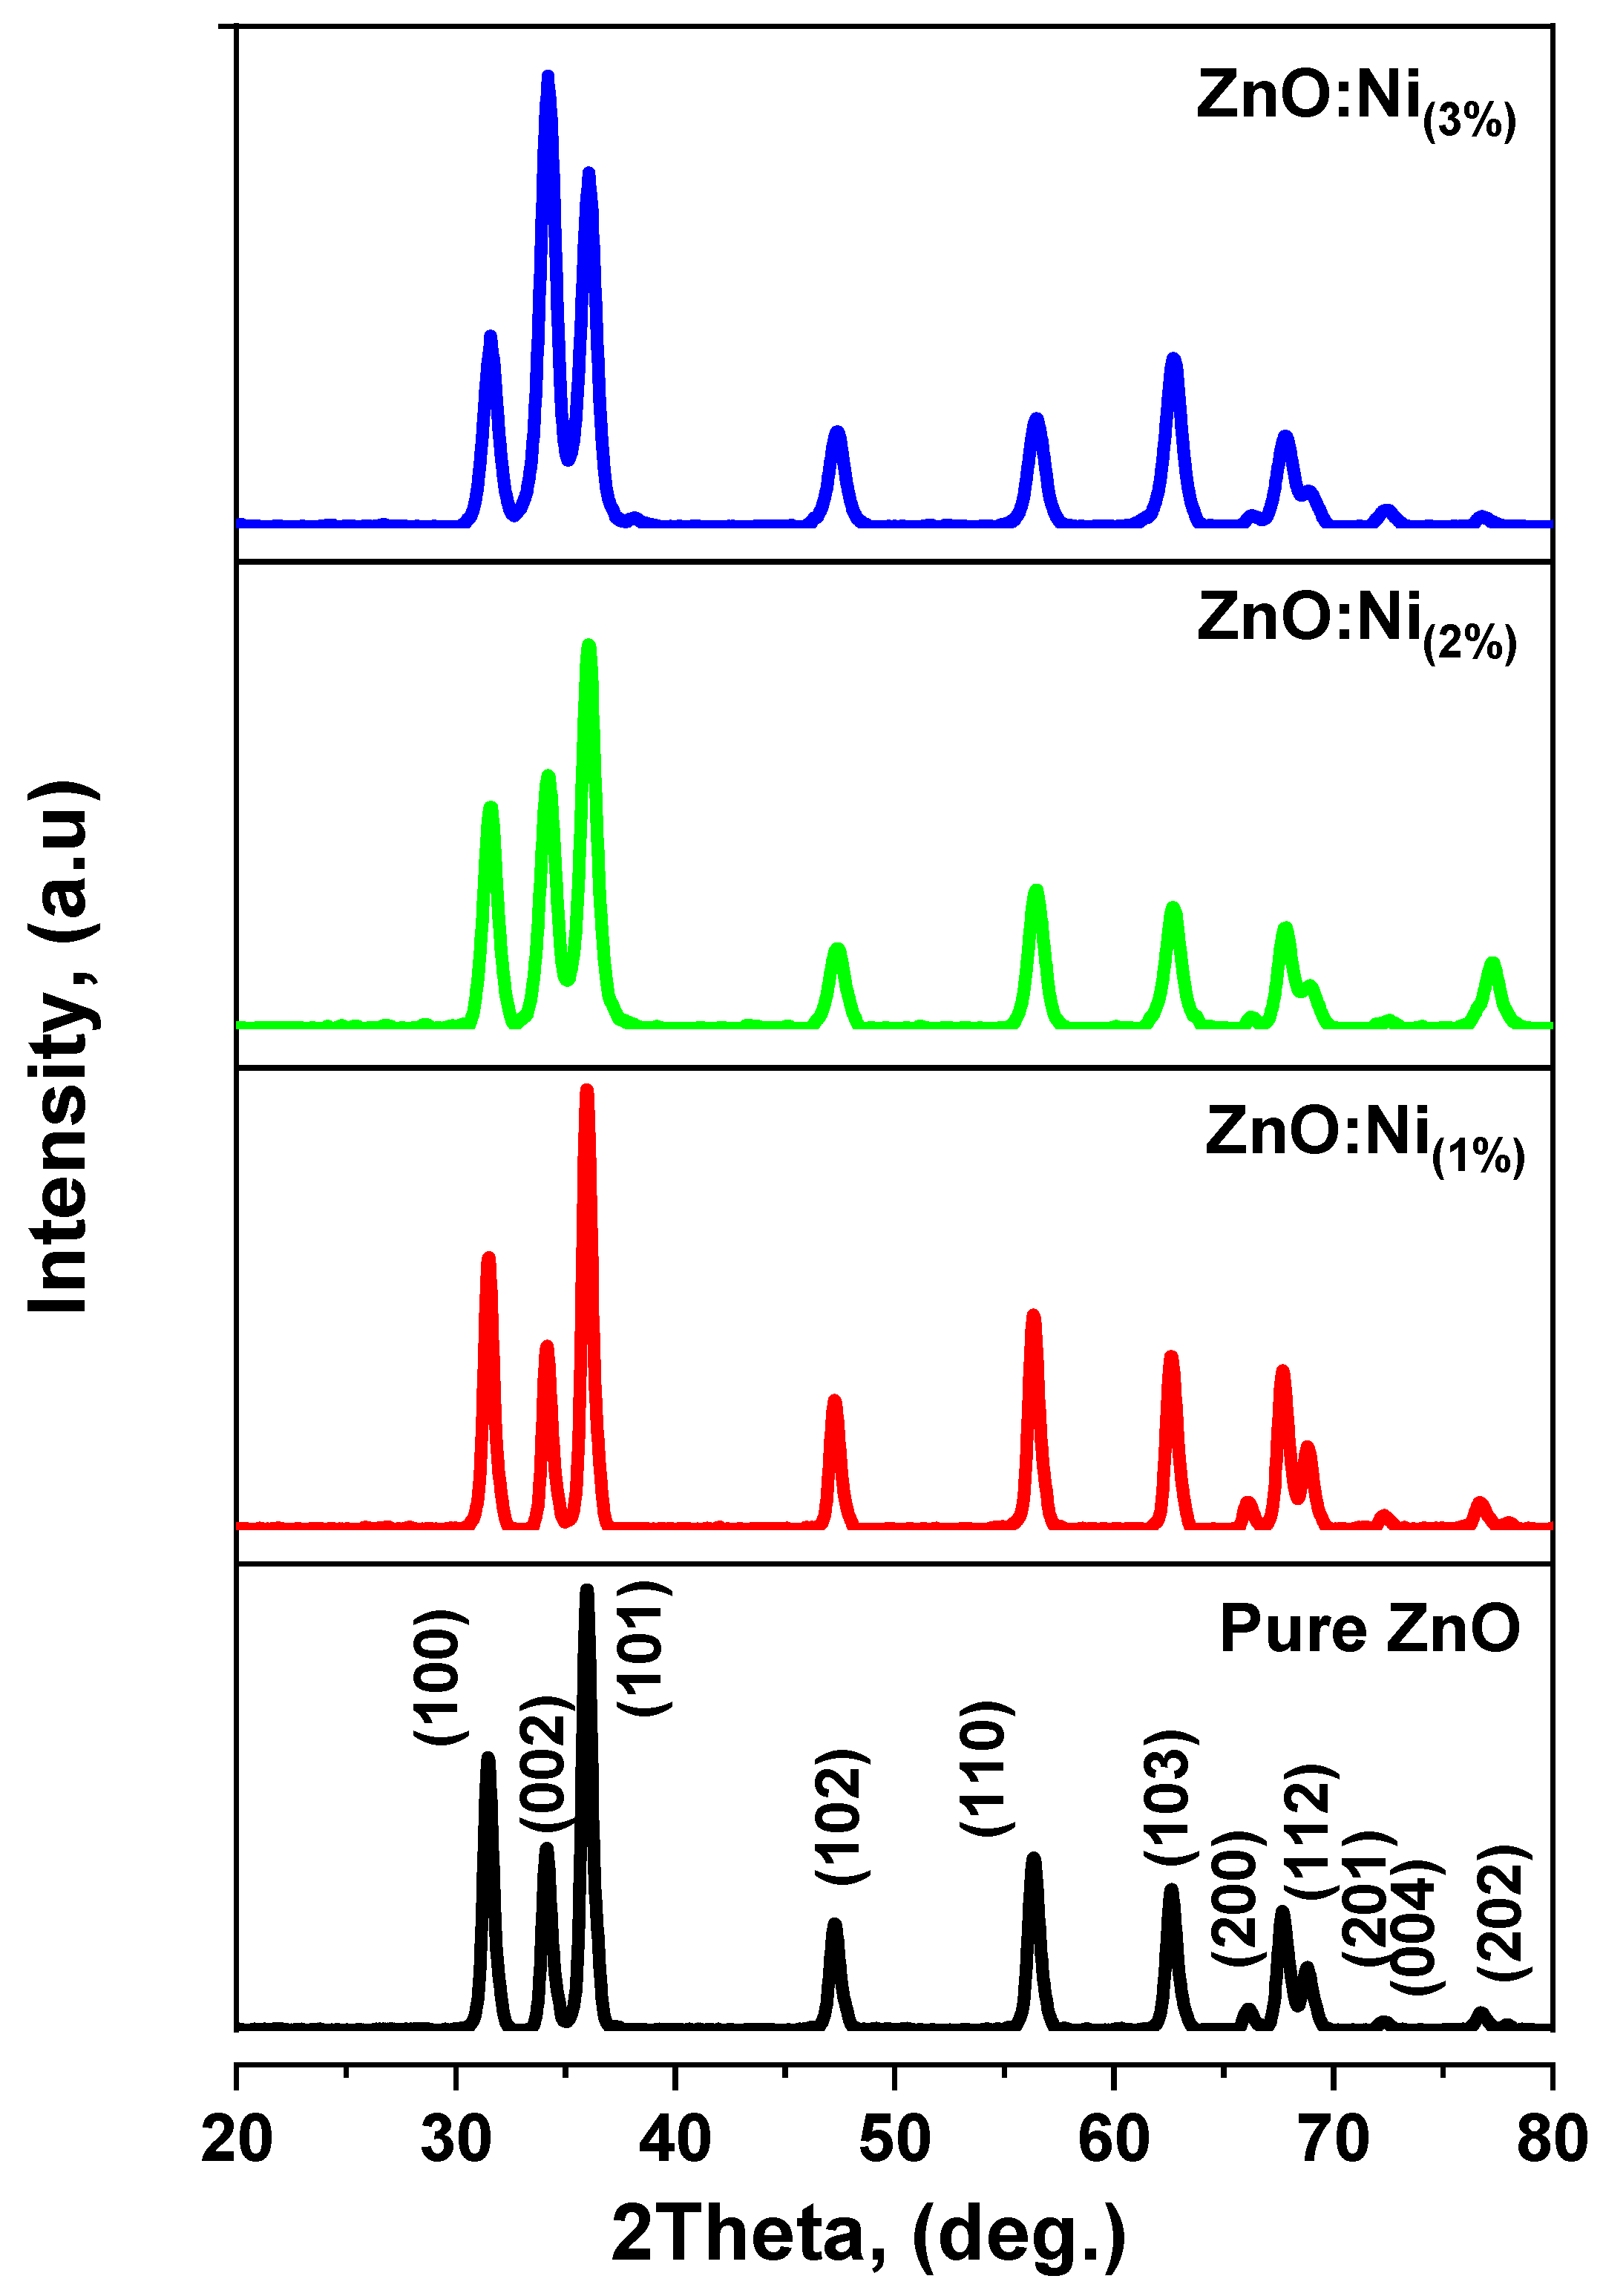
3.1. X-ray Diffraction Studies

Figure 3 illustrates the X-ray diffraction patterns for the pure and Ni-doped nanostructures (1%, 2%, and 3%). The distinct peaks in both the pure and doped specimens correspond to the indices (100), (002), (101), (102), (110), (103), (200), (112), (201), (004), and (202), which align well with JCPDS card number 89-0510 [42]. The detected prominent peaks confirm the presence of a hexagonal wurtzite structure in the ZnO, which was characterized by the P63mc space group [42]. Additionally, the diffraction patterns revealed no secondary phase due to Ni doping. This absence of a secondary phase might be attributed to the replacement of Zn ions by doped Ni ions, which, in turn, is likely due to the similar ionic radii of Ni2+ (0.069 nm) and the substituted Zn2+ ions (0.074 nm).
The pronounced and intense peaks in the XRD patterns demonstrate the exceptional crystallinity of the synthesized nanostructures. The most intense peaks, such as (100), (002), and (101), are predominant in the prepared nanostructures. The diffraction peak intensities of (100) and (002) increase with an increasing doping concentration, signifying high crystallinity and a preferential degree of nanostructure growth along the a-axis and c-axis. Conversely, the diffraction peaks related to the (101) plane decrease in intensity with an increasing doping concentration for both the pure and doped samples, indicating high crystallinity and the preferential growth of nanostructures along the b-axis. The dominant peaks’ orientations along the a-axis, b-axis, and c-axis at (100), (101), and (002), respectively, substantiate that the synthesized samples exhibit a hexagonal wurtzite structure. The diminished crystallinity along the most intense (101) peak may be due to the varying solubility of zinc acetate depending on the solvent. Zinc acetate dissolves more readily in deionized water compared to other solvents, thereby reducing the size of nanocrystallites. The decrease in crystallite size may also be attributed to the fact that the nanostructures were prepared using a laser-assisted process. In this case, the solution underwent laser irradiation during the preparation process, initiating chemical reactions that generated tiny ZnO nanoparticles.
Table 2 presents the structural parameters of the pure and Ni-doped ZnO nanostructures synthesized via LACBS with varying doping concentrations. The analysis includes the determination of peak positions (2θ), intensity, full width at half maximum (FWHM) values, lattice constants (a, b, and c), and internal strain ( ε a , ε c ) along the diffraction peaks of the (100), (002), and (101) planes.
The crystallinity of the dominant peak decreases as the concentration of Ni dopant increases, suggesting that the introduction of Ni atoms into the ZnO matrix disrupts the crystalline structure. The change in the internal strain values also indicates the impact of Ni doping on the pure ZnO matrix. The negative strain values are suggestive of compressive strain, which can be attributed to the presence of defects and impurities. Moreover, the shift in the diffraction peaks of the (100), (002), and (101) planes for both the pure and doped samples was calculated using Bragg’s law, which relates the wavelength of X-rays diffracted by the crystal lattice to the interatomic spacing of the lattice planes [43]:
n λ = 2 d s i n θ ,
where n, θ ,   λ , and d   represent the order of diffraction, the diffraction angle, X-ray wavelength, and the distance between planes, respectively. Crystallite size (D) was calculated using the Debye–Scherer formula [44], as follows:
D = k λ β c o s θ ,
where k is the constant ( k = 0.9), θ is the Bragg diffraction angle, λ is the X-ray source wavelength ( λ = 1.5427), and β is FWHM. The lattice constants (a, b, and c) of the doped and undoped ZnO were calculated using Bragg’s law [33]:
a = b = λ 3 s i n θ ,
c = 3 a ,
where θ is the diffraction peak angle and λ is the wavelength of the X-ray source. The values of the lattice parameters (a and c) are given in Table 2.
Ɛa and Ɛc represent strain along different crystallographic axes of the ZnO structure. The different values of strain ( ε a and ε c ) arise from the anisotropic mechanical properties of ZnO. This anisotropy is due to the compound’s hexagonal structure, where the ‘a’ and ‘c’ axes are not equivalent. In general, mechanical or thermal stresses can induce varying strain along these different directions, which explains the observed difference in the values of ε a and ε c . The doping process changes the strain response, as it can alter the lattice parameters and, as a result, the mechanical properties of ZnO. Therefore, we report the strain along ‘c’ axis ( ε c ), as this direction is more sensitive to these alterations and, therefore, best illustrates the impact of doping on the ZnO samples. The strain ( ε a ) of the undoped and doped ZnO nanostructures was calculated using the following equation [45]:
ε a = a a o a o × 100 % ,
The strain ( ε c ) of the pure and doped samples was calculated using the following equation [46]:
ε c = c c o c o × 100 % ,
where a o and c o are the standard lattice constants for unstrained ZnO determined from the X-ray diffraction pattern data and the standard lattice constant for unstrained ZnO (JCPDS card no 89-0510), respectively [42].

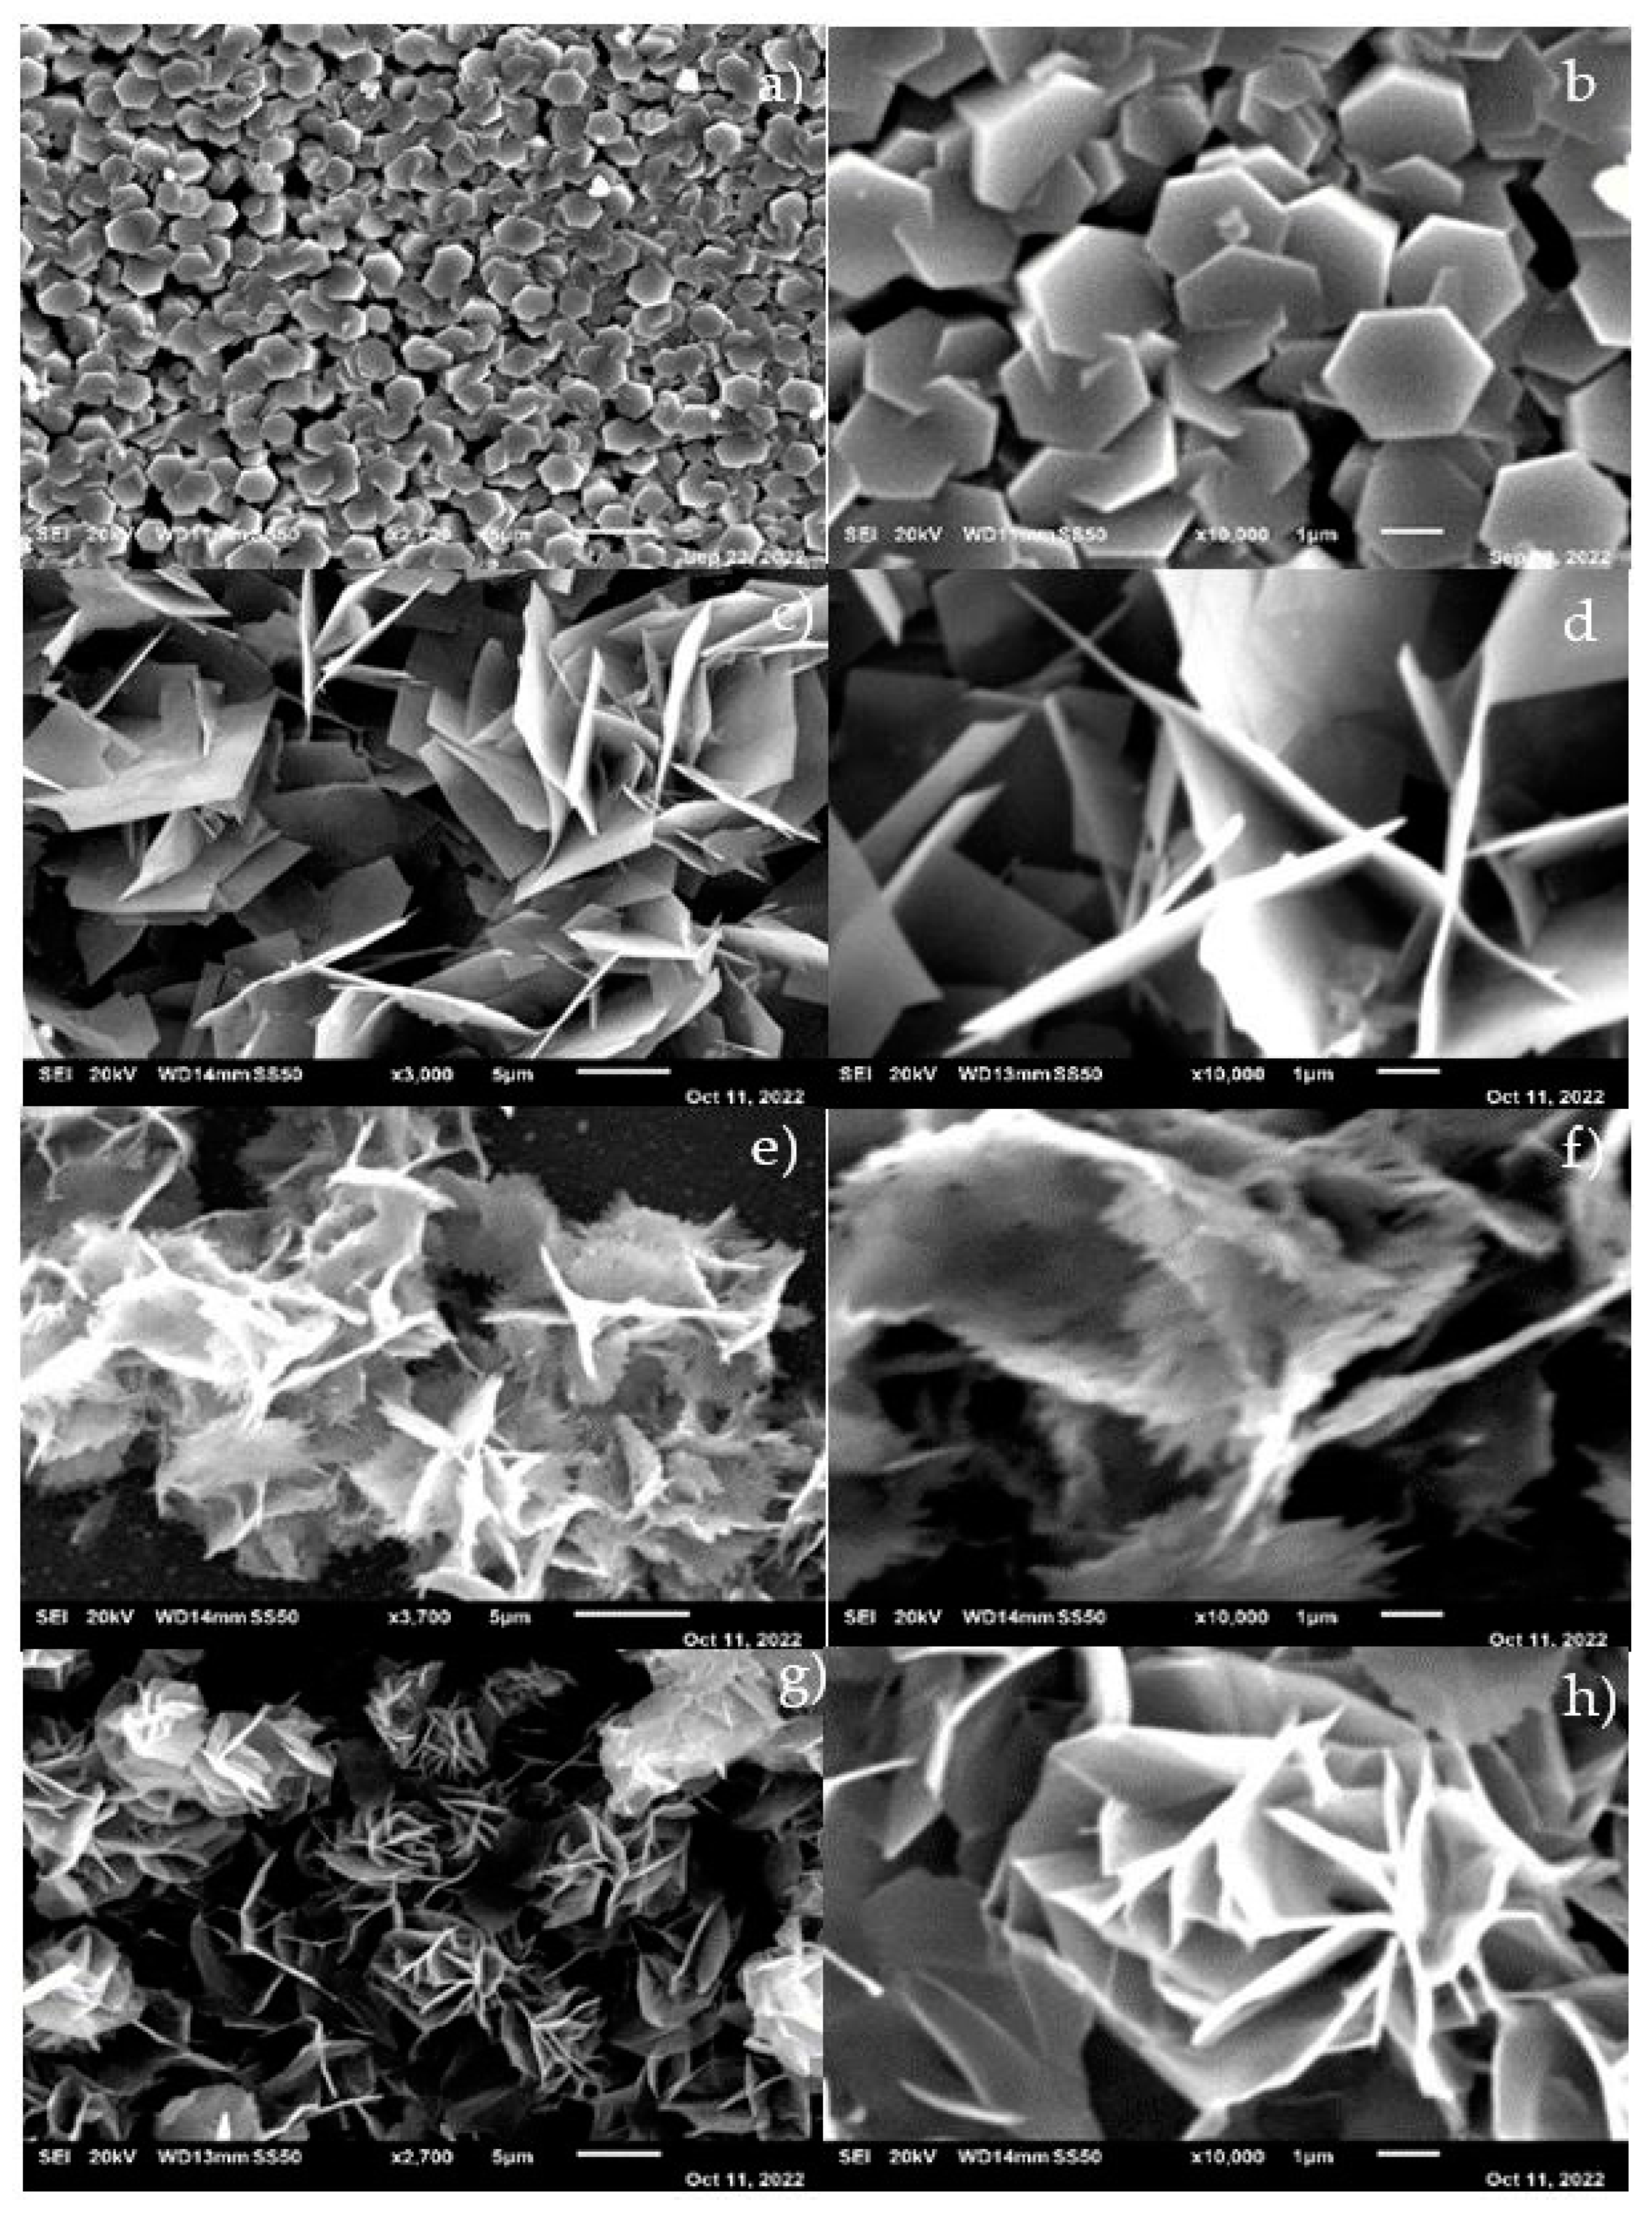
3.2. Scanning Electron Microscopy (SEM)

Figure 4 presents a morphological analysis performed on the pure and Ni-doped nanostructures with varying doping concentrations of 1%, 2%, and 3%. The images were captured at different magnifications to provide a detailed view of the samples. In all the samples, the figures reveal densely packed and uniform hexagonal particles. However, their morphologies transform into hexagonal flakes as the doping concentration increases from 1% to 3%. Notably, Figure 4c–g displays a bundle of hexagonal flakes that exhibit a clear orientation [47]. These findings are consistent with the X-ray diffraction (XRD) results and suggest that the doping and laser assistance during the growth process contributed to the morphological changes. The 3D hexagonal flakes possess a higher surface-to-volume ratio than the 1D structures of the nanoparticles, making them ideal for photonic applications due to their ability to capture additional light. Moreover, their larger surface area makes them highly effective in reducing concentrations of harmful dyes and other impurities in water purification applications. The application of Ni-doping to nanostructures has been widely studied due to its ability to give rise to favorable properties, such as enhanced electronic, magnetic, and catalytic activity. The doping of Ni in the hexagonal flakes improves their structural stability and enhances their electrocatalytic activity, which are essential characteristics in energy conversion applications [47,48,49]. The mechanism behind the nanostructure shape transition upon the addition of Ni involves the following:
ZnO nanostructures typically grow along their c-axis due to the polar nature of this crystallographic direction. As such, the formation of nanorods, which grow along this direction, is a common outcome of ZnO synthesis. However, adding Ni ions into the ZnO crystal lattice during synthesis can disrupt this growth process. Ni ions, with their higher charge density compared to Zn ions, have a greater tendency to be adsorbed onto the non-polar faces of the ZnO crystal, thus inhibiting growth along the c-axis and promoting lateral growth instead. This results in the formation of a flake-like structure, as the crystal expands to a greater degree in the lateral direction than it does along the c-axis. Additionally, the doping of Ni could result in the creation of additional nucleation sites on the surface of the ZnO crystal, thereby promoting the growth of new crystal faces and contributing to the flake-like structure. The transition from nanorods to nanoflakes upon Ni doping could also be attributed to the change in surface energy of the nanostructures. Adding Ni might reduce the surface energy of the non-polar faces of ZnO, making it easier for the nanostructures to grow in the lateral direction, which leads to the formation of nanoflakes. This shape transition could enhance the photocatalytic properties of the ZnO nanostructures by increasing their surface area and the number of active sites available for the photodegradation process. Furthermore, Ni doping can introduce new energy levels within the bandgap of ZnO, thereby enhancing its light absorption capabilities and reducing the recombination rate of electron–hole pairs, leading to improved photocatalytic performance.

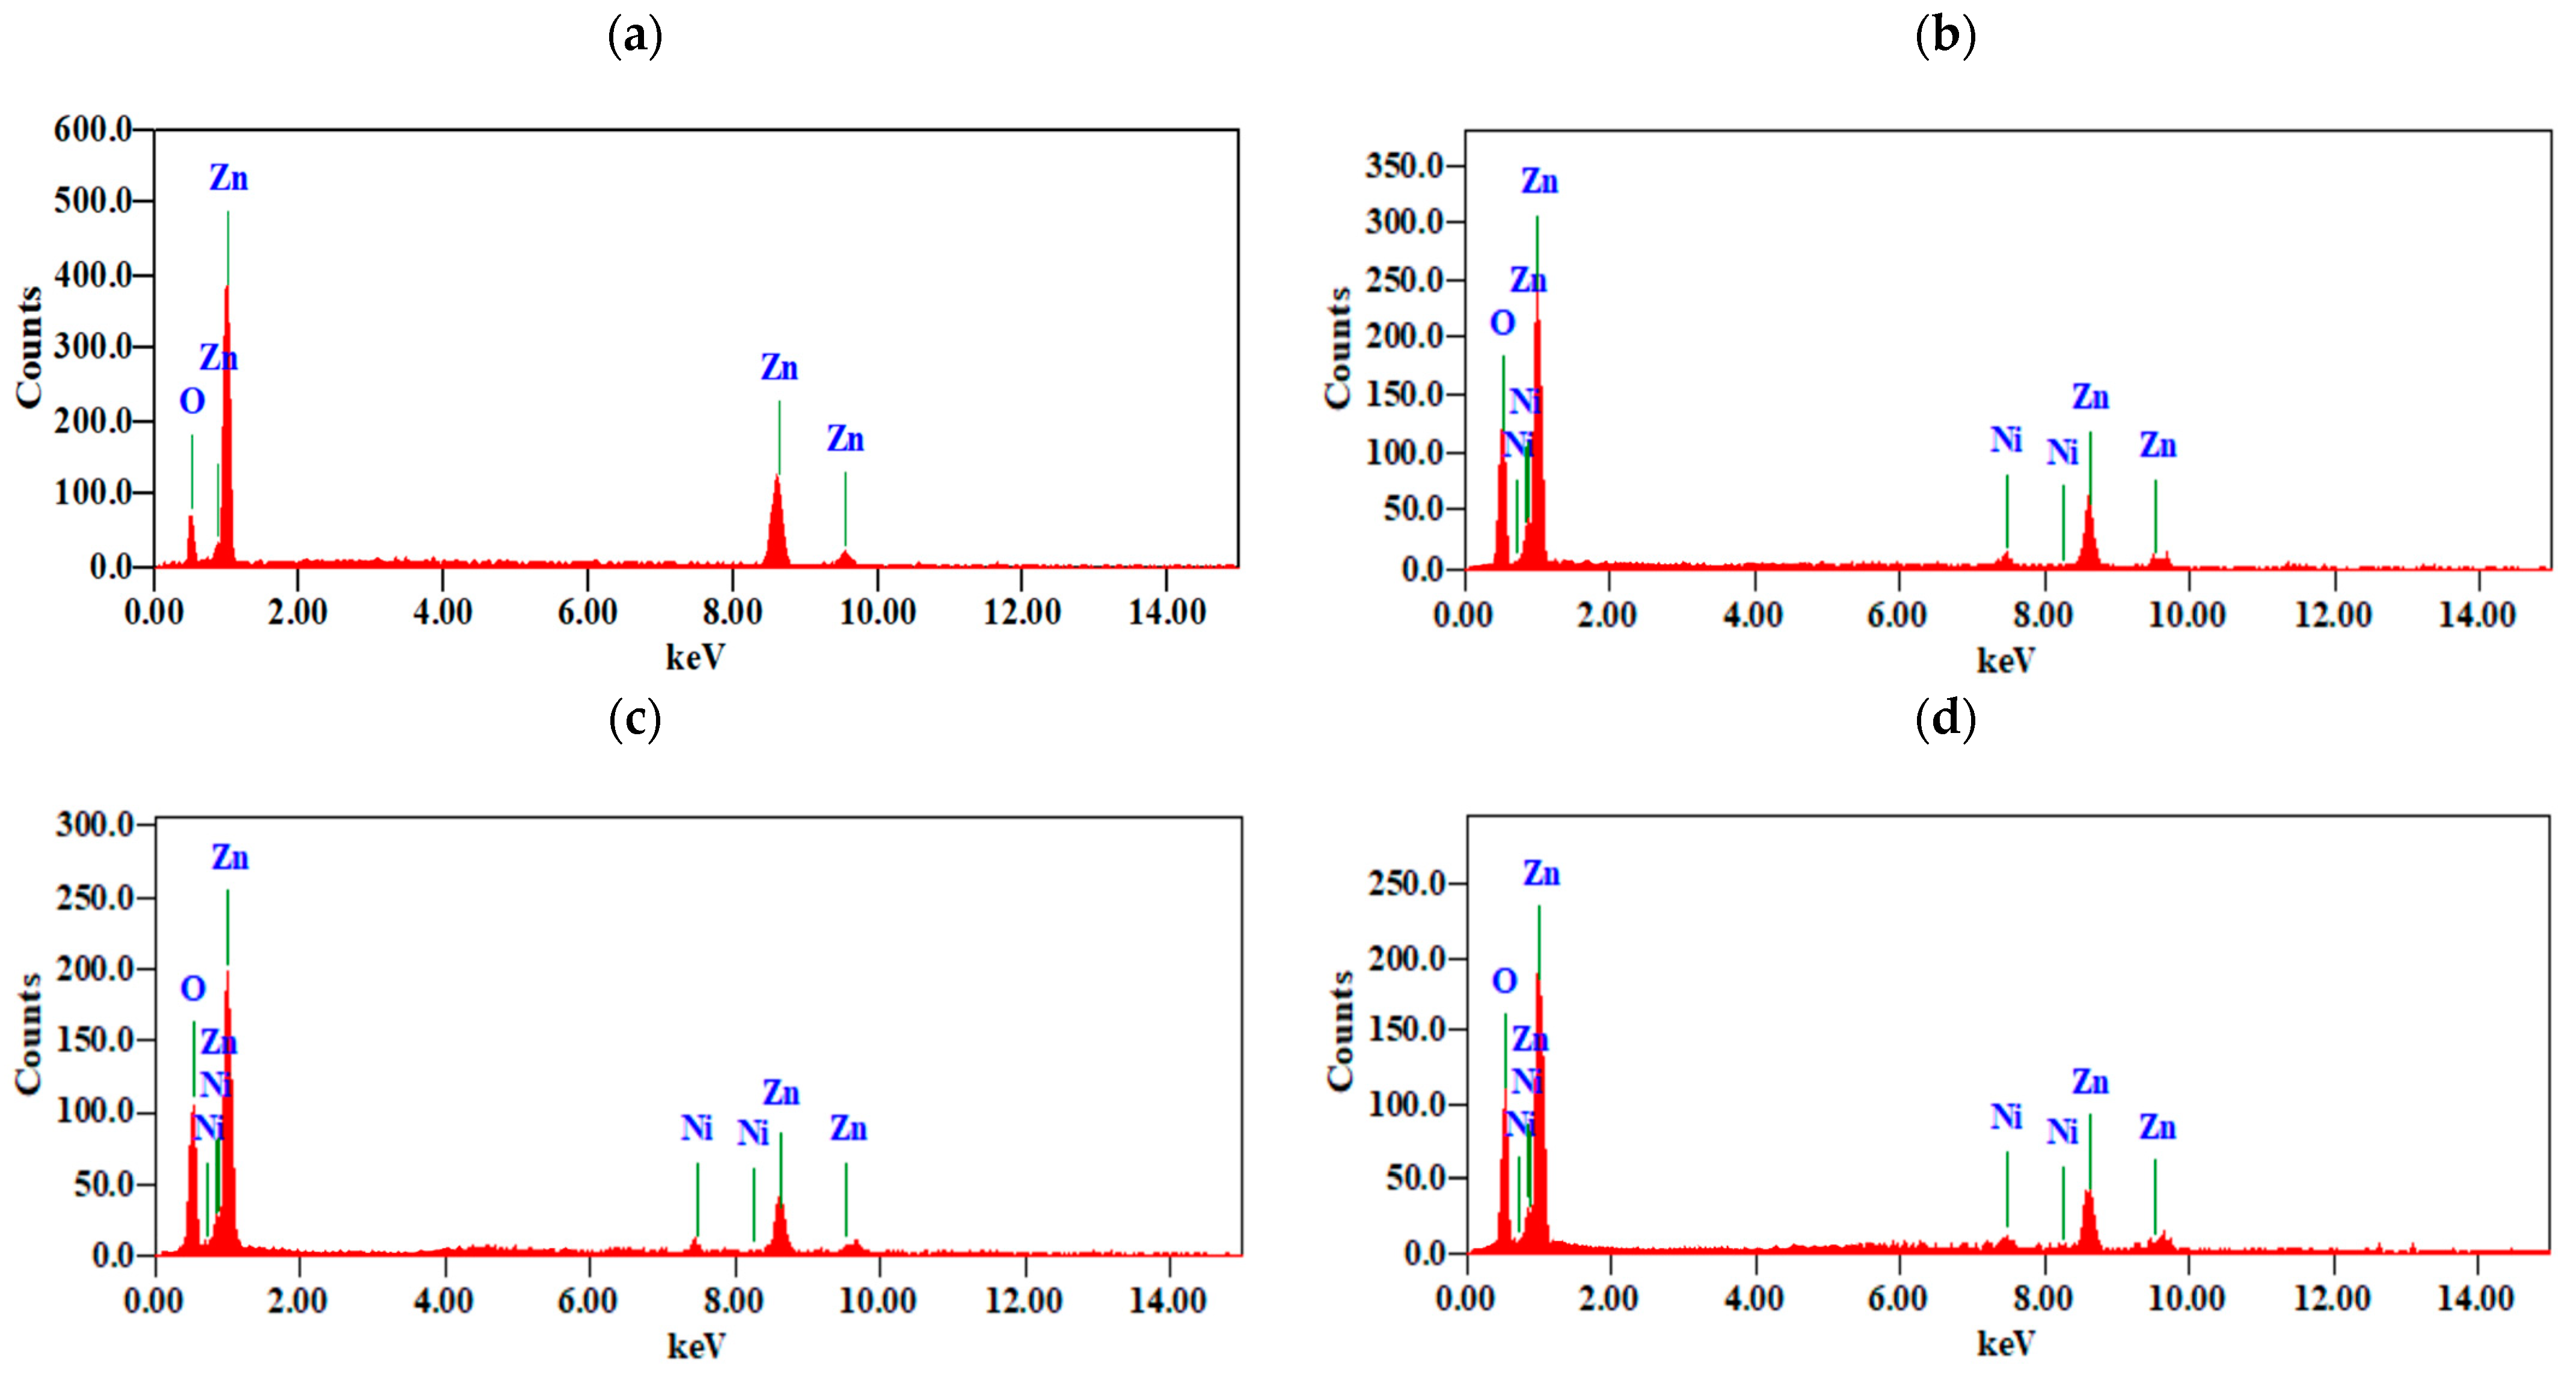
3.3. Energy Dispersive X-ray Spectroscopy (EDX)

The elemental compositions of the pure and Ni-doped (at levels of 1%, 2%, and 3%) nanostructures were analyzed using energy-dispersive X-ray spectroscopy (EDX). Figure 5 and Table 2 provide confirmation of the presence of Zn, O, and Ni in the doped samples and of Zn and O in the pure ZnO samples. In the pure ZnO samples, the Zn:O ratio is approximately 51.25% and 48.75%, respectively, indicating that there are no residual impurities. However, in the doped samples, the percentages of detected Ni are 0.84 At%, 1.99 At%, and 2.90 At% for the 1%, 2%, and 3% doped samples, respectively. The elemental profiles for both the pure and Ni-doped ZnO samples are presented in Table 3.

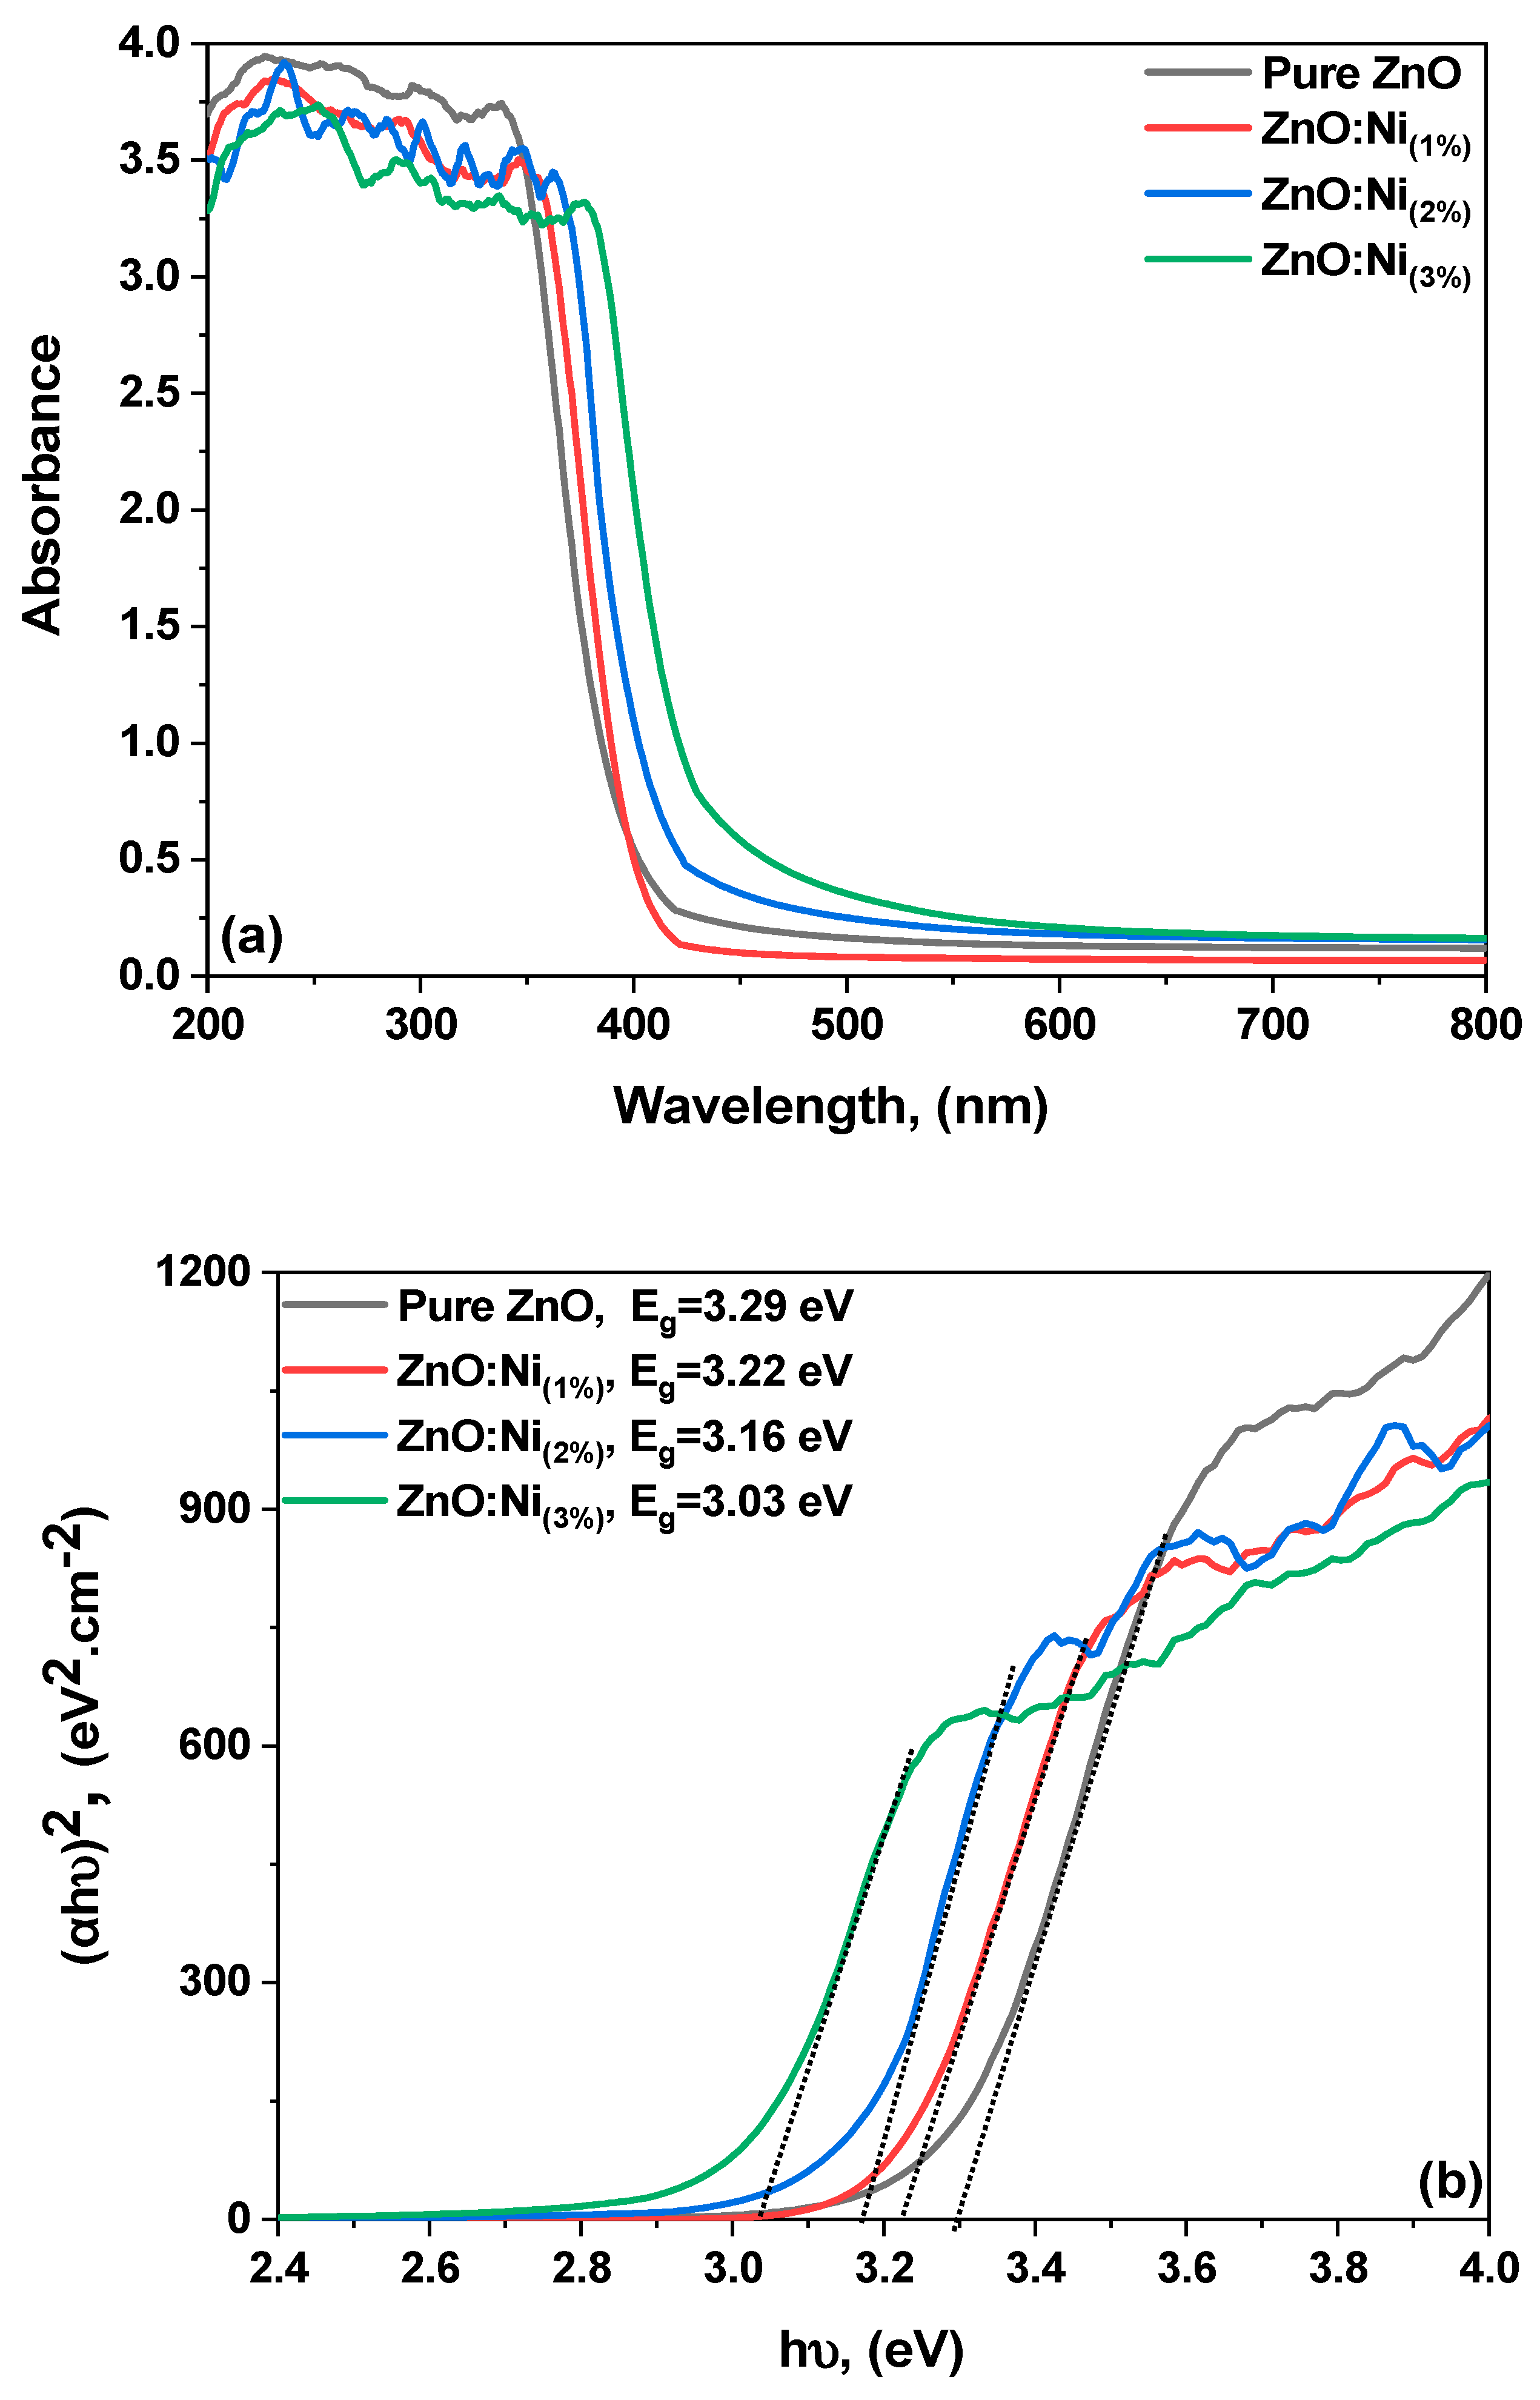
3.4. Optical Studies/UV–Vis Absorption
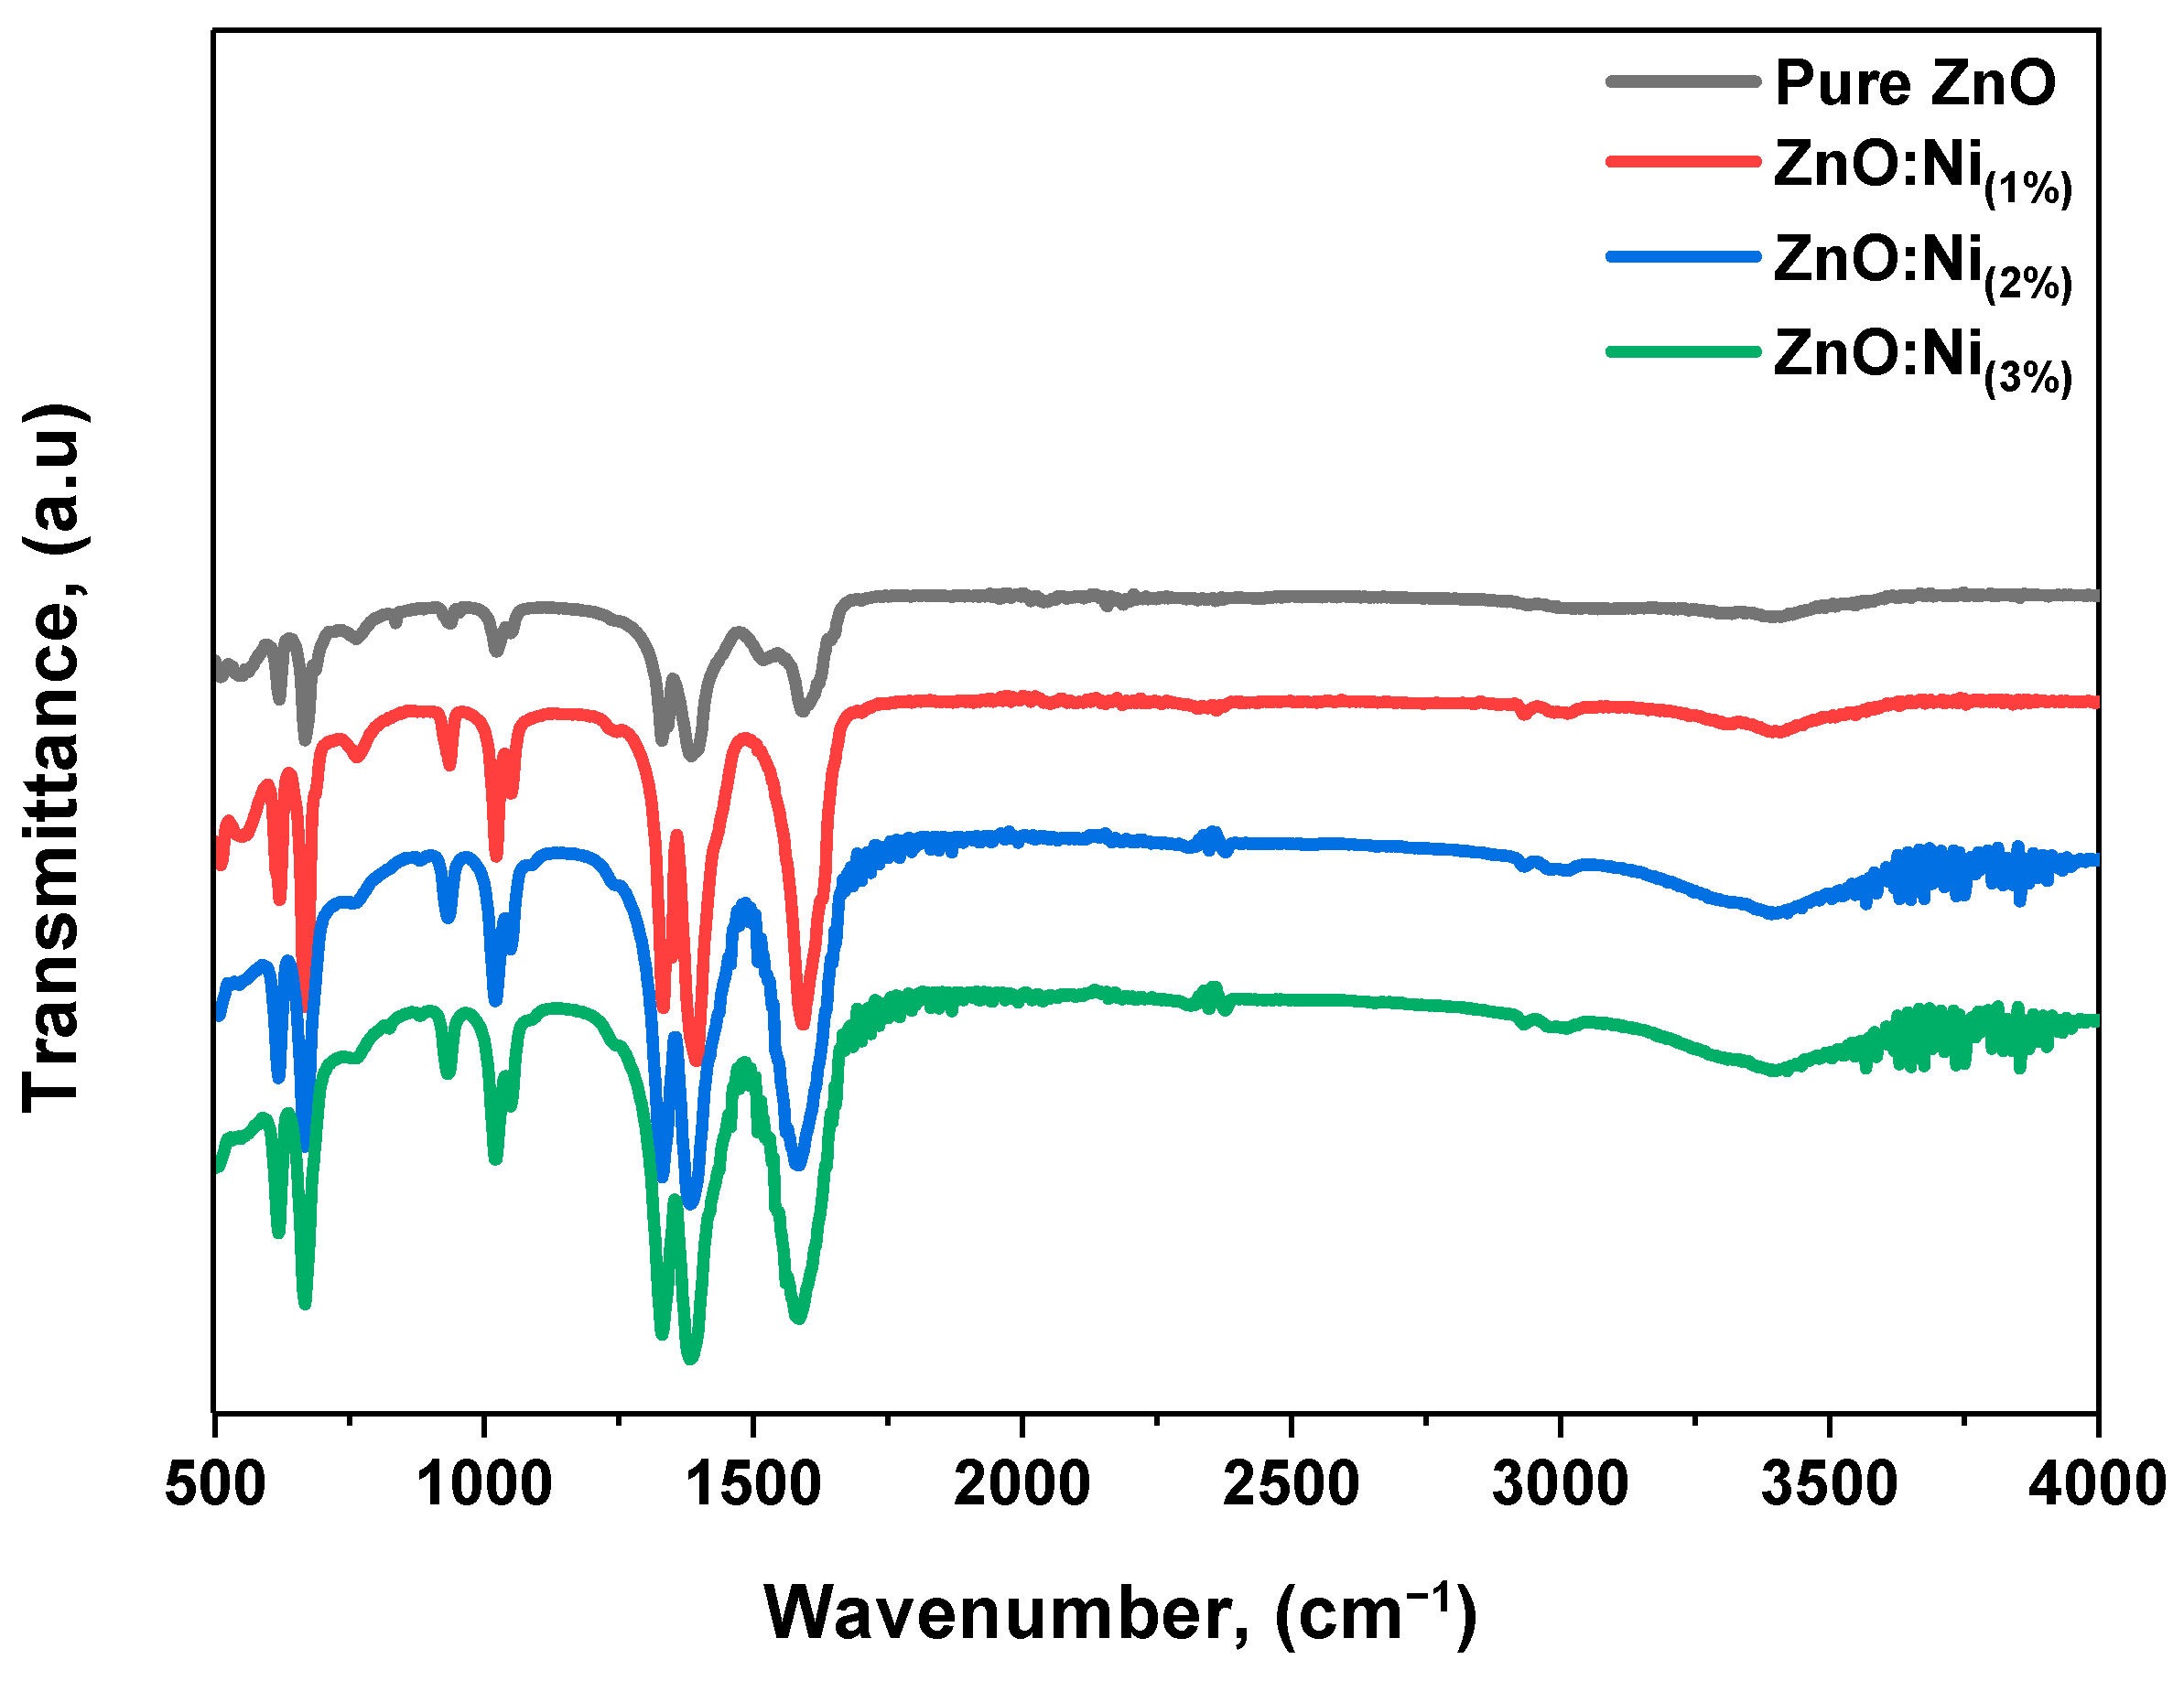
Figure 6a displays the UV–Vis absorbance spectra of the pure ZnO and Ni-doped ZnO nanostructures, with Ni-doping concentrations of 1%, 2%, and 3%, as a function of the light wavelength in the range of 200–800 nm. In the pure ZnO samples, a prominent absorption edge at 380 nm can be observed in the UV–Vis spectrum. As the Ni-doping concentration increases, the absorption edge shifts towards a higher wavelength region, leading to a redshift and a band-narrowing effect [50]. In the UV region, the absorption rate of the ZnO is relatively large, namely, in the range of 200−380 nm, while the absorption rate starts to increase in the range of 380 nm or more for the doped samples.
To elaborate, as the Ni-doping concentration increases, the material’s absorption edge, which represents the lowest energy (or longest wavelength) at which a material can absorb light, is observed to shift towards a higher wavelength region. This shift is known as a redshift because higher wavelengths correspond to the red end of the visible light spectrum. Concurrently, a ‘band-narrowing effect’ indicates that the semiconductor material’s energy gap between the valence and conduction bands is decreasing. These alterations in optical properties are due to changes in the electron structure of the ZnO induced by Ni-doping. Regarding the UV region, the rate at which ZnO is absorbed is comparatively substantial within the wavelength range of 200-400 nanometers; however, it begins to experience a reduction in its absorption capacity at wavelengths exceeding 380 nanometers. These interactions could involve phenomena such as surface plasmon resonance or localized electric field enhancements, which significantly increase a material’s optical absorption.
The 3% Ni-doped ZnO sample exhibited a wide photo absorption range in the visible spectral regions, which is advantageous for photo sensor applications as it produces more charge carriers. The optical bandgap of the samples was determined using Tauc’s equation, which is used to calculate the energy difference between the lowest unoccupied molecular orbital (LUMO) and the highest occupied molecular orbital (HOMO). Ni doping had a significant effect on the optical properties of the ZnO nanostructures. It modified the electronic band structure and created new energy states in the bandgap, thereby changing the nanostructures’ optical properties. The redshift in the absorption edge can be attributed to the substitutional doping of Ni ions in the ZnO lattice and the resulting decrease in the lattice constant. The narrowing of the bandgap is due to the formation of Ni-related defect states in the bandgap [51]
(αhυ)1/n = B(hυ − Eg),
where hυ is the incident photon energy; h is the Planck constant; α stands for the absorption coefficient; B is a constant known as the Tauc parameter, which holds crucial information about the material structure; Eg stands for the optical energy bandgap; and n varies depending on the type of electron transition, i.e., equaling 1/2 or 3/2 for direct transitions and 2 or 3 for indirect transitions [52]. The (αhυ)2 versus photon energy (hυ) plots for all the prepared pure and Ni-doped ZnO samples are displayed in Figure 6b. The band gap values for the present samples were calculated by extrapolating the linear fit from the slope to the photon energy axis. The band gap value of the pure ZnO nanostructures was 3.3 eV, which aligns with the reported data [53]. The Ni-doped ZnO samples with concentrations of 1%, 2%, and 3% have bandgaps (Eg) of 3.22, 3.16, and 3.03 eV, respectively. As the dopant ratio is increased, the bandgap values decrease. The presence of oxygen vacancies, which facilitate the easy transfer of electrons from the valence band (VB) to the conduction band (CB), is responsible for causing the bandgap to decrease [54]. In other words, the impurity states of ZnO become more delocalized and overlap with the valance band edge as the number of oxygen vacancies increases, thus narrowing the overall band gap.

3.5. FTIR Studies

The wurtzite structures of the pure and Ni-doped ZnO nanostructures were investigated using Fourier transform infrared (FTIR) spectroscopy. The analysis was carried out in the range of 500 cm−1 to 4000 cm−1, and the spectra for the pure and doped samples are illustrated in Figure 7. The M-O stretching mode, which is associated with the functional groups, was assigned to the spectral region between 500 and 600 cm−1. Furthermore, the peaks at around 500 cm−1 were attributed to the E2 (L.O.) mode, which is typical of ZnO’s wurtzite structure [55]. The asymmetric and symmetric stretching vibration modes of C=O were observed in the range of 1300 cm−1 to 1600 cm−1 [53]. The peak at 1500 cm−1 was also ascribed to the stretching modes of vibrations in symmetric and asymmetric C=O bonds and Zn(OH)2 bending vibrations. The weak band observed near 800 cm−1 was attributed to the metal–oxygen vibration frequency and the result of changes in the microstructural characteristics induced by adding Ni to the Zn-O lattice [53]. Furthermore, the Ni-doping level varied from 1% to 3%, which may have affected the vibrational modes of the samples.

3.6. Photocatalytic Study

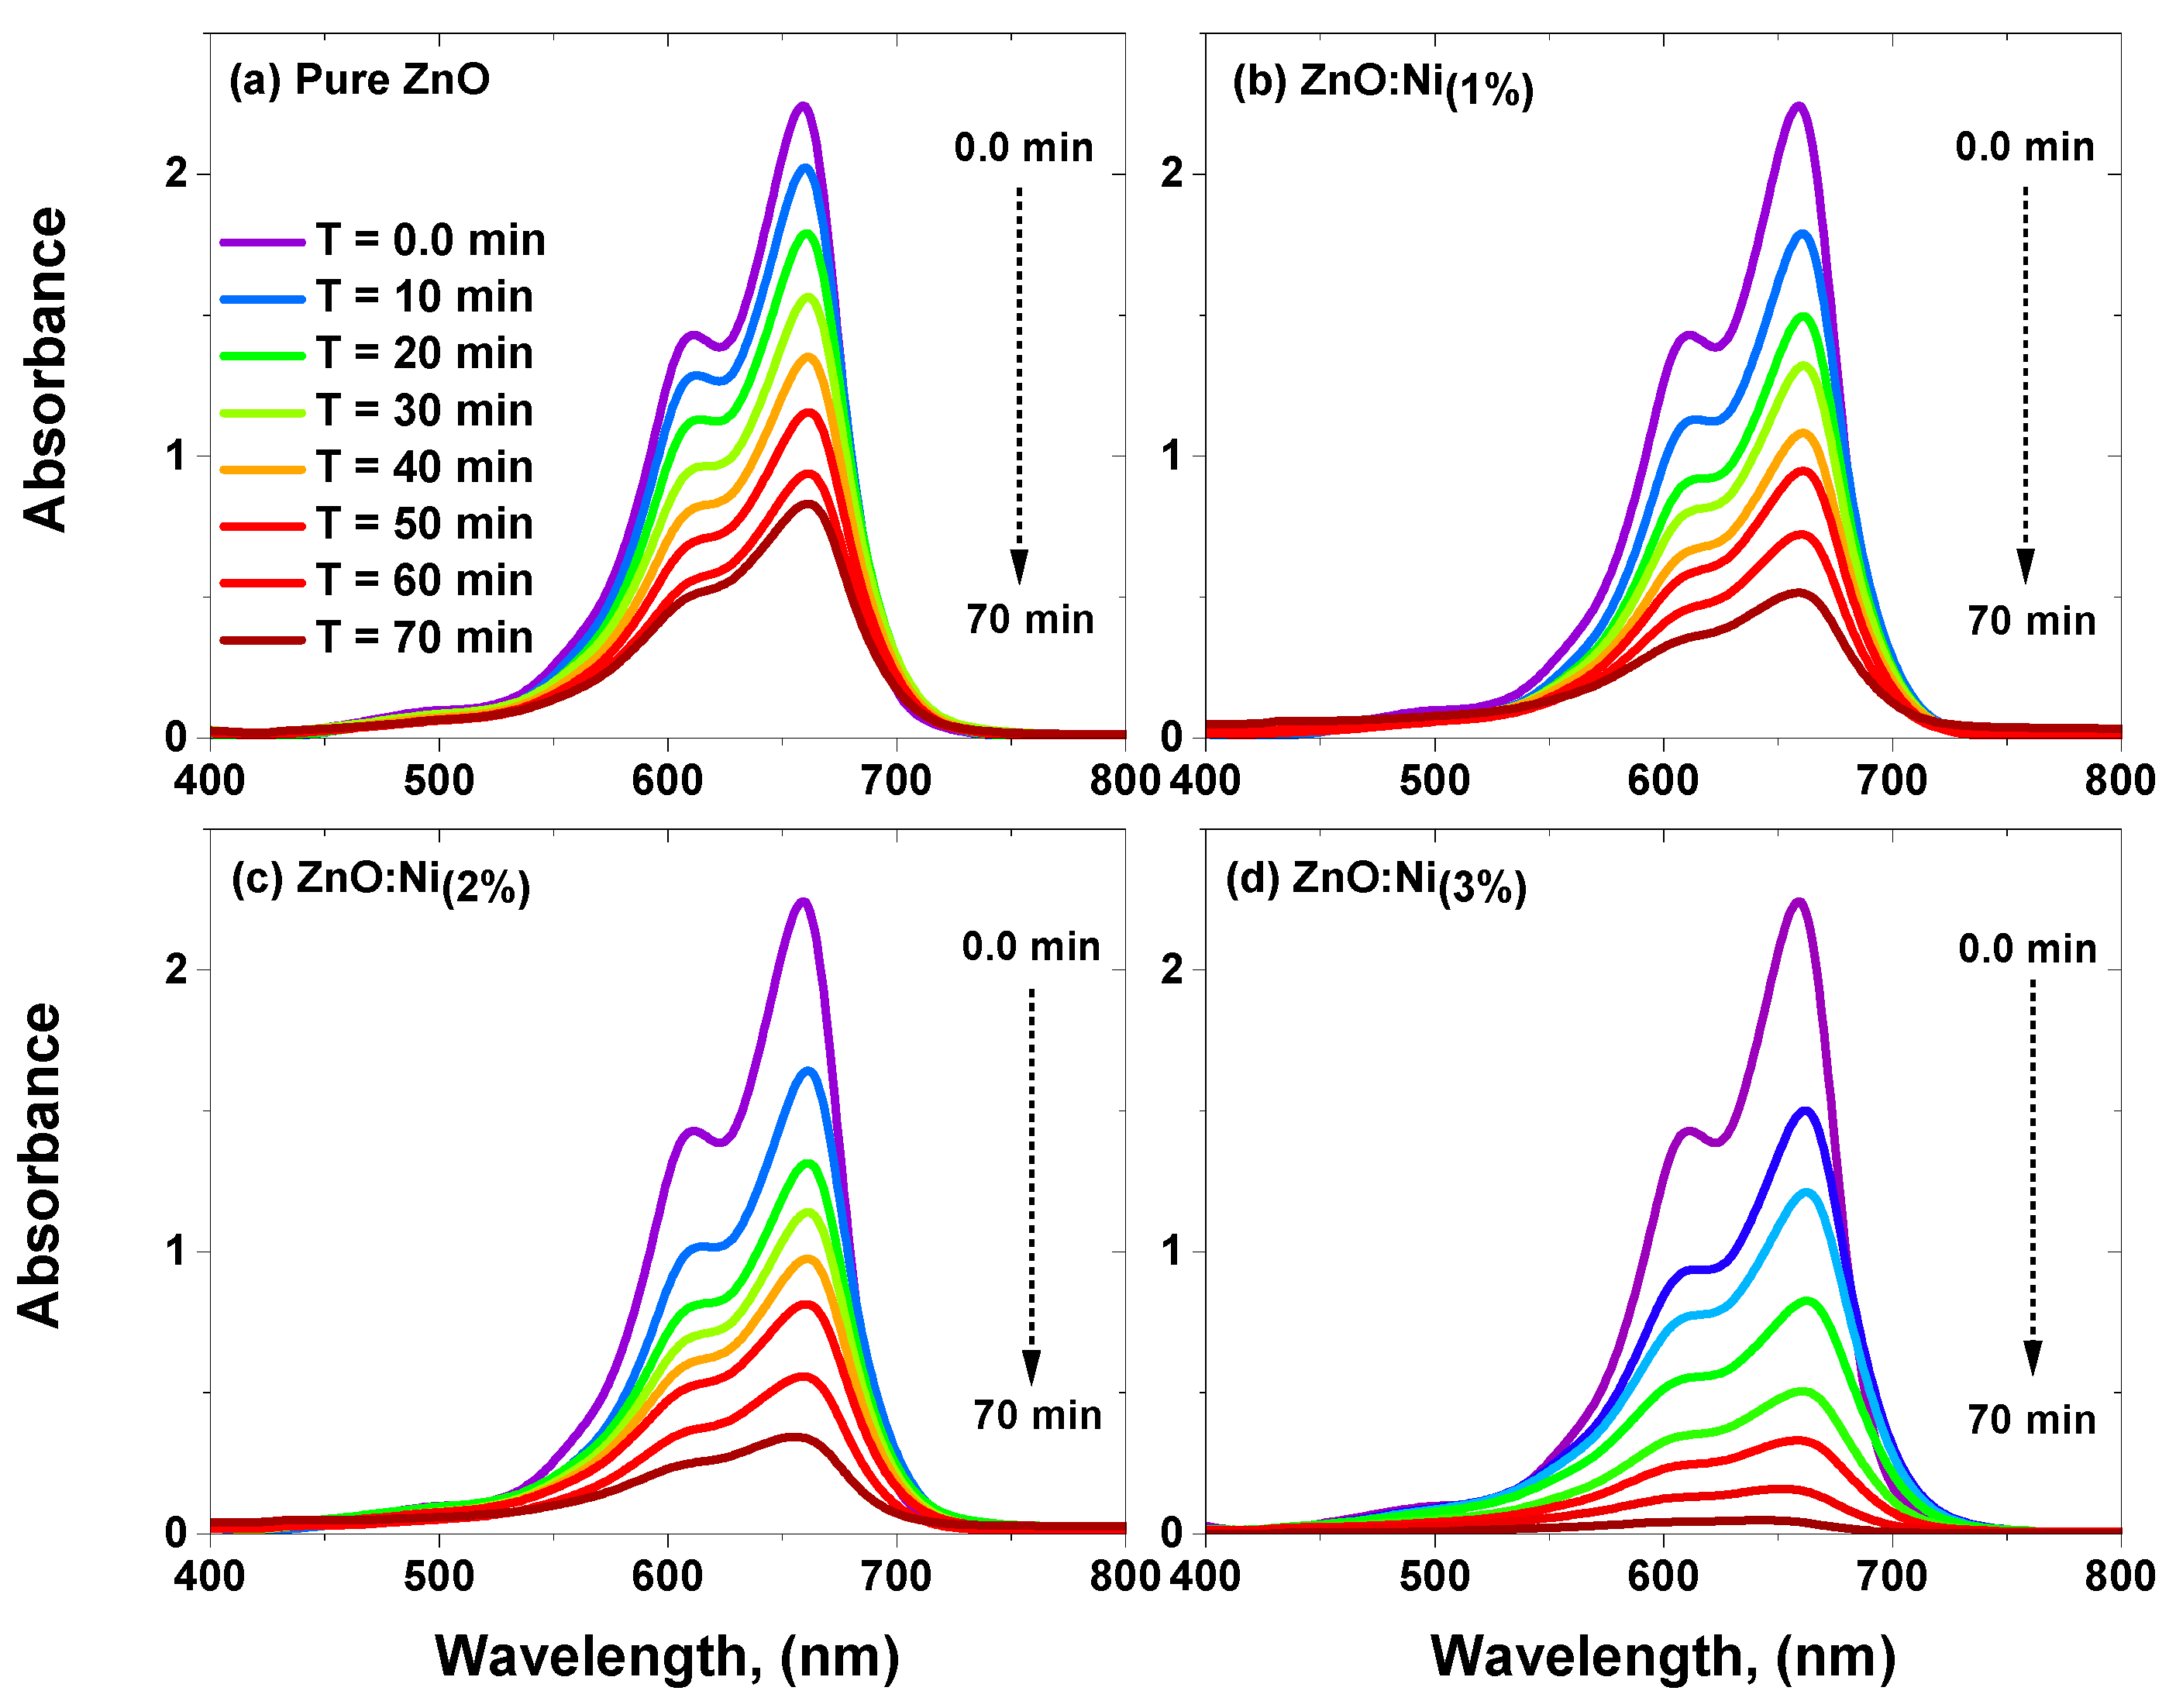
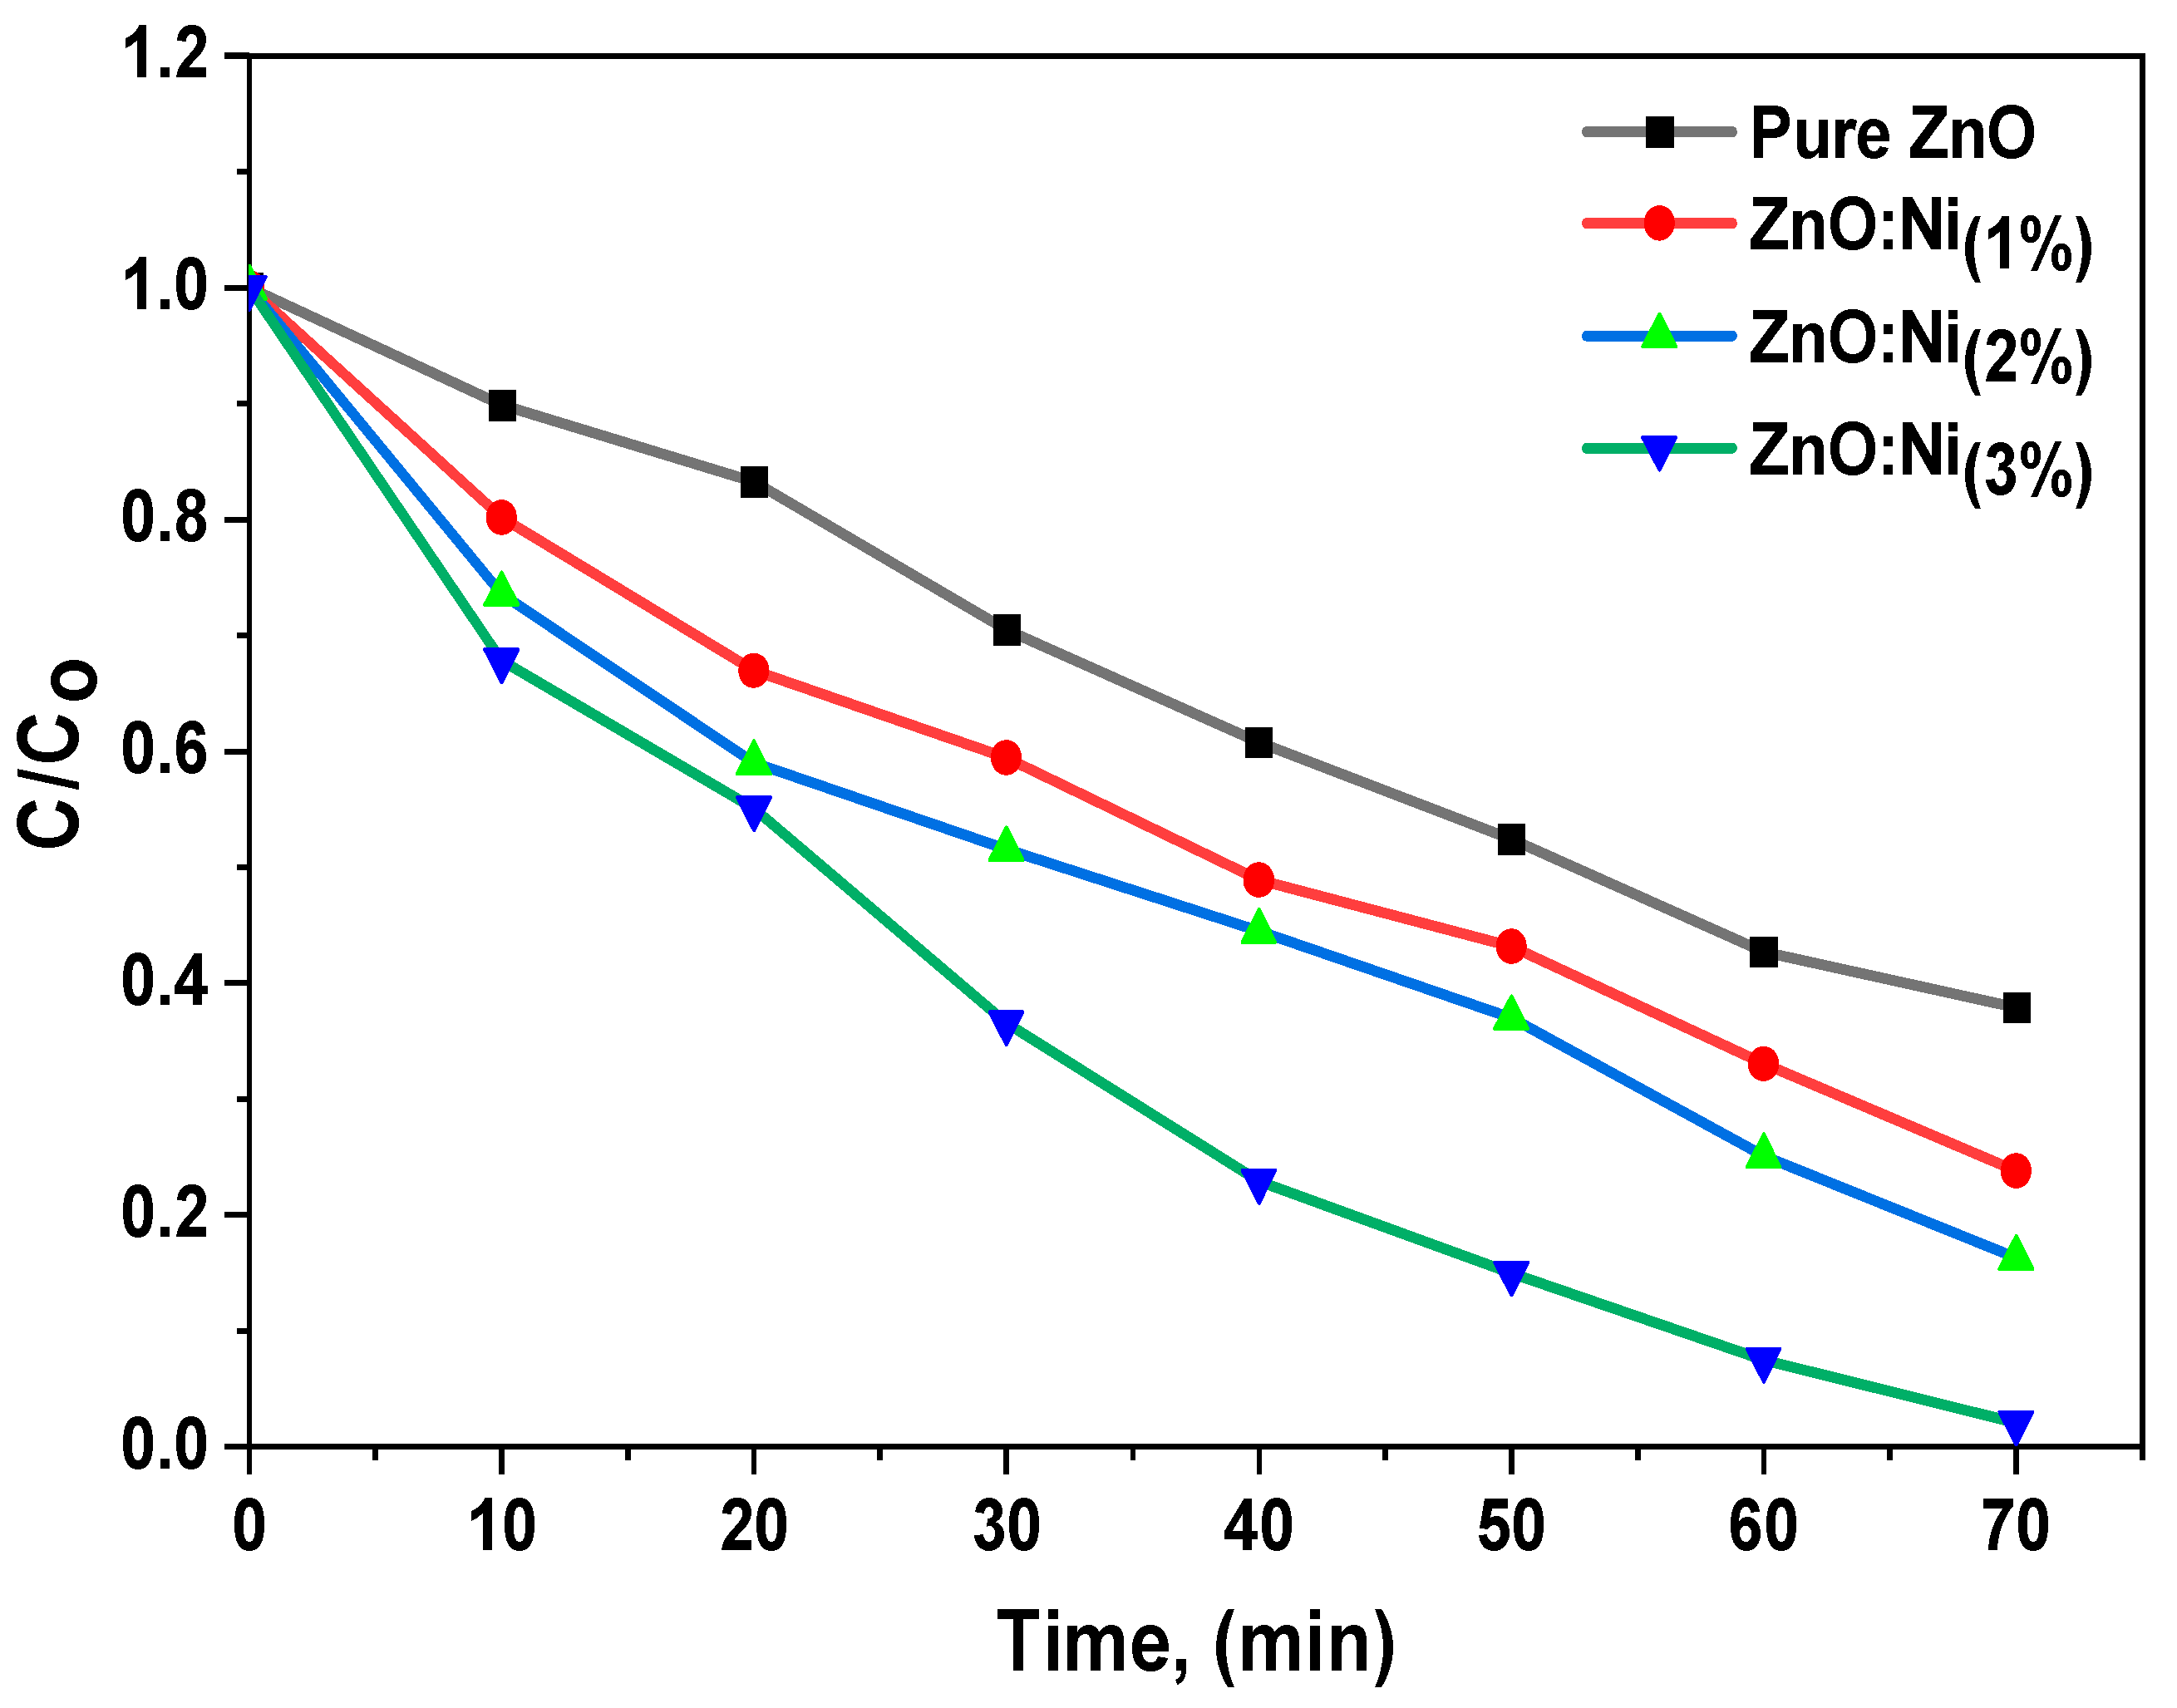
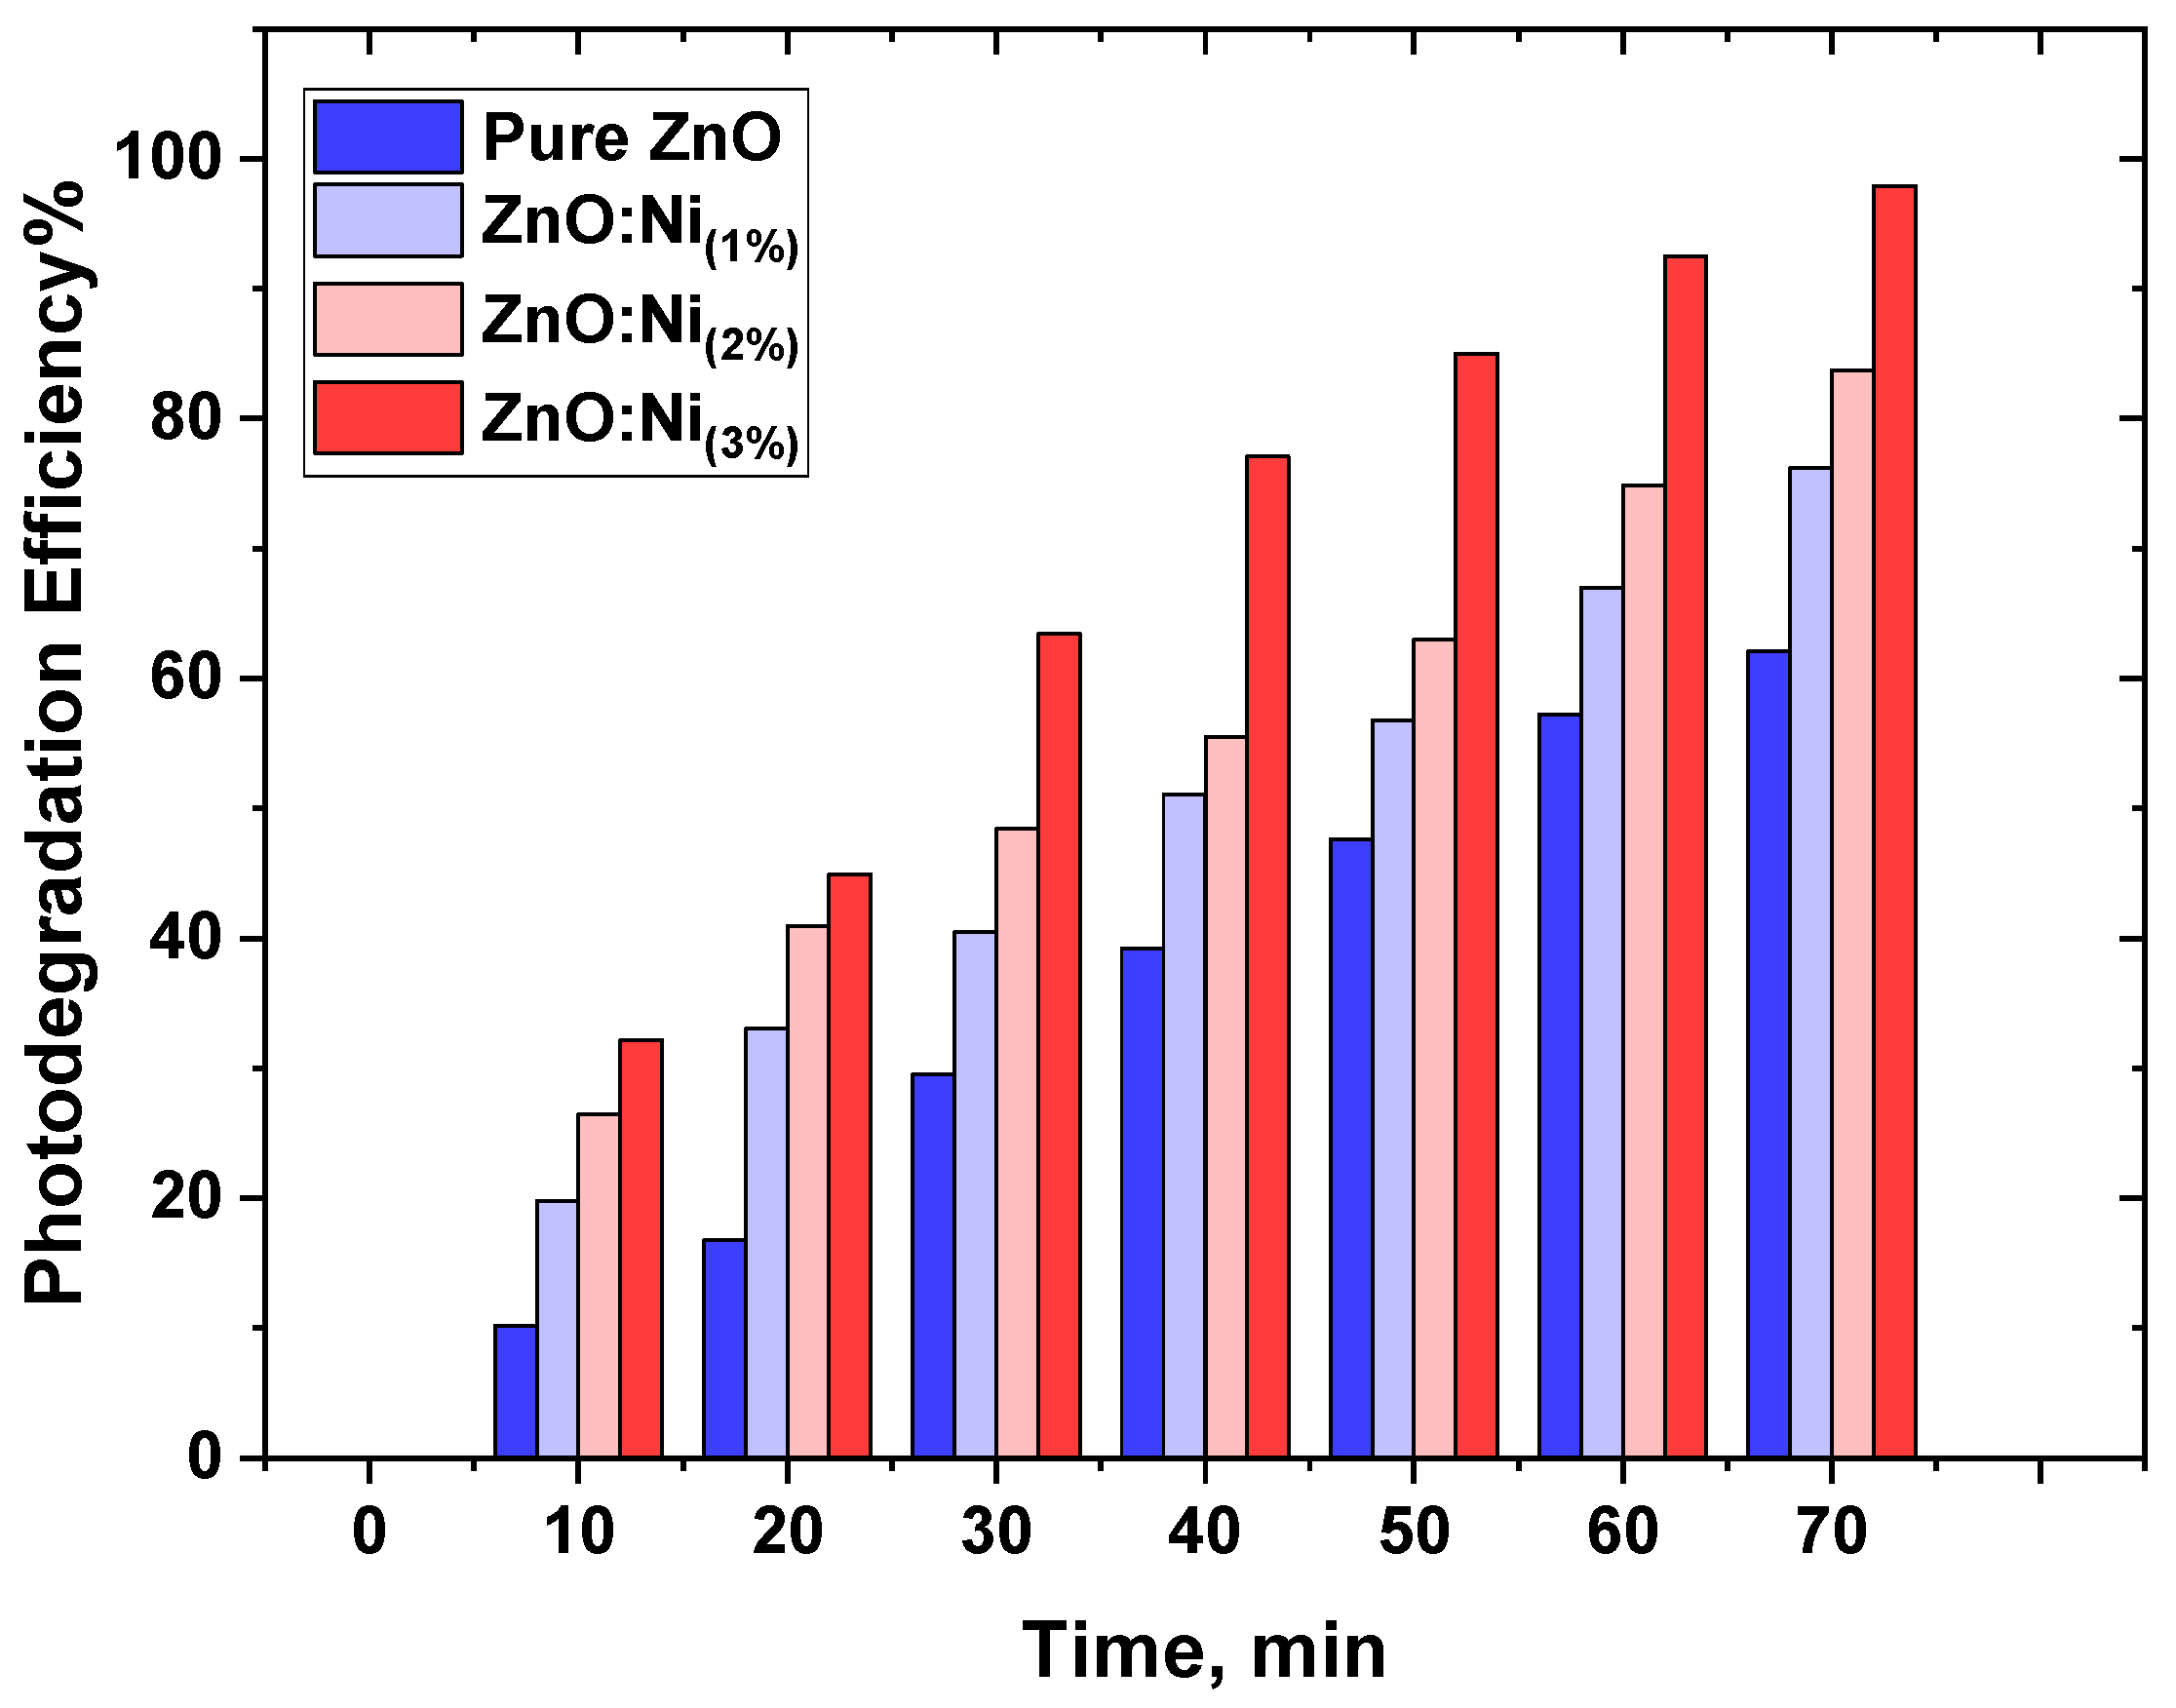
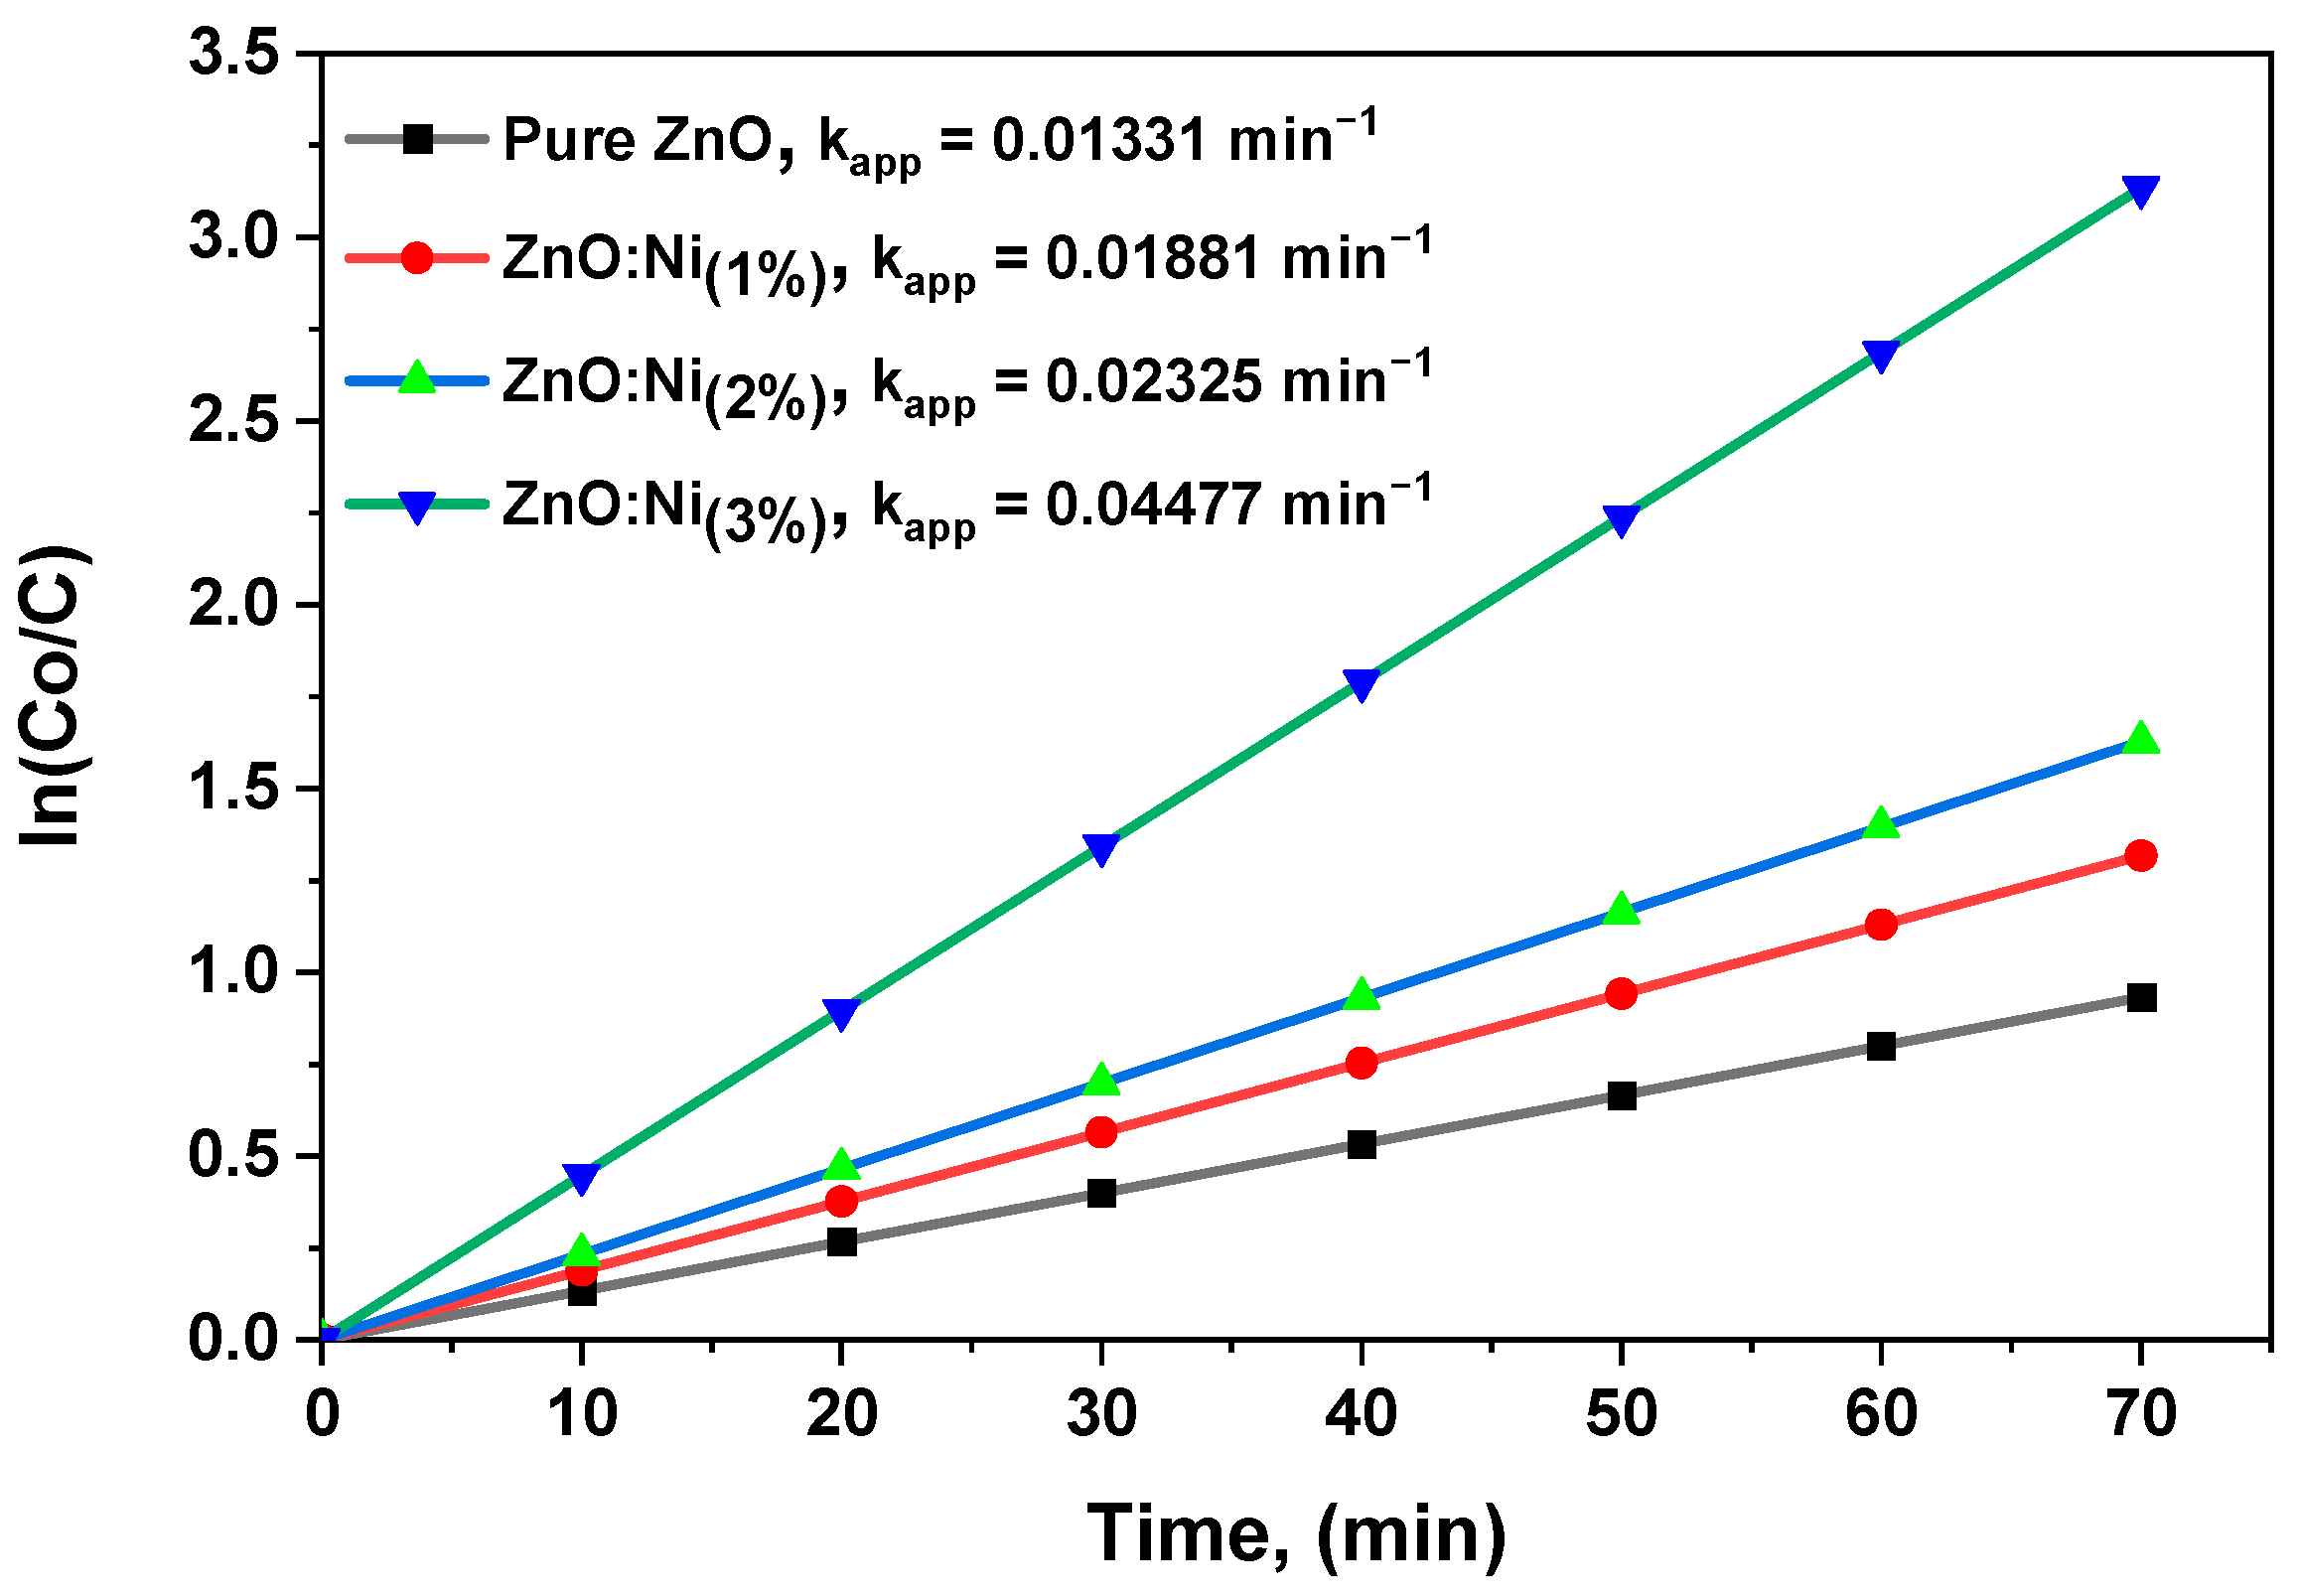
3.6.1. Photocatalytic Degradation Studies

In this study, the photocatalytic activity of both the pure and Ni-doped zinc oxide samples during the degradation process of MB dye was comprehensively investigated. The absorption spectra of the samples were analyzed before and after exposure to a blue laser, which had a wavelength of 444.4 nm, a light power of 7 watts, and an area of irradiation of 44.18 c m 2 . This wavelength falls within the visible light range. It is close to the absorption edge of ZnO, making it an ideal choice for the excitation of the photocatalyst and the enhancement of the photocatalytic process. However, the photocatalytic activity of pure ZnO is limited due to its wide bandgap and fast recombination of photogenerated electron–hole pairs. Doping ZnO with metal ions such as Ni- can improve its photocatalytic activity by narrowing its bandgap and reducing the recombination rate of electron–hole pairs. To assess the photocatalytic activity of the pristine and Ni-doped ZnO samples, the absorption spectra of the samples were analyzed before and after exposure to a blue laser. The results of the absorption spectra analyses are presented in Figure 8a–d. The absorption spectra analyses revealed that Ni-doped ZnO exhibited higher photocatalytic activity in the degradation process of MB dye than pristine ZnO. This was attributed to improved charge separation and the reduced recombination rate of electron–hole pairs in the Ni-doped ZnO.
The decrease in the absorption spectra of MB over time indicates significant photocatalytic activity, which is a result of the creation of hydroxyl radicals due to electron pair migration to the surface. Adding Ni to ZnO catalysts with reduced band gaps improved the efficacy of decomposing organic dyes. This improvement is due to the increased surface area, oxygen vacancies, and the generation and spatial separation of electron–hole pairs. The researchers employed the photocatalytic kinetics method to accurately measure the dye degradation rate. Figure 9 displays the change in the ratio of the dye concentration ( C ) to its initial concentration ( C o ) over time. By tracking this ratio, the researchers could determine the rate at which the dye decomposes.
The degradation of MB through photodegradation was initiated by a blue laser. This implies that the degradation rate depends on the concentration of MB present, as depicted in Figure 10.
Figure 11 depicts a clear and direct correlation between the natural logarithm of the MB concentration ratio and time. The graph presents the initial MB concentration and the concentration at a specific time, thus providing valuable insights into the kinetics of the photocatalytic reaction. To calculate the rate constants of the photocatalytic reactions, Equation (2) was utilized to determine the slopes of the linear plots. A higher rate constant implies more efficient photocatalytic degradation. Certain structures, such as one-dimensional nanostructures, exhibit increased electron transfer rates, leading to superior photocatalytic performance due to their exceptional ability to promote electron mobility. Furthermore, several factors, including surface imperfections, surface area, and surface reactivity, can impact the effectiveness of photocatalysts. To enhance the photocatalytic characteristics of ZnO and Ni-doped ZnO, additional dopants can be incorporated, or the synthesis process can be modified. These adjustments can further augment the photocatalytic performance of the catalysts and ultimately improve the efficiency of the reaction.
Table 4 provides valuable rate constant data that can be used to evaluate the photocatalytic performance of both undoped and Ni-incorporating ZnO in terms of MB degradation. The results indicate that among the different samples examined, 3% Ni-doped zinc oxide exhibited the most effective level of MB degradation. These findings suggest that the newly developed pure and Ni-doped ZnO photocatalysts have improved efficiency compared to earlier versions. Notably, this study underscores the need for further research into using ZnO and Ni-doped ZnO nano-photocatalysts for organic dye oxidation. Despite their demonstrated effectiveness, these materials remain understudied, and a considerable knowledge gap needs to be addressed. Future studies could focus on exploring the mechanisms underlying the improved performance of Ni-doped ZnO, optimizing the preparation methods, and assessing the photocatalytic activity of these materials for other organic pollutants.

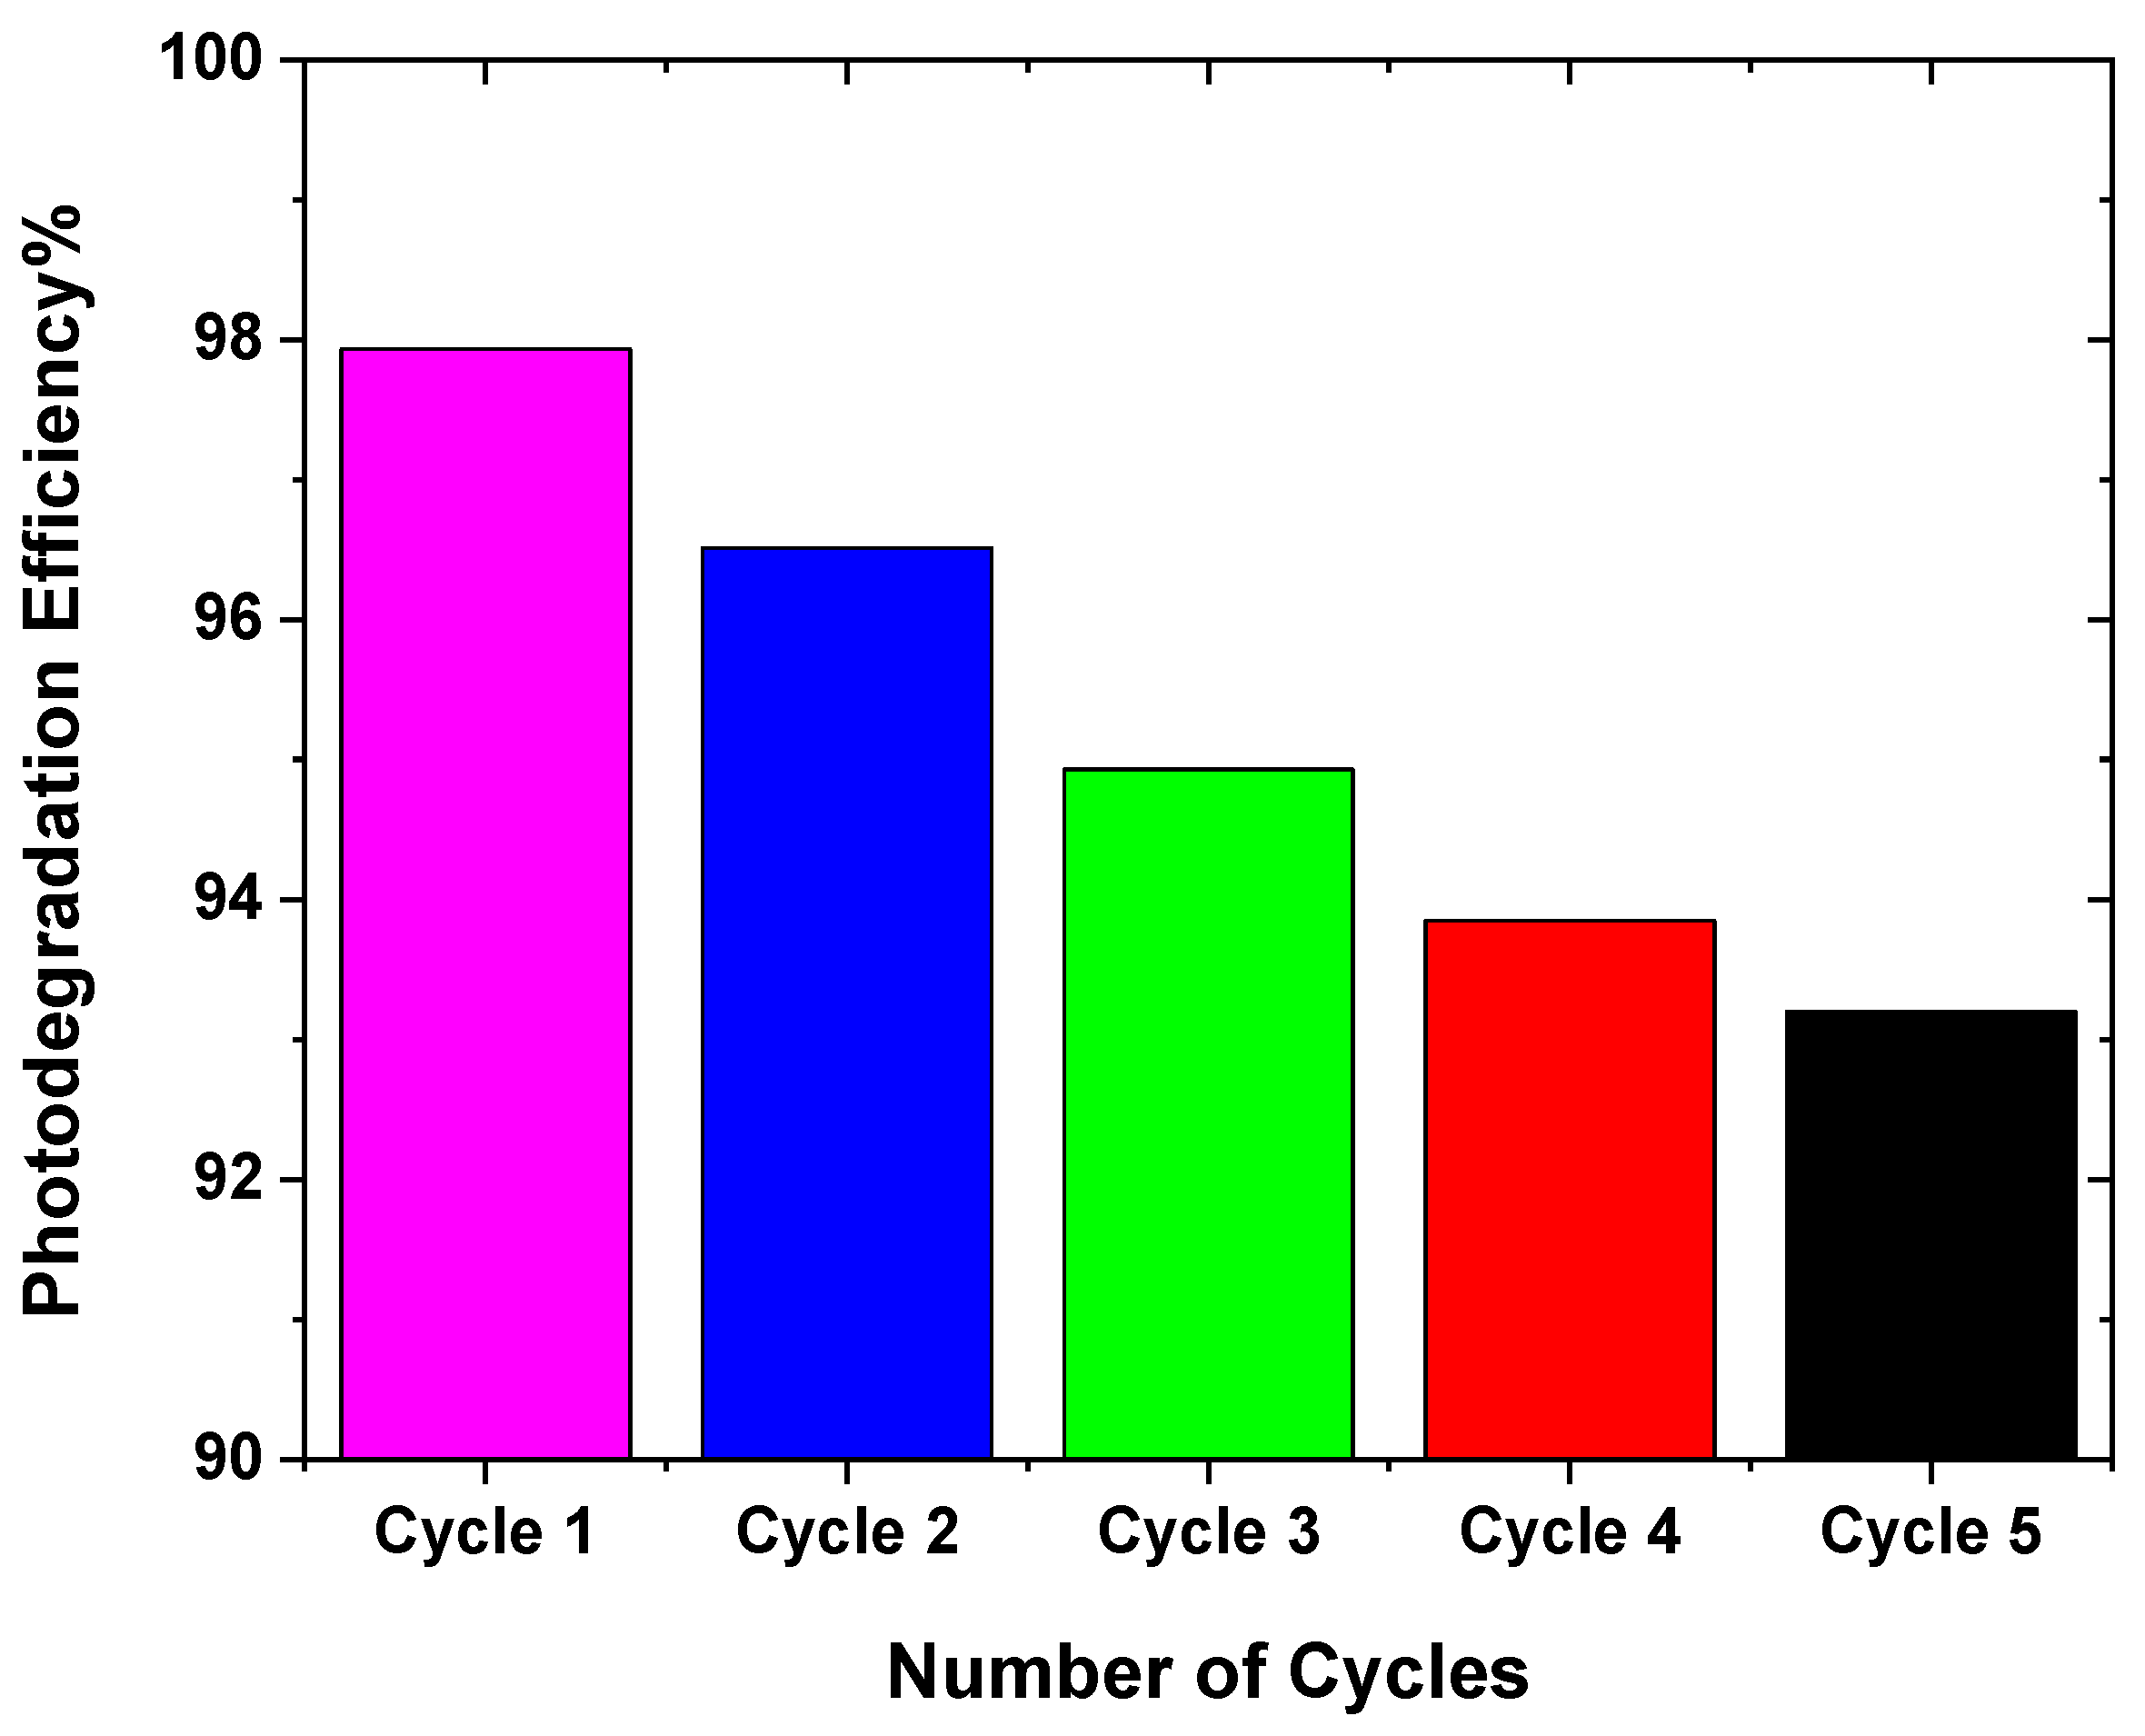
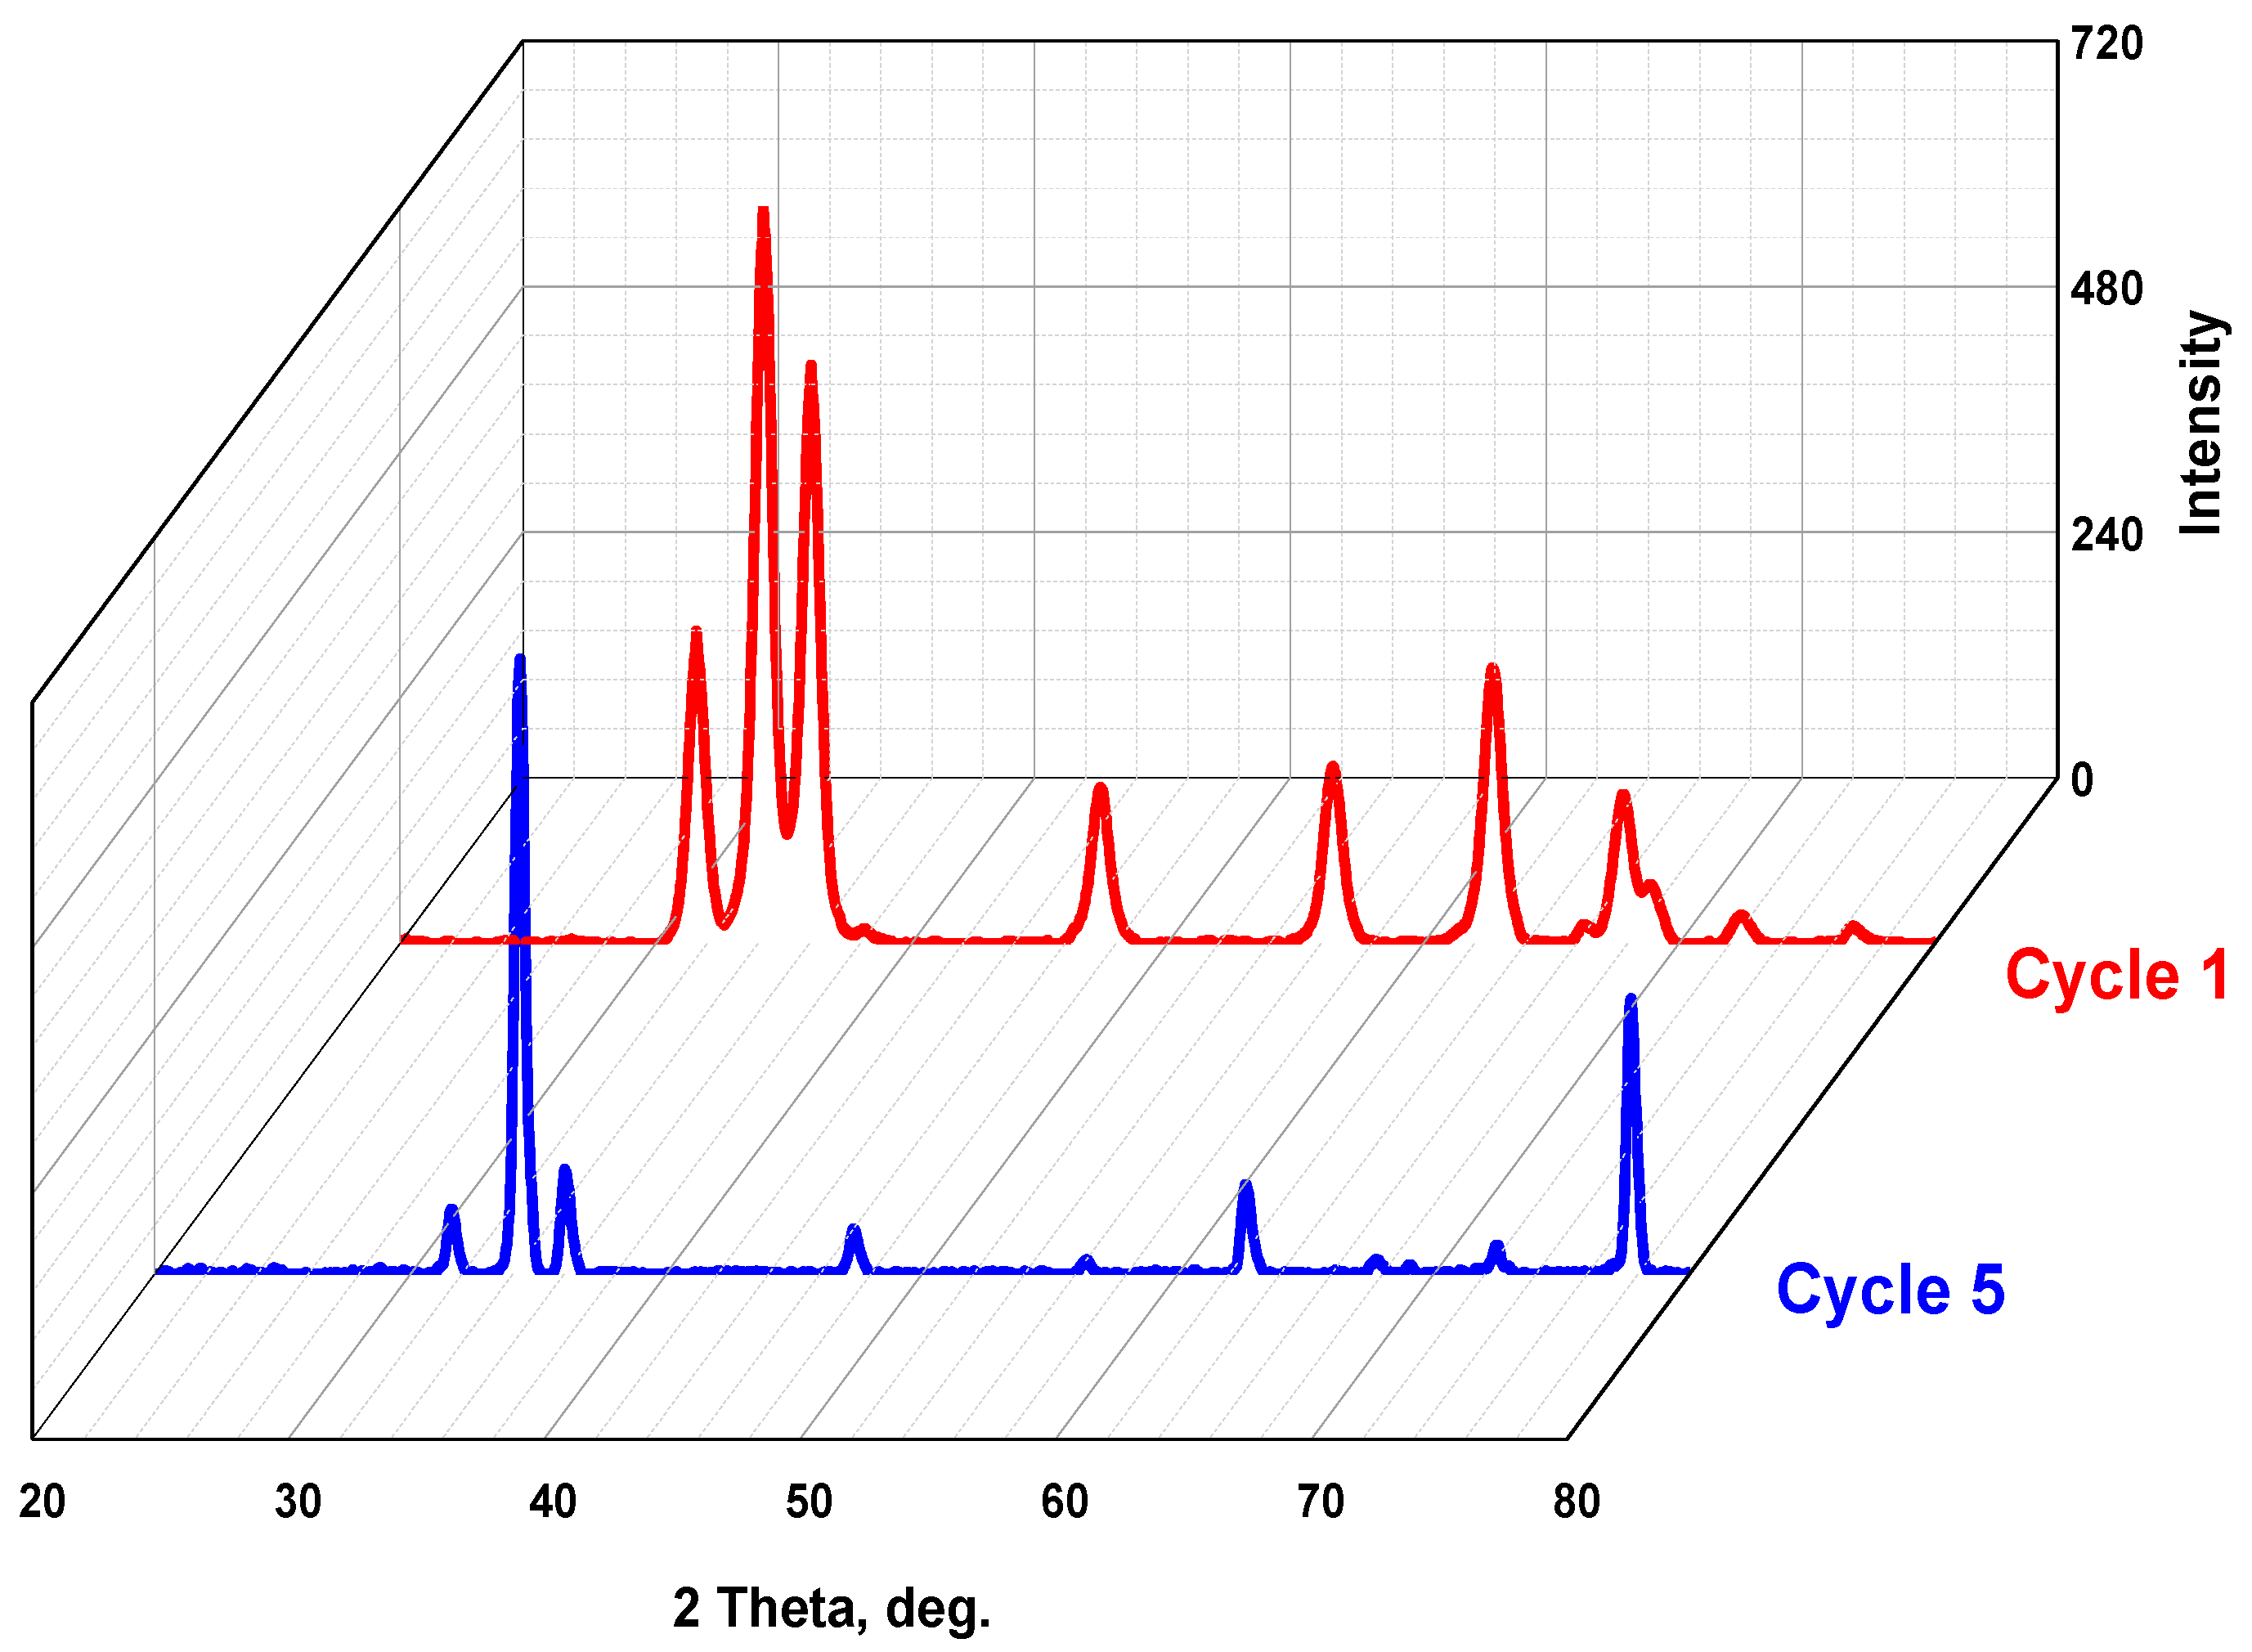
3.6.2. Photocatalytic Stability

The efficacy of photodegradation in decomposing dyes was investigated using Equation (2), and the results are presented graphically in Figure 12. The dye mixture’s adsorption values upon exposure to blue laser illumination for five cycles, with agitation applied for 60 min, were noted. It was observed that the ZnO:Ni(3%) photocatalyst exhibited consistent and robust performance, maintaining approximately 93.2% photodegradation after five consecutive cycles. The material’s potential application in water purification processes was sparked by this observation. Additionally, it was noted that the photocatalyst retained its activity after multiple cycles, which is a critical consideration for practical utilization in wastewater treatment.
Interestingly, as shown in Table 5, the XRD pattern of the catalyst specimen (ZnO:Ni(3%)) exhibits no signs of degradation or phase inconsistency, even after being subjected to five cycles, as shown in Figure 13. The lattice parameters have very slight changes after five cycles of degradation of the dyes, thus indicating the high stability of the studied catalytic materials. This exceptional durability can be attributed to the strong covalent bonding within the ZnO lattice and the efficient incorporation of nickel ions, which enhance the material’s structural integrity. Additionally, the presence of the Ni dopant in the catalyst successfully suppresses the recombination of photogenerated electron–hole pairs, which is a key factor in enhancing photocatalytic efficiency. These findings showed that this doped metal oxide possesses exceptional photocatalytic capabilities, indicating its potential as a promising candidate for various environmental applications. This can be attributed to its unique properties, including a high surface area and enhanced light absorption, contributing to its remarkable photocatalytic performance. The slight changes in the lattice parameters and the drop in efficiency can be attributed to several factors. Firstly, the accumulation of by-products on the photocatalyst’s surface can reduce the number of active sites available for photodegradation. Secondly, the aggregation of nanoparticles over time can decrease the surface area available for reactions, thus reducing the degradation rate.

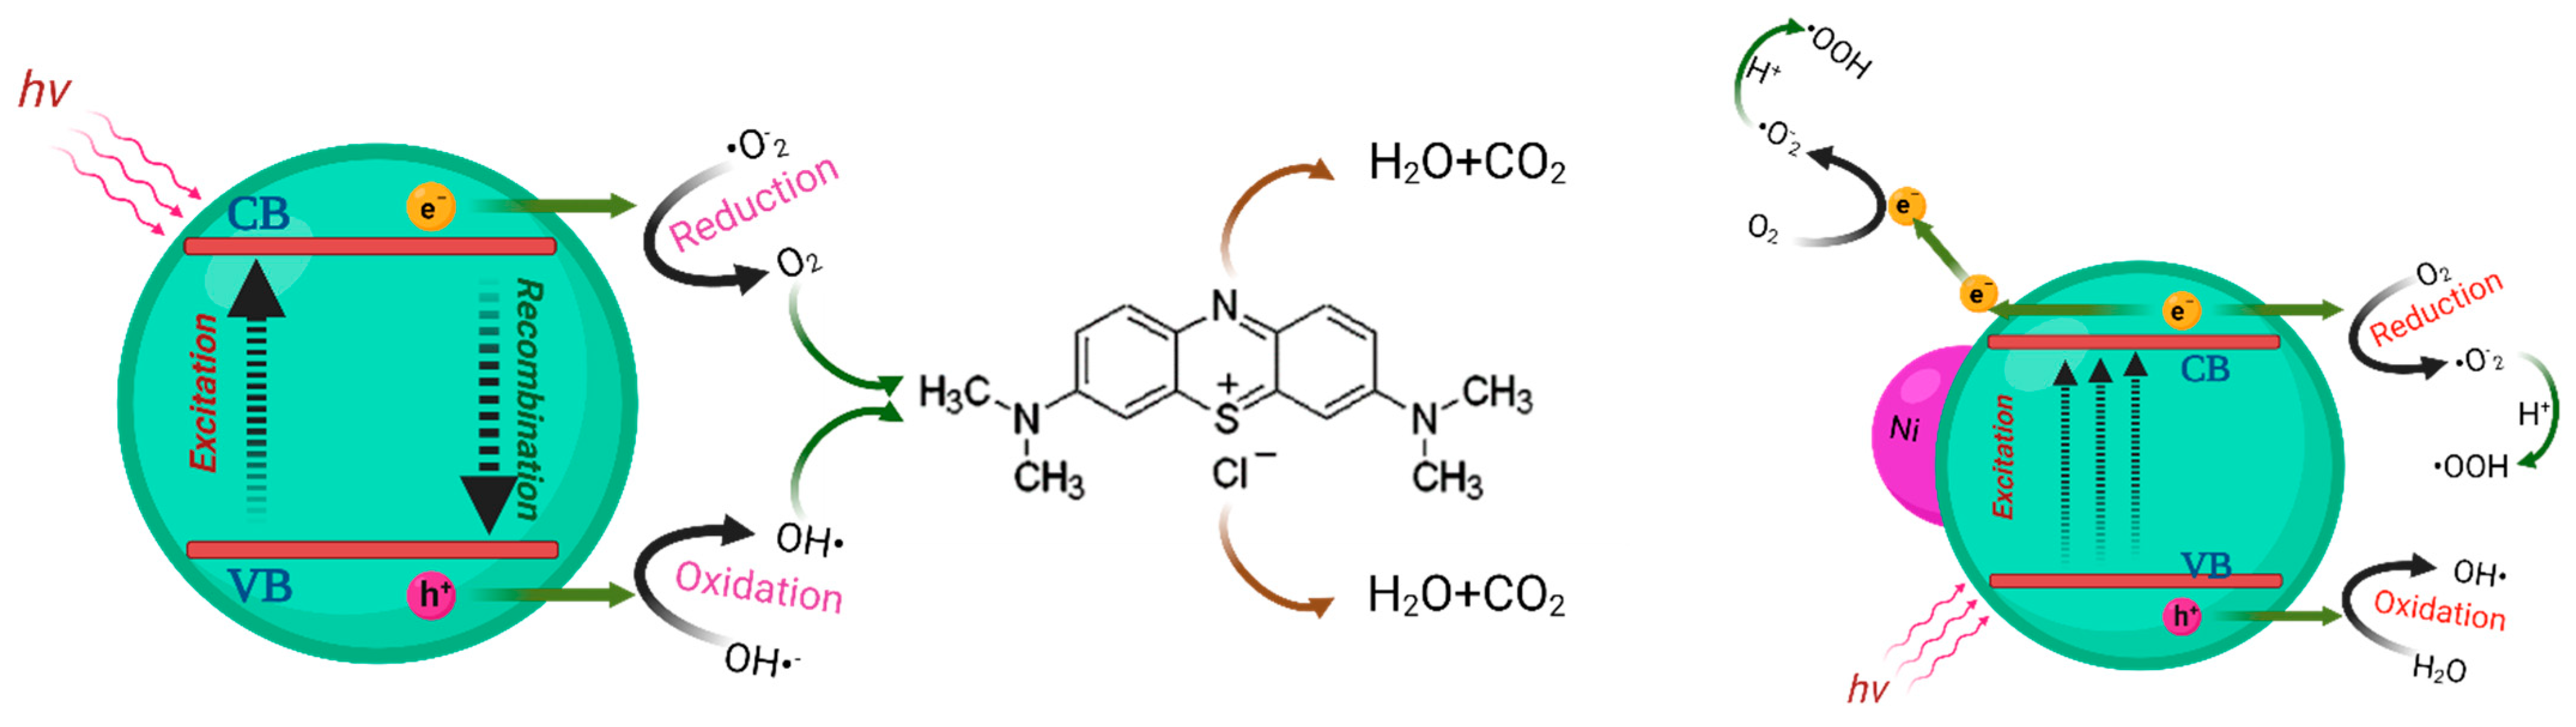
3.6.3. Photocatalysis Mechanism

The degradation of organic dyes using photocatalysis is highly dependent on the generation of electron–hole pairs, which requires semiconductor catalysts to absorb more light efficiently. To achieve this, doping ZnO with Ni- significantly enhances the former’s photocatalytic characteristics by extending the lifespan of the electron–hole pairs and increasing the compound’s light-harvesting capacity [33]. The process involves exposing the ZnO nanostructure to blue laser photons, which could excite electrons from the valence band to the conduction band, creating holes in the valence band. Ni nanoparticles on the surface of the ZnO then trap the excited electrons, effectively slowing down the recombination process. The holes produced can then react with adsorbed H2O molecules, generating active species such as OH, which initiates the degradation of organic dyes such as MB molecules.
Moreover, the trapped electrons interact with dissolved O2, forming O2, as shown in Figure 14. Overall, incorporating Ni-doped ZnO nanopowders into photocatalytic processes offers an eco-friendly and effective solution for pollutant cleanup by increasing the photocatalytic activity [60,61]. Doping can alter the electronic properties of a material. Doping introduces new energy levels into the band structure of a material [62]. In the case of Ni doping, it can introduce impurity levels within the band gap of ZnO, effectively reducing the band gap energy. This is due to the addition of Ni 3d states, which are located just below the conduction band of ZnO. This can enhance light absorption and, consequently, photocatalytic activity.
h ν + Z n O = h + V B + e ( C B )
N i 0 + 2 e = N i 2
N i 2 + O 2 = O 2
h + V B + H 2 O = OH + H +
M B   D y e + O 2 + O H = C O 2 + H 2 O

3.6.4. Significance of the Findings

The synthesis process adopted in this study, particularly the LACBS technique, is a significant contribution. This methodology allows for the synthesis of high-purity ZnO nanopowder and the precise control of Ni doping, thereby optimizing the photocatalytic performance of the synthesized materials. This synthesis technique substantially contributes to the methods available for creating novel photocatalysts. Moreover, the study utilizes an extensive array of advanced characterization techniques, such as XRD, FE-SEM, EDX, UV–Vis spectroscopy, and FTIR. These techniques facilitate a detailed understanding of the synthesized materials’ crystallinity, morphology, elemental composition, and optical properties. This comprehensive characterization is crucial for ensuring the synthesis’s reproducibility and for understanding the structure–function relationships of these materials, constituting a significant aspect of materials science and photocatalysis. The comparative evaluation of the photocatalytic performance of pristine and Ni-doped ZnO nanostructures towards the degradation of MB under blue laser light irradiation is another key contribution of this study. The results suggest that Ni doping enhances the photocatalytic efficiency of ZnO. This finding can provide valuable insights for designing efficient photocatalysts for water treatment applications and opens new directions for future research. Finally, the study underscores the need for further research into using ZnO and Ni-doped ZnO nano-photocatalysts for organic dye degradation. The study opens new avenues for future research, especially in terms of exploring other dopants and modifying the synthesis process to further enhance the photocatalytic performance of ZnO. Therefore, this study significantly contributes to ongoing research into photocatalysis and environmental remediation.

4. Conclusions

This paper presents a detailed investigation of the synthesis and characterization of pure and Ni-doped ZnO nanostructures using the low-cost and high-productivity LACBS method. The samples were thoroughly characterized using various analytical techniques, including structural, morphological, spectral, optical, and photocatalytic studies. The conducted XRD analysis revealed the hexagonal wurtzite structure of the synthesized samples. Notably, Ni doping did not introduce any secondary phase and produced highly dense and homogeneous hexagonal nanosized particles. However, as the Ni-doping concentration increased from 1% to 3%, a transition in morphology from particles to hexagonal flakes was observed. The EDX analysis confirmed the presence of Zn, O, and Ni in all the samples, with the Ni content increasing with the doping concentration. The band gap studies revealed a significant decrease in bandgap (Eg) with the increase in the Ni concentration. The values of Eg were found to be 3.22 eV, 3.16 eV, and 3.03 eV for the Ni-doped ZnO samples with doping concentrations of 1%, 2%, and 3%, respectively. FTIR studies were conducted in the range of 500 cm−1 to 4000 cm−1 to investigate the wurtzite structures of the pure and Ni-doped (1%, 2%, and 3%) ZnO nanostructures. The results indicated that Ni plays a crucial role in the electron-trapping properties of these materials, while oxygen faults are necessary for enhancing photocatalytic activity.

Author Contributions

Conceptualization, S.H.Z. and A.H.Z.; methodology, S.H.Z. and I.S.Y.; software, M.G.D. and M.N.; validation, S.H.Z., S.M.A. and E.A.K.; formal analysis, S.H.Z., M.S.A.E.-s., C.A.C.A., A.F.I.A. and H.Y.Z.; investigation, S.H.Z., C.A.C.A., A.H.Z. and M.N.; resources, S.H.Z. and M.S.; data curation, S.H.Z., M.G.D. and V.G.; writing—original draft preparation, S.H.Z., V.G. and M.S.A.-w.; writing—review and editing, S.H.Z., C.A.C.A., M.S.A.-w. and I.S.Y.; visualization, S.H.Z. and A.H.Z.; supervision, S.H.Z.; project administration, S.H.Z.; funding acquisition, S.H.Z. All authors have read and agreed to the published version of the manuscript.

Funding

This work was kindly supported by the Deanship of Graduate Studies and Research, Ajman University, Ajman, UAE, through the financial assistance offered under Grant number (Project ID, DGSR Ref. Number: 2022-IRG-HBS-17).

Data Availability Statement

All data are contained within the article.

Acknowledgments

The authors would like to convey their profound gratitude to Samer O. Alalalmeh and Omar E. Hegazi for their scrupulous attention to detail in editing and formatting the manuscript, which significantly contributed to the clarity and coherence of the final product. Furthermore, we extend our heartfelt appreciation to Taimoor Ahmad and Sohaib Naseem Khan of Ajman University for their generous provision of expertise and meticulous execution of FTIR analysis and nanoparticle synthesis. Their contributions have undeniably elevated the rigor and impact of our scholarly investigation. In addition, we express our sincere acknowledgment to Bayan Alradi, Bashayer Al Maamari, and Jamil Hassan Al Alami, affiliated with Ajman University, for their assiduous and comprehensive efforts in collecting and analyzing the photocatalyst data. Their diligence and expertise were crucial for the successful completion and interpretation of this research project. We also extend our gratitude to Abdul Razack Hajamohideen from United Arab Emirates University for his invaluable assistance in our research endeavors, particularly through his provision of SEM and XRD analyses. Finally, we extended our gratitude to Ghaseb N. Makhadmeh for designing the schematic diagrams. The unwavering commitment and expertise demonstrated by each of these individuals have undoubtedly enriched our research, enabling us to achieve our scientific objectives and contribute meaningfully to the academic community.

Conflicts of Interest

The authors declare no conflict of interest.

References

  1. Sharma, P.; Nadda, A.K.; Kumar, S. Microbial community profiling in bio-stimulated municipal solid waste for effective removal of organic pollutants containing endocrine disrupting chemicals. Microbiol. Res. 2023, 267, 127273. [Google Scholar] [CrossRef] [PubMed]
  2. Wang, L.; Huang, T.; Yang, G.; Lu, C.; Dong, F.; Li, Y.; Guan, W. The precursor-guided hydrothermal synthesis of CuBi2O4/WO3 het-erostructure with enhanced photoactivity under simulated solar light irradiation and mechanism insight. J. Hazard. Mater. 2020, 381, 120956. [Google Scholar] [CrossRef] [PubMed]
  3. Feng, Y.; Tao, Y.; Meng, Q.; Qu, J.; Ma, S.; Han, S.; Zhang, Y. Microwave-combined advanced oxidation for organic pollutants in the environmental remediation: An overview of influence, mechanism, and prospective. Chem. Eng. J. 2022, 441, 135924. [Google Scholar] [CrossRef]
  4. Kumar, J.A.; Krithiga, T.; Sathish, S.; Renita, A.A.; Prabu, D.; Lokesh, S.; Geetha, R.; Namasivayam, S.K.R.; Sillanpaa, M. Persistent organic pollutants in water resources: Fate, occurrence, characterization and risk analysis. Sci. Total Environ. 2022, 831, 154808. [Google Scholar] [CrossRef]
  5. Wang, Q.; Huang, N.; Cai, H.; Chen, X.; Wu, Y. Water strategies and practices for sustainable development in the semiconductor industry. Water Cycle 2023, 4, 12–16. [Google Scholar] [CrossRef]
  6. Pratap, B.; Kumar, S.; Nand, S.; Azad, I.; Bharagava, R.N.; Ferreira, L.F.R.; Dutta, V. Wastewater generation and treatment by various eco-friendly technologies: Possible health hazards and further reuse for environmental safety. Chemosphere 2023, 313, 137547. [Google Scholar] [CrossRef]
  7. Dong, Y.; Wu, H.; Yang, F.; Gray, S. Cost and efficiency perspectives of ceramic membranes for water treatment. Water Res. 2022, 220, 118629. [Google Scholar] [CrossRef]
  8. Al Ja’Farawy, M.S.; Kusumandari; Purwanto, A.; Widiyandari, H. Carbon quantum dots supported zinc oxide (ZnO/CQDs) efficient photocatalyst for organic pollutant degradation—A systematic review. Environ. Nanotechnol. Monit. Manag. 2022, 18, 100681. [Google Scholar] [CrossRef]
  9. Shi, Y.; Feng, D.; Ahmad, S.; Liu, L.; Tang, J. Recent advances in metal–organic frameworks–derived carbon-based materials in sulfate radical-based advanced oxidation processes for organic pollutant removal. Chem. Eng. J. 2023, 454, 140244. [Google Scholar] [CrossRef]
  10. Jagadeesh, N.; Sundaram, B. Adsorption of Pollutants from Wastewater by Biochar: A Review. J. Hazard. Mater. Adv. 2023, 9, 100226. [Google Scholar] [CrossRef]
  11. Lung, C.W.; Zheng, Z.; Lo, I.M. Solar-driven photocatalytic chlorine activation for the simultaneous degradation of pharmaceuticals and personal care products and the inactivation of Escherichia coli in drinking water. Chemosphere 2023, 311, 137019. [Google Scholar] [CrossRef]
  12. Sathish, S.; Kumar, J.A.; Prabu, D.; Renita, A.A.; Murugesan, K.; Rajasimman, M.; Joo, S.-W.; Vasseghian, Y.; Wang, C. Latest avenues on solar light-driven photocatalytic hydrogen generation using surface modified nanomaterials towards sustainable environment and circular bioeconomy. Fuel 2023, 340, 127398. [Google Scholar] [CrossRef]
  13. El-Maghrabi, H.H.; Younis, S.A.; Ali, H.R.; Nada, A.A. Solar-driven photocatalytic transformation of toluene to benzoic acid over perovskite-type NiTiO3 decorated with reduced GO and g-C3N4 nanosheets. J. Environ. Chem. Eng. 2023, 11, 109477. [Google Scholar] [CrossRef]
  14. Lenka, S.; Badamali, S.K. Nanostructured ZnO as an efficient heterogeneous photocatalyst towards degradation of lignin under visible light irradiation. Mol. Catal. 2023, 536, 112918. [Google Scholar] [CrossRef]
  15. Gao, J.; Shen, J.; Maouche, C.; Ali, R.N.; Yang, J.; Liu, Q. Enhanced antibacterial performance in water over the nanostructured heterojunction photocatalysts: A review. J. Clean. Prod. 2022, 372, 133770. [Google Scholar] [CrossRef]
  16. Ganesh, V.; Al Abdulaal, T.H.; Al Shadidi, M.; Hussien, M.S.A.; Bouzidi, A.; Algarni, H.; Zahran, H.Y.; Abdel-Wahab, M.S.; Mohammed, M.I.; Yahia, I.S.; et al. Enhancement in the Structural, Electrical, Optical, and Photocatalytic Properties of La2O3-Doped ZnO Nanostructures. Materials 2022, 15, 6866. [Google Scholar] [CrossRef]
  17. Soylu, S.; Kara, M.; Türkmen, M.; Şahin, B. Synergistic effect of Foeniculum vulgare essential oil on the antibacterial activities of Ag- and Cu-substituted ZnO nanorods (ZnO-NRs) against food, human and plant pathogenic bacterial disease agents. Inorg. Chem. Commun. 2022, 146, 110103. [Google Scholar] [CrossRef]
  18. Hwang, J.-D.; Lin, M.-C. ZnO hole blocking layer induced highly UV responsive p-NiO/n-ZnO/n-Si heterojunction photodiodes. Sens. Actuators A Phys. 2023, 349, 114087. [Google Scholar] [CrossRef]
  19. Roy, A.; Benhaliliba, M. Investigation of ZnO/p-Si heterojunction solar cell: Showcasing experimental and simulation study. Optik 2023, 274, 170557. [Google Scholar] [CrossRef]
  20. Kang, S.B.; Sanger, A.; Jeong, M.H.; Baik, J.M.; Choi, K.J. Heterogeneous stacking of reduced graphene oxide on ZnO nanowires for NO2 gas sensors with dramatically improved response and high sensitivity. Sens. Actuators B Chem. 2023, 379, 133196. [Google Scholar] [CrossRef]
  21. Rajan, A.; Gupta, V.; Arora, K. Thickness dependent ultraviolet photoconductivity studies on sol-gel derived zinc oxide (ZnO) films. Mater. Today Commun. 2023, 35, 105507. [Google Scholar] [CrossRef]
  22. Kadinskaya, S.A.; Kondratev, V.M.; Kindyushov, I.K.; Koval, O.Y.; Yakubovsky, D.I.; Kusnetsov, A.; Lihachev, A.I.; Nashchekin, A.V.; Akopyan, I.K.; Serov, A.Y.; et al. Deep-Level Emission Tailoring in ZnO Nanostructures Grown via Hydrothermal Synthesis. Nanomaterials 2022, 13, 58. [Google Scholar] [CrossRef]
  23. Rai, R.S.; Girish, J.P.; Bajpai, V.; Khan, M.I.; Elboughdiri, N.; Shanableh, A.; Luque, R. An eco-friendly approach on green synthesis, bio-engineering applications, and future outlook of ZnO nanomaterial: A critical review. Environ. Res. 2023, 221, 114807. [Google Scholar] [CrossRef] [PubMed]
  24. Wang, Z.L. Nanostructures of zinc oxide. Mater. Today 2004, 7, 26–33. [Google Scholar] [CrossRef]
  25. Ganesh, V.; Hussien, M.S.A.; Shaik, U.P.; Ade, R.; Mohammed, M.I.; Al Abdulaal, T.H.; Zahran, H.Y.; Yahia, I.S.; Abdel-Wahab, M.S. Impact of Mo-Doping on the Structural, Optical, and Electrocatalytic Degradation of ZnO Nanoparticles: Novel Approach. Crystals 2022, 12, 1239. [Google Scholar] [CrossRef]
  26. Dubrovskii, V.G.; Timofeeva, M.A.; Tchernycheva, M.; Bolshakov, A.D. Lateral growth and shape of semiconductor nanowires. Semiconductors 2013, 47, 50–57. [Google Scholar] [CrossRef]
  27. Davis, K.; Yarbrough, R.; Froeschle, M.; White, J.; Rathnayake, H. Band gap engineered zinc oxide nanostructures via a sol–gel synthesis of solvent driven shape-controlled crystal growth. RSC Adv. 2019, 9, 14638–14648. [Google Scholar] [CrossRef] [PubMed]
  28. Yin, H.; Chen, J.; Wang, Y.; Wang, J.; Guo, H. Composition dependent band offsets of ZnO and its ternary alloys. Sci. Rep. 2017, 7, 41567. [Google Scholar] [CrossRef] [Green Version]
  29. AlAbdulaal, T.H.; Ganesh, V.; AlShadidi, M.; Hussien, M.S.A.; Bouzidi, A.; Algarni, H.; Zahran, H.Y.; Abdel-Wahab, M.S.; Yahia, I.S.; Nasr, S. The Auto-Combustion Method Synthesized Eu2O3- ZnO Nanostructured Composites for Electronic and Photocatalytic Applications. Materials 2022, 15, 3257. [Google Scholar] [CrossRef]
  30. Rastogi, A. Doped ceramics for visible light photocatalysis. In Nanostructured Materials for Visible Light Photocatalysis; Elsevier: Amsterdam, The Netherlands, 2022; pp. 277–293. [Google Scholar] [CrossRef]
  31. Feng, X.; Gu, L.; Wang, N.; Pu, Q.; Liu, G. Fe/N co-doped nano-TiO2 wrapped mesoporous carbon spheres for synergetically enhanced adsorption and photocatalysis. J. Mater. Sci. Technol. 2023, 135, 54–64. [Google Scholar] [CrossRef]
  32. Akhter, P.; Arshad, A.; Saleem, A.; Hussain, M. Recent Development in Non-Metal-Doped Titanium Dioxide Photocatalysts for Different Dyes Degradation and the Study of Their Strategic Factors: A Review. Catalysts 2022, 12, 1331. [Google Scholar] [CrossRef]
  33. Zyoud, S.H.; Yahia, I.S.; Shahwan, M.; Zyoud, A.H.; Zahran, H.Y.; Abdel-Wahab, M.S.; Daher, M.G.; Nasor, M.; Makhadmeh, G.N.; Hassan, N.; et al. Fast and Excellent Enhanced Photocatalytic Degradation of Methylene Blue Using Silver-Doped Zinc Oxide Submicron Structures under Blue Laser Irradiation. Crystals 2023, 13, 229. [Google Scholar] [CrossRef]
  34. Tabib, A.; Bouslama, W.; Sieber, B.; Addad, A.; Elhouichet, H.; Férid, M.; Boukherroub, R. Structural and optical properties of Na doped ZnO nanocrystals: Application to solar photocatalysis. Appl. Surf. Sci. 2017, 396, 1528–1538. [Google Scholar] [CrossRef]
  35. Fenoll, J.; Ruiz, E.; Hellín, P.; Flores, P.; Navarro, S. Heterogeneous photocatalytic oxidation of cyprodinil and fludioxonil in leaching water under solar irradiation. Chemosphere 2011, 85, 1262–1268. [Google Scholar] [CrossRef] [PubMed]
  36. Khatamian, M.; Khandar, A.; Divband, B.; Haghighi, M.; Ebrahimiasl, S. Heterogeneous photocatalytic degradation of 4-nitrophenol in aqueous suspension by Ln (La3+, Nd3+ or Sm3+) doped ZnO nanoparticles. J. Mol. Catal. A Chem. 2012, 365, 120–127. [Google Scholar] [CrossRef]
  37. Sin, J.-C.; Lam, S.-M.; Lee, K.-T.; Mohamed, A.R. Preparation of cerium-doped ZnO hierarchical micro/nanospheres with enhanced photocatalytic performance for phenol degradation under visible light. J. Mol. Catal. A Chem. 2015, 409, 1–10. [Google Scholar] [CrossRef]
  38. Lemos, S.C.S.; Rezende, T.K.D.L.; Assis, M.; Romeiro, F.D.C.; Peixoto, D.A.; Gomes, E.D.O.; Jacobsen, G.M.; Teodoro, M.D.; Gracia, L.; Ferrari, J.L.; et al. Efficient Ni and Fe doping process in ZnO with enhanced photocatalytic activity: A theoretical and experimental investigation. Mater. Res. Bull. 2022, 152, 111849. [Google Scholar] [CrossRef]
  39. Jolaei, S.; Mirzaei, M.; Hassanpour, A.; Safardoust-Hojaghan, H.; Khani, A. Using ZnO, NiO, and ZnO/NiO as Nano Photocatalyst for Removal of Acid Violet and Rhodamine B from Wastewater. J. Nanostruct. 2022, 12, 761–770. [Google Scholar] [CrossRef]
  40. Palneedi, H.; Park, J.H.; Maurya, D.; Peddigari, M.; Hwang, G.-T.; Annapureddy, V.; Kim, J.-W.; Choi, J.-J.; Hahn, B.-D.; Priya, S.; et al. Laser Processing of Metal Oxides: Laser Irradiation of Metal Oxide Films and Nanostructures: Applications and Advances (Adv. Mater. 14/2018). Adv. Mater. 2018, 30, 1870094. [Google Scholar] [CrossRef] [Green Version]
  41. Zyoud, S.H.; Ahmed, N.M.; Lahewil, A.S.Z.; Bin Omar, A.F. Micro spot ZnO nanotubes using laser assisted chemical bath deposition: A low-cost approach to UV photodetector fabrication. Sens. Actuators A Phys. 2022, 338, 113485. [Google Scholar] [CrossRef]
  42. Chauhan, S.; Kumar, M.; Chhoker, S.; Katyal, S.C.; Awana, V.P.S. Structural, vibrational, optical and magnetic properties of sol-gel derived Nd doped ZnO nanoparticles. J. Mater. Sci. Mater. Electron. 2013, 24, 5102–5110. [Google Scholar] [CrossRef]
  43. Primo, J.D.O.; Horsth, D.F.; Correa, J.D.S.; Das, A.; Bittencourt, C.; Umek, P.; Buzanich, A.G.; Radtke, M.; Yusenko, K.V.; Zanette, C.; et al. Synthesis and Characterization of Ag/ZnO Nanoparticles for Bacteria Disinfection in Water. Nanomaterials 2022, 12, 1764. [Google Scholar] [CrossRef]
  44. Elhamdi, I.; Souissi, H.; Taktak, O.; Elghoul, J.; Kammoun, S.; Dhahri, E.; Costa, B.F.O. Experimental and modeling study of ZnO:Ni nanoparticles for near-infrared light emitting diodes. RSC Adv. 2022, 12, 13074–13086. [Google Scholar] [CrossRef]
  45. Karthika, K.; Ravichandran, K. Tuning the microstructural and magnetic properties of ZnO nanopowders through the simulta-neous doping of Mn and Ni for biomedical applications. J. Mater. Sci. Technol. 2015, 31, 1111–1117. [Google Scholar] [CrossRef]
  46. Belkhaoui, C.; Mzabi, N.; Smaoui, H.; Daniel, P. Enhancing the structural, optical and electrical properties of ZnO nanopowders through (Al + Mn) doping. Results Phys. 2019, 12, 1686–1696. [Google Scholar] [CrossRef]
  47. Vijayaprasath, G.; Murugan, R.; Mahalingam, T.; Ravi, G. Comparative study of structural and magnetic properties of transition metal (Co, Ni) doped ZnO nanoparticles. J. Mater. Sci. Mater. Electron. 2015, 26, 7205–7213. [Google Scholar] [CrossRef]
  48. Xu, C.; Cao, L.; Su, G.; Liu, W.; Qu, X.; Yu, Y. Preparation, characterization and photocatalytic activity of Co-doped ZnO powders. J. Alloys Compd. 2010, 497, 373–376. [Google Scholar] [CrossRef]
  49. Abdel-Wahab, M.; Jilani, A.; Yahia, I.; Al-Ghamdi, A.A. Enhanced the photocatalytic activity of Ni-doped ZnO thin films: Morphological, optical and XPS analysis. Superlattices Microstruct. 2016, 94, 108–118. [Google Scholar] [CrossRef]
  50. Ali, H.; Alsmadi, A.; Salameh, B.; Mathai, M.; Shatnawi, M.; Hadia, N.; Ibrahim, E. Influence of nickel doping on the energy band gap, luminescence, and magnetic order of spray deposited nanostructured ZnO thin films. J. Alloys Compd. 2019, 816, 152538. [Google Scholar] [CrossRef]
  51. Wang, Y.S.; Thomas, P.J.; O’Brien, P. Nanocrystalline ZnO with Ultraviolet Luminescence. J. Phys. Chem. B 2006, 110, 4099–4104. [Google Scholar] [CrossRef]
  52. Mohammed, M.I.; Yahia, I.S. Synthesis and optical properties of basic fuchsin dye-doped PMMA polymeric films for laser applications: Wide scale absorption band. Opt. Quantum Electron. 2018, 50, 159. [Google Scholar] [CrossRef]
  53. Elilarassi, R.; Chandrasekaran, G. Synthesis and optical properties of Ni-doped zinc oxide nanoparticles for optoelectronic ap-plications. Optoelectron. Lett. 2010, 6, 6–10. [Google Scholar] [CrossRef]
  54. Jyoti, K.; Singh, A. Green synthesis of nanostructured silver particles and their catalytic application in dye degradation. J. Genet. Eng. Biotechnol. 2016, 14, 311–317. [Google Scholar] [CrossRef] [PubMed] [Green Version]
  55. Handore, K.; Bhavsar, S.; Horne, A.; Chhattise, P.; Mohite, K.; Ambekar, J.; Pande, N.; Chabukswar, V. Novel Green Route of Synthesis of ZnO Nanoparticles by Using Natural Biodegradable Polymer and Its Application as a Catalyst for Oxidation of Aldehydes. J. Macromol. Sci. Part A 2014, 51, 941–947. [Google Scholar] [CrossRef]
  56. Azfar, A.K.; Kasim, M.F.; Lokman, I.M.; Rafaie, H.A.; Mastuli, M.S. Comparative study on photocatalytic activity of transition metals (Ag and Ni)-doped ZnO nanomaterials synthesized via sol–gel method. R. Soc. Open Sci. 2020, 7, 191590. [Google Scholar] [CrossRef] [Green Version]
  57. Devi, K.N.; Devi, S.A.; Singh, W.J.; Singh, K.J. Nickel doped zinc oxide with improved photocatalytic activity for Malachite Green Dye degradation and parameters affecting the degradation. J. Mater. Sci. Mater. Electron. 2021, 32, 8733–8745. [Google Scholar] [CrossRef]
  58. Ahmad, I.; Aslam, M.; Jabeen, U.; Zafar, M.N.; Malghani, M.N.K.; Alwadai, N.; Alshammari, F.H.; Almuslem, A.S.; Ullah, Z. ZnO and Ni-doped ZnO photocatalysts: Synthesis, characterization and improved visible light driven photocatalytic degradation of methylene blue. Inorganica Chim. Acta 2022, 543, 121167. [Google Scholar] [CrossRef]
  59. Cai, X.; Cai, Y.; Liu, Y.; Li, H.; Zhang, F.; Wang, Y. Structural and photocatalytic properties of nickel-doped zinc oxide powders with variable dopant contents. J. Phys. Chem. Solids 2013, 74, 1196–1203. [Google Scholar] [CrossRef]
  60. Abdel-Wahab, M.S. Substrate Temperature Impact on the Structural, Optical and Photo-Catalytic Activity of Sputtered Cu-Doped ZnO Thin Films. J. Electron. Mater. 2021, 50, 4364–4372. [Google Scholar] [CrossRef]
  61. Liu, Y.; Wang, Y.; Zhen, W.; Wang, Y.; Zhang, S.; Zhao, Y.; Song, S.; Wu, Z.; Zhang, H. Defect modified zinc oxide with augmenting sonodynamic reactive oxygen species generation. Biomaterials 2020, 251, 120075. [Google Scholar] [CrossRef]
  62. Zyoud, S.H.; Alalalmeh, S.O.; Hegazi, O.E.; Yahia, I.S.; Zahran, H.Y.; Abu Sara, H.; Bloukh, S.H.; Shahwan, M.; Zyoud, A.H.; Hassan, N.; et al. Novel Laser-Assisted Chemical Bath Synthesis of Pure and Silver-Doped Zinc Oxide Nanoparticles with Improved Antimicrobial and Photocatalytic Properties. Catalysts 2023, 13, 900. [Google Scholar] [CrossRef]
Figure 1. Schematic diagram illustrating the working principle for synthesizing pure and Ni-doped ZnO nanostructures.
Crystals 13 01087 g001
Figure 2. Photocatalytic schematic diagram.
Crystals 13 01087 g002
Figure 3. XRD spectra of pure and Ni-doped ZnO nanoparticles.
Crystals 13 01087 g003
Figure 4. (ah): SEM images of (a,b) pure ZnO, (c,d) ZnO: Ni(1%), (e,f) ZnO: Ni(2%), and (g,h) ZnO: Ni(3%).
Crystals 13 01087 g004
Figure 5. (ad). Elemental analysis of (a) pure ZnO, (b) ZnO: Ni(1%), (c) ZnO: Ni(2%), and (d) ZnO: Ni(3%).
Crystals 13 01087 g005
Figure 6. (a,b): (a) The UV–Visible spectra of pure and Ni-doped ZnO, (b) Band gap based on experimental ( a h v ) 2 vs. h v plots.
Crystals 13 01087 g006
Figure 7. FTIR spectrum of pure and Ni-doped ZnO nanostructures.
Crystals 13 01087 g007
Figure 8. (ad) Spectra concerning absorption of MB dye by pure and Ni-doped ZnO nanostructures.
Crystals 13 01087 g008
Figure 9. Concentration spectra of MB dye when using pure and Ni-doped ZnO nanostructures.
Crystals 13 01087 g009
Figure 10. Degradation percentages of MB dyes at different time intervals with varying photocatalysts.
Crystals 13 01087 g010
Figure 11. The ln ( C o C ) versus time plot used to determine the rate constant.
Crystals 13 01087 g011
Figure 12. Photodegradation efficiency with several cycles and rate of degradation with the number of cycles for recycling the best catalyst (ZnO:Ni(3%)).
Crystals 13 01087 g012
Figure 13. XRD patterns of the best catalyst (ZnO:Ni(3%)) before (cycle 1) and after (cycle 5) stability tests.
Crystals 13 01087 g013
Figure 14. Schematic diagram of the proposed mechanism for the degradation of MB using pure and Ni-doped ZnO nanostructures.
Crystals 13 01087 g014
Table 1. The amounts of solutions.
SamplesSolution ASolution BSolution CTotal
Pure ZnO50 mL50 mL0100 mL
ZnO: Ni(1%)49.5 mL49.5 mL1 mL100 mL
ZnO: Ni(2%)49 mL49 mL2 mL100 mL
ZnO: Ni(3%)48.5 mL48.5 mL3 mL100 mL
Table 2. Structural parameters of pure and Ni-doped ZnO nanostructures.
Samples(h, k, l)2θ, (deg)dβ, (deg)ID, (Å)a = b, (Å)c, (Å) ε a ε c
Pure ZnO10031.382.81680.19678997.32873.29075.69971.27249.5303
00234.112.60670.24595865.90353.03425.2555−6.61980.9944
10136.152.48100.245914155.93582.86834.9680−11.7278−4.5300
ZnO: Ni(1%)10031.532.82580.76006691.89743.27545.67330.80289.0224
00234.142.61570.78114511.85863.03175.2510−7.45010.965
10136.052.48790.801210621.82162.87604.9813−11.4911−4.2740
ZnO: Ni(2%)10031.612.82490.77622811.85823.26745.65930.55418.7535
00234.172.61640.79323071.83043.02915.2465−6.77890.8224
10136.012.48810.80334711.81662.87904.9867−11.3961−4.1712
ZnO: Ni(3%)10031.732.82320.79013211.82613.25535.63840.18368.3527
00234.212.61690.80777381.85863.02565.2406−6.69950.9083
10135.962.48920.80535861.81182.88294.9934−11.2770−4.0424
Table 3. EDX analysis of the pure and Ni-doped ZnO nanoparticles.
SamplesFormulaMass%Atom%SigmaNetK Ratio Line
Pure ZnOO18.8848.750.2824260.0033915 K
Zn81.1251.251.2973600.0253198 K
Ni0000
Total100100
ZnO: Ni(1%)O18.1847.550.2624360.0034063 K
Zn80.6451.611.1880380.0276570 K
Ni1.180.840.265780.0005570 L
Total100100
ZnO: Ni(2%)O18.1947.520.2524090.0033656 K
Zn79.0150.501.1582770.0284559 K
Ni2.801.990.3114470.0013944 L
Total100100
ZnO: Ni(3%)O18.5848.110.2426540.0037131 K
Zn77.3148.991.0591440.0314740 K
Ni4.112.900.3224170.0023315 L
Total100100
Table 4. Comparison between efficiencies of different catalyst systems from previous studies.
Synthesis MethodsCatalyst TypesCatalyst AmountDyesLight Sources% of Deg k a p p , (min−1) Time, (min)Refs.
Sol–gelZnO:Ni(1%)100 mg/100 mLMO, (10 ppm)UV light31.680.0029160[56]
co-precipitationZnO:Ni(6%)0.1g/LMalachite Green, (15 ppm)UV light760.004260[57]
Wet chemicalZnO:Ni(12%)10 mg/50 mLMB, (3 ppm)Visible light980.08160[58]
Water bathZnO:Ni(10%)2 mg/50 mLRhodamine BVisible light92.20.0115210[59]
LACBSZnO10 mg/50 mLMB, (20 ppm)Blue laser62.120.0133170This work
LACBSZnO: Ni(1%)10 mg/50 mLMB, (20 ppm)Blue laser76.210.0188170This work
LACBSZnO: Ni(2%)10 mg/50 mLMB, (20 ppm)Blue laser76.210.0232570This work
LACBSZnO: Ni(3%)10 mg/50 mLMB, (20 ppm)Blue laser97.930.0447770This work
Table 5. Comparison between the XRD petameters of cycle 1 and cycle 5 for ZnO:Ni(3%).
ZnO:Ni(3%)(h, k, l)2θ, (deg)dβ, (deg)ID, (Å)a = b, (Å)c, (Å)
Cycle 110031.602.810.743051.943.275.66
00234.272.630.807181.813.025.23
10136.042.480.815661.812.884.98
Cycle 510031.582.820.73641.983.275.66
00234.202.600.766011.913.035.24
10136.062.470.791031.862.884.98
Disclaimer/Publisher’s Note: The statements, opinions and data contained in all publications are solely those of the individual author(s) and contributor(s) and not of MDPI and/or the editor(s). MDPI and/or the editor(s) disclaim responsibility for any injury to people or property resulting from any ideas, methods, instructions or products referred to in the content.

