Abstract
A cyclobenzaprine-tetraphenylborate (CBP-TPB) complex was synthesized, achieving a 78% yield through an anion exchange reaction. The white crystals of the complex were formed in acetonitrile and characterized using a variety of spectroscopic and analytical techniques, including ultraviolet, infrared, mass, elemental, and nuclear magnetic resonance (NMR) spectroscopy, as well as X-ray crystallography. The study employed a comprehensive approach to investigate the structural properties, stability, and behavior of the CBP-TPB complex. The use of crystallographic analysis, Hirshfeld surface analysis, quantum theory of atoms in molecules, noncovalent interaction reduced density gradient, global reactivity descriptors, frontier molecular orbitals, molecular electrostatic potential, and ultraviolet-visible spectroscopy provided valuable insights into the complex’s molecular geometries, supramolecular features, and intermolecular interactions. These findings contribute to a better understanding of the CBP-TPB complex’s potential applications in fields such as pharmaceuticals and materials science and emphasize the importance of combining theoretical predictions and experimental measurements in understanding molecular properties. The study also demonstrated the potential of density functional theory-based computational methods for predicting NMR spectroscopic parameters.
1. Introduction
Cyclobenzaprine hydrochloride (CBP) is chemically known as 3-(5H-Dibenzo[a,d] 1 annulen-5-ylidene)-N,Ndimethyl-1-propanamine hydrochloride (Figure 1). Cyclobenzaprine acts centrally as a skeletal muscle relaxant with antidepressant properties [1,2]. Cyclobenzaprine’s exact mode of action is still unknown; however, it appears to work predominantly on the brain stem to decrease tonic somatic motor activity, affecting both gamma and alpha motor neurons and reducing muscle spasms. Muscle spasms related to acute, painful musculoskeletal problems are treated in the short term with cyclobenzaprine. It frequently coexists with physical treatment and rest. It functions by assisting with muscle relaxation [1,2]. Sodium tetraphenyl borate, an organic anion molecule, is used as an ion-pair reagent for a variety of cationic compounds [3,4], it forms an ion-pair or ion-associate complex when it combines with cyclobenzaprine [5].
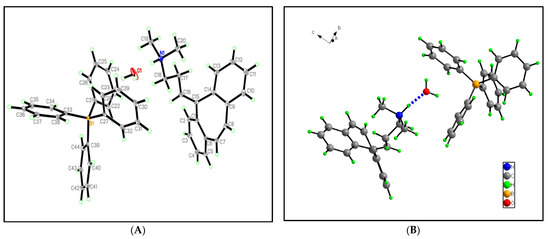
Figure 1.
Graphical representation of the asymmetric units for CBP-TPB: (A) displays the atom numbering, and (B) showcases the DIAMOND plots.
A complex known as an ion-associate complex or an ionic compound is made up of ions bound together by electrostatic forces known as ionic bonding. Although the formed compound is generally neutral, it does contain positively charged ions known as cations and negatively charged ions known as anions. Ionic compounds are often rigid and brittle, with high melting and boiling temperatures. They are usually electrically insulating when they are solid, but when they are melted or dissolved, the ions become mobilized, and as a result, they become highly conductive. Ions dissociate when ionic substances dissolve, becoming solvated by the solvent and distributed throughout the resultant solution [6]. Solvable ionic compounds are the most prevalent type of strong electrolytes because their solutions have high electrical conductivity and the ability to transmit charge when the ions are discharged into the solution [6].
Ion-pair or ion-associate compounds can be used as sensing components in electrochemical sensors [3,4]. The synthesis of ionic compounds based on known active medicinal substances as the cationic component and tiny ions (halogens, nitrates) as the anionic part is one of the contemporary trends in pharmacology [7]. In particular for peptides in particular, ion pairs are employed to create innovative, controlled-release medicinal formulations [8,9]. One of the key advantages of employing drugs that form ion-pair complexes is that the active ingredient does not go through structural changes, making the medication more stable [10], have a longer half-life, and be more bioavailable [11,12]. Meanwhile, the creation of an ion-pair medicine results in a brand-new drug with improved absorption properties [13,14].
The study of noncovalent interactions and chemical reactivity is essential for understanding the behavior of molecules in various chemical, biological, and material systems. Computational chemistry methods have emerged as indispensable tools in this field, allowing researchers to delve into the underlying mechanisms and characteristics of these interactions and reactivity patterns. In this context, the importance of computational chemistry methods in assessing the strength and nature of noncovalent interactions, as well as chemical reactivity behaviors, cannot be overstated [15,16,17,18]
These powerful techniques provide valuable insights into the electronic properties and structural characteristics of molecules, enabling scientists to more accurately predict and understand the intricacies of noncovalent interactions and chemical reactivity. By employing advanced computational approaches, researchers can explore complex molecular systems, unravel the driving forces behind chemical processes, and guide the development of innovative materials and drug candidates. In this work, we utilize computational chemistry methods to investigate the noncovalent interactions and chemical reactivity of a specific molecular system, contributing to the growing body of knowledge in this important area of research [19,20,21].
In this paper, we present the synthesis, characterization, single-crystal structure determination, and DFT calculations of the tetraphenylborate cyclobenzaprine complex. Hydrogen bonds and noncovalent interactions, which were investigated via Hirshfeld surface analysis, stabilize the molecular structure. Differential spectroscopic methods, UV, infrared, mass spectrometry, elemental analysis, and NMR spectroscopy were used to characterize this compound. The DFT calculation method was employed to investigate the interaction mechanism of cyclobenzaprine complex with tetraphenylborate anions. The interaction strength and type of the complex were studied through the reduced density gradient function.
2. Methods
2.1. Experimental (Chemistry)
2.1.1. General
The melting point was determined using a Gallenkamp melting point apparatus. X-ray crystallography was measured on a Bruker APEX-II D8 venture diffractometer equipped with graphite monochromatic Mo Kα radiation, with l = 0.71073 Å at100 (2) K. The IR spectra were recorded with a Perkin-Elmer FTIR spectrometer. Bruker 500 and 700 MHz and 125 and 176 MHz instruments were used to record 1H NMR and 13 C NMR in DMSOd6, respectively, using TMS as an internal standard (with chemical shifts in δ ppm). The mass spectrum was measured on an Agilent triple quadrupole 6410 QQQ LC/MS equipped with an ESI (electrospray ionization) source. Elemental analysis was carried out via Perkin Elmer, 2400 series II, CHNS/O elemental analysis. A Shimadzu 1800 UV double-beam spectrophotometer with quartz cell was used to scan the spectra of the formed complex.
2.1.2. Synthesis
A solution of sodium tetraphenyl borate (0.3422 g, 1 mmol) in deionized water (30 mL) was added to a solution of 3-(5H-dibenzo [a,d]cyclohepten-5-ylidene)-N,N-dimethyl-1-propanamine (0.260375 g, 1 mmol) in deionized water. A white precipitate was produced and rinsed with deionized water after being filtered off. The precipitate was dried at room temperature to produce the complex of matching ion pairs. The proposed chemical was discovered to have a 76% yield and a melting point of 131 °C upon recrystallization from acetonitrile. Various spectroscopic and instrumentation analyses supported the generated ion-pair complex. Mass spectrometry, UV spectral analysis, IR, elemental analysis, and NMR were applied.
R(KBr) 3025 cm−1 (amino group). 1H NMR (700 MHz, DMSO_d6) δ: 2.2 (m, 2H, CH2), 2.6 (s, 6H, N–CH3), 3.0 (m, 2H, CH2), 5.4 (t, J = 7.0 Hz, 1H, CH), 6.80 (d, J = 7.0 Hz, 1H, CH), 6.92 (d, J = 7.0 Hz, 1H, CH), 7.15–7.45 (all, ArH). 13C NMR δ: 24.55, 42.31, 56.56, 122.33, 126.13, 127.83, 128.10, 128.73, 128.97, 129.18, 129.41, 129.79, 131.18, 131.36, 131.60, 134.11, 134.33, 136.24, 136.38, 141.69, 144.49, 152.15, 163.30, 163.69, 164.10. Elemental analysis: (C44H41BN); cal. C 88.79%, H 6.89%, and N 2.35% found C 87.43%, H: 6.89%, and N 2.27%.
2.2. Theoretical Methodology
2.2.1. Single-Crystal X-ray Diffraction
Data collection: Intensity data for the crystalline structures were measured at room temperature (293 K) using a SMART APEX BRUKER AXS diffractometer. The instrument was equipped with graphite monochromated Mo Kα radiation (λ = 0.71073 Å) and operated in the ω/2θ scan mode.
Structure solution: The structures of CBP-TPB complex were solved using direct methods within the Olex2-1.5-alpha [22] and SHELXS software [23]. Crystal data and details of the structural determination are provided in Table 1 and Figure S1.

Table 1.
Crystal data and structure refinement parameters for (CBP-TPB) (CCDC 1518156).
Geometrical calculations and weak interaction identification: Geometrical calculations and weak interaction identification were performed using PLATON, CrystalExplorer [24], and Expo2014 programs [25].
Visualization and molecular graphics: DIAMOND 4.5 [26] software was employed for creating visualizations and molecular graphics.
In summary, the SCXRD methodology involved sample preparation, data collection using a diffractometer, structural solution with direct methods, geometrical calculations and weak interaction identification using specialized software, and visualization of the crystal structures through various molecular graphics programs. The resulting bond distances and angles were compiled in tables for further analysis.
2.2.2. Computational Details
The methodology for computational details in this study was as follows:
Initial geometries: All DFT calculations were performed using experimental single-crystal X-ray data (Table S1 and Figure 1).
Geometry optimization: Geometry optimizations for various isolated monomer and dimer models were carried out in the gas phase using the Gaussian 09, Rev D.01 software package [6,27]. The GaussView 6.0 program [28] was utilized for visualization, analysis, modification, and export of data results.
DFT functional and basis set: The B3LYP/6–31G(d,p) functional, ref. [29], was employed [30,31].
Frequency calculations: Frequency calculations were performed on optimized geometries, ensuring that all stationary points were true minima (zero imaginary frequency) on the potential energy surface.
Single-point calculations: The obtained stable geometries were used at the same level of theory for all single-point (SP) calculations for NCI, QTAIM, BSs, reactivity descriptors, and aromaticity [30,32].
Counterpoise correction: For hydrogen-bonded dimers, computed interaction energies were corrected for basis set superposition errors using the counterpoise method (CP) [30,33]
Hirshfeld surfaces and fingerprint maps: Three-dimensional (3D) Hirshfeld surfaces (HSs) and associated 2D fingerprint maps were generated using the CrystalExplorer17.5 program in conjunction with the TONTO system [34].
Bader’s atoms-in-molecules (AIM) analysis: QTAIM topological properties of electron densities at bond critical points (BCPs) were computed and displayed using the AIMALL software packages [32,35].
Reduced density gradient noncovalent interaction (RDG-NCI) analysis: RDG-NCI analysis was performed, and corresponding color-filled isosurface graphs were drawn using the VMD visualizer [36].
Global chemical reactivity descriptors: All global and local chemical reactivity descriptors for the systems were calculated using conceptual density functional theory (CDFT), also known as chemical reactivity theory (CRT) [37].
3. Results and Discussion
3.1. Chemistry
A white precipitate of an ion-pair or ion-associate complex of cyclobenzaprine and sodium tetraphenyl borate is produced when cyclobenzaprine hydrochloride (1) and sodium tetraphenyl borate (2) react in water. In accordance with Scheme 1, the yields, which were at 75%, were recrystallized in acetonitrile.
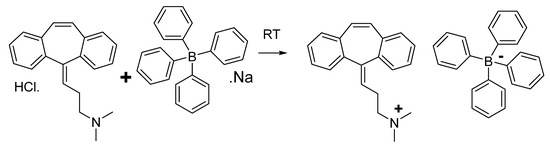
Scheme 1.
Chemical reaction of cyclobenzapyrine with sodium tetraphenyl borate.
Specifically, the 1H NMR spectra of the cyclobenzaprine-tetraphenylboric complex is distinguished by a singlet signal of N–(CH3)2 protons at 2.6 ppm, as well as multiple signals of protons at 3.0 and 2.2 ppm for N–CH2–CH2 and N–CH2–CH2, respectively. In the case of N–CH2–CH2CH, the triplet signal can be detected at 5.4 ppm. Resonance peaks for N–CH2–CH2, N–(CH3)2, N–CH2–CH2, and N–CH2–CH2CH were observed at 24.47, 42.57, 56.61, and 122.33 ppm in the 13C NMR spectra. The olefinic ethylene in the cyclobenzaprine ring manifests as two distinctive 1H resonances, with intrinsic splitting patterns at around 6.92 and 6.80 ppm, and a resonance peak at 131.18 ppm in the 13C NMR spectra. The tetraphenylboric ring’s aromatic protons appeared in the 7.15–7.45 ppm range. The IR spectrum of the target complex was characterized by the appearance of the absorption band at 3025 cm−1 assignable for the amino group. ESI-MS of compound 3 revealed a peak at m/z 276 equal to [M]+, in addition to a negative scan at (m/z) for [(Ph)4B]− at 319. The spectra of the named compound 3 are depicted in Section 3.2.7, which shows show a maximum absorption at 294, 226, and 207 nm.
3.2. Molecular Geometries and Computational Details
3.2.1. An Investigation through Crystallography
In this study, the crystallographic structure of the cyclobenzaprine-tetraphenylboric complex is investigated. The complex has an empirical formula of C44H44BNO and a molecular weight of 613.61 g/mol. The crystal data and structural refinement details are provided in Table S1 and Figure 1. The crystal structure was determined at a temperature of 293 K (about room temperature), exhibiting a monoclinic crystal system with a space group of C2/c. The unit cell dimensions are as follows: a = 41.072 Å, b = 9.9974 Å, and c = 16.8148 Å. The angles between the unit cell axes are α = 90°, β = 93.115°, and γ = 90°, indicating that the crystal structure is slightly distorted from a perfect rectangular prism. The volume of the unit cell is 6894.2 Å3 and contains eight formula units (Z = 8), resulting in a calculated density of 1.182 g/cm3. The X-ray diffraction data was collected using MoKα radiation (λ = 0.71073 Å), and the 2Θ range for data collection was 4.194° to 66.446°. A total of 55,034 reflections were collected, out of which 13,176 were found to be independent reflections with an Rint of 0.1232 and an Rsigma of 0.1548. The final structure was refined with no restraints, resulting in 600 refined parameters. The goodness-of-fit on F2 was found to be 1.014, indicating that the model is a reasonable representation of the experimental data. The final R indexes for the reflections with I ≥ 2σ(I) were R1 = 0.0785 and wR2 = 0.1430, while the final R indexes for all the data were R1 = 0.1724 and wR2 = 0.1711. These values suggest that the structure refinement was successful and produced a reliable crystallographic model. The largest difference electron density peak and hole are 0.40 e/Å3 and −0.28 e/Å3, respectively, reflecting the quality of the electron density map.
3.2.2. Quantifying Intermolecular Interactions: A Hirshfeld Surface Analysis
Interactions between atoms in the crystal of the CBP-TPB complex were investigated using Hirshfeld surface analysis. Figure 2a and Figure 3a–d show the CBP-TPB complex Hirshfeld surface mapped using dnorm, di, de, shape index, curvedness, and fragment patch, respectively. The distance between the atoms existing in the crystal system is described by the sum of the di and de pair. Lists of all 3D surfaces with their lowest, maximum, and mean values as well as their dnorm, di, de, shape index, curvedness, and fragment values are given in Supplementary Materials, Figure S1.
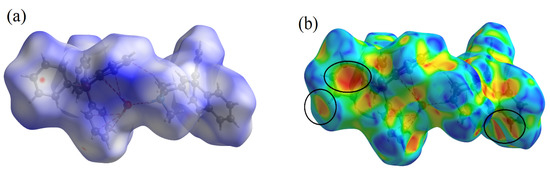
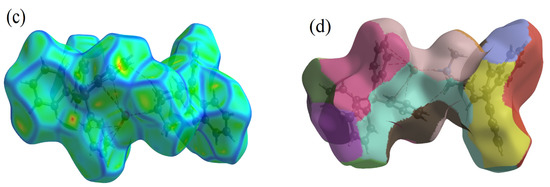
Figure 2.
Depiction of the Hirshfeld surface for the CBP-TPB complex, showcasing (a) dnorm, visualization of the complex where red denotes negative values, white corresponds to zero, and blue represents positive values. (b) Shape index, emphasizing the presence of red and blue triangles enclosed by the black ellipse, signifying bumps and hollow areas on the shape index surface, respectively. (c) Curvedness, identifying planar (green) and curved (blue edge) regions relevant to planar stacking interactions, and (d) Fragment patches, unique (colored) areas based on atoms external to the Hirshfeld surface, illustrating the closest neighboring molecule.
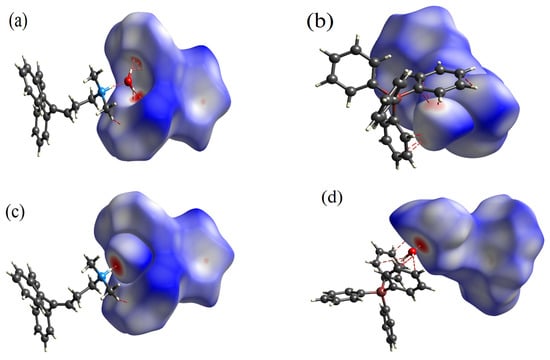
Figure 3.
Three-dimensional Hirshfeld surfaces, featuring dnorm property mapping, illustrating noncovalent homodimers: (a) anionic dimer, (b) cationic dimer in the presence of water, (c) anionic dimer with water, and (d) cationic dimer established through O46···H91 hydrogen bond. Green dashed lines represent intermolecular contacts.
In the CBP-TPB complex, the dnorm value ranged from −0.0916–1.7427 Å, the shape index ranged from −1.00 to 1.00 Å, and the curvedness ranged from −4.00 to 4.00 Å, as shown in Supplementary Materials, Figure S1. The dnorm surface has brick-red circular patches, representing close interaction with surrounding molecules; a hydrogen connection between O–H and N–H was discovered despite the fact that the intermolecular H–H, N–H, and C–H interactions were defined by blue and white patches. Because the O atom has a greater electronegativity (3.34) than the N atom (3.04), it is possible that the oxygen atom had the most influence on the electron density on the H atom. One of the key characteristics of Hirshfeld analysis is the shape index, which identifies complementarity between molecules in crystal packing [38]. Patches of varied colors on a “shape index” surface exhibiting intermolecular complementarity zones are shown in Figure 2b. The pi-stacked molecules in the concave section are represented by red highlighted patches. The ring structure of the molecule inside the crystal surface is depicted by the convex area in blue.
Curvature is used to determine the surface area of a molecule’s shape [39]. The electrostatic contact between the molecules is represented by the curvature. Figure 2c depicts the curvedness of the CBP-TPB complex, which ranges between −4.00 and 4.00. Low curvedness on the surface refers to flat disc-like regions, but high curvedness corresponds to sharp edge-like curvature that is likely to stretch the surface into patches, indicating contact between neighboring molecules. The blue edge that divides flat parts illustrates π–π stacking interactions. Two-dimensional fingerprint pictures reflect the type of intermolecular interactions between atoms, as well as the variations in these patterns, and they are a significant intermolecular link in the overall crystal structure [38]. The fingerprint plot specifically reveals that all components of the molecule are in close proximity. Two-dimensional fingerprint plots of distinct intermolecular interactions of CBP-TPB complex and corresponding dnorm figures along with the proportion of intermolecular contacts provided by each atom are available in Supplementary Materials, Figure S1.
These 2D plots revealed small spikes, such as a pseudo-symmetrical region with a high concentration of blue color that encircled the entire contributing area. Almost all of the exchanges listed above provide information about the 3D network of the CBP-TPB complex [38]. The enrichment ratio was determined in order to confirm the accuracy of the data on the contribution of bonds produced in the molecule. Because of the enormous amount of hydrogen on the molecular surface, H…H contacts were the most stable (around 69.4%) in the CBP-TPB complex. In the CBP-TPB complex, according to calculations, H–H bonds created 69.4% of the molecular surface, accompanied by C–H with 28.0%, C–C with 1.7%, and O–H with 0.8%, as shown in Supplementary Materials, Figure S1.
The interaction data reveal that H···O and C···H contacts in all of the anion-bound complexes as well as the receptor molecule have relatively higher contributions in comparison to the N···H contacts (Table 2). This discrepancy may be due to a greater number of C–H···O or N–H···O contacts associated with the oxyanion-bound coordinated structures of the neutral receptor segments. Hence, the interaction spots including C–H···O or N–H···O H–bonding contacts were observed prominently on the crystal structure surface. As a result, the solid-state results obtained from SCXRD studies are validated by these data and the information collected from Hirshfeld surfaces, the relevant 2D FPs of free ligand segments, and negatively charged ion-bound receptor complexes.
Table 2.
Hydrogen Bonds for CBP-TPB complex.
3.2.3. Quantum Theory of Atoms in Molecules (QTAIM) Analysis
The topological AIM analysis calculations are directly related to any chemical bond, including hydrogen bonding, which is characterized by the existence of a bond critical point (BCP) [40]. In order to understand the nature and strength of the hydrogen bonding interactions in the CBP-TPB complex, we further investigated them with the help of the Multiwfn software based on Bader’s AIM theory. The AIM graph displaying all the BCPs is presented in Figure 4. There are nine BCPs (BCP20, BCP29, BCP34, BCP41, BCP49, BCP56, BCP91 and BCP95) between LIG, H2O, and TTB in the reaction paths of C25···H47, H19···C25, C3···H30, C36···H48, H8···C36, O46···H91, C71···H78, C29···H84, and C31···H88, respectively. The nature of the chemical bonds and molecular reactivity is described by the total electron density ρ(r), Laplacian electron density ▽2ρ(r), and electron energy density H(r), which is composed of the electron potential energy density V(r). The values of the AIM topological parameters of C25···H47, H19···C25, C3···H30, C36···H48, H8···C36, O46···H91, C71···H78, C29···H84, and C31···H88 for the complex are listed in Table 3 [32,33].
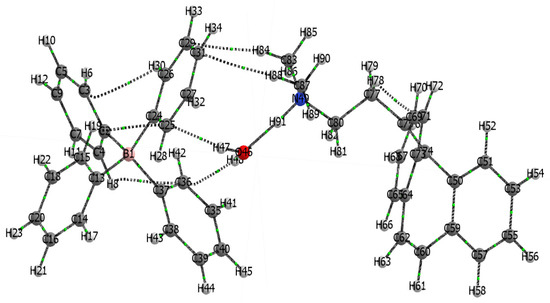
Figure 4.
Representation of atoms in molecules (AIM) graph for the CBP-TPB complex. This figure illustrates three molecules within the CBP-TPB complex. Atoms are depicted as colored spheres, with each hue corresponding to a distinct element: blue for nitrogen, pink for boron, red for oxygen, the conventional color for carbon, and white for hydrogen. Atom numbering ranges from 1–45 for the first TPB molecule, 46–48 for the water molecule, and 49–91 for the CBP molecule.
Table 3.
The AIM properties of selected values for the main interactions in EAMT. These properties include the electronic density (ρ(r)), Laplacian of density (∇2ρ(r)), Hamiltonian kinetic H(r), Ellipticity (ɛ(r)), Lagrangian kinetic G(r), and density of potential energy (V(r)).
Rozas et al. [41] and Fuster et al. [42] proposed that these criteria can be employed to characterize interaction types. Interactions can be categorized as strong or extremely strong hydrogen bonds (covalent interactions) when ∇2ρ(r) < 0 and H(r) < 0, moderate hydrogen bonds when ∇2ρ(r) > 0 and H(r) < 0, and weak hydrogen bonds when ∇2ρ(r) > 0 and H(r) > 0. The |V(r)|/G(r) ratio is utilized for bonding characterization in three regions, specifically, closed shell interaction: |V(r)|/G(r) < 1, intermediate: 1 < |V(r)|/G(r) < 2, and shared shell interaction: |V(r)|/G(r) > 2. Additionally, van der Waals interactions contribute to the molecular structure.
As shown in Table 2, the intermolecular and intramolecular bonds within and between the three compounds (comp1, comp2, and comp3) was analyzed using the QTAIM approach and the calculated topological parameters. The focus was on electron density (ρ(r)), Laplacian values (∇2ρ(r)), ellipticity (ε), Hamiltonian kinetic energy (H(r)), and the |V(r)|/G(r) ratio to classify the interactions.
Intramolecular interactions: TPB: BCP29 (H19–C25), BCP34 (C3–H30), and BCP49 (H8–C36) display weak hydrogen bonds, as indicated by ∇2ρ(r) > 0 and H(r) > 0. These interactions contribute to the stability of the molecular structure.
CBP: BCP91 (C71–H78) exhibits a weak hydrogen bond, as indicated by ∇2ρ(r) > 0 and H(r) > 0. This interaction may influence the conformation, stability, and reactivity of CBP.
Intermolecular Interactions:
CBP–Water: BCP20 (C25–H47) and BCP41 (C36–H48) show closed-shell interactions, as evidenced by the |V(r)|/G(r) ratio (0.9318 and 0.8965, respectively) being less than 1. These interactions are attributed to van der Waals forces, indicating that comp1 can interact with water molecules, potentially affecting its solubility and reactivity in aqueous environments.
CBP-TPB: BCP95 (C29–H84) and BCP100 (C31–H88) display closed-shell interactions, as indicated by the |V(r)|/G(r) ratio (0.7584 and 0.7605, respectively) being less than 1. These interactions are attributed to van der Waals forces, suggesting that comp1 and comp3 can form non-covalent interactions with each other. This information could be valuable for designing new drug candidates based on comp3, as the non-covalent interactions with other molecules can affect the compound’s binding affinity, selectivity, and biological activity.
CBP-Water: BCP56 (O46–H91) shows an intermediate interaction, as indicated by the |V(r)|/G(r) ratio (1.1799) being between 1 and 2. This interaction suggests that comp2 and comp3 can form moderate hydrogen bonds, which may have implications for the solubility and reactivity of comp3 in aqueous environments.
3.2.4. NCl-RDG Analysis
The NCI-RDG analysis for the CBP-TPB complex was performed to determine the non-covalent interactions (NCIs) among the compound’s different entities. This approach is effective in providing details about weak NCIs in real space and visualizing regions where these interactions occur. It can differentiate between hydrogen bonding, van der Waals forces, and repulsive steric interactions using simple color codes [43,44]. Figure 5 presents the NCI scatter diagrams and RDG isosurfaces for the CBP-TPB complex. The red regions represent strong repulsion, blue regions correspond to strong attraction, and green regions signify electrostatic interactions. The function sign(λ2)ρ, which results from the combination of the sign of λ2 (the second largest eigenvalue of the Hessian matrix of electron density) and ρ, is employed to distinguish hydrogen bond interactions from other types of interactions.
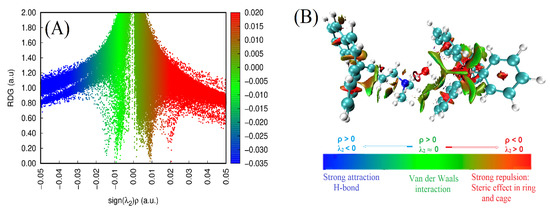
Figure 5.
(A) Scatter plot representing non-covalent interactions (NCI) and (B) reduced density gradient (RDG) examination of the CBP-TPB complex.
As depicted in Figure 5A, the values of sign(λ2)ρ range from −0.05 to 0.05 atomic units (a.u.). The absence of spikes on the left is related to negative sign(λ2)ρ, while the spikes on the right are associated with positive sign(λ2)ρ, with the smallest positive value in red being 0.02 a.u. This indicates that strong hydrogen bonding, van der Waals forces, and steric interactions collectively contribute to the high stability of the CBP-TPB complex [37].
In the RDG isosurface map (Figure 5B), green and red regions represent the presence of van der Waals forces and steric effects within the CBP-TPB complex, respectively. Moreover, the blue circular intermolecular hydrogen bonding regions imply that the complex has hydrogen bonding interactions in these areas, with a bluer isosurface suggesting a stronger hydrogen bond. As illustrated in Figure 6, the hydrogen bond interaction of O46···H91 is robust, promoting system stability. This finding is in line with the topological analysis discussed in Section 3.2.3.
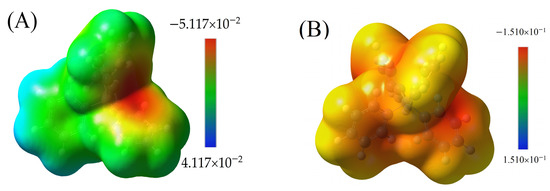
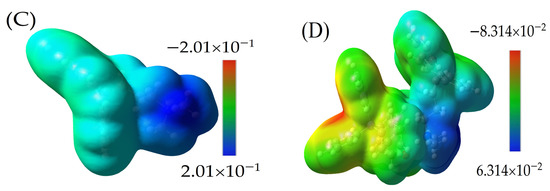
Figure 6.
The MESP for (A) TPB neutral molecule, ranging from −5.117 × 10⁻² to 4.117 × 10⁻², with a red region (negative) found around boron; (B) negative ion of TPB, covered by yellow to orange on all surfaces and the red region around carbons bonded to boron, ranging from −1.510 × 10⁻¹ to 1.510 × 10⁻¹; (C) positive ion of CBP molecule, with blue color around amine groups, ranging from −2.010 × 10⁻¹ to 2.010 × 10⁻¹; and (D) MESP for the CBP-TPB complex, ranging from −8.314−2 to 6.314−2. This range highlights the electrostatic interactions occurring between CBP and TPB within the complex. The interaction between the two molecules can be attributed to the complementary electrostatic properties, where the high electron-density regions of CBP (blue) interact with the low electron-density regions of TPB (red).
3.2.5. Interaction Energies (IE)
The results presented demonstrate the effectiveness of the DFT technique at the B3LYP level with the 6–311G (d,p) basis set for determining the most stable configurations and binding energies of the structures. In this case, the complexation energy and BSSE energy of the cyclobenzaprine cation, tetraphenylborate anion, and crystalline water (CBP-TPB) (molar ratio 1:1:1) were computed, as shown in Table 4. The salts formed between the cyclobenzaprine cation and the tetraphenylborate anion in the gas phase exhibit a complexation energy (corrected) of −146.86 kcal/mole and a BSSE energy of 0.0378. These values indicate that both salts have a low formation energy, suggesting that the complexes are stable. The negative complexation energy further supports this interpretation, as it implies that the complexes can be spontaneously produced, making their formation energetically favourable.
Table 4.
Corrected interaction energies (∆E) and ∆EBSSE (in kcal mol−1) calculated at the B3LYP/6–311G(d,p) theoretical level.
This finding is consistent with the experimental procedure and confirms the stability of the complexes formed between the cyclobenzaprine cation and the tetraphenylborate anion in the presence of crystalline water.
3.2.6. Chemical Reactivity Study
The Global Reactivity Descriptors
The global reactivity descriptors can provide insights into the formation of the CBP-TPB complex from the interaction between the cation CBP and the anion TPB. By comparing the reactivity of the cation and anion, we can better understand the driving forces behind complex formation. Table 5 below summarizes the computed values for various reactivity descriptors:
Table 5.
Comparison of Global Reactivity Descriptors for CBP-TPB Complex Formation: A Quantitative Analysis of the Cation CBP and Anion TPB’s Chemical Reactivity Properties.
The interaction between the cation CBP and the anion TPB to form the complex CBP-TPB can be understood through their contrasting reactivity properties:
Mulliken electronegativity: TPB has significantly higher electronegativity than CBP, indicating that TPB has a stronger ability to attract electrons. This difference in electronegativity can drive ionic interactions as TPB attracts electrons from CBP, facilitating complex formation. A high electronegativity value would indicate that the oxygen atom in water has a strong ability to attract electrons.
Chemical potential: The chemical potential of TPB is more negative compared with CBP, suggesting that TPB is more stable and less prone to losing electrons. Conversely, CBP has a higher chemical potential, indicating it is more likely to lose electrons. This difference in chemical potential can promote electron transfer from CBP to TPB, fostering complex formation. A negative chemical potential would suggest that H2O would be more stable and less likely to lose electrons.
Vertical ionization potential (IP) and vertical electron affinity (EA): TPB has a higher IP and EA than CBP, meaning TPB is more resistant to losing electrons and more likely to gain electrons. This difference in IP and EA can promote electron transfer from CBP to TPB, contributing to the formation of the CBP-TPB complex. High IP and EA values would imply that water is more resistant to losing electrons and more likely to gain electrons, respectively.
Electrophilicity and nucleophilicity indices: TPB exhibits a higher electrophilicity index, indicating its propensity to accept electrons. In contrast, CBP has a higher nucleophilicity index, suggesting its preference for donating electrons. The contrasting electrophilic and nucleophilic tendencies of TPB and CBP, respectively, can drive the formation of the CBP-TPB complex. These indices can help us understand the propensity of water to accept or donate electrons in chemical reactions.
Hardness and softness: Hardness represents the resistance of a molecule to changes in electron density. A high hardness value would suggest that water is more resistant to such changes. Softness, on the other hand, would indicate the molecule’s susceptibility to changes in electron density.
Discussion on the Analysis of Frontier Molecular Orbitals (FMOs) Based on the Given Results
Frontier molecular orbital (FMO) theory is a crucial tool in understanding the reactivity and reaction mechanisms of molecules in quantum chemistry. FMOs, which include the highest occupied molecular orbital (HOMO) and lowest unoccupied molecular orbital (LUMO), are the primary orbitals that participate in chemical reactions. The importance of HOMO and LUMO energy levels in determining the electron-donating and electron-accepting abilities of molecules has been highlighted in the given results. The HOMO energy (EHOMO) is directly proportional to the electron-donating ability of a molecule. As EHOMO increases, the electron-donating ability of the molecule also increases. On the other hand, the LUMO energy (ELUMO) is inversely proportional to the electron-accepting ability of the molecule. Therefore, a decrease in ELUMO corresponds to an increase in the electron-accepting ability.
The study analyzed the frontier molecular orbitals of CBP, water, and TPB after optimizing their structures using the B3LYP/6–31G(d,p) method. The resulting frontier orbital parameters, including EHOMO, ELUMO, and the electrophilicity index (ω), are presented in Table 6 below.
Table 6.
Frontier orbital parameters: EHOMO, ELUMO, and ω of CBP and TPB.
From Table 6, it can be observed that CBP has a higher EHOMO (−8.211 eV) compared with TPB (−5.937 eV). This indicates that CBP has a greater electron-donating ability than TPB. Similarly, CBP has a lower ELUMO (−3.821 eV) compared with TPB (−1.395 eV), which implies that CBP has a higher electron-accepting ability than TPB.
The electrophilicity index (ω) is another parameter that can be used to determine the reactivity of molecules. A higher ω value suggests a greater electrophilic nature of the molecule. In the given results, TPB has a significantly higher electrophilicity index (4.1820) compared to CBP (0.0297), indicating that TPB is more electrophilic and susceptible to nucleophilic attack.
Molecular Electrostatic Nature of Interactions—MESP
The molecular electrostatic potential (MESP) is an essential aspect to evaluate when analyzing molecular interactions within a complex, such as the CBP-TPB system. MESP provides insights into the electrostatic properties of the molecules, which in turn helps to elucidate the interaction mechanisms and behavior of the complex. In contrast, Figure 6A,B illustrate the MESP for the neutral and anionic TPB molecules, respectively. In both cases, a red region is observed on the phenyl ring, with MESP values of −0.155 a.u. for the anion and −5.117 × 10⁻² a.u. for the neutral molecule. The red region signifies electron-rich areas, or “shells”, which can potentially interact with the electron-poor regions in CBP.
Figure 6C presents the MESP for CBP, highlighting the blue region around the amine groups with a MESP value of 0.201 a.u. This value is obtained by mapping the electron density total SCF density (isoval = 0.0004) with ESP. The blue region indicates electron-poor areas, or “holes”, which are particularly significant for electrostatic interactions. Figure 6D presents the MESP for the CBP-TPB complex, ranging from −8.314 × 10⁻² to 6.314 × 10⁻². This range highlights the electrostatic interactions occurring between CBP and TPB within the complex. The interaction between the two molecules can be attributed to the complementary electrostatic properties, where the electron-poor regions of CBP (blue) interact with the electron-rich regions of TPB (red).
The analysis of the MESP for CBP, TPB, and the CBP-TPB complex sheds light on the electrostatic properties of the system and the interaction between CBP and TPB. Understanding these electrostatic interactions is essential for comprehending the behavior and function of the CBP-TPB complex. Further studies focusing on other molecular properties, such as intermolecular interactions and atomic charge distributions, could provide a more comprehensive understanding of the complex and its potential applications [45,46].
3.2.7. UV Spectral Analysis
The study presents an analysis of the electronic absorption spectrum for a specific chemical structure using UV-vis spectroscopy. The researchers conducted the analysis in both gas and acetonitrile solvent phases. For the computational part, they employed the time-dependent density functional theory (TD-DFT) IEFPCM model at the B3LYP/6–311G(d,p) theoretical level on the optimized ground-state geometry.
The acquired absorption spectra were investigated at room temperature in aqueous solvents with a concentration of 50 ppm. The resulting plots are displayed in Figure 7. The researchers determined the experimental maximum wavelength (λmax) and absorbance at room temperature, and the data are provided in Table 6.
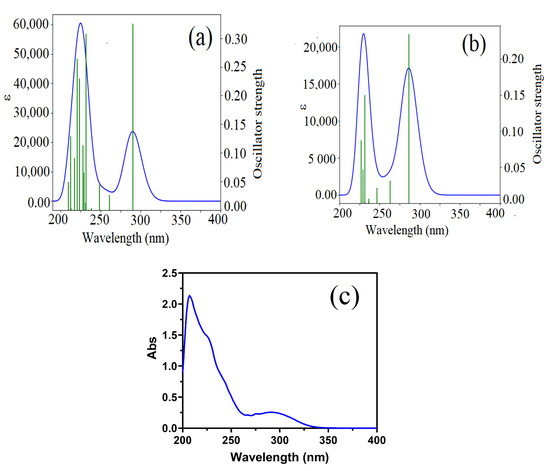
Figure 7.
(a,b) Absorption spectra obtained through TD-DFT calculations for complex in the acetonitrile solvent and gas phase, respectively. (c) Experimentally measured absorption spectrum of the target complex in acetonitrile solvents at room temperature.
Various parameters such as dipole moment (μ, D), main absorption energy (E), oscillator strength (f), maximum wavelength (max), electronic transition of excitation energy, and atomic orbital contribution were computed in both solvent and gas phases. The corresponding data are shown in Table 7.
Table 7.
Computed energy values, dipole moments (D), peak absorption wavelengths (λmax), excitation energies (eV), oscillator strengths (f), identification of electronic transitions (HOMO(H) → LUMO(L)), and primary contributions (%) for the target compound’s S1 and S2 excited states in the gas phase.
The analysis of the UV-vis spectra revealed that the molecule exhibited different absorption bands in the gas phase and the acetonitrile solvent phase. These differences can be attributed to the solvent effect, which influences the electronic structure and transitions within the molecule due to various factors such as solvent polarity, solute-solvent interactions, and solvent-induced conformational changes.
The high-intensity bands observed in the acetonitrile solvent phase at 290.2 nm, 223.5 nm, and 220.8 nm, and in the gas phase at 286.4 nm and 231.4 nm, are attributed to the n → π* electronic transition. The n → π* transition typically involves the promotion of an electron from a non-bonding orbital (n) to an anti-bonding pi orbital (π*). This type of transition is commonly observed in molecules containing multiple bonds, such as carbonyl groups, double bonds, or triple bonds.
The calculated parameters, such as dipole moment, main absorption energy, oscillator strength, maximum wavelength, electronic transition of excitation energy, and atomic orbital contribution, provide valuable insights into the molecule’s behavior in different environments. For example, the dipole moment in the acetonitrile solvent phase (17.6 D) is lower than in the gas phase (21.9 D), suggesting that the solvent environment affects the molecule’s overall charge distribution. Additionally, the major % contribution column in Table 5 indicates which electronic transitions have the most significant impact on the observed absorption bands.
The UV spectra analysis for the CBP-TPB complex indicates that there are differences between the maximum absorption spectra obtained through TD-DFT calculations for the complex in acetonitrile solvent and gas phase, with values of 290 nm and 286.4 nm, respectively. However, the experimentally measured absorption spectrum of the complex in acetonitrile solvent at room temperature is very close to the TD-DFT prediction in the same solvent, with a value of 291 nm (Table 6). This suggests that the theoretical calculations are a good approximation of the experimental results in this case, and that the complex is likely to absorb light at around 290 nm in acetonitrile solvent at room temperature. Overall, the comparison and interpretation of the UV spectra highlight the importance of both theoretical predictions and experimental measurements in understanding the electronic properties and absorption spectra of molecules in different environments [47].
3.2.8. NMR Spectral Analysis
The comparison of experimental and calculated NMR data for the title molecule demonstrates the potential of DFT-based computational methods for reliably predicting and interpreting NMR spectroscopic parameters. In this study, isotropic chemical shifts were calculated for 13C and 1H NMR in DMSO solution using the IEF-PCM model, with the results presented in Table 7.
Considering that the range of 13C NMR chemical shifts for analogous organic molecules is typically greater than 100 ppm [23,26], the accuracy of the calculated values in this study is deemed sufficient to allow for reliable interpretation of the data. As expected, the 13C NMR chemical shifts in the ring for the title molecule are greater than 100 ppm (Table 8).
Table 8.
Experimental and theoretical chemical shifts of MTX 13C and 1H NMR spectra.
The experimental carbon NMR spectrum displays sixteen peaks with varying intensities, which is less than the twenty peaks that would be expected based on the molecular formula. This observation suggests the presence of symmetry within the molecule, causing certain carbon atoms to be equivalent. The calculated carbon NMR spectrum shows twenty-two peaks in the range of 122.6 to 164.60 ppm, while the experimental data ranges from 124.1 to 175.7 ppm.
The calculated proton NMR chemical shifts demonstrate moderate agreement with the experimental values. This discrepancy can be attributed to the free rotation of one methyl group within the molecule. Due to this rotation, the chemical shifts associated with the protons in a given methyl group were averaged, resulting in equal values as observed in the experimental results. The calculations, however, yielded different isotropic shielding values, as a fixed geometry was employed for this purpose [48].
The observed difference in the carbon NMR data may be due to structural implications originating from the theoretical calculations. Despite this, the overall agreement between the experimental and calculated NMR data supports the validity of using DFT-based computational methods for predicting and interpreting NMR spectroscopic parameters. Further refinement of the computational models and inclusion of dynamic effects, such as the free rotation of methyl groups, could potentially improve the accuracy of these predictions and enhance the reliability of the calculated NMR data [48].
4. Conclusions
In conclusion, this comprehensive study utilized a multifaceted approach to investigate the structural properties, stability, and behavior of the cyclobenzaprine-tetraphenylboric (CBP-TPB) complex. A detailed crystallographic analysis revealed the complex’s monoclinic crystal system, unit cell dimensions, and refined atomic positions, providing valuable insights into its molecular geometries and supramolecular features. These insights have potential applications in various fields, such as pharmaceuticals and materials science. Hirshfeld surface analysis was employed to investigate the interactions within the CBP-TPB complex, providing valuable insights into the intermolecular contacts and complementarity between the molecules in the crystal packing. The prevalence of H...H contacts and the significance of H···O and C···H contacts were revealed in the complex. These findings, supported by solid-state results from single-crystal X-ray diffraction (SCXRD) studies, contribute to a better understanding of the structural properties and potential applications of the CBP-TPB complex.
The study also carried out QTAIM analysis for TPB, water, and CBP, revealing various types of intramolecular and intermolecular interactions, including weak hydrogen bonds and van der Waals interactions. Understanding these interactions is crucial for designing functional materials, catalysts, and drug candidates based on these compounds, leading to more efficient and selective systems for applications in chemistry, materials science, and biology.
The noncovalent interaction reduced density gradient (NCI-RDG) analysis of the CBP-TPB complex provided insights into the presence and contributions of hydrogen bonding, van der Waals forces, and steric interactions, highlighting the robust O46···H91 hydrogen bond interaction as a key factor promoting system stability. These findings contribute to our understanding of the CBP-TPB complex’s structural properties and potential applications. Global reactivity descriptors revealed that the formation of the CBP-TPB complex is primarily driven by differences in electronegativity, chemical potential, ionization potential, electron affinity, and electrophilicity/nucleophilicity indices between the cation CBP and the anion TPB. These differences promote electron transfer from CBP to TPB, leading to the formation of the ionic complex. The analysis of frontier molecular orbitals using the B3LYP/6–31G(d,p) method disclosed significant differences in the electron-donating and electron-accepting abilities of CBP and TPB, as well as their electrophilicity indices. Understanding these differences is essential for comprehending the reaction mechanisms and reactivity of these molecules.
Molecular electrostatic potential (MESP) analysis provided insights into the electrostatic properties of the system and the interaction between CBP and TPB. Further studies focusing on other molecular properties, such as intermolecular interactions and atomic charge distributions, could offer a more comprehensive understanding of the complex and its potential applications.
UV-vis spectroscopy analysis, in conjunction with computational methods like TD-DFT, demonstrated the potential for investigating molecular properties and understanding the behavior of molecules in various environments. This study compared the maximum absorption spectra of the CBP-TPB complex obtained through TD-DFT calculations and experimental measurements in different environments, emphasizing the importance of both theoretical predictions and experimental measurements in understanding the electronic properties and absorption spectra of molecules.
Furthermore, the study showcased the potential of DFT-based computational methods for reliably predicting and interpreting NMR spectroscopic parameters for 13C and 1H NMR in DMSO solution. Despite some discrepancies between experimental and calculated NMR data, the overall agreement supports the use of DFT-based methods for predicting NMR parameters. Further refinement of computational models and the inclusion of dynamic effects could potentially enhance the accuracy and reliability of these predictions.
Supplementary Materials
The following supporting information can be downloaded at: https://www.mdpi.com/article/10.3390/cryst13071088/s1, Figure S1: Over all, the surface structure of the complex.
Author Contributions
Conceptualization G.A.E.M.; methodology, G.A.E.M. and E.A.A. software, A.H.B.; validation, G.A.E.M., formal analysis, H.A.G.; investigation, H.A.G. and A.H.B.; resources G.A.E.M.; writing—original draft preparation, G.A.E.M., A.H.B., H.A.G., R.A.-S. and E.A.A. writing—review and editing, G.A.E.M., A.H.B., H.A.G., R.A.-S., O.S.A. and E.A.A. All authors have read and agreed to the published version of the manuscript.
Funding
The authors extend their appreciation to the Researchers Supporting Project, King Saud University, Riyadh, Saudi Arabia for funding this work through grant no. RSP-2023R353.
Data Availability Statement
All data are available from all authors.
Acknowledgments
The authors extend their appreciation to the Researchers Supporting Project, King Saud University, Riyadh, Saudi Arabia for funding this work through grant no. RSP-2023R353.
Conflicts of Interest
The authors declare no conflict of interest.
References
- Chou, R.; Peterson, K.; Helfand, M. Comparative efficacy and safety of skeletal muscle relaxants for spasticity and musculoskeletal conditions: A systematic review. J. Pain Symptom Manag. 2004, 28, 140–175. [Google Scholar] [CrossRef]
- Toth, P.E.; Urtis, J. Commonly used muscle relaxant therapies for acute low back pain: A review of carisoprodol, cyclobenzaprine hydrochloride, and metaxalone. Clin. Ther. 2004, 26, 1355–1367. [Google Scholar] [CrossRef]
- Khater, M.M.; Hassib, H.B.; Issa, Y.M.; Mohammed, S.H. Surface morphology changes of polymer membrane and carbon paste sertraline sensors. Talanta 2015, 134, 546–553. [Google Scholar] [CrossRef]
- AlRabiah, H.; Abounassif, M.A.; Al-Majed, A.; Mostafa, G.A.E. Comparative investigation of β- and γ-cyclodextrin as ionophores in potentiometric based sensors for naltrexone. Int. J. Electrochem. Sci. 2016, 11, 4930–4942. [Google Scholar] [CrossRef]
- Abdel-Raoof, A.M.; Osman, A.O.E.; El-Desouky, E.A.; Abdel-Fattah, A.; Abdul-Kareem, R.F.; Elgazzar, E. Fabrication of an (α-Mn2O3: Co)-decorated CNT highly sensitive screen printed electrode for the optimization and electrochemical determination of cyclobenzaprine hydrochloride using response surface methodology. RSC Adv. 2020, 10, 24985–24993. [Google Scholar] [CrossRef]
- Brown, T.; Lemay, E., Jr.; Bursten, B.; Murphy, C.; Langford, S.; Sagatys, D. Chemistry the Central Science: A Broad Perspective; Pearson Australia Group: Parkside, Australia, 2010. [Google Scholar]
- Giner, B.; Mergenbayeva, S.; Lomba, L.; Rafikova, K.; Dauletbakov, A.; Belyankova, Y.; Seilkhanov, T.; Zazybin, A. Synthesis and Ecotoxicological Studies of Ionic Compounds Based on Tolperisone, Diphenhydramine and Trimecaine. Chem. Sel. 2020, 5, 12823–12828. [Google Scholar] [CrossRef]
- Noda, A.; Hayamizu, K.; Watanabe, M. Pulsed-gradient spin− echo 1H and 19F NMR ionic diffusion coefficient, viscosity, and ionic conductivity of non-chloroaluminate room-temperature ionic liquids. J. Phys. Chem. B 2001, 105, 4603–4610. [Google Scholar] [CrossRef]
- Tokuda, H.; Ishii, K.; Susan, M.A.B.H.; Tsuzuki, S.; Hayamizu, K.; Watanabe, M. Physicochemical properties and structures of room-temperature ionic liquids. 3. Variation of cationic structures. J. Phys. Chem. B 2006, 110, 2833–2839. [Google Scholar] [CrossRef]
- Tokuda, H.; Tsuzuki, S.; Susan, M.A.B.H.; Hayamizu, K.; Watanabe, M. How ionic are room-temperature ionic liquids? An indicator of the physicochemical properties. J. Phys. Chem. B 2006, 110, 19593–19600. [Google Scholar] [CrossRef]
- Hunt, P.A.; Gould, I.R.; Kirchner, B. The structure of imidazolium-based ionic liquids: Insights from ion-pair interactions. Aust. J Chem. 2007, 60, 9–14. [Google Scholar] [CrossRef]
- Maiti, A.; Rogers, R.D. A correlation-based predictor for pair-association in ionic liquids. Phys. Chem. Chem. Phys. 2011, 13, 12138–12145. [Google Scholar] [CrossRef]
- Sofian, Z.M.; Harun, N.; Mahat, M.M.; Hashim, N.A.N.; Jones, S.A. Investigating how amine structure influences drug-amine ion-pair formation and uptake via the polyamine transporter in A549 lung cells. Eur. J. Pharm. Biopharm. 2021, 168, 53–61. [Google Scholar] [CrossRef]
- Wang, H.; Tian, Q.; Quan, P.; Liu, C.; Fang, L. Probing the role of ion-pair strategy in controlling dexmedetomidine penetrate through drug-in-adhesive patch: Mechanistic insights based on release and percutaneous absorption process. AAPS Pharm. Sci. Tech. 2020, 21, 4. [Google Scholar] [CrossRef]
- Al-Hamdani, Y.S.; Tkatchenko, A. Understanding non-covalent interactions in larger molecular complexes from first principles. J. Chem. Phys. 2019, 150, 010901. [Google Scholar] [CrossRef]
- Hajji, M.; Abad, N.; Habib, M.A.; Elmgirhi, S.M.H.; Guerfel, T. Computational chemistry methods for modelling non-covalent interactions and chemical reactivity—An overview. J. Indian Chem. Soc. 2021, 98, 100208. [Google Scholar] [CrossRef]
- Bakheit, A.H.; Attwa, M.W.; Kadi, A.A.; Ghabbour, H.A.; Alkahtani, H.M. Exploring the Chemical Reactivity, Molecular Docking, Molecular Dynamic Simulation and ADMET Properties of a Tetrahydrothienopyridine Derivative Using Computational Methods. Crystals 2023, 13, 1020. [Google Scholar] [CrossRef]
- Abuelizz, H.A.; Taie, H.A.; Bakheit, A.H.; Marzouk, M.; Abdellatif, M.M.; Al-Salahi, R. Biological Evaluation of 4-(1H-triazol-1-yl)benzoic Acid Hybrids as Antioxidant Agents: In Vitro Screening and DFT Study. Appl. Sci. 2021, 11, 11642. [Google Scholar] [CrossRef]
- Szatylowicz, H.; Jezierska, A.; Sadlej-Sosnowska, N. Correlations of NBO energies of individual hydrogen bonds in nucleic acid base pairs with some QTAIM parameters. Struct. Chem. 2016, 27, 367–376. [Google Scholar] [CrossRef]
- Hajji, M.; Al-Otaibi, J.S.; Belkhiria, M.; Dhifaoui, S.; Habib, M.A.; Elmgirhi, S.M.H.; Mtiraoui, H.; Bel-Hadj-Tahar, R.; Msaddek, M.; Guerfel, T. Structural and computational analyses of a 2-propanolammonium-chlorocadmate (II) assembly: Pivotal role of hydrogen bonding and H—H interactions. J. Mol. Struct. 2021, 1223, 128998. [Google Scholar] [CrossRef]
- Rezac, J.; Hobza, P. Benchmark calculations of interaction energies in noncovalent complexes and their applications. Chem. Rev. 2016, 116, 5038–5071. [Google Scholar] [CrossRef]
- Dolomanov, O.V.; Bourhis, L.J.; Gildea, R.J.; Howard, J.A.; Puschmann, H. OLEX2: A complete structure solution, refinement and analysis program. J. Appl. Crystallogr. 2009, 42, 339–341. [Google Scholar] [CrossRef]
- Sheldrick, G.M. Crystal structure refinement with SHELXL. Acta Crystallogr. Sect. C Struct. Chem. 2015, 71, 3–8. [Google Scholar] [CrossRef] [PubMed]
- Turner, M.J.; McKinnon, J.J.; Wolff, S.K.; Grimwood, D.J.; Spackman, P.R.; Jayatilaka, D.; Spackman, M.A. Crystal Explorer (v17); The University of Western Australia: Crawley, Australia, 2017. [Google Scholar]
- Altomare, A.; Ciriaco, F.; Cuocci, C.; Falcicchio, A.; Fanelli, F. Combined powder X-ray diffraction data and quantum-chemical calculations in EXPO2014. Powder Diffr. 2017, 32, S123–S128. [Google Scholar] [CrossRef]
- Brandenburg, K. DIAMOND; Crystal Impact GbR: Bonn, Germany, 2006. [Google Scholar]
- Frisch, M.J.; Trucks, G.W.; Schlegel, H.B.; Scuseria, G.E.; Robb, M.A.; Cheeseman, J.R.; Scalmani, G.; Barone, V.; Mennucci, B.; Petersson, G.A.; et al. Gaussian 09, Revision D.01; Gaussian Inc.: Wallingford, CT, USA, 2009; Volume 121, pp. 150–166. [Google Scholar]
- Dennington, R.; Keith, T.; Millam, J. Gauss View; Version 5; Semichem Inc.: Shawnee Mission, KS, USA, 2016; Volume 6. [Google Scholar]
- Raghavachari, K.; Trucks, G.W.; Pople, J.A.; Head-Gordon, M. A fifth-order perturbation comparison of electron correlation theories. Chem. Phys. Lett. 1989, 157, 479–483. [Google Scholar] [CrossRef]
- Bakheit, A.H.; Al-Salahi, R.; Al-Majed, A.A. Thermodynamic and Computational (DFT) Study of Non-Covalent Interaction Mechanisms of Charge Transfer Complex of Linagliptin with 2,3-Dichloro-5,6-dicyano-1,4-benzoquinone (DDQ) and Chloranilic acid (CHA). Molecules 2022, 27, 6320. [Google Scholar] [CrossRef]
- Ghabbour, H.A.; Bakheit, A.H.; Ezzeldin, E.; Mostafa, G.A.E. Synthesis Characterization and X-ray Structure of 2-(2,6-Dichlorophenylamino)-2-imidazoline Tetraphenylborate: Computational Study. Appl. Sci. 2022, 12, 3568. [Google Scholar] [CrossRef]
- Bakheit, A.H.; Ghabbour, H.A.; Hussain, H.; Al-Salahi, R.; Ali, E.A.; Mostafa, G.A. Synthesis and Computational and X-ray Structure of 2, 3, 5-Triphenyl Tetrazolium, 5-Ethyl-5-phenylbarbituric Acid Salt. Crystals 2022, 12, 1706. [Google Scholar] [CrossRef]
- Mostafa, G.A.; Bakheit, A.H.; Al-Agamy, M.H.; Al-Salahi, R.; Ali, E.A.; Alrabiah, H. Synthesis of 4-Amino-N-[2 (diethylamino)Ethyl]Benzamide Tetraphenylborate Ion-Associate Complex: Characterization, Antibacterial and Computational Study. Molecules 2023, 28, 2256. [Google Scholar] [CrossRef]
- Jeroundi, D.; Sebbar, N.K.; Hökelek, T.; Rodi, Y.K.; Mazzah, A.; Renard, C.; Chakroune, S. Crystal structure, Hirshfeld surface analysis and interaction energy and DFT studies of 10-allyl-pyrrolo [2, 1-c][1, 4] benzodiazepine-5, 11-dione. Moroc. J. Heterocycl. Chem. 2020, 9, 43–54. [Google Scholar]
- Pendás, Á.M.; Gatti, C. 3 Quantum Theory of Atoms in Molecules and the AIMAll Software. Complement. Bond. Anal. 2021, 43. [Google Scholar]
- Humphrey, W.; Dalke, A.; Schulten, K. VMD: Visual molecular dynamics. J. Mol. Graph. 1996, 14, 33–38. [Google Scholar] [CrossRef] [PubMed]
- Srivastava, R. Chemical reactivity theory (CRT) study of small drug-like biologically active molecules. J. Biomol. Struct. Dyn. 2021, 39, 943–952. [Google Scholar] [CrossRef] [PubMed]
- Spackman, M.A.; Jayatilaka, D. Hirshfeld surface analysis. Cryst. Eng. Comm. 2009, 11, 19–32. [Google Scholar] [CrossRef]
- Ahmed, A.; Fatima, A.; Shakya, S.; Rahman, Q.I.; Ahmad, M.; Javed, S.; AlSalem, H.S.; Ahmad, A. Crystal structure, topology, DFT and hirshfeld surface analysis of a novel charge transfer complex (L3) of anthraquinone and 4-{[(anthracen-9-yl) meth-yl] amino}-benzoic acid (L2) exhibiting photocatalytic properties: An experimental and theoretical approach. Molecules 2022, 27, 1724. [Google Scholar] [PubMed]
- Kolandaivel, P.; Nirmala, V. Study of proper and improper hydrogen bonding using Bader’s atoms in molecules (AIM) theory and NBO analysis. J. Mol. Struct. 2004, 694, 33–38. [Google Scholar] [CrossRef]
- Rozas, I.; Alkorta, I.; Elguero, J. Behavior of ylides containing N, O, and C atoms as hydrogen bond acceptors. J. Am. Chem. Soc. 2000, 122, 11154–11161. [Google Scholar] [CrossRef]
- Fuster, G.; Schuhmacher, M.; Domingo, J.L. Human exposure to dioxins and furans: Application of the substance flow analysis to health risk assessment. Environ. Sci. Pollut. Res. 2002, 9, 241–249. [Google Scholar] [CrossRef]
- Abuelizz, H.A.; Bakheit, A.H.; Marzouk, M.; Abdellatif, M.M.; Al-Salahi, R. Reactivity of 4, 5-Dichlorophthalic Anhydride towards Thiosemicarbazide and Amines: Synthesis, Spectroscopic Analysis, and DFT Study. Molecules 2022, 27, 3550. [Google Scholar] [CrossRef]
- Haque, A.; Alenezi, K.M.; Khan, M.S.; Wong, W.Y.; Raithby, P.R. Non-covalent interactions (NCIs) in π-conjugated functional materials: Advances and perspectives. Chem. Soc. Rev. 2023, 52, 454–472. [Google Scholar] [CrossRef]
- Mostafa, G.A.; Bakheit, A.; AlMasoud, N.; AlRabiah, H. Charge Transfer Complexes of Ketotifen with 2,3-Dichloro-5,6-dicyano-p-benzoquinone and 7,7,8,8-Tetracyanoquodimethane: Spectroscopic Characterization Studies. Molecules 2021, 26, 2039. [Google Scholar] [CrossRef]
- Abuelizz, H.A.; Taie, H.A.A.; Bakheit, A.H.; Mostafa, G.A.E.; Marzouk, M.; Rashid, H.; Al-Salahi, R. Investigation of 4-Hydrazinobenzoic Acid Derivatives for Their Antioxidant Activity: In Vitro Screening and DFT Study. ACS Omega 2021, 6, 31993–32004. [Google Scholar] [CrossRef] [PubMed]
- Nemykin, V.N.; Hadt, R.G.; Belosludov, R.V.; Mizuseki, H.; Kawazoe, Y. Influence of Molecular Geometry, Exchange-Correlation Functional, and Solvent Effects in the Modeling of Vertical Excitation Energies in Phthalocyanines Using Time-Dependent Density Functional Theory (TDDFT) and Polarized Continuum Model TDDFT Methods: Can Modern Computational Chemistry Methods Explain Experimental Controversies? J. Phys. Chem. A 2007, 111, 12901–12913. [Google Scholar] [PubMed]
- Ayyappan, S.; Sundaraganesan, N.; Aroulmoji, V.; Murano, E.; Sebastian, S. Molecular structure, vibrational spectra and DFT molecular orbital calculations (TD-DFT and NMR) of the antiproliferative drug Methotrexate. Spectrochim. Acta Part A Mol. Biomol. Spectrosc. 2010, 77, 264–275. [Google Scholar] [CrossRef] [PubMed]
Disclaimer/Publisher’s Note: The statements, opinions and data contained in all publications are solely those of the individual author(s) and contributor(s) and not of MDPI and/or the editor(s). MDPI and/or the editor(s) disclaim responsibility for any injury to people or property resulting from any ideas, methods, instructions or products referred to in the content. |
© 2023 by the authors. Licensee MDPI, Basel, Switzerland. This article is an open access article distributed under the terms and conditions of the Creative Commons Attribution (CC BY) license (https://creativecommons.org/licenses/by/4.0/).