Article

Properties of Potassium Doped and Tantalum Containing Tungsten after Heavy Ion Irradiation

1
Fusion Science Center, Southwestern Institute of Physics, Chengdu 610225, China
2
Key Laboratory of Radiation Physics and Technology of Ministry of Education, Institute of Nuclear Science and Technology, Sichuan University, Chengdu 610064, China
*
Author to whom correspondence should be addressed.
Crystals 2023, 13(6), 951; https://doi.org/10.3390/cryst13060951
Submission received: 18 May 2023 / Revised: 10 June 2023 / Accepted: 12 June 2023 / Published: 14 June 2023

Abstract

:
Tungsten potassium (WK) alloy has been reported as one of the ideal plasma-facing materials (PFMs). Tantalum alloying is a good method to improve the mechanical properties of tungsten. The effect of tantalum contents on the irradiation resistance of WK alloy has not yet been reported. In this study, WK (containing 82 ppm potassium) alloy with 1 wt. % Ta and 3 wt. % Ta, specifically WK-1Ta and WK-3Ta, were fabricated with sparking plasma sintering and irradiated with 7.5 MeV W2+ ion. The relative densities of WK-1Ta and WK-3Ta are 97.2% and 96.4%, respectively. The average grain sizes of WK-1Ta and WK-3Ta are 2.08 μm and 1.51 μm, respectively. The Vickers hardness of WK-3Ta is nearly 20% higher than that of WK-1Ta, both before and after irradiation. Irradiation hardening was confirmed by nano indentation test results. After irradiation, the number of dislocation loops formed in WK-1Ta and WK-3Ta are very similar, and the dislocation loop density of WK-3Ta is only slightly higher than that of WK-1Ta. This phenomenon is consistent with nano hardness analysis results. Compared to the reported nano hardness results of WK alloys, both WK-1Ta and WK-3Ta had higher hardness than the WK alloys before irradiation. Compared to the irradiation hardening results for the reported WK alloys, the existence of Ta may have positive influence on resistance to irradiation hardening.

1. Introduction

Tungsten (W) is considered to be one of the most promising candidates among plasma-facing materials (PFMs) due to its unique properties, such as low hydrogen isotope retention, low sputtering yield and a high melting point [1,2,3]. However, drawbacks, such as a high ductile-to-brittle transition temperature (DBTT), brittleness at low temperature and brittleness due to neutron irradiation are obstacles to the engineering applications of tungsten. The designs of W-based alloys with ductile dopants are an effective means of mitigating these disadvantages. Potassium doping has already proved its efficiency in suppressing secondary recrystallization and controlling grain growth up to 1900 °C in tungsten thin wires, and therefore shows extraordinary properties at elevated temperatures [4]. Potassium-doped (K-doped) tungsten bulk material becomes an attractive candidate for the plasma-facing material as well [5,6,7,8,9]. It has been reported that the K-doped tungsten fabricated with sparking plasma sintering (SPS) shows good thermal conductivity, as well as strong mechanical properties at temperatures from RT to 50 °C [6]. Alloying elements like tantalum (Ta), vanadium (V), chromium (Cr) and rhenium (Re) are also being intensively studied [10,11,12,13,14,15]. It has been reported that tantalum alloying contributes to improving the hardness and bending strength of W [14], and can be expected to suppress surface blistering and reduce the deuterium retention in tungsten [15]. Therefore, W-Ta alloy has attracted great interest among fusion material researchers. Considering the respective advantages of potassium bubble and tantalum alloy strengthening, it is interesting to investigate the properties of tungsten material containing both potassium and tantalum.
When serving as a plasma-facing material (PFM), tungsten is expected to face severe environments, including high thermal fluxes, neutron irradiation, deuterium (D) and helium (He) plasma exposure, etc. [16,17,18,19]. In the case of the International Thermonuclear Experimental Reactor (ITER), high-energy neutron irradiation can produce serious displacement damage in PFM, and the accumulated damage level is expected to reach 15 dpa for divertor armor after operating for 5 years [20]. Displacement damages due to neutron irradiation, such as dislocation, vacancy, phase change and transmutation may cause degeneration of the material. Irradiation hardening, decrease in ductility and increase in the ductile-to-brittle transition temperature (DBTT) are often reported in tungsten material after irradiation [21,22]. The effect of tantalum contents on the irradiation resistance of WK alloy has not yet been reported. Therefore, it is important to investigate the mechanical properties of the material under the displacement damage service environment when developing WK-Ta alloy for PFM application. Heavy ion irradiation is normally used to simulate neutron irradiation for generating displacement damage on materials considering the cost and safety issues.
In this work, WK (containing 82 ppm potassium) alloy with 1 wt. % Ta and 3 wt. % Ta (WK-1Ta and WK-3Ta) were fabricated with the SPS powder metallurgy method. Microstructure, density and micro-hardness before and after W2+ ion irradiation were investigated.

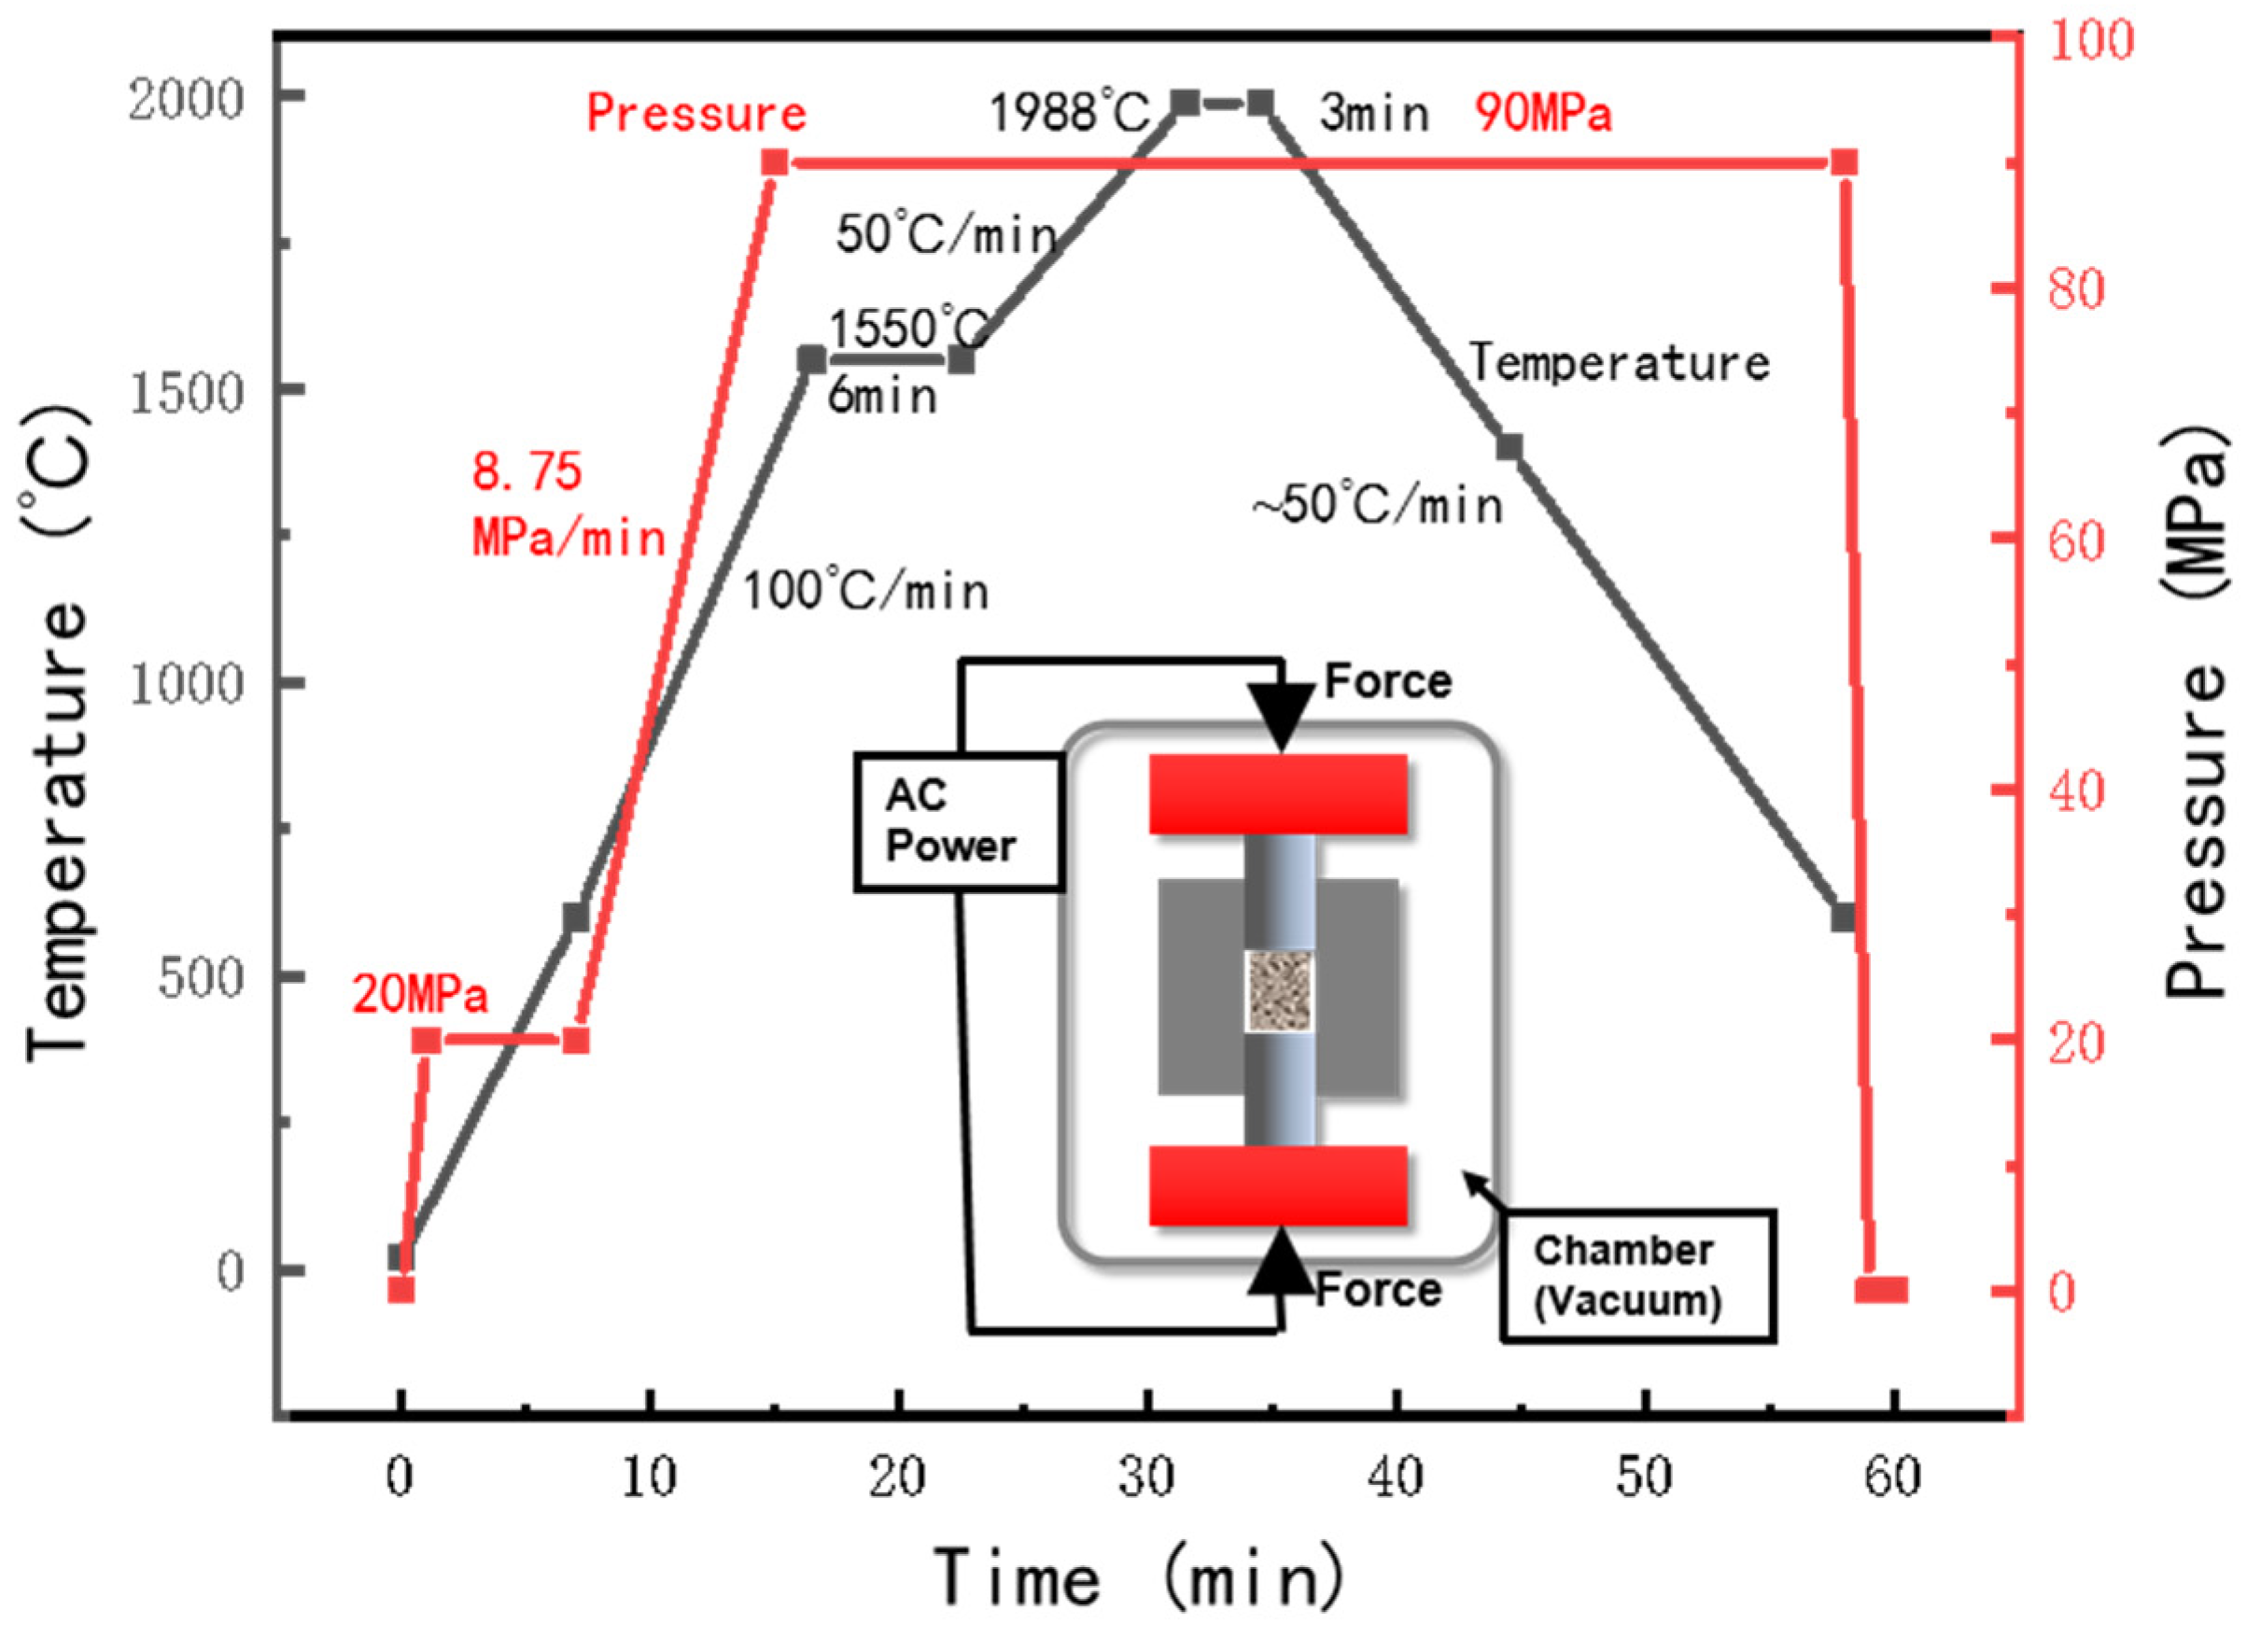
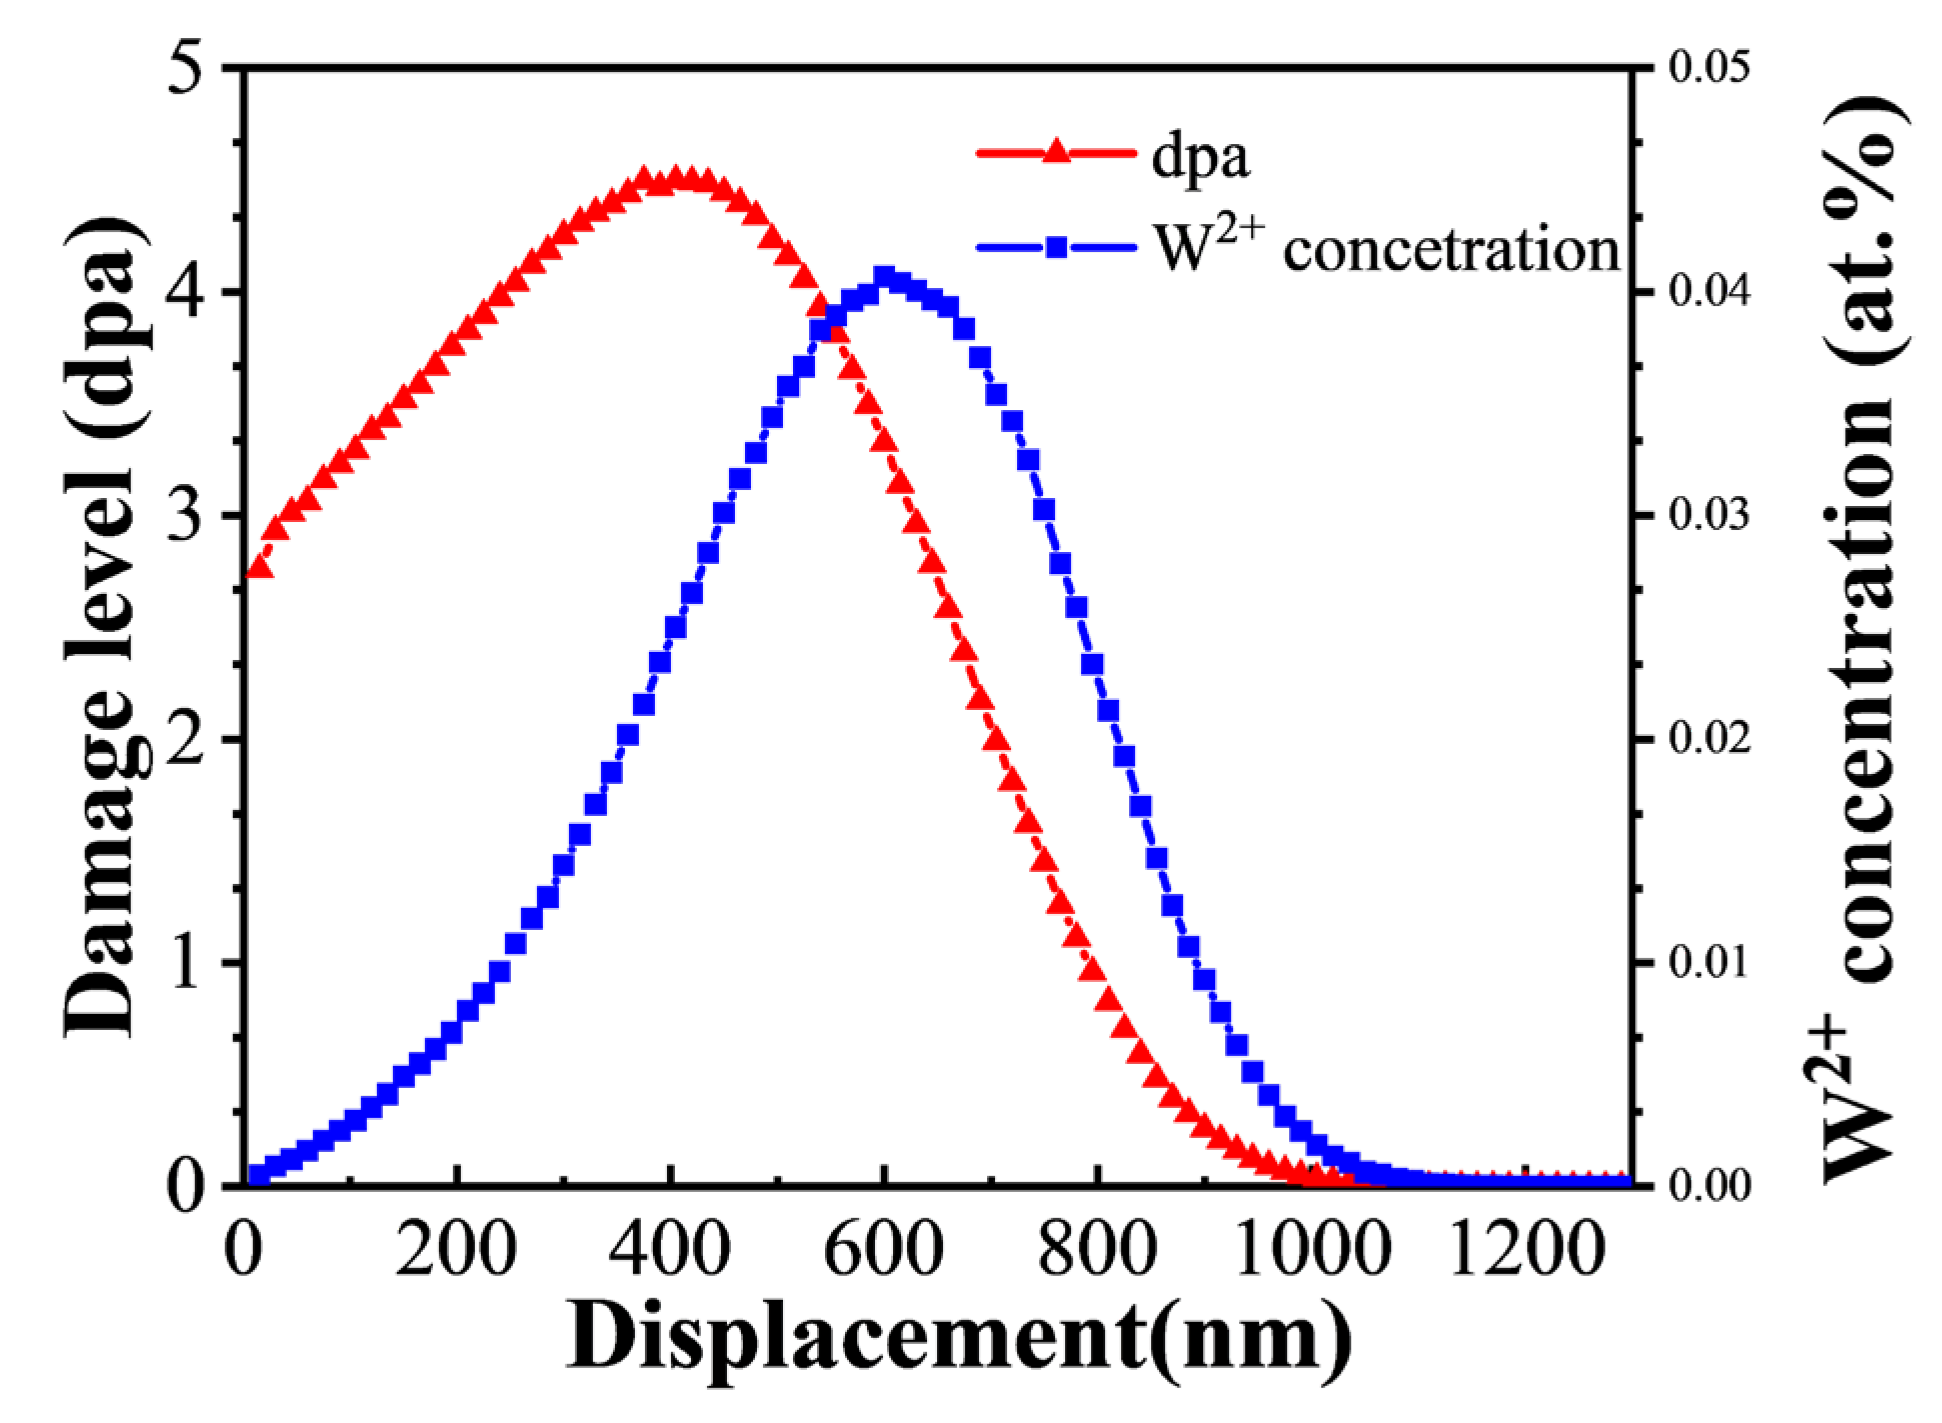
2. Materials and Methods

Tungsten blue oxide (TBO) was first produced with calcinations of ammonium paratungstate (APT). The doped TBO powder was then subjected to high temperature H2 reduction, acid washing and drying. The Al-K-Si-O compounds were formed and incorporated into the tungsten particle interior during those processes, and formed the AKS-W powder. More details about the powder production process can be found in [12]. The chemical composition of the AKS-doped tungsten powder (WK) used in this study is shown in Table 1. The content of K concentration in the WK powder is 82 ppm. Tantalum powder with a purity of 99.95% and a grain size of 10.5 μm produced by ZhongNuo Advanced Material (Beijing) Technology Co., Ltd. was added to the W-K powder, followed by the ball milling process. The chemical information for the tantalum powder is shown in Table 2. The ball material ratio is 8:1, the ball milling speed is 360 r/min and the ball milling time is 40 h. Two mixed powersWK-1Ta (1 wt. % Ta) powder and WK-3Ta (3 wt. % Ta) powder were produced after the ball milling process.
The WK-1Ta and WK-3Ta powders were then consolidated through SPS (Labox-325, Sinterland Inc., Nagaoka, Japan). The sintering parameters are shown in Figure 1. The sintered samples, WK-1Ta and WK-3Ta, were then annealed at 1000 °C for 3 h. The stress-released samples were cut and polished and formed the irradiation specimen, with a size of Φ15 mm × 1.9 mm.
The irradiation experiment was done with the HVE-3MV Tandetron Accelerator, located at Sichuan University, Key Laboratory of Radiation Physics and Technology, Ministry of Education, China. A 7.5 MeV W2+ ion was utilized as the self-ion irradiation source. The samples were heated until their surface temperatures reached 473 K. The heating was stopped at the beginning of the irradiation process. After around 100 min, the sample surface temperature became stable and maintained the same 344 K level for the rest of irradiation process. The total irradiation duration was 360 min. The total accumulated fluence was 1.2 × 10¹⁵ ions cm−2. The depth distribution profile of the irradiation damage was calculated by the binary collision code Transport of Ions in Matter (TRIM) in the SRIM-2008 software [23], in which the “ion distribution and quick calculation of damage” mode was chosen. The lattice binding energy (Eb) and displacement threshold energy (Ed) were set to 0 and 90 eV, respectively. The peak damage level was 4.5 dpa, which was calculated with Equation (1):
dpa = N d Φ N w
where Nd is the number of displacements acquired by TRIM, Nw stands for atomic density of WK-3Ta (6.054 × 10²² atoms cm−3, same for WK-1Ta), Φ stands for the ion flux and the value is 5.56 × 1010 cm−2 s−1. The irradiation parameters were set with the goal of simulating 1 year of displacement damage (5 dpa), and the eventual peak damage level was 4.5 dpa, which was slightly smaller than 5 dpa. Figure 2 shows the depth distribution profile of the displacement damage level and W2+ concentration in W. The damaged zone extends to around 1000 nm and the peak damage (4.5 dpa) is located at around 405 nm. It should be noted that we selected a relative “low” irradiation temperature. This was due to the limitations of the irradiation facility and the need to capture the precision of using the irradiation damage simulation software (no temperature effect was considered by the SRIM software and the input parameters were based on the room temperature values).
Nanoindentation tests were performed by using a nanoindenter (Agilent G200) equipped with a Berkovich tip. A continuous stiffness measurement (CSM) was adopted to obtain continuous profiles of hardness and elastic modulus as a function of indentation depth. Before testing, the indenter tip geometry was calibrated by indenting a fused silica reference sample. Other main testing parameters were depicted as follows: the maximum indentation depth was 1200 nm, the strain rate was 0.05 s−1 and the Poisson’s ratio was 0.25. For each specimen, 8 tests were carried out. The distance between the two testing locations was 100 μm. A total of 6 best fitting curves from the 8 were chosen for forming the final resulting curve by averaging the values.

3. Results

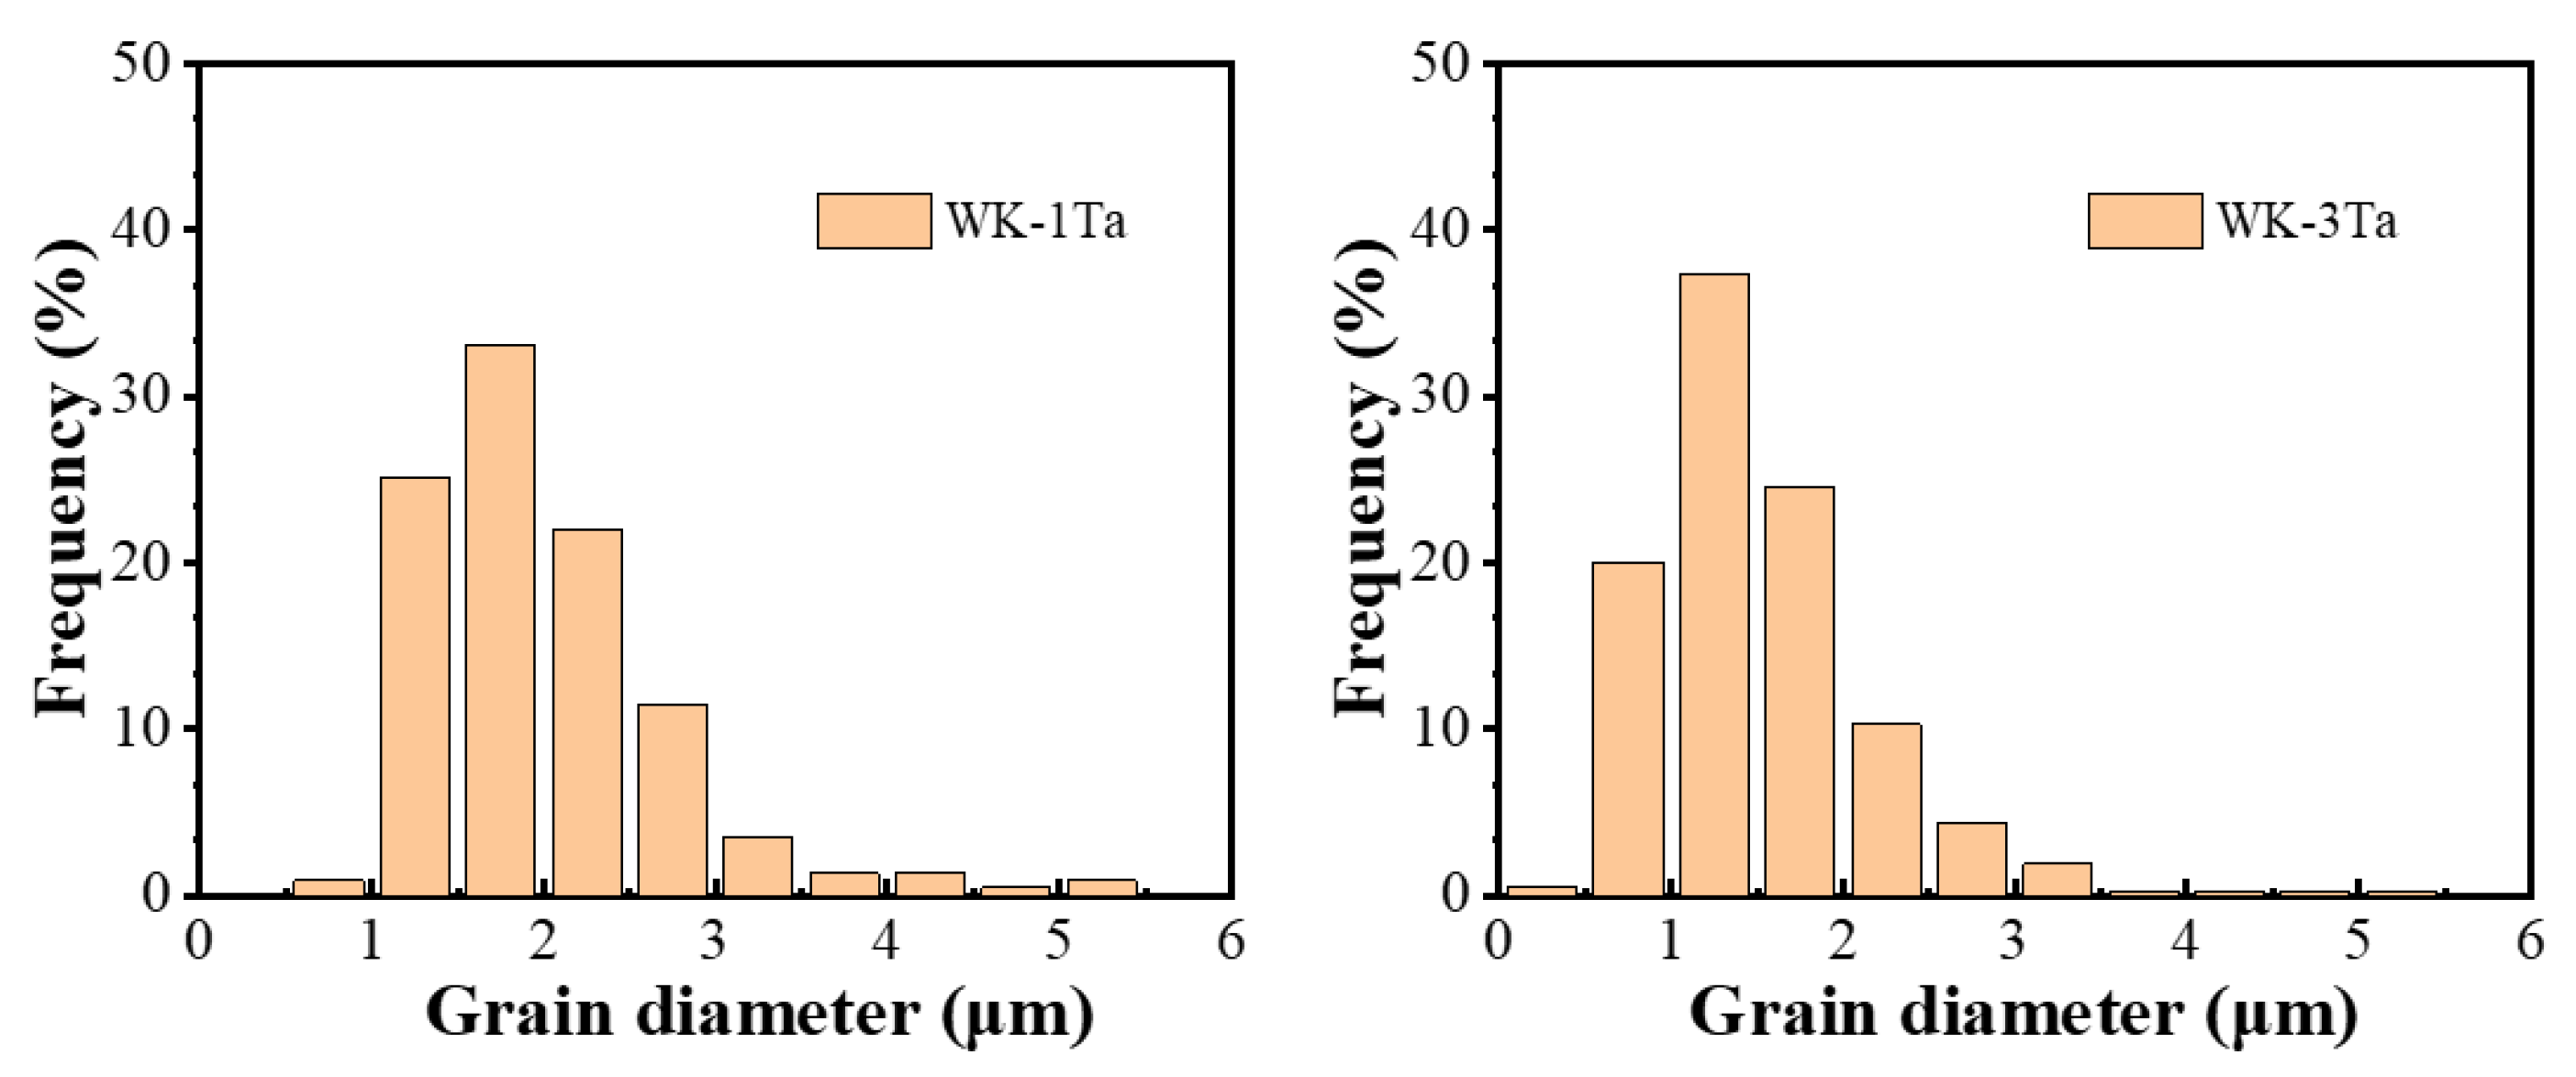
3.1. Density and Grain Size

The relative density of the samples was measured with the Archimedes method. The relative densities for the WK-1Ta and WK-3Ta are 97.2% and 96.4%, respectively. The microstructure of the samples is shown in Figure 3. A summary of the grain sizes is shown in Figure 4. The average grain sizes for WK-1Ta and WK-3Ta are 2.08 μm and 1.51 μm, respectively.

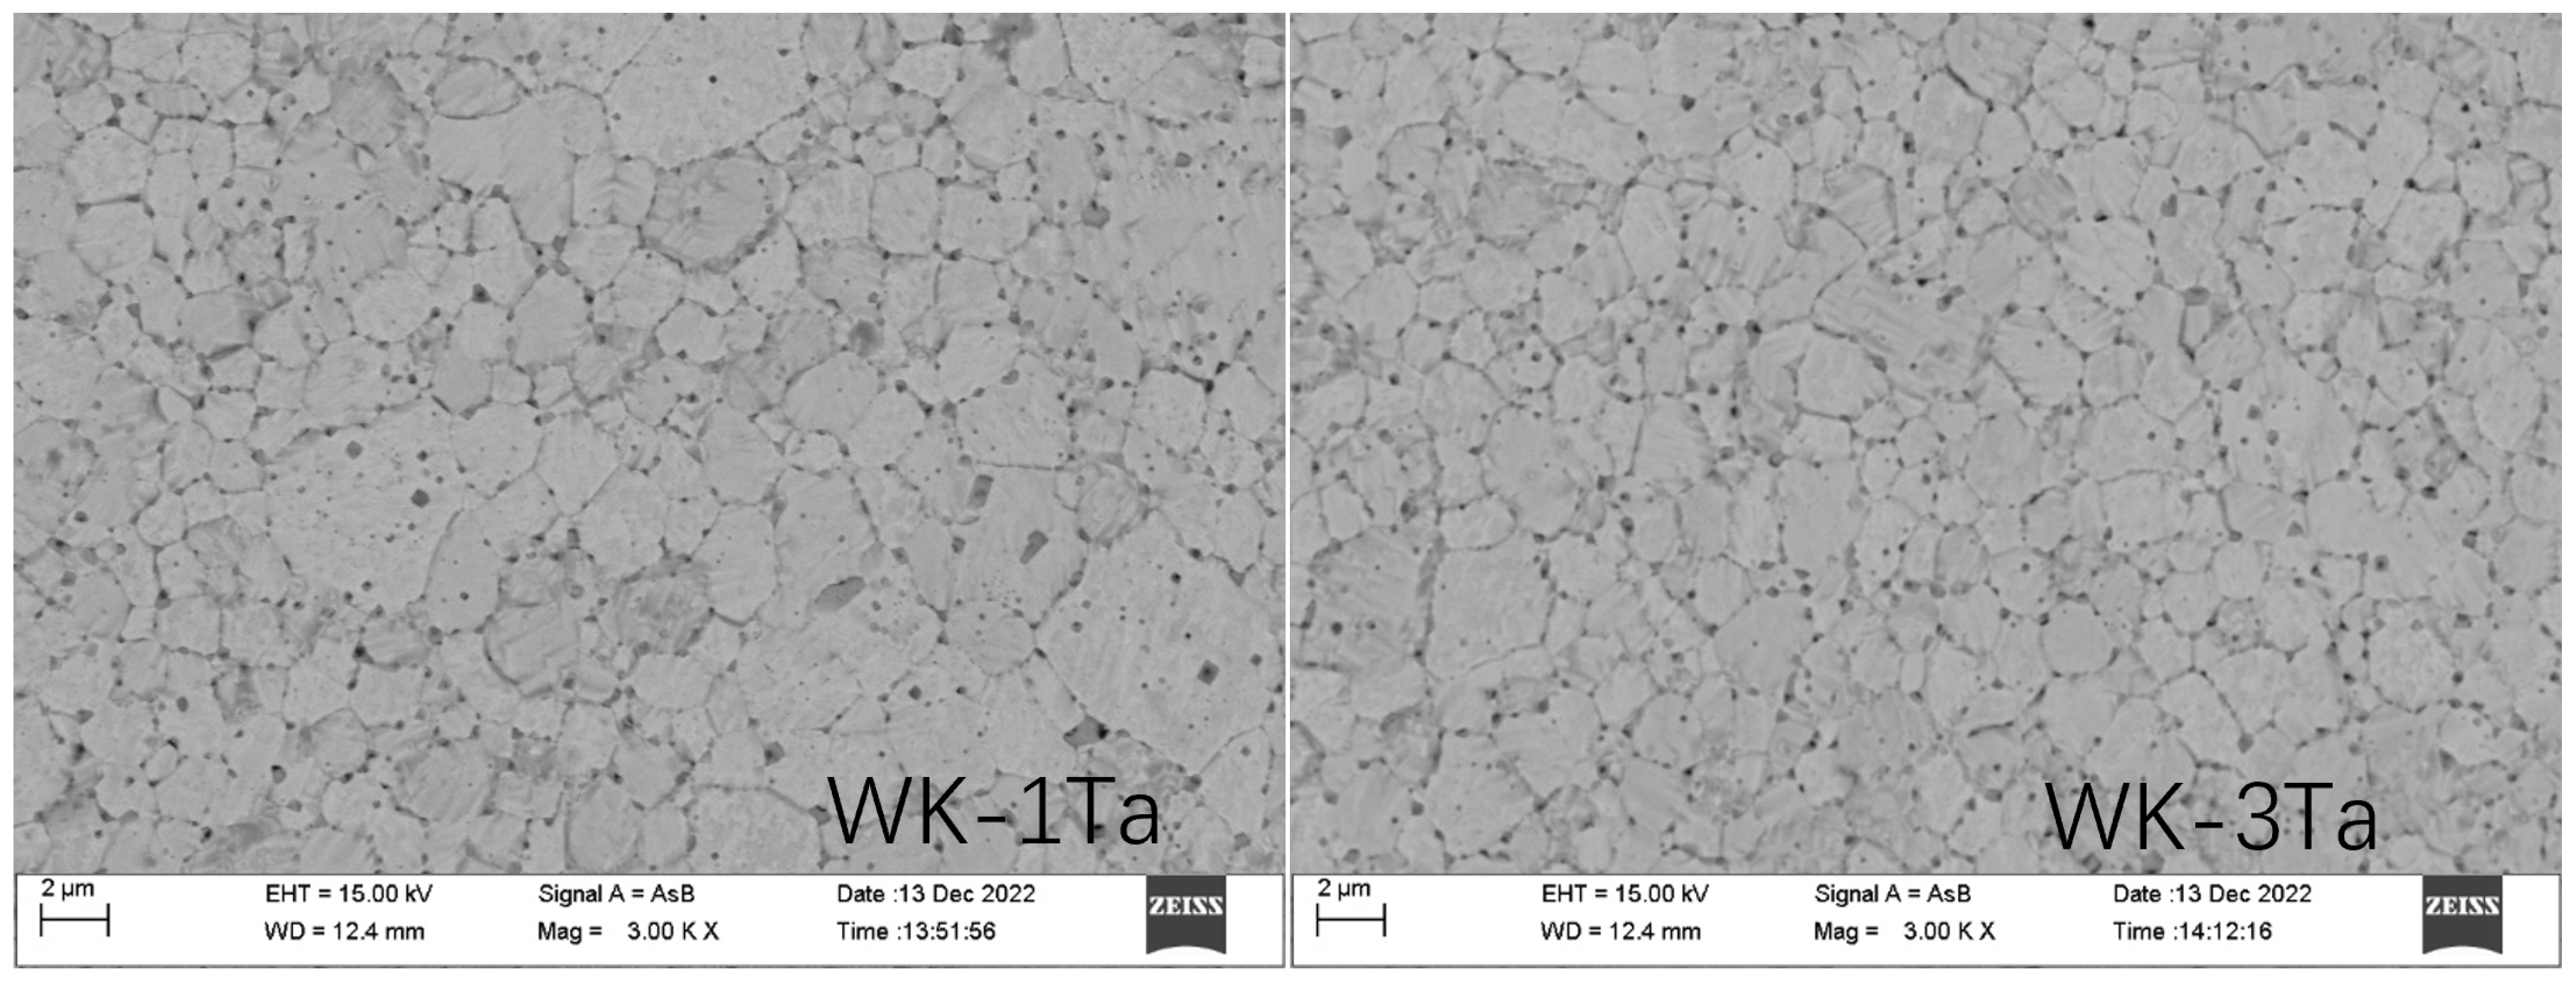
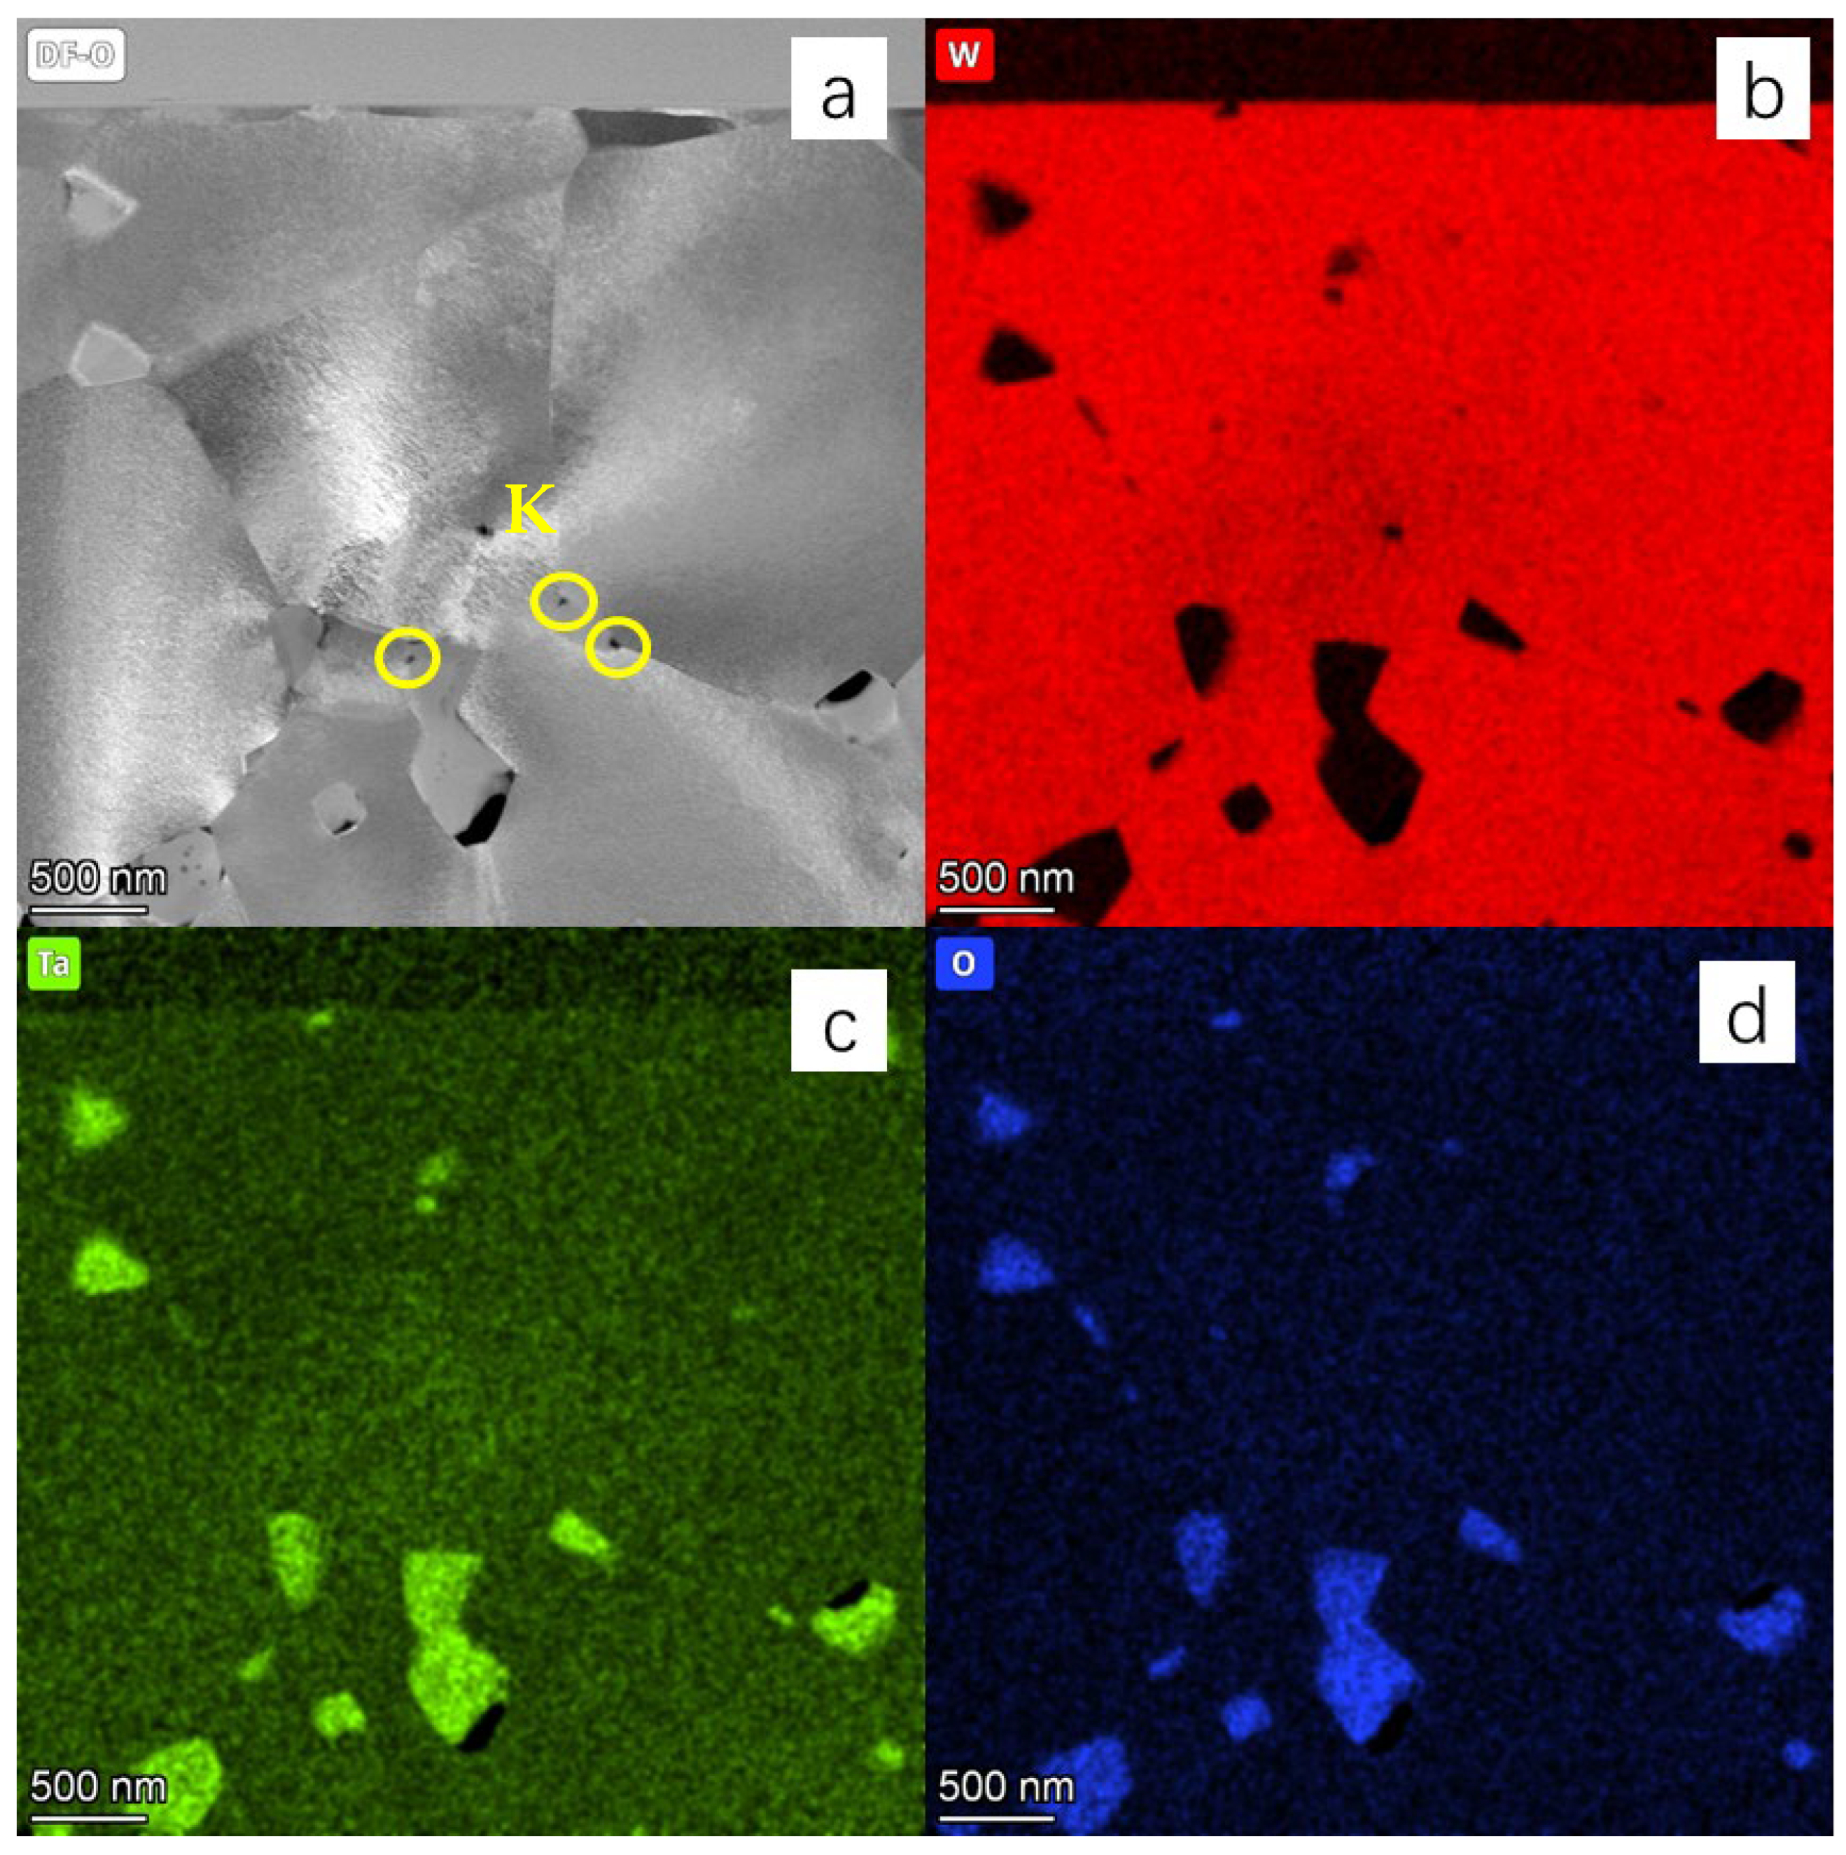
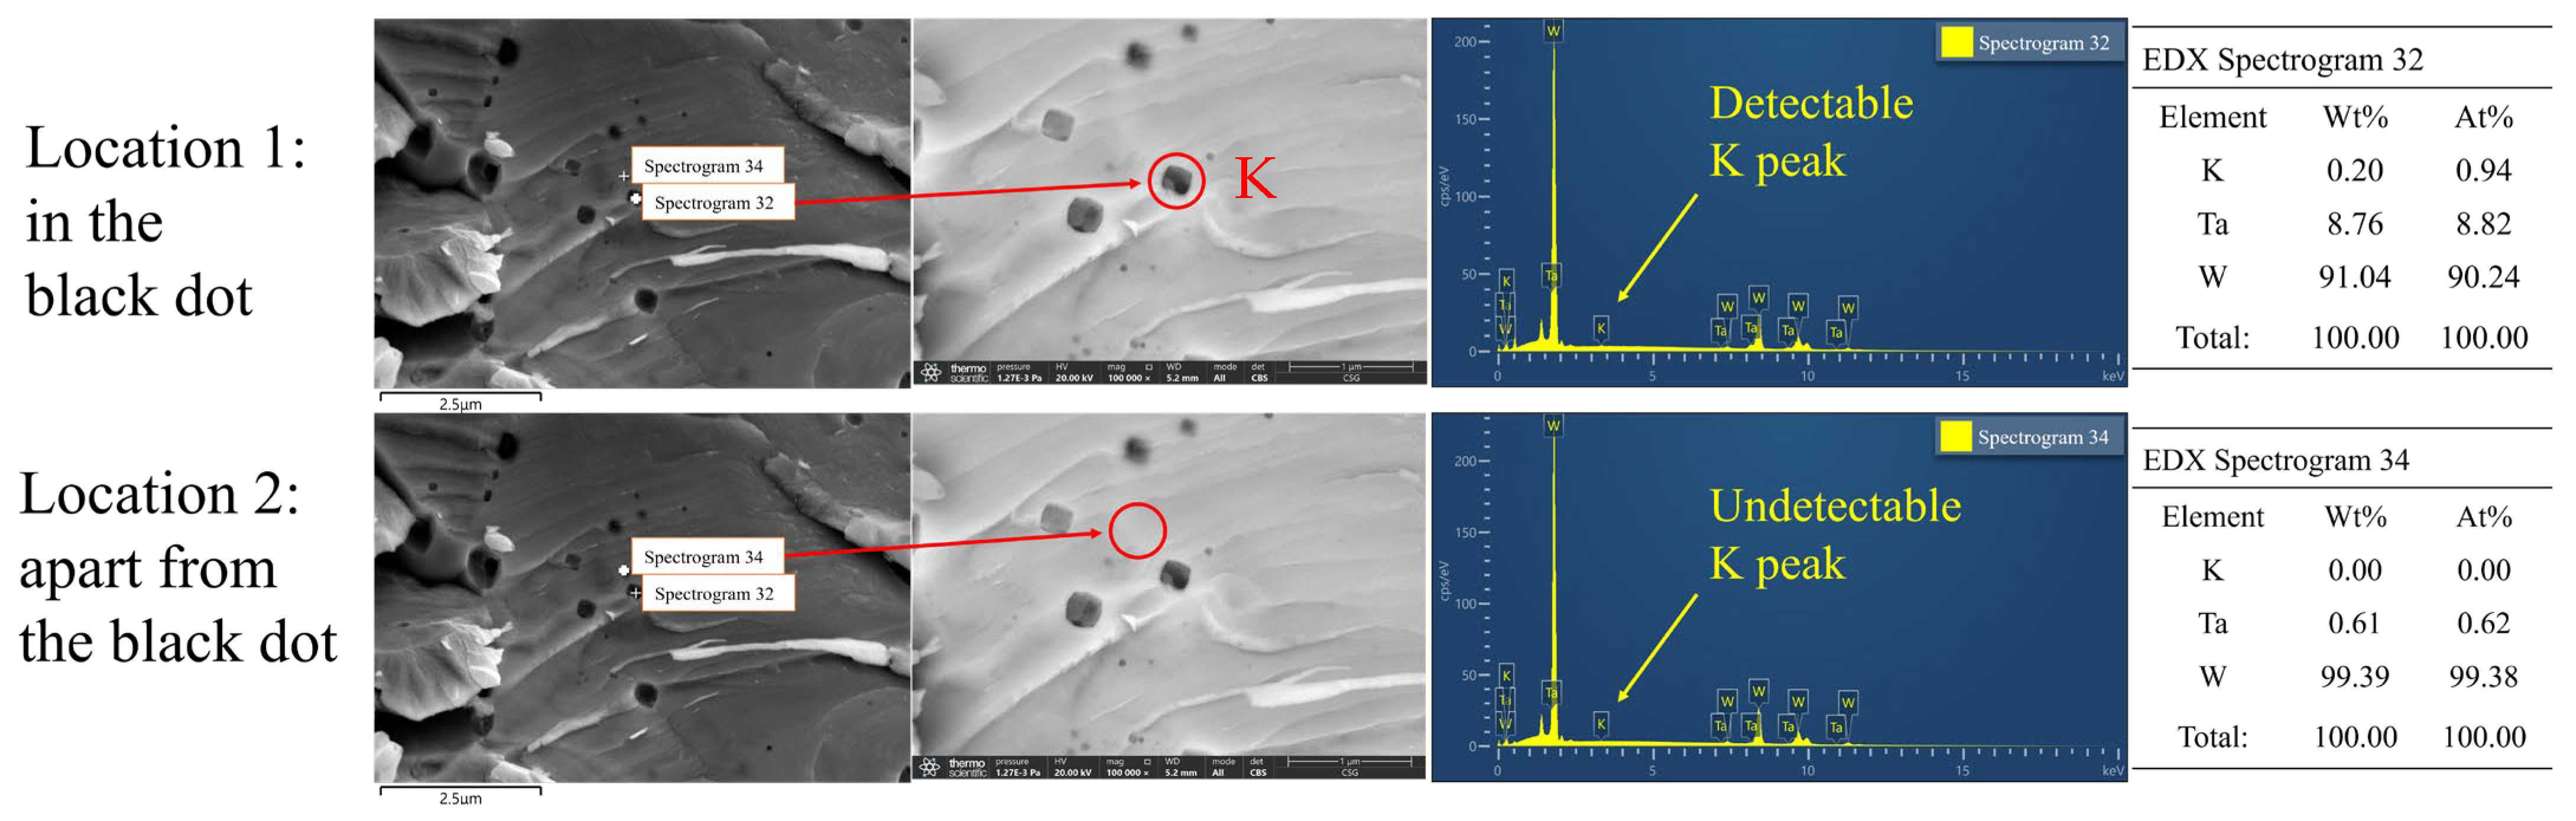
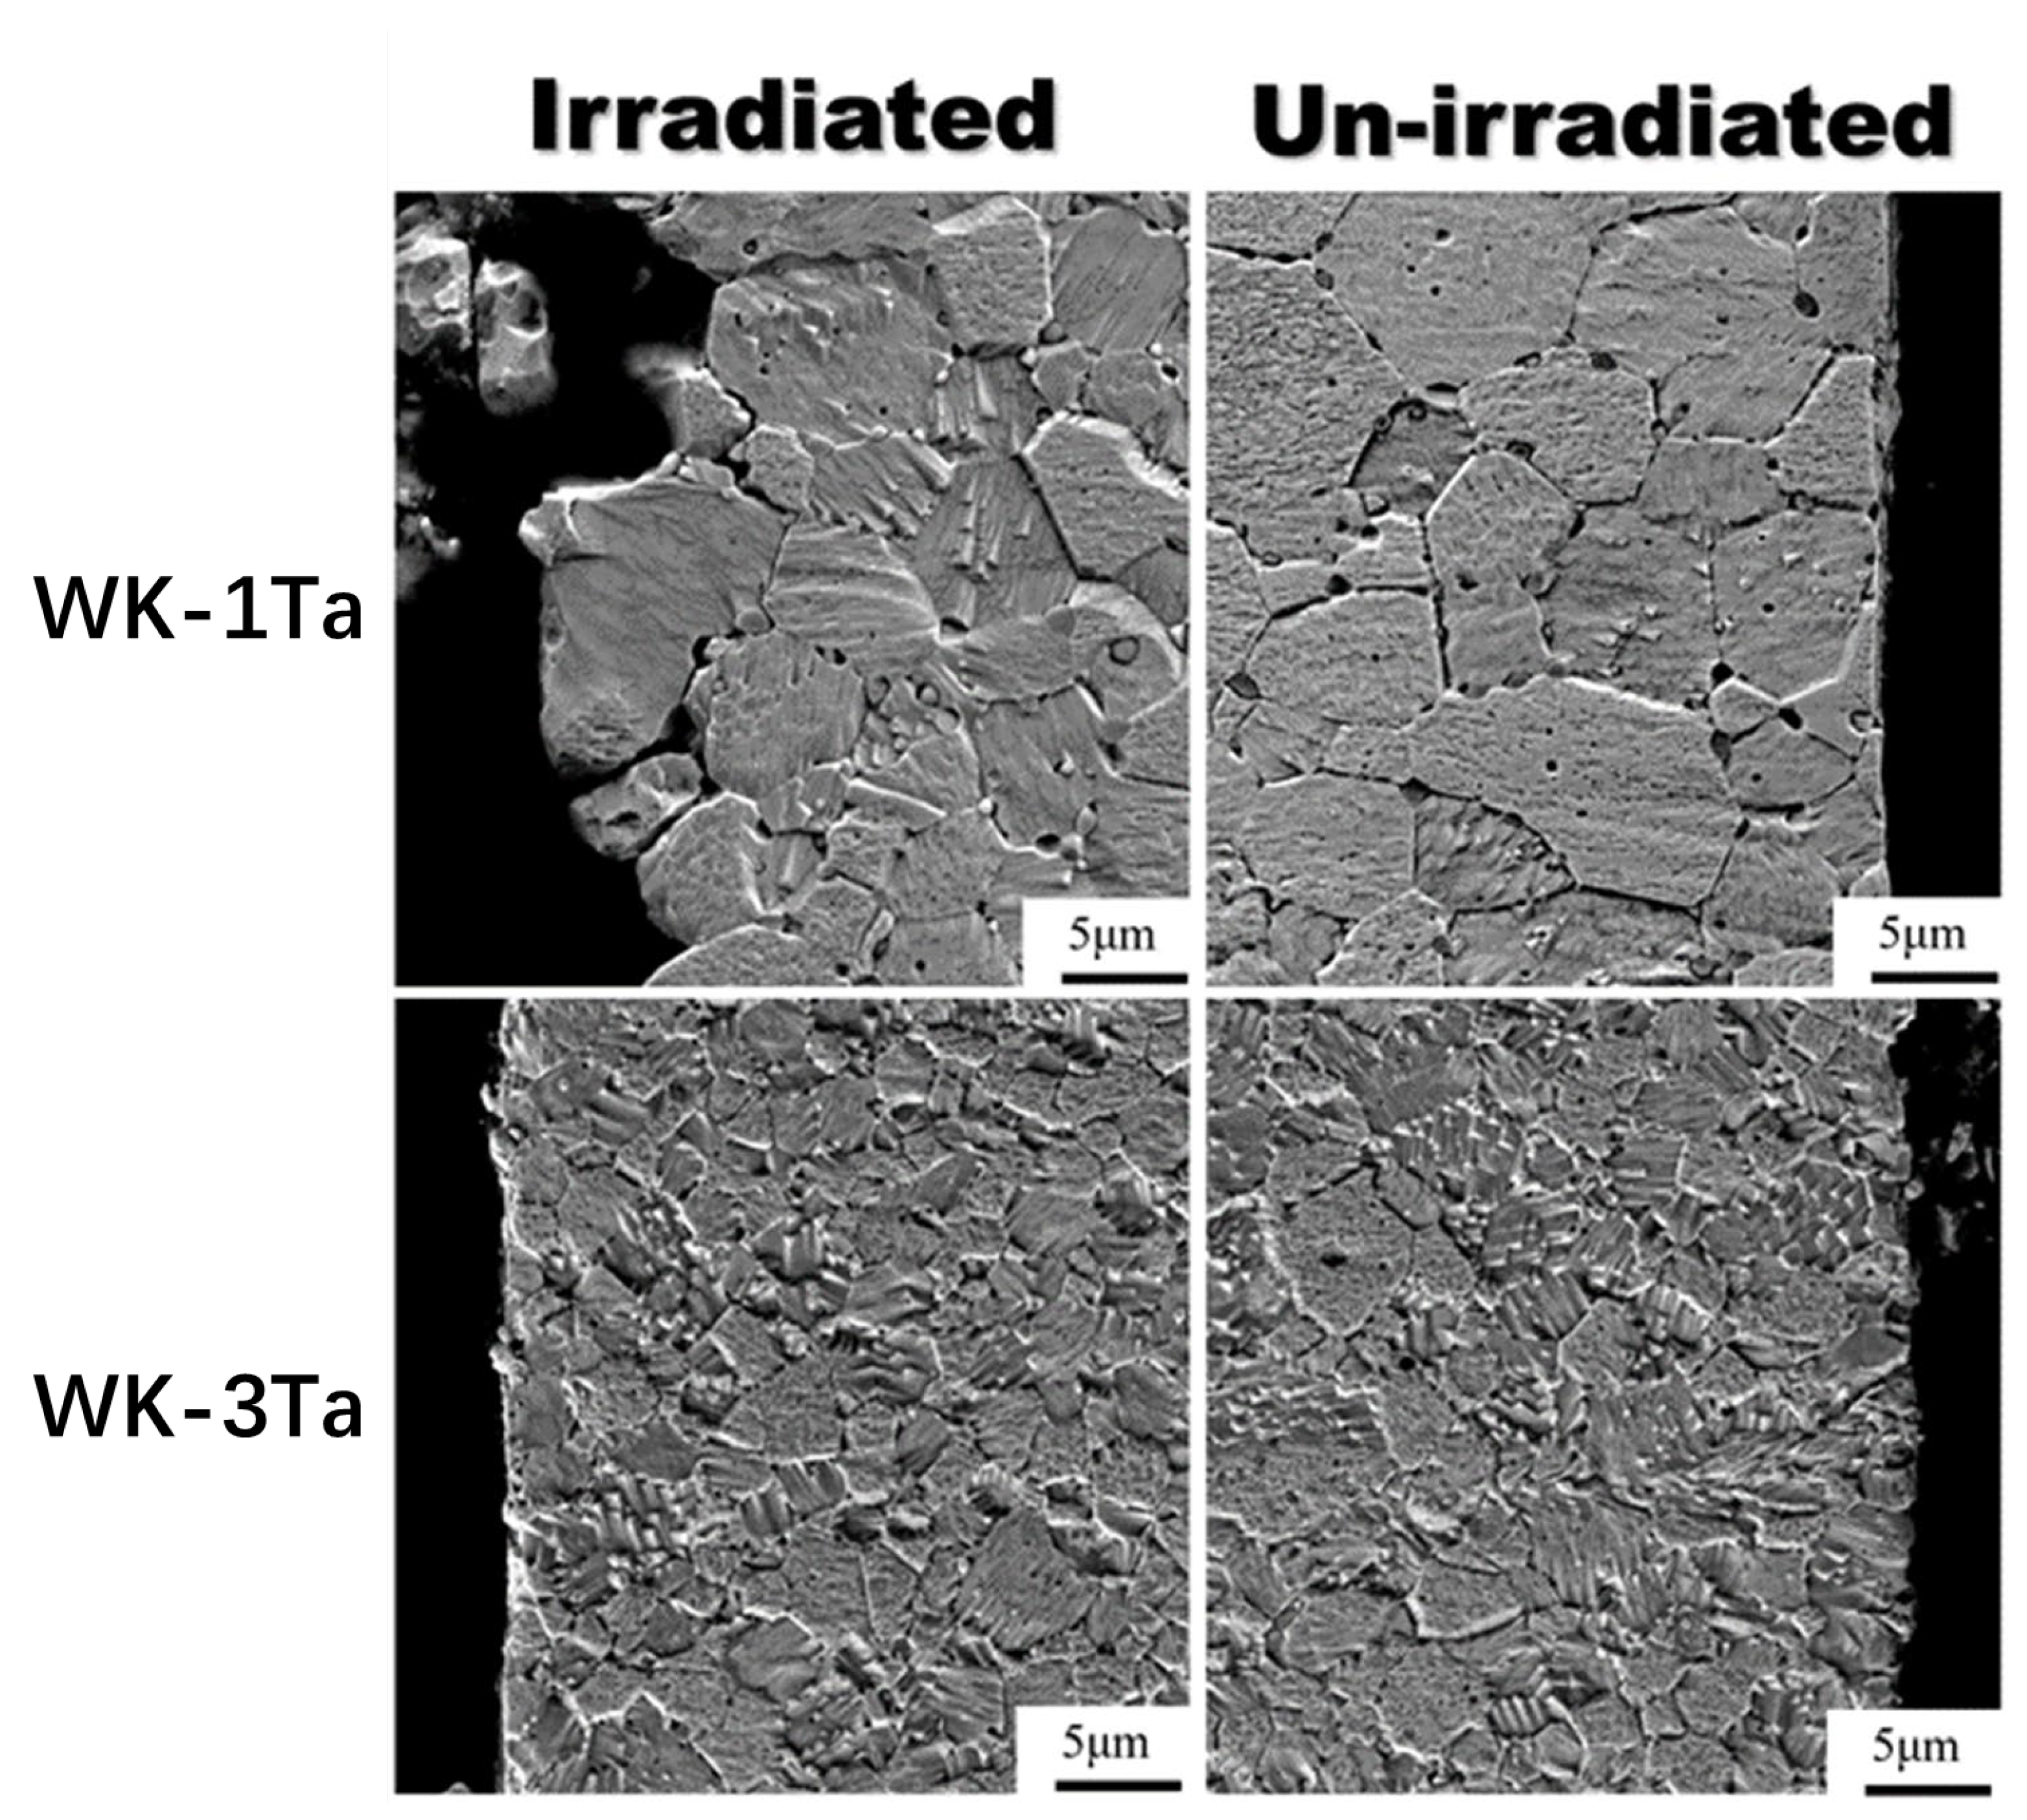
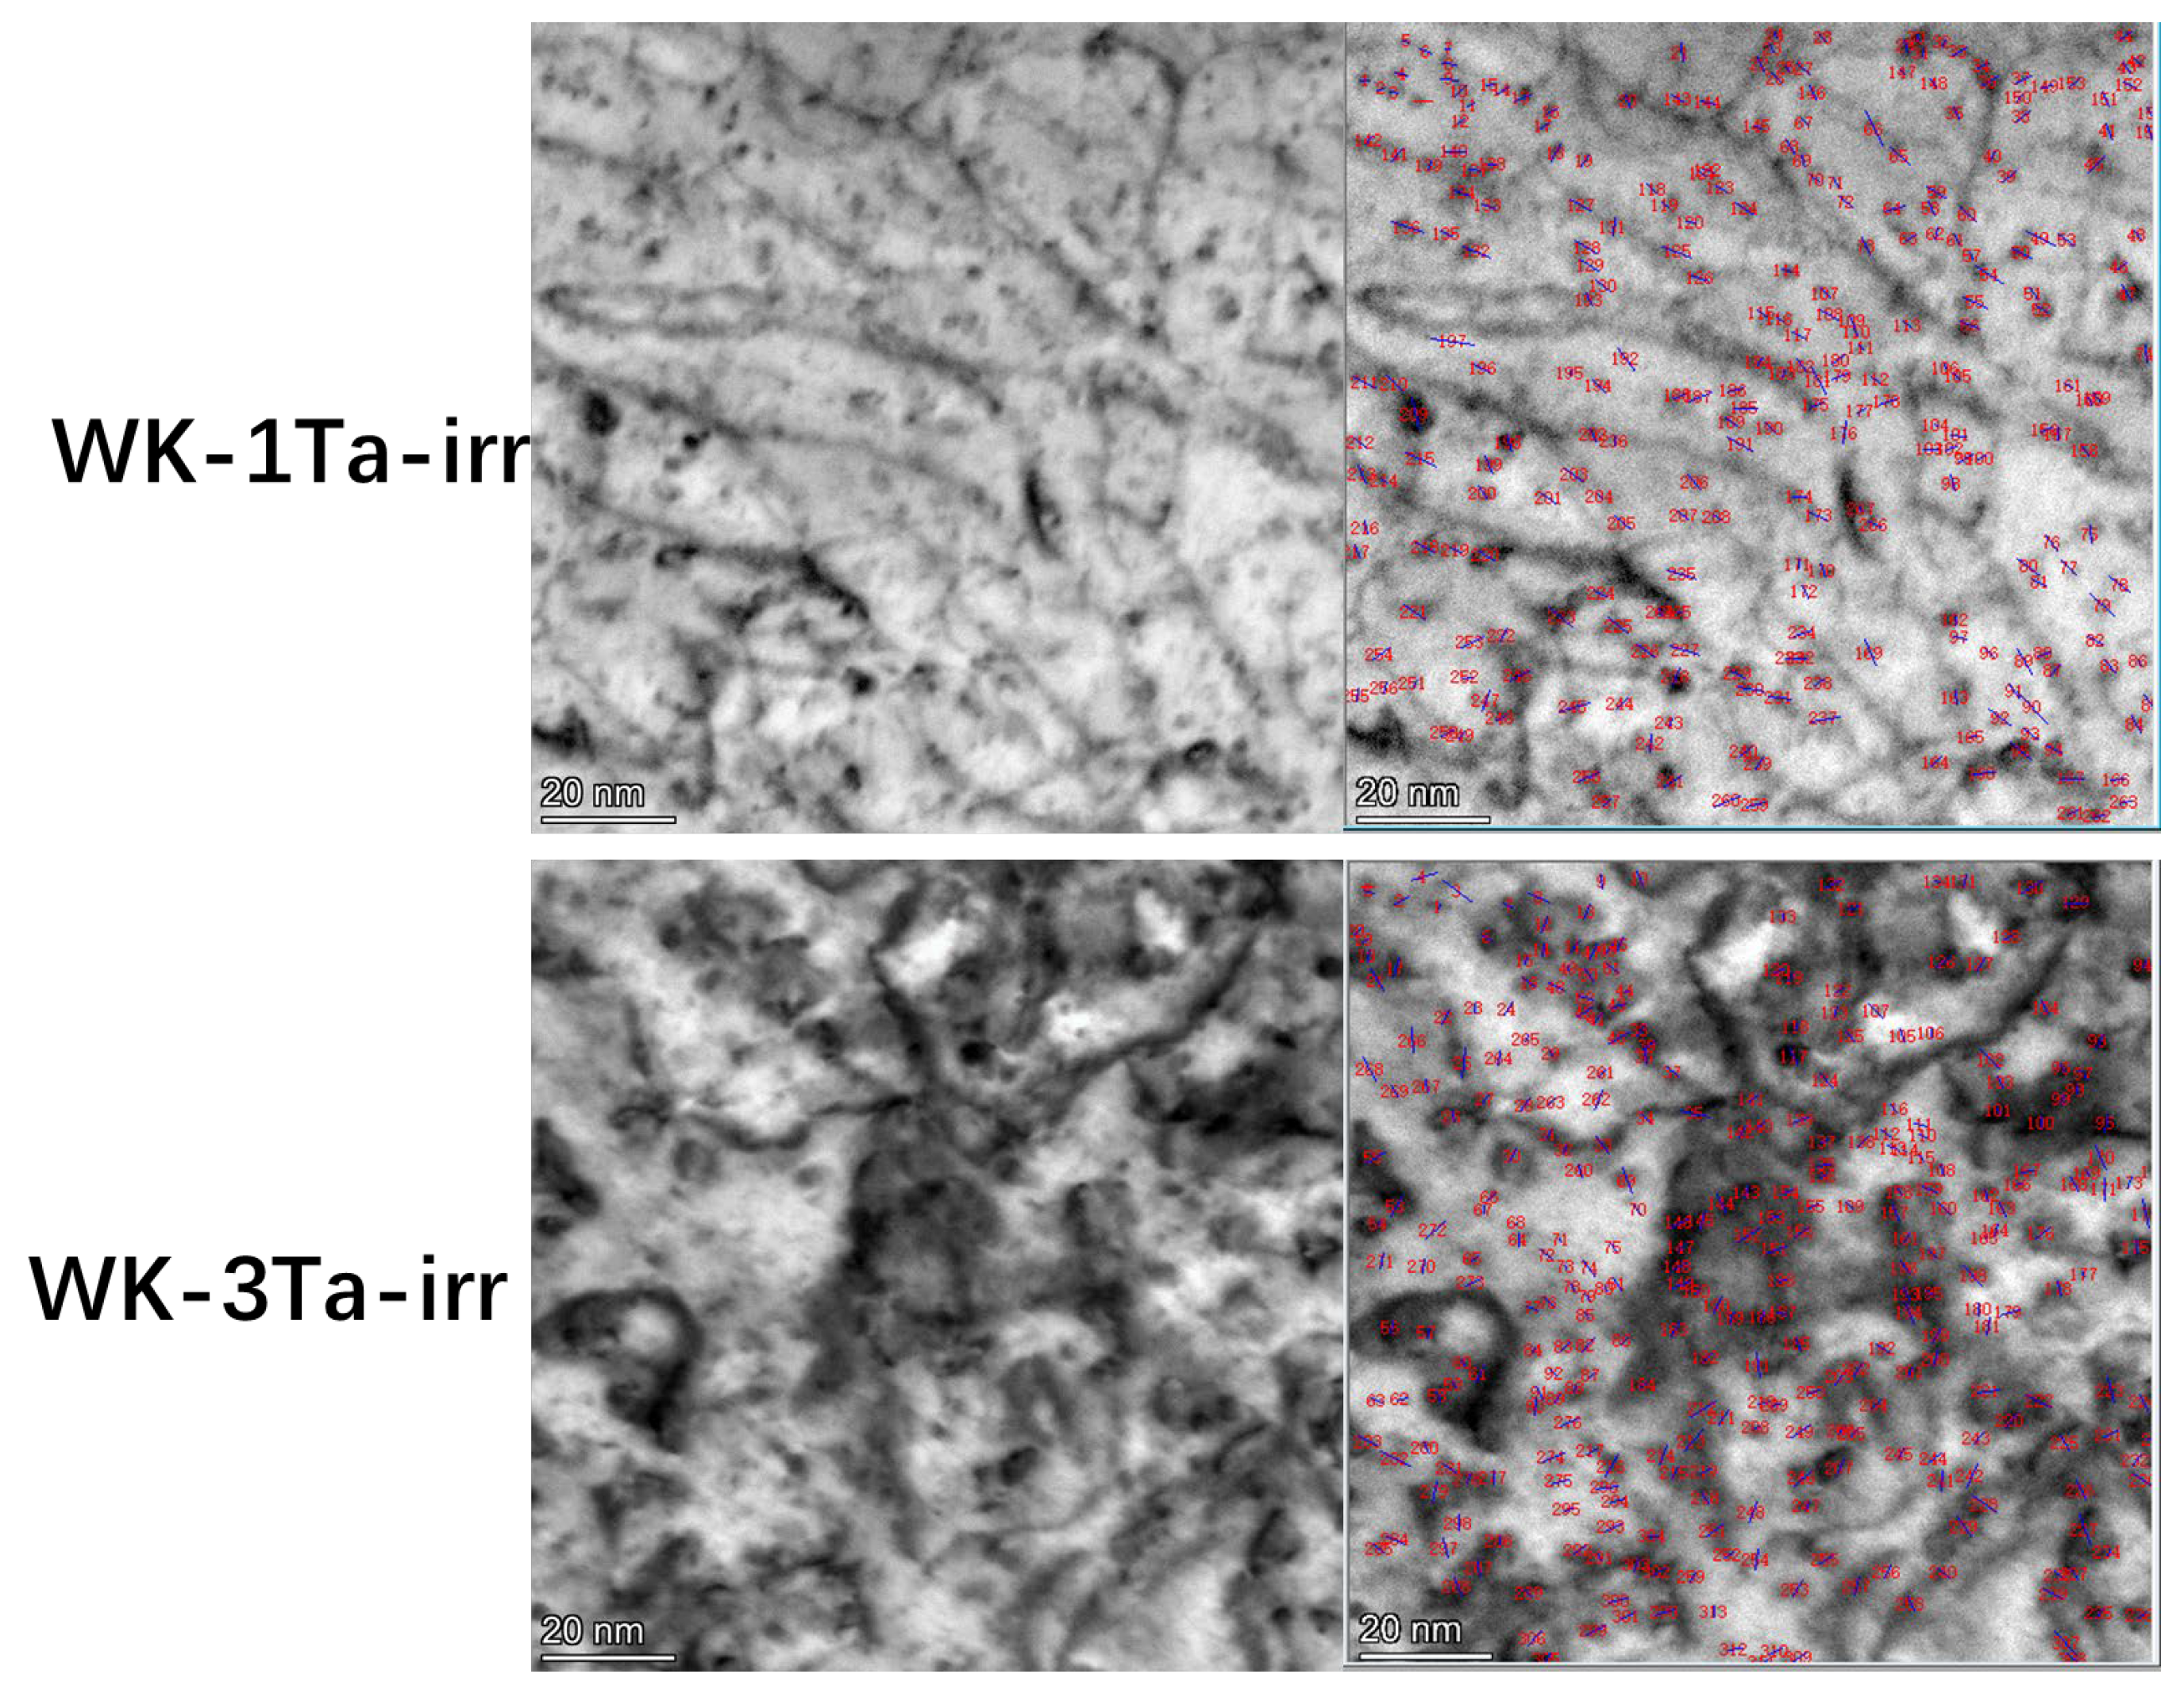
3.2. Microstructure and Element

The scanning transmission electron microscope (STEM) image of WK-3Ta is shown in Figure 5. Figure 5a is the annular bright field (ABF) image and Figure 5b–d are the energy dispersive spectrometer (EDX) results of the data gathered from the image in Figure 5a. the tantalum grains with a size of 500 nm are found at the grain boundary of tungsten. Additionally, oxygen was detected at the tantalum rich locations. In Figure 5a, the small (nanometre size) holes (indicated in the yellow circles) are located at the grain boundary of W, which was believed to be the location of the K bubbles. This phenomenon is similar to the reported results from the K-doped tungsten alloy [11]. WK-1Ta shows a similar microstructure with a lower tantalum concentration.

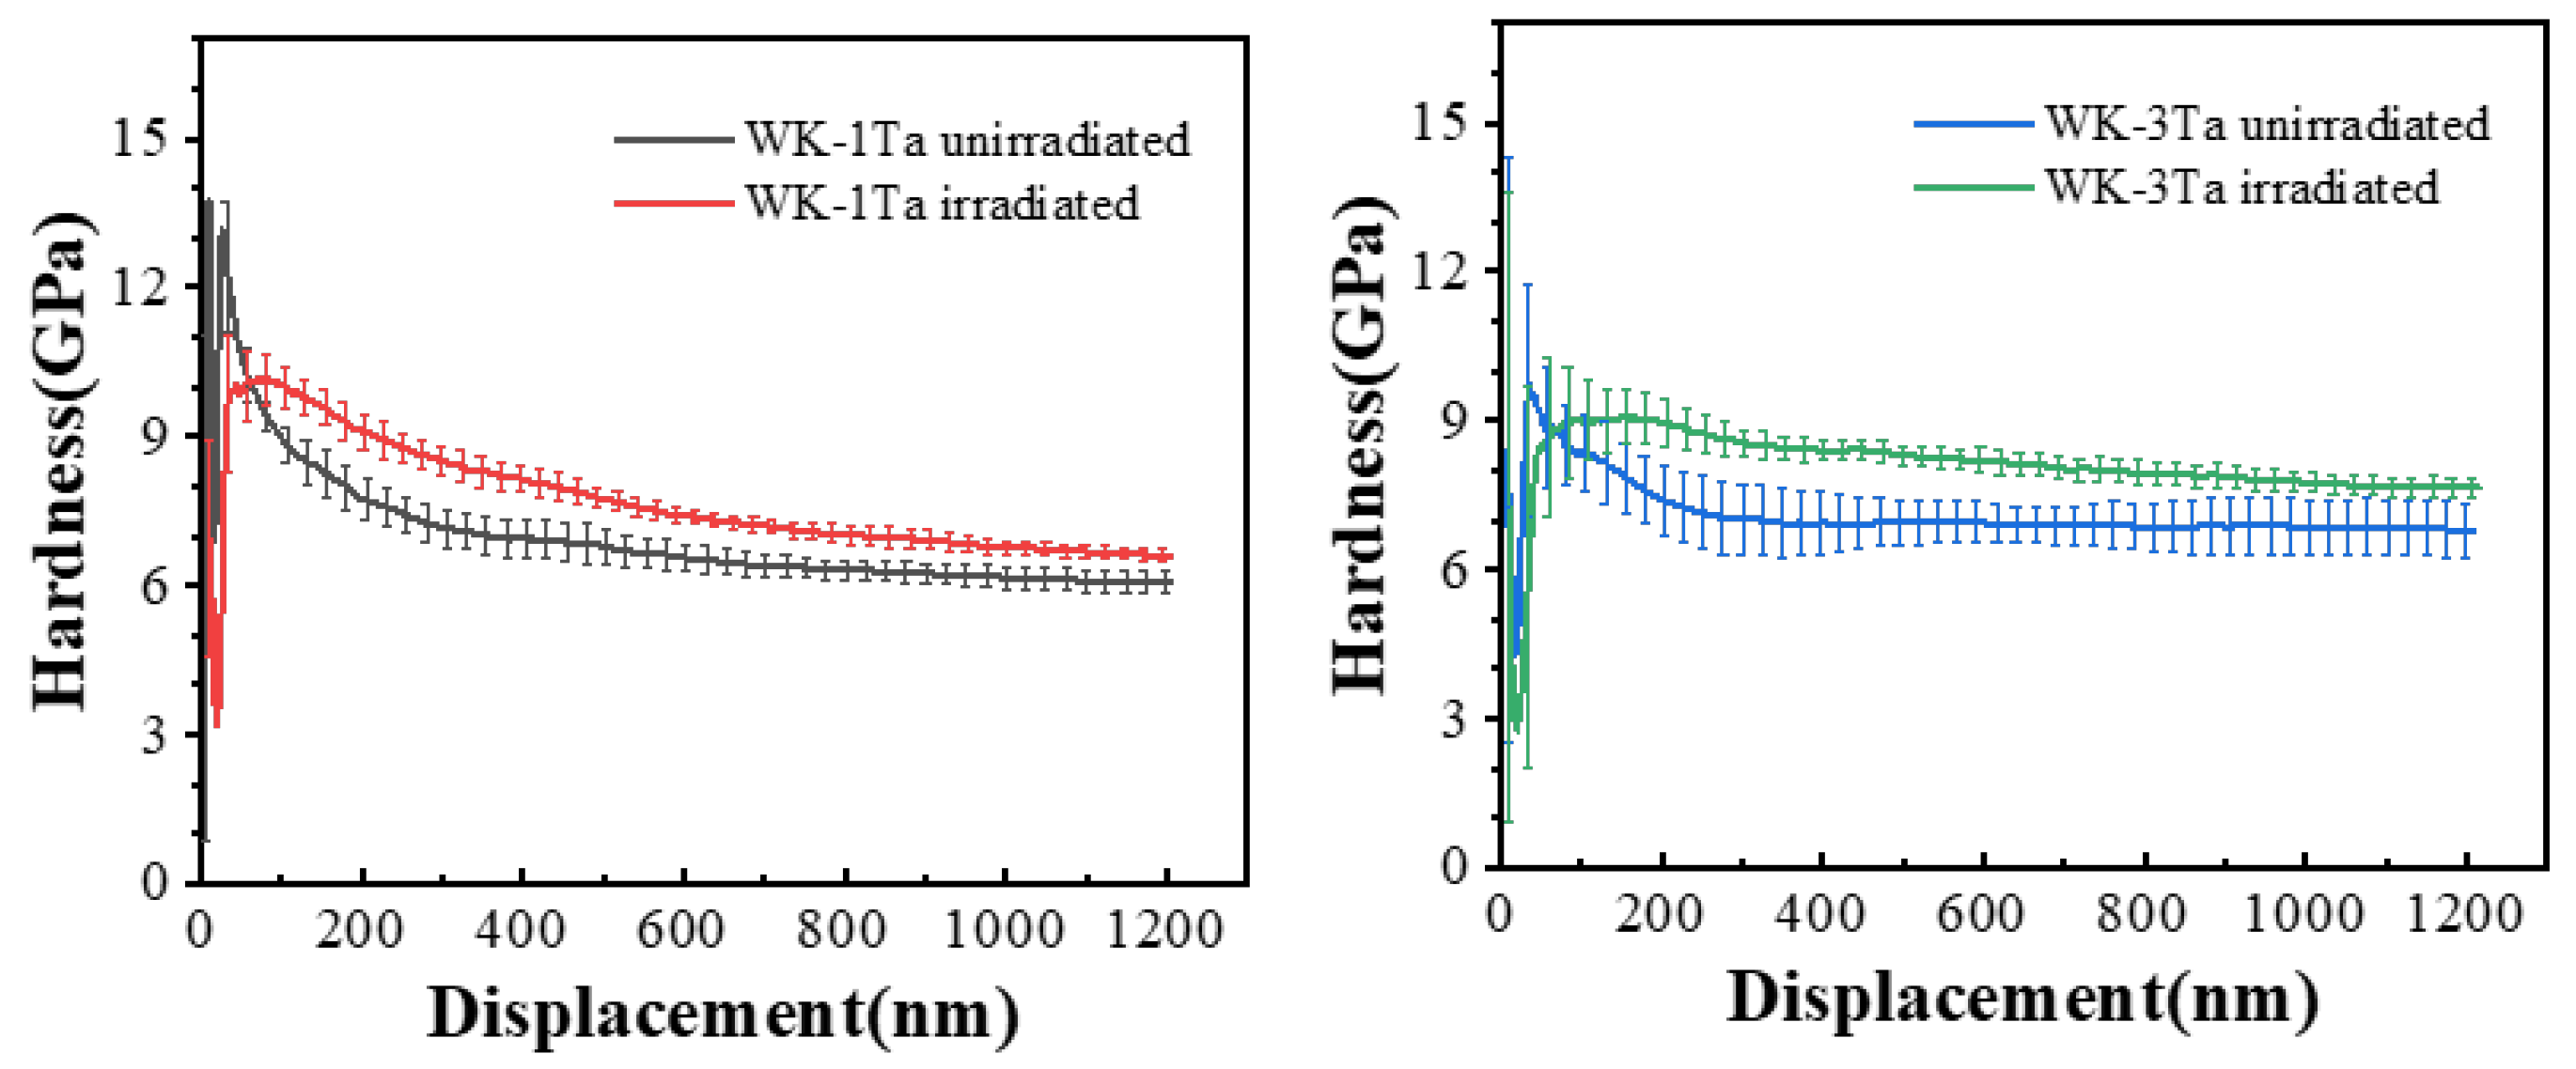
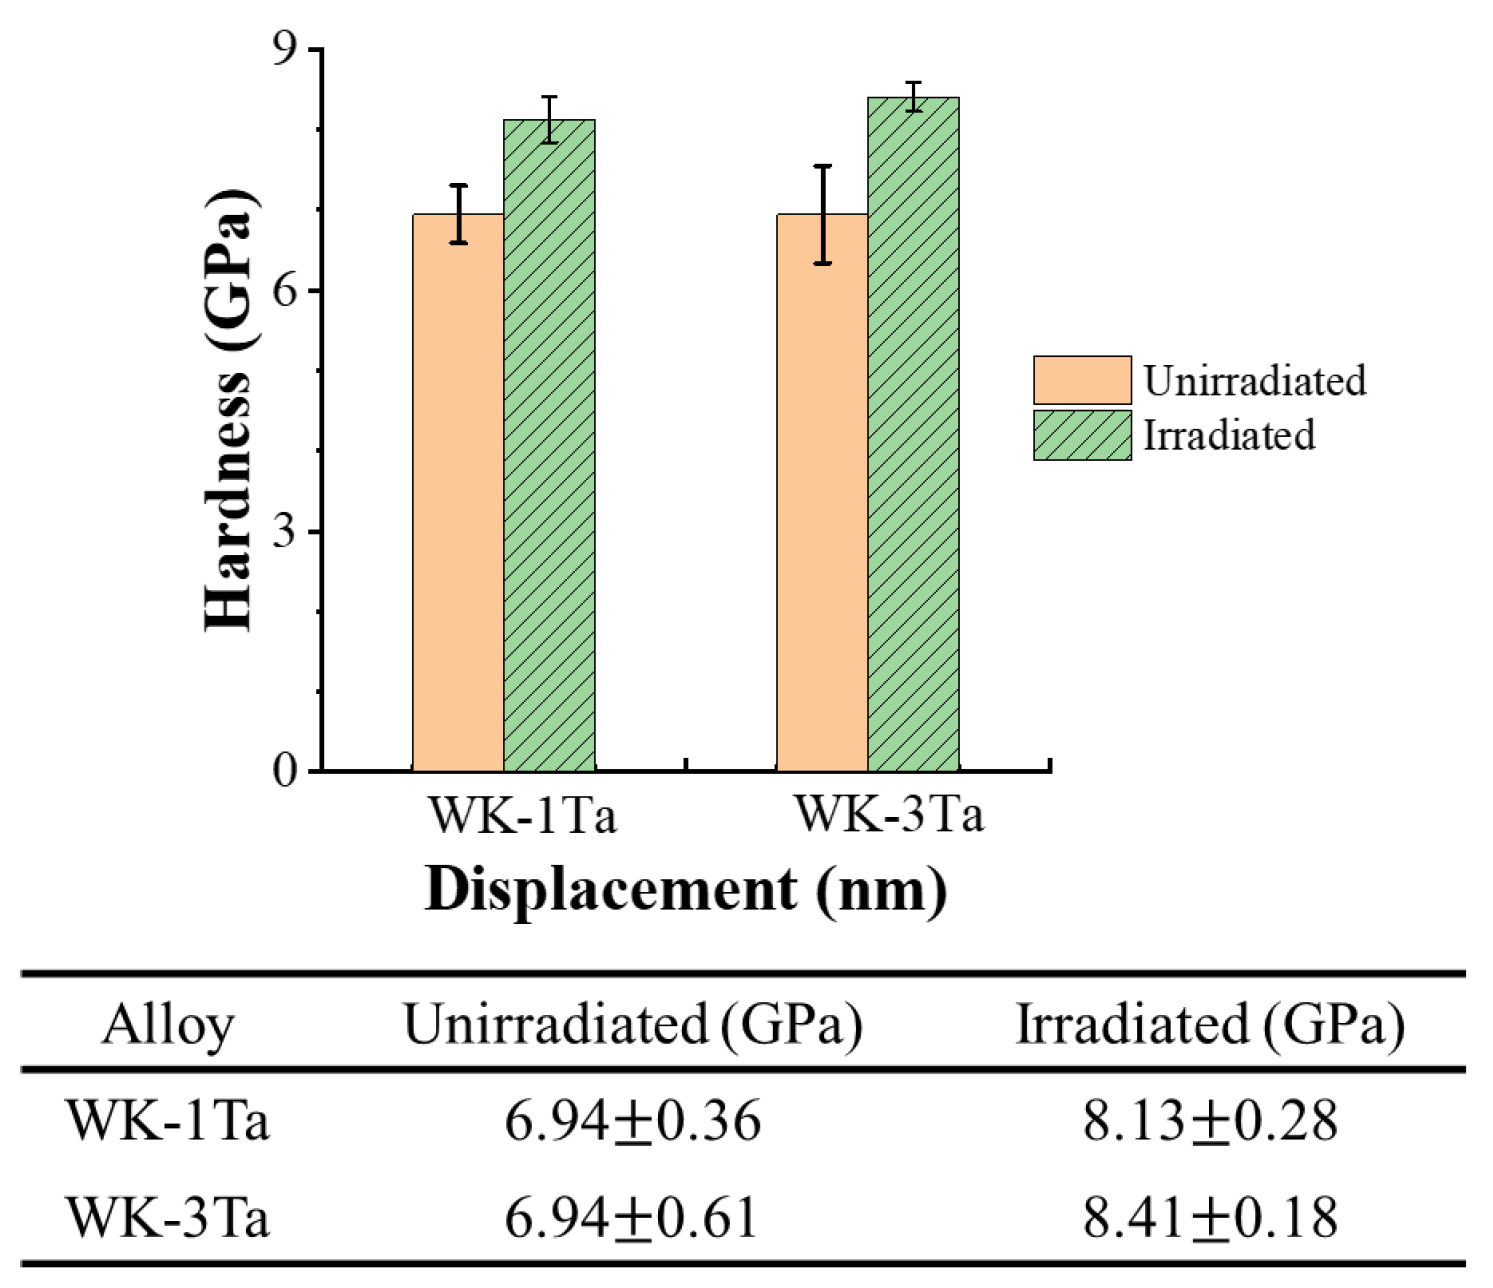
3.3. Vcikers Hardness and Nano Hardness

The Vickers hardness of the samples before and after irradiation are summarized in Table 3. WK-1Ta-irr is the irradiated WK-1Ta sample. From this result, it is hard to detect the difference in the Vickers hardness between the irradiated and unirradiated samples. The Vickers hardness for WK-3Ta is around 20% higher than that of WK-1Ta, in both irradiated and non-irradiated cases.
The nano hardness result (depth depended on the hardness curve) for the investigated samples are shown in Figure 6. The nano hardness values for the samples after irradiation are higher that the samples before irradiation, in both the WK-1Ta and WK-3Ta samples. The gap between the hardness curves of the unirradiated and irradiated samples of WK-3Ta is larger than that of WK-1Ta, indicating that the increase in hardness of WK-3Ta is larger than that of WK-1Ta. The nano hardness values of the investigated samples at the peak displacement damage location (405 nm depth) are shown in Figure 7.
The location of the 405 nm depth (the maximum dpa influenced location) shows that the nano hardness for the unirradiated WK-1Ta and WK-3Ta samples are both 6.94 GPa. The nano hardness for the irradiated samples is around 1.2 GPa higher than that of the unirradiated ones. In addition, the nano hardness for the irradiated WK-3Ta sample is slightly higher than that of the WK-1Ta, which is consistent with the hardness curve comparison results.

4. Discussion

The density analysis results indicate more tantalum content is not helpful for the densifying of the investigated WK-Ta alloys. However, the relative density of the WK-1Ta and WK-3Ta alloys fabricated by this work are generally higher than that of other research [8,24]. The average tungsten grain size for WK-1Ta is slightly larger than that of WK-3Ta, which indicates the positive effect of the tantalum for keeping the tungsten grain with finer grain size during the SPS sintering. The tantalum grains with a size of ~500 nm are located at the boundaries of tungsten grains and become the trap location of oxygen. It is clear that the tantalum grain was crushed during the ball milling and SPS processes, since its original size was 10.5 μm. As shown in Figure 5, it is hard to detect the K element at the polished sample, although some nanometer holes at the tungsten grain boundaries are assumed to be the location of K bubbles. The literature [11] has reported the existence of K at the tungsten grain boundaries and tungsten grain interior for the WK alloy fabricated with the SPS process. In order to confirm the existence of K bubble at the tungsten grain interior, an EDX analysis was performed on the breaking face of the WK-1Ta specimen. The results are shown in Figure 8. We have analyzed two different locations. The upper figure shows the black dot location. the black dot at the transgranular-fractured grain was the location of a K bubble, where Ta enrichment was also detected. The lower figure shows the location apart from the black dot, where it was assumed to be the area of pure W. In the pure W area, no K element was detected, while a very small amount of Ta was detected. Ta appears to preferentially enrich nucleation within the K-bubble rather than in tungsten, when it exists in the tungsten grain interior. This phenomenon was also reported by potassium doped and titanium-containing tungsten material [25]. Therefore, it is clear that the K bubble is an attractive location for soft alloying elements when it exists in the tungsten grain interior. Ta likely presents at the grain boundaries due to its affinity with the creation of vacancies in tungsten, which was described in Figure 5. It can be concluded that the Ta is located at both grain boundaries and enriched at K bubbles in the tungsten grain interior. In addition, the doping of Ta purifies the oxygen at the grain boundaries. The results from the WK-3Ta specimen showed a similar phenomenon and are not presented here.
The WK-3Ta samples show higher (20%) Vickers hardness than WK-1Ta, in both irradiated and unirradiated cases. It is well known that the Vickers hardness is a comprehensive mechanical property related to the density, grain size and microstructure of a material. The density analysis results show that the relative density of WK-1Ta (97.2%) is slightly higher than that of WK-3Ta (96.4%), which leads to a positive effect for hardness; however, the average grain size of WK-1Ta (2.08 μm) is larger than that of WK-3Ta (1.51 μm), and has a negative effect on the hardness. In addition, it is believed that the nano size tantalum grains act as barriers to dislocation motion [26], and more tantalum content means more barriers for the dislocation motion under indentation, and eventually results in higher hardness. Therefore, WK-1Ta has disadvantages in terms of hardness than WK-1Ta, concerning the barriers for the dislocation motion. In summary, compared to WK-3Ta, WK-1Ta has advantages in terms of density but disadvantages in terms of grain size and the dislocation barrier with regard to the Vickers hardness. The WK-3Ta samples show higher Vickers hardness than WK-1Ta samples.
As shown in Figure 6 and Figure 7, the nano indentation test result indicates that the increase of hardness occurred in both the WK-3Ta and WK-1Ta alloys. It is well known that the displacement damage will generate vacancies, make the material interstitial and lead to defects such as dislocation loops, voids or phase changes for the material. These defects cause degeneration of the material, such as worse ductility and higher ultimate strength [26,27]. Therefore, the irradiated samples show a higher hardness than the unirradiated ones due to the defects generated during irradiation. However, there is only a limited difference (within the margin of error) between the Vickers hardness of the irradiated and unirradiated samples, in both WK-1Ta and WK-3Ta cases (see values in Table 3). This is because during the Vickers hardness test, the indenting head was pressed into the sample with a depth of 6 μm, while the irradiation influenced area is only 1 μm deep. The irradiation effect could be not clearly detected with the Vickers hardness test. However, the nano indentation test of this work gives the information of the hardness up to 1.2 μm, and therefore the increase of hardness due to irradiation was detected with the nano hardness test.
With regard to the 405 nm depth location (the maximum dpa influenced location), the nano hardness for the samples before irradiation are identical, which is consistent with the Vickers hardness result, while the nano hardness value of WK-3Ta is slightly higher than that of WK-1Ta in the irradiated samples. In order to understand more about this phenomenon, a microstructure analysis was performed on the irradiated sample surfaces. The microstructure images of the unirradiated samples’ surfaces are shown for comparison. Figure 9 shows a morphology comparison between irradiated and unirradiated WK-3Ta and WK-1Ta samples. It should be noted that the nano indentation test influenced area is a very thin distance (~μm) from the sample surface. It is clear that the grain size of WK-1Ta is larger than that of WK-3Ta for both the unirradiated and irradiated samples. The grains at the irradiated surface of the WK-1Ta sample are flaky, and small falling off grains were detected. In contrast, the unirradiated surface of WK-1Ta shows a dense morphology. For WK-3Ta, the change of the microstructure before and after irradiation is not detectable—both the irradiated surface and the unirradiated surface show the dense grain morphology. Apart from that, it is difficult to detect any irradiation influence from the morphology comparison in Figure 9.
In order to have clearer information about the irradiation influence on the alloys, further STEM analyses were performed on the irradiated samples, focusing on the irradiation influenced domains. The results are shown in Figure 10. As can be seen, the dislocation loops were obviously detected for both WK-1Ta and WK-3Ta. The formation of the dislocation loops is believed to be related to irradiation hardening. We have estimated the dislocation loop density by using the dislocation loop number divided by the investigated sample volume. The results indicate that the dislocation loop densities for WK-1Ta and WK-3Ta are 3.7 × 10²³/m3 and 4.3 × 10²³/m3, respectively. The number of dislocation loops formed in WK-1Ta and WK-3Ta are very similar, and the dislocation loop density of WK-3Ta is only slightly higher than that of WK-1Ta. This phenomenon is consistent with the nano hardness analysis results. A greater concentration of Ta in the alloy did not appear to have a positive influence on irradiation hardening resistance.
It should be noted that the indentation tests were carried out at room temperature, and the doping effect of the K bubble was not addressed in the work.
Irradiation hardening has been widely reported for WK based materials [15,28,29]. Yang [28] reported that the WK alloy fabricated with the SPS method had an initial hardness of 6.27 GPa. After being irradiated with a 3 MeV W2+ ion with a displacement damage of 2 dpa, 5 dpa and 8 dpa, it had a hardness of 8.28 GPa, 8.98 GPa and 9.29 GPa, respectively. When compared to the results achieved by this work, both WK-1Ta and WK-3Ta had a hardness of 6.94 GPa before irradiation, which is 0.67 GPa higher than the WK alloy. The increase of hardness may be due to the existence of Ta. As shown in Figure 8, the enrichment of Ta at the K bubble may act as an additional obstacle for the dislocation motion under indentation. However, a higher concentration of Ta (WK-3Ta) did not bring any detectable influence on the nano indentation results before irradiation. With regard to the 5 dpa displacement damaged case, WK-1Ta and WK-3Ta had a hardness of 8.13 GPa and 8.41 GPa, which are both lower than the reported WK alloy (8.98 GPa). The existence of Ta appears to release the irradiation hardening (1.2 GPa vs. 2.71 GPa) of the WK alloy. However, it should be noted that Yang’s irradiation experiment was carried out at a much higher temperature (650 °C), while the irradiation of the work was carried out at 71 °C. The irradiation temperature may also impact the results of irradiation hardening. Mao’s [15] irradiation test was done at a temperature closer to that of this work (400 K). It was reported the rolled WK alloy had a hardness of 6.41 GPa and 6.87 GPa before and after the irradiation, respectively. However, the limited irradiation hardening may be mainly due to the low level (0.5 dpa) of displacement damage. Nevertheless, compared to the reported WK alloy results, the existence of Ta in the WK-Ta alloy may have a positive influence on hardness and resistance to irradiation hardening.

5. Conclusions

In order to analyze the effect of tantalum contents on the irradiation resistance of WK alloy, WK (containing 82 ppm potassium) alloy with 1 wt. % Ta and 3 wt. % Ta (WK-1Ta and WK-3Ta) were fabricated with the SPS process. The relative density of WK-1Ta and WK-3Ta is 97.2% and 96.4%, respectively. The average grain size of WK-1Ta and WK-3Ta are 2.08 μm and 1.51 μm, respectively. The Vickers hardness for WK-3Ta is 15% higher than that of WK-1Ta, in both irradiated and unirradiated cases. Compared to WK-3Ta, WK-1Ta has an advantage in terms of density but a disadvantage in terms of grain size and dislocation barrier when considering the Vickers hardness. Eventually, WK-3Ta shows a higher Vickers hardness than WK-1Ta. A limited difference for the Vickers hardness was detected between the irradiated and unirradiated samples.
The nano indentation test result indicates that an increase of hardness occurred in both the irradiated WK-3Ta and WK-1Ta samples. With regard to the location of the 405 nm depth (the maximum dpa influenced location), the nano hardness for the samples before irradiation are identical, while for the irradiated samples, WK-3Ta has a slightly higher nano hardness than that of WK-1Ta. After irradiation, the number of dislocation loops formed in WK-1Ta and WK-3Ta are very similar, and the dislocation loop density of WK-3Ta is only slightly higher than that of WK-1Ta. This phenomenon is consistent with nano hardness analysis results. A greater concentration of Ta in the alloy did not appear to have a positive influence on irradiation hardening resistance. Compared to the reported nano hardness of WK alloys, both WK-1Ta and WK-3Ta had a higher hardness than the WK alloys before irradiation. The increase of hardness may be due to the enrichment of Ta at the K bubble in the tungsten grain interior. Compared to the irradiation hardening results of reported WK alloys, the existence of Ta may have a positive influence on resistance to irradiation hardening.

Author Contributions

Conceptualization, J.D.; methodology, C.W. and T.Z.; validation, J.D.; formal analysis, C.W.; investigation, P.W. (Pan Wen) and C.W.; resources, J.T.; data curation, C.W.; writing—original draft preparation, J.D.; writing—review and editing, P.W. (Pinghuai Wang), X.L. and J.C.; visualization, C.W.; supervision, J.C.; project administration, X.L.; funding acquisition, J.D. and X.L. All authors have read and agreed to the published version of the manuscript.

Funding

This research was funded by National Natural Science Foundation of China (No.12192280), the Innovation Program of SWIP (No. 202103XWCXRC002), National MCF Energy R&D Program (Grant No. 2019YFE03120004).

Data Availability Statement

Not applicable.

Conflicts of Interest

The authors declare no conflict of interest.

References

  1. Linsmeier, C.; Rieth, M.; Aktaa, J.; Chikada, T.; Hoffmann, A.; Houben, A.; Kurishita, H.; Jin, X.; Li, M.; Litnovsky, A.; et al. Development of advanced high heat flux and plasma-facing materials. Nucl. Fusion 2017, 57, 092007. [Google Scholar] [CrossRef]
  2. Visca, J.H.Y.; Crescenzi, C.B.B.; Fursdon, M.; Greuner, H.; Guilhem, D.; Languille, P.; Li, M.; McIntosh, S.; Müller, A.V.; Reiser, J.; et al. European DEMO divertor target: Operational requirements and material-design interface. Nucl. Mater. Energy 2016, 9, 171–176. [Google Scholar]
  3. Coenen, J.W.; Antusch, S.; Aumann, M.; Biel, W.; Du, J.; Engels, J.; Heuer, S.; Houben, A.; Hoeschen, T.; Jasper, B.; et al. Materials for DEMO and reactor applications boundary conditions and new concepts. Phys. Scr. 2016, T167, 014002. [Google Scholar] [CrossRef] [Green Version]
  4. Tanure, L.; Terentyev, D.; Nikoli, V.; Riesch, J.; Verbeken, K. EBSD characterization of pure and K-doped tungsten fbers annealed at different temperatures. J. Nucl. Mater. 2020, 537, 152201. [Google Scholar] [CrossRef]
  5. Huang, B.; Chen, L.; Qiu, W.; Yang, X.; Shi, K.; Lian, Y.; Liu, X.; Tang, J. Correlation between the microstructure, mechanical/thermal properties, and thermal shock resistance of K-doped tungsten alloys. J. Nucl. Mater. 2019, 520, 6–18. [Google Scholar] [CrossRef]
  6. Huang, B.; Tang, J.; Chen, L.; Yang, X.; Lian, Y.; Chen, L.; Liu, X.; Cui, X.; Gu, L.; Liu, C. Design of highly thermal-shock resistant tungsten alloys with nano scaled intra- and inter-type K bubbles. J. Alloys Compd. 2019, 782, 149–159. [Google Scholar] [CrossRef]
  7. Ma, X.; Zhang, X.; Wang, T.; Lang, S.; Lv, W.; Wang, Y.; Ge, C.; Yan, Q. Large-scale potasium-doped tungsten alloy with superior recrystallization resistance, ductility and strength induced by potassium bubbles. J. Nucl. Mater. 2022, 559, 153450. [Google Scholar] [CrossRef]
  8. Ma, X.; Wang, T.; Zhang, X.; Yuan, Y.; Cheng, L.; Zhu, J.; Lv, W.; Lang, S.; Wang, Z.; Ge, C.; et al. Surface modification and deuterium retention in hot-rolled potassium doped tungsten alloy exposed to deuterium plasma. J. Nucl. Mater. 2022, 568, 153890. [Google Scholar] [CrossRef]
  9. Ma, X.; Zhang, X.; Wang, T.; Lv, W.; Lang, S.; Ge, C.; Yan, Q. Irradiation hardening behaviors of large-scale hot rolling potassium-doped tungsten alloy under synergistic irradiations of Fe11+ ion combined with deuterium and helium plasmas. Nucl. Mater. Energy 2022, 30, 101138. [Google Scholar] [CrossRef]
  10. Ishijima, Y.; Kurishita, H.; Yubuta, K.; Arakawa, H.; Hasegawa, M.; Hiraoka, Y.; Takida, T.; Takebe, K. Current status of ductile tungsten alloy development by mechanical alloying. J. Nucl. Mater. 2004, 329–333, 775–779. [Google Scholar] [CrossRef]
  11. Watanabe, S.; Nogami, S.; Reiser, J.; Rieth, M.; Sickinger, S.; Baumgärtner, S.; Miyazawa, T.; Hasegawa, A. Tensile and impact properties of tungsten-rhenium alloy for plasma-facing components in fusion reactor. Fusion Eng. Des. 2019, 148, 111323. [Google Scholar] [CrossRef]
  12. Liu, X.; Lian, Y.; Greuner, H.; Boeswirth, B.; Jin, Y.; Feng, F.; Wang, J.; Chen, L.; Song, J.; Yu, Y.; et al. Irradiation effects of hydrogen and helium plasma on different grade tungsten materials. Nucl. Mater. Energy 2017, 12, 1314–1318. [Google Scholar] [CrossRef]
  13. Chen, L.; Li, S.; Qiu, W.; Huang, B.; Lian, Y.; Liu, X.; Tang, J. Combining the K-bubble strengthening and Y-doping: Microstructure, mechanical/thermal properties, and thermal shock behavior of W-K-Y alloys. Int. J. Refract. Met. Hard Mater. 2022, 103, 105739. [Google Scholar] [CrossRef]
  14. Wang, Z.; Yuan, Y.; Arshad, K.; Wang, J.; Zhou, Z.; Tang, J.; Lu, G.H. Effects of tantalum concentration on the microstructures and mechanical properties of tungsten-tantalum alloys. Fusion Eng. Des. 2017, 125, 496–502. [Google Scholar] [CrossRef]
  15. Zhou, H.; Yu, J.; Chen, C.; Zhu, K. Effect of pre-damage induced by argon ions on the deuterium blister formation in tungsten-tantalum alloys exposed to deuterium plasma. Int. J. Hydrog. Energy 2019, 44, 23320–23329. [Google Scholar] [CrossRef]
  16. Roth, J.; Tsitrone, E.; Loarte, A.; Loarer, T.; Counsell, G.; Neu, R.; Philipps, V.; Brezinsek, S.; Lehnen, M.; Coad, P.; et al. Recent analysis of key plasma wall interactions issues for ITER. J. Nucl. Mater. 2009, 390–391, 1–9. [Google Scholar] [CrossRef] [Green Version]
  17. Ueda, Y.; Coenen, J.W.; de Temmerman, G.; Doerner, R.P.; Linke, J.; Philipps, V.; Tsitrone, E. Research status and issues of tungsten plasma facing materials for ITER and beyond. Fusion Eng. Des. 2014, 89, 901–906. [Google Scholar] [CrossRef]
  18. Zinkle, S.J.; Snead, L.I. Designing radiation resistance in materials for fusion. Annu. Rev. Mater. Res. 2014, 44, 241–267. [Google Scholar] [CrossRef]
  19. Bolt, H.; Barabash, V.; Federici, G.; Linke, J.; Loarte, A.; Roth, J.; Sato, K. Plasma facing and high heat flux materials—Needs for ITER and beyond. J. Nucl. Mater. 2002, 307–311, 43–52. [Google Scholar] [CrossRef]
  20. Bolt, H.; Barabash, V.; Krauss, W.; Linke, J.; Neu, R.; Suzuki, S.; Yoshida, N. Materials for the plasma-facing components of fusion reactors. J. Nucl. Mater. 2004, 329–333, 66–73. [Google Scholar] [CrossRef] [Green Version]
  21. Nogami, S.; Terentyev, D.; Zinovev, A.; Yin, C.; Rieth, M.; Pintsuk, G.; Hasegawa, A. Neutron irradiation tolerance of potassium-doped and rhenium-alloyed tungsten. J. Nucl. Mater. 2021, 553, 153009. [Google Scholar] [CrossRef]
  22. Fukuda, M.; Hasegaw, A.; Tanno, T.; Nogami, S.; Kurishita, H. Property change of advanced tungsten alloys due to neutron irradiation. J. Nucl. Mater. 2013, 442, S273–S276. [Google Scholar] [CrossRef]
  23. Stoller, R.E.; Toloczko, M.B.; Was, G.S.; Certain, A.G.; Dwaraknath, S.; Garner, F.A. On the use of SRIM for computing radiation damage exposure. Nucl. Instrum. Methods Phys. Res. Sect. B Beam Interact. Mater. At. 2013, 310, 75–80. [Google Scholar] [CrossRef]
  24. Tejado, E.; Carvalho, P.A.; Munoz, A.; Dias, M.; Correia, J.B.; Mardolcar, U.V. The effects of tantalum addition on the microtexture and mechanical behaviour of tungsten for ITER applications. J. Nucl. Mater. 2015, 467, 949–955. [Google Scholar] [CrossRef] [Green Version]
  25. Wen, P.; Hu, X.; Fan, C.; Tan, Y.; Qiu, W.; Zhao, T.; Li, S.; Wu, C.; Du, J.; Tang, J. Irradiation hardening of WK-based PFM exposed to 14 MeV protons. Fusion Eng. Deign 2023, 187, 113379. [Google Scholar] [CrossRef]
  26. Garrison, L.M.; Katoh, Y.; Snead, L.L.; Byun, T.S.; Reiser, J.; Rieth, M. Irradiation effects in tungsten-copper laminate composite. J. Nucl. Mater. 2016, 481, 134–146. [Google Scholar] [CrossRef] [Green Version]
  27. Dellis, S.; Xiao, X.; Terentyevc, D.; Mergiaa, K.; Krimpalis, S.; Bakaev, A.; Messoloras, S. Mechanical properties of neutron-irradiated single crystal tungsten W(100) studied by indentation and FEM modelling. J. Nucl. Mater. 2021, 551, 152985. [Google Scholar] [CrossRef]
  28. Yang, X.L.; Chen, L.Q.; Qiu, W.B.; Song, Y.Y.P.; Tang, Y.; Cui, X.D.; Liu, C.S.; Jiang, Y.; Zhang, T.; Tang, J. Irradiation hardening behaviors of tungsten-potassium alloy studied by accelerated 3-MeVW2+ ions. Chin. Phys. B 2020, 29, 046102. [Google Scholar] [CrossRef]
  29. Song, Y.Y.P.; Qiu, W.B.; Chen, L.Q.; Yang, X.L.; Deng, H.; Liu, C.S.; Zhang, K.; Tang, J. Hardening effect of multi-energy W2+-ion irradiation on tungsten–potassium alloy. Chin. Phys. B 2020, 29, 105202. [Google Scholar] [CrossRef]
Figure 1. SPS sintering process of WK-Ta alloys.
Crystals 13 00951 g001
Figure 2. Distribution profile of irradiation damage and the W2+ concentration of the irradiation.
Crystals 13 00951 g002
Figure 3. Cross section image of WK-1Ta and WK-3Ta.
Crystals 13 00951 g003
Figure 4. Summary of the grain sizes of WK-1Ta and WK-3Ta.
Crystals 13 00951 g004
Figure 5. Scanning transmission electron microscope image of WK-3Ta. (a) Annular bright field (ABF) image of the sample; (b) EDX analysis for element W; (c) EDX analysis for element Ta; (d) EDX analysis for element O.
Crystals 13 00951 g005
Figure 6. Nano hardness result for the investigated samples.
Crystals 13 00951 g006
Figure 7. Nano hardness values for the 405 nm depth of the investigated samples.
Crystals 13 00951 g007
Figure 8. EDX analysis result of the breaking face of the WK-1Ta specimen.
Crystals 13 00951 g008
Figure 9. Morphology comparison between irradiated and unirradiated WK-3Ta and WK-1Ta samples.
Crystals 13 00951 g009
Figure 10. Scanning transmission electron microscope images of samples after irradiation. The upper images are the dislocation loops for the WK-1Ta sample (dislocation loop density 3.7 × 10²³/m3); the lower images are the dislocation loops for the WK-3Ta sample (dislocation loop density 4.3 × 10²³/m3).
Crystals 13 00951 g010
Table 1. Chemical composition and particle size of the AKS-W powder for ball milling.
Particle Size, μmElement Content (ppm)Oxygen Content (wt. %)
KAlSiNaFeCaCuTiMoNiCoNSC
3.288230185<128<5<1<5<54413<10<100.1
Table 2. Chemical composition of tantalum powder for ball milling.
Particle
Size, μm
Element Content (wt. %)
AlFeCaMgCuMnNaCoNiSiPKSC
10.50.0040.0180.0040.0010.0010.0010.0020.0010.0010.0040.0030.0020.0040.005
Table 3. Vickers hardness of the samples before and after irradiation.
HV0.2
1.96 N, 15 s
Location 1Location 2Location 3Average
WK-1Ta404.2433.8398.1412.0 ± 19.1
WK-3Ta496.0520.0510.0508.7 ± 12.1
WK-1Ta-irr406.3414.2422.9414.5 ± 8.3
WK-3Ta-irr517.3536.8501.1518.4 ± 17.9
Disclaimer/Publisher’s Note: The statements, opinions and data contained in all publications are solely those of the individual author(s) and contributor(s) and not of MDPI and/or the editor(s). MDPI and/or the editor(s) disclaim responsibility for any injury to people or property resulting from any ideas, methods, instructions or products referred to in the content.

