Abstract
In this study, according to the acquired polydopamine deposition rates, polydopamine films with equal thickness were prepared under different conditions on SiO2 substrates. Subsequently, we investigated the influence of dopamine solution pH and concentration on the formation of surface aggregates of the deposited polydopamine films. Assumptions were made to explain how pH and concentration execute their effects. Based on the optimized parameters, a continuous and smooth polydopamine film with a thickness of about 14 nm and a roughness of 1.76 nm was fabricated on a silicon dioxide substrate, through the deposition for 20 minutes in a dopamine solution with a concentration of 1.5 mg/mL and a pH of 8.2. The prepared polydopamine film was then employed as a precursor and subjected to a high-temperature process for the carbonization and graphitization of the film. Raman spectroscopy analysis indicated that the resulting graphene-like film had fewer structural defects in comparison with previous works and the results of XPS indicated that most of the carbon atoms were bound into the cross-linked honeycomb lattice structure. The prepared graphene-like material also exhibited high electrical conductivity and satisfying mechanical elasticity.
1. Introduction
As an emerging surface modification technology, mussel biomimetic chemistry is applied in many scientific research fields such as biology, energy, and environment technology. In this trend, the technology based on dopamine garnered significant attention. In 2007, Lee et al. [1] reported that dopamine can undergo oxidative self-polymerization in a weak alkaline environment, leading to the formation of polydopamine (PDA) coatings on various substrates. Further investigations by Yminu et al. [2] revealed that PDA coatings can be formed on a wide range of materials, including noble metals (Au, Ag, Pt, and Pd), metals with native oxide on the surface (such as Cu, stainless steel, and NiTi shape memory alloys), oxides (TiO2, non-crystalline SiO2, quartz, Al2O3, and Nb2O5), semiconductors (such as GaAs and Si), ceramics, and synthetic polymers, etc.
The self-polymerization reaction of dopamine requires only moderate preconditions, resulting in facile deposition of polydopamine (PDA) layers [3]. Moreover, PDA exhibits good adhesion properties on various surfaces, making it a versatile material for constructing functional surfaces. Ultrathin PDA films can be achieved by regulating the deposition time and through subsequent high-temperature process, the films can be graphitized to graphene-like materials [4,5]. In comparison with other graphene fabrication methods, e.g., chemical vapor deposition (CVD), chemical synthesis, exfoliation of graphite and SiC pyrolysis, the approach with PDA has many advantages. There are no dangerous chemicals, extreme high-temperature processes, or severe environment harmful waste products involved in the PDA method. Moreover, with other approaches, the prepared graphene, in most cases, must be transferred to a suitable substrate, e.g., a substrate with a dielectric layer on the surface, to form the desired devices. With the fabrication method in this study, however, the graphene-like film can be achieved in situ on a SiO2 substrate [6,7]. Therefore, a transfer-process is not necessary anymore. Additionally, the graphene-like material prepared with this method adhere very well to the underlying SiO2 film, while transferred graphene supposedly is not so well adherent.
In 2011, Liu et al. [8] reported the successful conversion of solution oxidation-derived PDA to carbon at 800 °C in a nitrogen atmosphere, yielding a carbon material with approximately 7.28% nitrogen doping and nearly 60% carbon yield. Building on this work, J. Kong et al. [9] used various test apparatuses to investigate the structure of the PDA film on a SiO2 substrate after carbonization, revealing that the resulting carbonized PDA (C-PDA) coating had a graphite-like layered structure. Li et al. [10] deposited PDA on a substrate and obtained a highly ductile conductive carbon film by annealing the PDA coating. Lim et al. [11] adjusted the thickness of the carbon film from a few nanometers to tens of nanometers by varying the number of repetitions of the coating process, and the size of the resulting carbon film could be as large as that of the underlying silicon wafer. While graphene-like carbon films were fabricated through high-temperature carbonization of PDA in these studies, these films exhibited many structural defects. It is believed that the structure of the precursor is a key factor affecting the quality of the carbonized final products. Shin et al. [12] showed that the use of organic matter as a precursor for graphene synthesis results in better quality graphene with thinner films. However, there are few reports on obtaining graphene-like materials with fewer defects by improving the structure of the PDA films.
PDA coatings are commonly obtained through the self-deposition of dopamine under alkaline conditions, and physical measures can be employed to adjust PDA deposition. Wei et al. [13] utilized heating and stirring of the dopamine solution to quickly deposit a thicker PDA film, and Gao’s research group [14,15] developed a technology for cyclically extracting and reloading the dopamine deposition solution to prepare PDA coatings with gradient thickness. However, these studies did not pay attention to the problem that many aggregates on the film surface are easy to occur during the PDA self-deposition process., which can negatively affect the performance of the final product when PDA is used as a precursor for carbon-based materials. Although Kim et al. [16] obtained a flat and smooth PDA film with low roughness by passing oxygen into the solution, this preparation method is complex and costly. Ultrasound was also used by Diana et al. [17] to remove aggregates from the surface of the PDA coating, but this approach damaged the film. In this study, we investigated the effects of pH and dopamine concentration on aggregate formation on the PDA surface during the self-deposition process to obtain a PDA film with more ideal structure, so that better graphene-like materials can be achieved employing the improved PDA film as a precursor. In another word, we improved the quality of the precursor to optimize the prepared graphene-like materials and realize the in situ fabrication of the graphene-like film on the substrate. With optimized parameters, we were able to prepare a continuous and flat PDA film with a thickness of about 14 nm and a roughness of 1.76 nm on a SiO2 substrate. The deposition process lasted 20 min in a dopamine solution with a pH of 8.2 and a dopamine concentration of 1.5 mg/mL. The resulting PDA film was carbonized at 800 °C and 1000 °C with a heating rate of 10 °C/min under a vacuum of 0.1 Pa. The generated graphene-like film had fewer defects and higher conductivity compared to those fabricated with other PDA films.
2. Materials and Methods
2.1. Materials
The dopamine hydrochloride powder and the tris powder were purchased from Shanghai Aladdin Biochemical Technology Co., Ltd., Shanghai, China. The former had a purity of 98%, and was stored in a dry environment at 2–8 °C. The purity of the latter was greater than or equal to 99.8% with 0–0.005% H2O insoluble matter. Before the experiments, the tris powder was stored in a dry environment at room temperature. The PDA films were deposited on monocrystalline silicon substrates with 300 ± 20 Å silicon dioxide layer on top of them. These substrates were acquired from Tianjin Semiconductor Research Institute, China, and produced in April 2022. They were 10 × 10 mm quadrate samples and were 500 μm thick.
2.2. Preparation
2.2.1. Cleaning of Silicon Dioxide Substrates
At first, the silicon dioxide substrates were flushed 3 times with deionized water, soaked in deionized water, and ultrasonically cleaned for 10 min to remove coarse contaminants. After that, SC1 cleaning for substrates was carried out. A total of 5 parts of deionized water, 1 part of ammonia water (25% by weight of NH3), and 1 part of H2O2 solution (30%) were poured into a beaker. Subsequently, the samples were placed into the beaker and immersed in the solution at 80 °C for 12 min to remove organic residues from the substrates. After the SC1 cleaning was completed, samples were removed from the beaker, and rinsed with deionized water to remove the residual from SC1. Afterwards, the SC2 cleaning was also performed. The cleaning solution for the SC2 was comprised of 6 parts of deionized water, 1 part of hydrochloric acid solution (37% by weight), and 1 part of hydrogen peroxide solution (H2O2, 30%). The silicon dioxide substrates were laid into the solution and soaked there at 80 °C for 10 min to remove possible metal residues from the samples. After that, the samples were washed with deionized water again in order to remove the residues from the SC2 cleaning and kept in deionized water waiting for further processing.
2.2.2. Preparation of Dopamine Solution
- Solutions with different pH values:Firstly, three portions of dopamine hydrochloride powder were weighed, and were found to be 50 mg each, and they were dissolved each in 50 mL deionized water to form dopamine hydrochloride solution with a concentration of 1 mg/mL. Then, the tris powder was added slowly to set the pH of the three solutions to 7.9, 8.2 and 8.5, respectively.
- Solutions with different dopamine concentrations:Three portions of dopamine hydrochloride powder (50 mg, 75 mg, 100 mg) were weighed at first. Subsequently, each of them was dissolved in 50 mL deionized water to prepare the dopamine hydrochloride solution with the concentration of 1 mg/mL, 1.5 mg/mL, 2 mg/mL, respectively. Afterwards, tris powder was added slowly to adjust the pH of the solution to 8.2.
2.2.3. Preparation of Polydopamine Films
The cleaned silicon dioxide substrates were immersed in a dopamine hydrochloride solution. Then, the solution with the samples was placed in an orbital shaker to deposit the PDA film in a dark environment. The rotational speed of the orbital shaker was held at 80 r/min during the deposition. When the deposition was finished, the surface of the silicon dioxide samples was rinsed with deionized water and then dried with N2.
2.2.4. Carbonization of Polydopamine Films
The N2 dried samples were divided into 2 groups. They were annealed in a vacuum of 0.1 Pa at 800 °C or 1000 °C for 60 min, respectively. During the annealing processes, the samples were heated from room temperature to the set temperature at a heating rate of 10 °C/min.
2.3. Characterization
The cross section of the silicon dioxide samples with the deposited PDA film were characterized with scanning electron microscope (SEM) with the model of JIB-4700F from JEOL. The accelerating voltage of electrons were set to be 10 kV or 15 kV. The image magnification at the observation was adjusted between 50,000 and 85,000 to have clear images of the cross sections of the PDA films. For the SEM characterization of the film surface, the accelerating voltage was selected as 10 kV, and the magnifications were set to be 50 and 1000 to obtain the overall and the local images of the surface aggregations on the PDA film.
The surface of the PDA film deposited for a short time was observed with an optical microscope (SMIC) at a magnification of 100. Some sample surfaces were scratched with a tweezer on purpose. With the optical microscope, it can be judged, to some degree, whether a continuous PDA film was formed, based on whether obvious scratches could be made with the tweezer on the film surface. The model of the employed Atomic Force Microscope (AFM) was SPA400-SP13800N, from Seiko Corporation. The surface of the PDA films with different deposition time was characterized with AFM by an image size of 5 μm × 5 μm to investigate the surface roughness and morphology.
The applied X-ray diffraction (XRD) equipment was a product from Rigaku, Japan, with the model of Smart Lab 9 kW. It scanned the flat PDA films and the films with a great quantity of surface aggregations with the 2θ angle varying from 5° to 50° to detect the possible different crystalline structures. A Laser micro-Raman imaging spectrometer from Thermo Fisher (China) with the model of DXRxi was employed for the characterization of the molecular structure of the carbonized PDA films. The measurements were carried out with a spectral resolution <1.5 cm−1. The Raman spectroscopy analysis was performed on the flat films without aggregations, the films with many aggregates on the surface and the films with big thickness, to determine the structural defects in the films.
A pH meter (ST3100E from Ohaus) was deployed to detect the pH value of the reaction solution in order to explore the effect of the pH on the self-deposition of dopamine. The electrical conductivities of the carbonized PDA films were measured using a Hewlett Packard 4140BpA Meter/DC Voltage source.
3. Results and Discussion
Lee’s method [1] was employed to prepare PDA films. The elements ratio of the films was analyzed at various positions in the cross section of the prepared samples using EDS (energy dispersive spectroscopy). Figure 1a depicts the detection positions, where point 1 corresponds to the deposited PDA film, and point 2 lies in the SiO2/Si substrate area. The EDS measurement at point 1 is depicted in Figure 1b, which revealed that the main element in the deposited film was C, accounting for 51.8%, while there were also 5.4% N, 9.7% Si, and 33.1% O in the film. The presence of Si and O may have originated from the environment or some SiO2 particles present at the cross section. The existence of O may also be attributed to the oxidation of the deposition solution. On the other hand, the EDS result at point 2 shown in Figure 1c was significantly different from that of the deposited film. At point 2, the main elements were O and Si, with proportions of 50.5% and 32%, respectively. Through the EDS measurement, we also detected a certain proportion of C (16.8%) and a very small percentage of N (0.7%). These elements may have originated from the deposited film and might have reached the cross section during the EDS analysis, as the sample was broken. Additionally, C may have also originated from the environment. The observed film structure in Figure 1a and the different proportions of elements at the film cross section and the substrate cross section confirm the formation of PDA films on the surface of the SiO2 substrate.
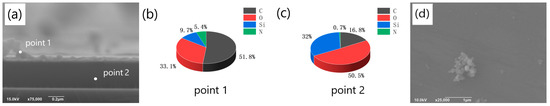
Figure 1.
(a) SEM image of the cross-section of the film obtained on the silicon dioxide substrate and EDS detection position (point1 corresponds to the cross-section of the film, point2 corresponds to the cross-section of the substrate); (b) the proportion of different elements at the film cross-section (point1); (c) The proportion of different elements at the cross section of the substrate (point2); (d) SEM image of the aggregates on the film surface.
During the self-deposition process of dopamine, aggregates are prone to form on the film surface, as illustrated in Figure 1d. The XRD analysis revealed that the molecular chain orientation and crystallinity of the aggregates were distinct from those of the flat film (XRD analysis of the film and the aggregate shown in Figure S1). The aggregates not only affected the smoothness of the PDA film but also influenced the properties of the graphene-like layer produced through carbonization of the former. Therefore, we explored the influencing factors for the formation of the aggregates. Firstly, we explored the effect of different pH values on the formation of aggregates on the surface of PDA films. The pH value of the polymerization system exerted a significant influence on the polymerization reaction, and it also held true for the self-polymerization of dopamine to form PDA under alkaline conditions. Specifically, a lower pH value was detrimental to the formation of PDA on the substrate surface, while an excessively high pH value can lead to the presence of a significant number of aggregates on the surface of the resulting PDA film. Thus, it was necessary to investigate the effects of pH on the formation of PDA in order to obtain a smooth, continuous, and aggregate-free PDA film on the substrate surface [18,19]. In 2009, Zhu et al. [20] discovered that the dopamine composite film, prepared from a buffer solution with a pH of 8.5, exhibited superior adsorption properties. However, this does not necessarily imply that the optimal pH value for the formation of the graphene-like carbonized film will also be 8.5 when the PDA layer serves as the starting material.
We studied the deposition rate of PDA on SiO2 substrates with dopamine solutions of different pH values, under the condition that the dopamine hydrochloride concentration of the solutions was 1 mg/mL. Based on the obtained deposition rates, PDA films of identical thickness were prepared to investigate the effects of different pH values on the formation of aggregates on the film surface. Figure 2a–c depict the SEM images of the cross-section of PDA films prepared with a deposition time of 60 min on the surface of the SiO2 substrate under pH values of 7.9, 8.2, and 8.5, respectively (the test results of the pH values are displayed in Figure S2). The thicknesses of the deposited films were 23.62 nm, 27.06 nm, and 28.09 nm, respectively. Figure 2d–f illustrate the SEM images of the cross-section of PDA films deposited for 90 min under the same conditions as previously mentioned, i.e., pH values of 7.9, 8.2, and 8.5. The thicknesses of the films were 36.32 nm, 43.31 nm, and 45.28 nm, respectively. We utilized the software IrfanView to calculate the width of different positions of the film in the figure, based on the scale in the figure, and then, we calculated the average value.
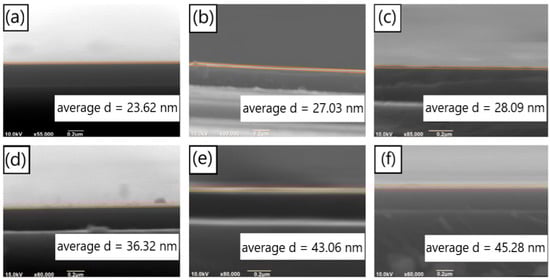
Figure 2.
SEM images of the cross section of the PDA films on silicon dioxide substrates deposited for 60 min under the conditions of (a) pH = 7.9, (b) pH = 8.2 and (c) pH = 8.5; SEM images of the cross section of the PDA films on silicon dioxide substrates deposited for 90 min, with (d) pH = 7.9, (e) pH = 8.2 and (f) pH = 8.5.
We conducted a series of SEM measurements to determine the thickness of PDA films under various deposition time conditions, and the results are summarized in Table 1. The relationship between the film thickness and the pH value is shown in Figure 3a. It is evident that, under the same deposition time, the film thickness increased with an increasing pH value. However, this increasing trend weakened as the pH value became higher. The different shades of darkness observed in the deposition solutions with different pH values (Figure S3) were consistent with the film thickness results presented in Figure 3a (the color of the solution serves as an indicator of the deposition rate. Specifically, the solution with a pH of 7.9 appears lighter, suggesting a slower deposition rate and smaller film thickness. On the other hand, solutions with pH values of 8.2 and 8.5 are similar in color, indicating that their deposition rates are also similar and their resulting film thicknesses are close). In Figure 3b, the film thickness is plotted against the deposition time, with the solution pH value being taken as the parameter. Within the range of deposition time between 0 and 90 min and a pH range from 7.9 to 8.5, the thickness of the deposited PDA film varied almost linearly with the deposition time. The deposition rates of PDA under the conditions of pH = 7.9, 8.2, and 8.5 were 0.399 nm/min, 0.466 nm/min, and 0.486 nm/min, respectively.

Table 1.
Thickness of the PDA film deposited for different time.
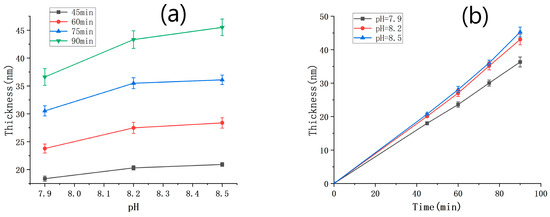
Figure 3.
(a) PDA film thickness against pH under different time conditions; (b) PDA film thickness against deposition time under different pH conditions.
Based on the obtained self-deposition rates of dopamine under different pH conditions, we prepared three sets of PDA film samples with equal thickness on SiO2 substrates using solutions with pH values of 7.9, 8.2 and 8.5, respectively, deposited for 73 min, 63 min and 60 min, respectively. The density of aggregates on the film surface, film flatness, and continuity were investigated using SEM. Initially, the local morphology of the films was observed using 1000× magnified images. Figure 4a–c correspond to pH values of 7.9, 8.2, and 8.5, respectively. It was observed that the film surface was smooth with almost no visible aggregates at pH values of 7.9 and 8.2, while numerous aggregates appeared on the surface of the film deposited at pH = 8.5. From the curve in Figure 3a, it can be inferred that the effect of pH on the PDA film primarily concerns the establishment of film thickness between pH values of 7.9 and 8.2, whereas within the range of pH 8.2–8.5, the effect on film thickness was insignificant, and the increase in pH significantly influenced the formation of aggregates. This phenomenon could be attributed to the gradual increase in the binding rate of dopamine molecules on the silica surface as the concentration of OH- increased under weaker alkaline conditions, resulting in the rapid formation of dopamine molecules on the surface of silica. When the concentration of OH- reaches a certain value, the increase in the binding rate of dopamine molecules on the SiO2 surface was no longer significant. Instead, it influenced the self-polymerization of freely moving dopamine molecules in the solution, resulting in more aggregates on the film surface. Another possible explanation is that a weaker alkaline solution tends to donate more protons to saturate the dangling bonds of dopamine molecules, reducing their chemical activity. Therefore, less self-polymerization will occur under weaker alkaline conditions, leading to smooth films without aggregates.
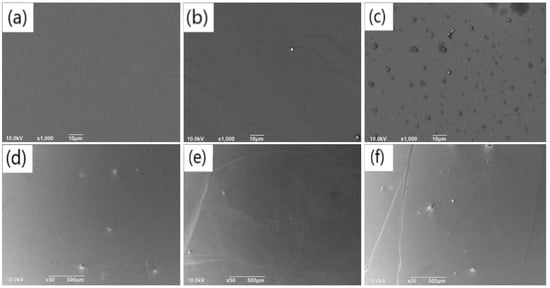
Figure 4.
SEM images (1000×) showing the surface of the PDA films with the same thickness deposited for different duration on silicon dioxide substrates under the conditions of (a) pH = 7.9, (b) pH = 8.2 and (c) pH = 8.5; 50× SEM images of the surface of the above-mentioned films corresponding to (d) pH = 7.9, (e) pH = 8.2, and (f) pH = 8.5, respectively.
SEM images with 50× magnification of the surface of the films deposited at pH values of 7.9, 8.2, and 8.5 are presented in Figure 4d–f. The particle size and quantity of surface aggregates are illustrated in Figure S4a–c. The results indicate that, under each pH condition, aggregates appeared on the film surface. However, the number of aggregates on the film surface was relatively small with pH = 8.2, and the average particle size of the aggregates was also small (12.48 μm) compared to the other films. On the other hand, higher numbers of aggregates (8 and 15) arose on the film surface under the condition of pH = 7.9 and 8.5, respectively. Moreover, the average size of the aggregates increased to 13.28 μm and 12.91 μm. Combined with the previous observations on subtle aggregates (Figure 4a–c), it can be concluded that under the condition of pH = 7.9, there were a few large aggregates, but almost no fine aggregates on the film surface. In contrast, under the condition of pH = 8.2, the surface of the film was relatively smooth, with few large or subtle aggregates. However, under the condition of pH = 8.5, there were not only some large aggregates but also a great quantity of subtle aggregates on the film surface. As -mentioned above, the smooth surface of the film deposited with the solution of pH = 8.2 can be attributed to the plenty of protons in the solution, which can saturate the dangling bonds of the dopamine molecules. When the pH decreased further, it is supposed that the film that was built beginning with discrete aggregates before a continuous layer was constructed. This may lead to the final film with large aggregates on the surface, just like in the case of the pH of 7.9.
In chemical reactions, the rate of reaction under some conditions is influenced by the concentration of the reactants [21,22], thereby exerting an effect on the final product. In light of the impact of pH values on the formation of surface aggregates in the PDA film, we selected pH 8.2 with fewer aggregates and further investigated the influence of dopamine concentration in the deposition solution on aggregate formation. This investigation aimed to minimize the number of aggregates and achieve a smooth film.
Similar to the exploration of the impact of pH value, we investigated the effects of different dopamine solution concentrations on the deposition rates of PDA films on SiO2 substrates, with the aim of identifying conditions that lead to reduced aggregates and a smoother film. Specifically, we prepared PDA films of the same thickness under various concentration conditions and studied the aggregates on their surfaces. SEM images of the cross-sectional views of PDA films deposited for different time periods with varying dopamine concentrations are shown in Figure 5a–e, which represent film thicknesses of 41.34 nm, 53.15 nm, 64.95 nm, and 79.16 nm, respectively. We also examined a low dopamine concentration of 0.5 mg/mL, as shown in Figure S5a, where only a few aggregates were observed on the SiO2 substrate, and no continuous film was formed. To confirm the formation of a continuous PDA film, EDS analysis was performed on the film surface, a relatively high proportion of C, O and N element was detected only at the aggregates, and there was nearly no C or N element observed in the non-aggregated areas. It could be verified that a PDA film with irregular surface was formed on the SiO2 substrate.
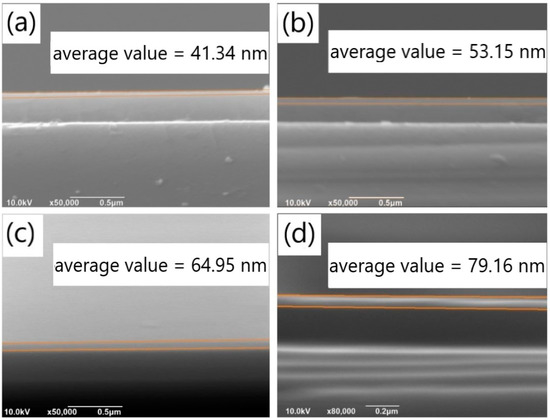
Figure 5.
Cross-sectional SEM images of PDA films obtained on silicon dioxide substrates under the concentration conditions of (a) 1.5 mg/mL and (b) 2 mg/mL with a deposition time of 60 min; Cross-sectional SEM images of the PDA film obtained on the silicon dioxide substrates under the concentration conditions of (c) 1.5 mg/mL and (d) 2 mg/mL with a deposition time of 90 min.
The thickness of the PDA films was measured using SEM under various deposition time conditions, and the results are presented in Table 2. By combining these results with the thickness of the PDA film deposited with a solution concentration of 1 mg/mL (Table 1), the relationship between the film thickness and the concentration was plotted in Figure 6a. As shown in the figure, the film thickness gradually increased with the concentration for all deposition times below 90 min, and the relationship between the two variables was linear. This finding is consistent with the chemical reaction rate formula Δv(A) = Δc (A)/Δt, where v represents the reaction rate, c is the reactant concentration, and t denotes the reaction time. Figure 6b illustrates the relationship between the film thickness and deposition time for different solution concentrations. It can be observed that the film thickness increased linearly with deposition time, when the concentration was between 1 and 2 mg/mL and the deposition time was below 90 min. Specifically, at solution concentrations of 1.5 mg/mL and 2 mg/mL, the deposition rates of dopamine were 0.705 nm/min and 0.883 nm/min, respectively.
Table 2.
Thickness of the PDA film deposited for different time.
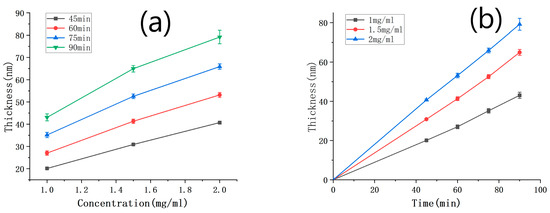
Figure 6.
(a) Curve of PDA film thickness against the concentration of the dopamine solution, with the deposition time as a parameter; (b) curve of PDA film thickness with the deposition time, under different concentrations.
According to the deposition rates obtained from our experiments, we fabricated two sets of samples with SiO2 substrates. The first set underwent PDA deposition for 42 min in a solution with a concentration of 1.5 mg/mL, while the second set underwent deposition for 32 min in a solution with a concentration of 2 mg/mL. Both groups were prepared using a solution with a pH value of 8.2, resulting in PDA films with the same thickness under different concentration conditions. The density of aggregates on the film surface, as well as the flatness and continuity of the film, were investigated using SEM. Similar to our exploration of the effect of pH value, we examined the subtle particles on the film surface using 1000× magnified images. Figure 7a,b correspond to the concentrations of 1.5 mg/mL and 2 mg/mL, respectively. It was observed that the film surface corresponding to 1.5 mg/mL was smooth, without any subtle aggregated particles. In contrast, a great quantity of aggregates was present on the surface of the film prepared with a concentration of 2 mg/mL. SEM images with a magnification of 50×, depicting the surface of the film having the concentrations of 1.5 mg/mL and 2 mg/mL, are shown in Figure 7c,d, respectively. The particle size and quantity of surface aggregates are summarized in Figure S6a,b. It is noted that, for the concentration of 1.5 mg/mL, the number of aggregates on the film surface was very small, and the average particle size of the aggregates was 9.36 μm. In contrast, when the concentration increased to 2 mg/mL, the number of aggregates on the film surface increased significantly compared to the concentration of 1.5 mg/mL, exceeding 50, and the average particle size was 10.41 μm.
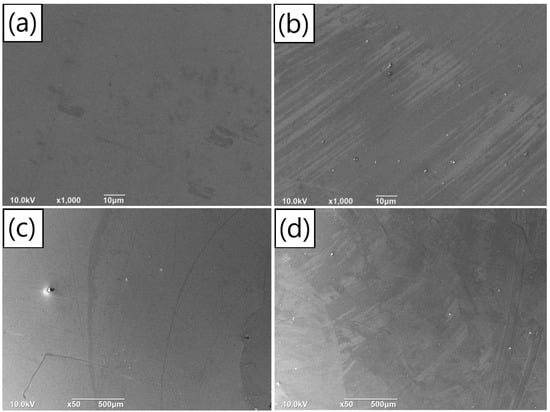
Figure 7.
Surface SEM images (1000×) of the same thickness PDA films prepared with different deposition time on silicon dioxide substrates under the concentrations of (a) 1.5 mg/mL and (b) 2 mg/mL; surface SEM images (50×) of the same thickness PDA films fabricated with different deposition time on silicon dioxide substrates under the concentrations of (c) 1.5 mg/mL and (d) 2 mg/mL.
By observing the surface aggregates on the PDA film under two concentration conditions and combining with the previous inspection of the PDA film formed at the concentration of 1 mg/mL (Figure 4b,e), we can conclude that the number of large particles and tiny aggregates on the film of 2 mg/mL was greater than that of the films deposited under the other two concentrations. In the cases of concentrations of 1 mg/mL and 1.5 mg/mL, the film surface was relatively flat, and there were few large particles on the surface. Compared with the film of 1 mg/mL, the PDA film deposited at the concentration of 1.5 mg/mL was smoother. Furthermore, no subtle aggregates were observed on the film surface in the latter case, and the average particle size of the large particles was also smaller. This is probably because the concentration of 1 mg/mL was insufficient to make dopamine molecules form film structure rapidly. At this concentration, the film can only be formed through continuous accumulation of dot aggregates, leading to aggregates arising on the surface. The concentration condition of 1.5 mg/mL satisfied the requirement for dopamine molecules to build a film structure rapidly. As a result, no subtle aggregates are formed on the film surface. However, the continuous increase in concentration also promoted the self-polymerization of the freely moving dopamine molecules in the solution, resulting in more aggregates on the surface of the deposited film. This may be the case for the film of 2 mg/mL [23,24].
Based on the investigation of the impact of varying pH levels and concentrations on the deposition of PDA film, a pH level of 8.2 and a concentration of 1.5 mg/mL were selected to deposit the PDA film with fewer surface aggregates. To determine the appropriate parameters for a continuous and thin PDA film, the deposition time was gradually increased. PDA films with deposition times of 2 min, 10 min, and 20 min were prepared. However, when the film thickness was very small, it was challenging to ascertain whether a continuous film structure was formed from the cross-sectional SEM images. According to this situation, we tried to make use of the optical microscope (OM) and scratches made in the film, assisted with the SEM inspection, to assess whether a continuous film was formed on the sample surface. The surface of the PDA film was investigated with OM, and the sample surface of the film was scraped to make some scratches. The OM observations are presented in Figure 6, where Figure 6a–c illustrate the OM images of the PDA film surface deposited for 2 min, 10 min, and 20 min, respectively. It can be observed that the sample surface characterized by OM was blue-purple under a deposition time of 2 min, which corresponds to the color of SiO2. This suggests that at the deposition time of 2 min, there was either no PDA film formed on top of the SiO2 layer or only sporadic dotted PDA accumulations. In contrast, under a deposition time of 10 min, the OM image of the sample surface appeared light yellow, and no obvious scratches could be observed after the surface was lightly scratched. It is supposed, under the deposition time of 10 min, layered PDA may be formed in some areas on the surface of the sample, but it lacks continuity and integrity. When the deposition time reached 20 min, the light-yellow color became more intense than that of the PDA film deposited for 10 min. Obvious scratches were found on the sample surface when it was lightly scraped. Thus, we conclude that a continuous and complete PDA film was formed on the sample with a deposition time of 20 min.
Atomic force microscopy (AFM) was utilized to investigate the surface roughness of the PDA film and to validate the observations obtained from OM. AFM images of the PDA film deposited on a SiO2 substrate are shown in Figure 8d–f, corresponding to deposition times of 2 min, 10 min, and 20 min, respectively. The surface roughness of the PDA film deposited for 2 min was found to be 0.6458 nm, which is comparable to that of the SiO2 substrate. The presence of abundant white spots in the AFM image suggests the absence of a continuous PDA layer on the sample surface. When the deposition time was increased to 10 min, the number of white spots decreased, and the surface roughness increased to 3.185 nm. These observations imply that a layered PDA film was formed in some regions on the sample surface, but the film structure was non-uniform, and some point-like aggregates still existed on the substrate surface. Comparatively, the PDA film deposited for 20 min exhibited a significant change in the surface morphology. The absence of white spots in the AFM image suggests the presence of a uniform and continuous PDA film on the SiO2 substrate, and the surface roughness decreased to 1.763 nm as compared to the 10 min deposition. The cross-sectional view of the AFM scanning of the PDA film deposited for 20 min is presented in Figure 8g (its corresponding surface AFM image and test position are shown in Figure S7), where a depression ten of nanometers wide is observed. The absence of the PDA film at this location may be due to direct contact of the AFM probe with the SiO2 layer at the bottom of the depression. The thickness of the PDA film, estimated from the difference between the lowest part of the depression and the film surface, was about 14 nm, which is consistent with the PDA deposition rate deduced from Figure 6.
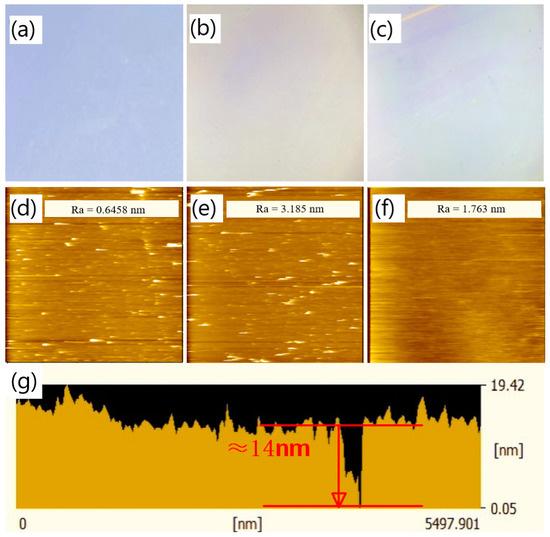
Figure 8.
OM image of the surface of the PDA film deposited on silicon dioxide substrate under the pH of 8.2 and the concentration of 1.5 mg/mL with a deposition time of (a) 2 min, (b) 10 min, and (c) 20 min; the AFM image of the surface of the PDA film deposited on silicon dioxide substrate under the pH of 8.2 and the concentration of 1.5 mg/mL with a deposition time of (d) 2 min, (e) 10 min, and (f) 20 min; (g) the cross-sectional view of the AFM scanning of the surface of the PDA film under the deposition time of 20 min.
The PDA film was synthesized using optimal parameters (pH = 8.2, solution concentration of 1.5 mg/mL, and deposition for 20 min), followed by carbonization to obtain graphene-like material through annealing at 800 °C in a vacuum (0.1 Pa) for 60 min at a heating rate of 10 °C/min. Raman spectroscopy was employed to analyze the carbon chain structure of the carbonized PDA film and compare it with that of films with the same thickness but different surface characteristics. Specifically, we compared the Raman spectra of the carbonization products of the PDA film with a smooth surface and no surface aggregates prepared with the optimized parameters (red curve), the carbonization products of the thicker PDA film (green curve), and the carbonization products of the PDA film with surface aggregates (blue curve). In Figure 9a, the Raman spectra of all three curves show obvious D peaks, indicating the presence of structural defects. Additionally, all three curves display 2D peaks, indicating the presence of multi-layered graphene. The ID/IG and I2D/IG ratios were compared and are summarized in Figure 7b. The ID/IG ratio of the carbonization products of the PDA film with a smooth surface and no surface aggregates prepared with optimal parameters was lower than that of the thicker PDA film and the PDA film with surface aggregates, suggesting fewer structural defects. Moreover, the half-peak width of the red curve was comparatively narrow, indicating a higher degree of graphitization. The I2D/IG ratios in all three cases were significantly less than 1, indicating the carbonized films consist of multi-layered graphene rather than one-layer graphene.
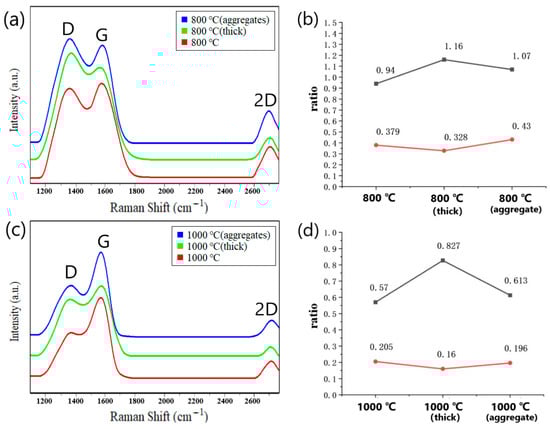
Figure 9.
(a) Comparison of Raman spectra of the at 800 °C carbonized PDA films with different morphologies (red curve corresponds to PDA film prepared according to the achieved optimal parameters, green curve corresponds to PDA film with smooth surface but bigger thickness, the blue curve corresponds to PDA film with the same thickness as the red curve, but aggregates on the surface). (b) The ratios of ID/IG and I2D/IG in three cases after carbonization at 800 °C; (c) Raman spectrum comparison after carbonization at 1000 °C. (d) The ratios of ID/IG and I2D/IG in three cases after carbonization at 1000 °C.
The PDA films were carbonized at 1000 °C under vacuum conditions (0.1 Pa) while maintaining the same heating rate. The resulting Raman spectra are presented in Figure 9c. It was evident from the spectra that the D peaks of the three curves weaken significantly with increasing annealing temperature, while the 2D peaks also exhibited a marked reduction. This behavior may be attributed to the accelerated decomposition of PDA at high temperature, promoting the rapid and thorough combination of carbon atoms and improved crystallinity of the carbonized layer. The ratios of ID/IG and I2D/IG in the three cases were compared, as depicted in Figure 9d. Consistent with the previous case of 800 °C, the ID/IG ratio of the carbonization products of the PDA film with a smooth surface and without surface aggregates is comparatively lower than the other two cases. Furthermore, the I2D/IG ratio of the carbonization products of the optimally prepared film was higher than that of the other two films, indicating that the number of stacked graphene layers was smaller. Notably, the ID/IG ratios of all three films carbonized at 1000 °C were evidently lower than those at 800 °C, suggesting a substantial reduction in structural defects. The Raman spectrum of the C-PDA acquired by Yu [2] also showed the D peaks and G peaks, confirming the existence of the graphite-like nanostructures. Compared with research results of Yu, our study presented the improved uniformity and the reduced thickness of the PDA film. In our study, the G peak of the Raman spectrum was more distinct, and at 2700 cm−1, a 2D peak appeared, indicating the formation of the graphene-like structure. This is also consistent with the research results from Li [25], who used neutron diffraction, Raman spectroscopy, and other techniques to verify that C-PDA has some graphite-like structures as the annealing temperature increased.
The electrical conductivity of the carbonization products of the PDA film with a smooth surface and without surface aggregates was approximately 670 S·m−1, as illustrated in Figure 10a. This value is close to that of multi-layer graphene. The attained high electrical conductivity may be attributed to the modified molecular charge transfer behavior induced by nitrogen doping or the improved crystallinity of the carbonized film resulting from the optimized deposition parameters [26,27]. Compared to the thicker film (550 S·m−1) and the film with numerous aggregates (605 S·m−1) (Figure 10b,c), the carbonized PDA film with a smooth surface and no aggregates exhibited superior electrical conductivity.
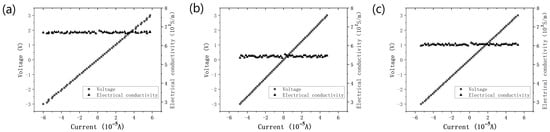
Figure 10.
The I–V curves and electrical conductivity of the carbonization product of (a) the smooth and no aggregates PDA film, (b) the thicker PDA film, and (c) the PDA film with many aggregates.
Through the Raman spectrum analysis and electrical conductivity measurement of the at different temperatures carbonized films, it can be shown that the carbonization product of the PDA film with a smooth surface and without surface aggregates, prepared with the optimized parameters, had fewer structural defects and a higher electrical conductivity.
Figure 11a displays the XPS spectra of the PDA film with a smooth surface and without surface aggregates carbonized at 1000 °C. The strong O1s peaks and the appearance of Si2s and Si2p peaks suggest that the thickness of the carbonized film was remarkably thin, likely below the detection depth of the XPS (≈10 nm). Upon closer inspection of the C1s peak (Figure 11b), it can be observed that the peak at a binding energy of 288 eV was almost absent, indicating the absence of the C = O structure. In contrast, the peak at a binding energy of 286 eV corresponds to the C-O/C-N structure, indicating the presence of a small amount of O and N doping in the film. The peak with a binding energy of 285 eV corresponds to the C-C/C = C structure, and the large peak indicates that most of the carbon atoms are bound into the cross-linked honeycomb lattice structure.
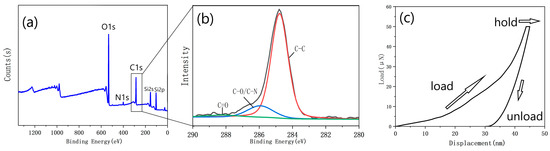
Figure 11.
(a) XPS spectrum of the film with the optimized parameters; (b) the C1s peak of the XPS spectrum; (c) a representative load vs. displacement curve obtained from the thick sample.
Due to the excessively small thickness of the prepared graphene-like material, it was not suitable for testing using the nanoindentation instrument. Therefore, a thick PDA film (with a thickness much greater than that shown in Figure 9) was fabricated and carbonized under 1000 °C. Based on the force-indentation depth curve of the carbonized thick film (Figure 11c), the Young’s modulus of the material was calculated to be approximately 30 GPa. A certain degree of creep could be observed. This was mainly due to the weak van der Waals forces between the atom layers in the graphite structure in the carbonized film. When subjected to external force, the carbon atom planes would bend and deform, maintaining the lateral structural stability without requiring the in-plane rearrangement of the carbon atoms to adapt to the external force.
Based on the mechanical properties of the carbonized product of the thick film, those of the prepared thin graphene-like material were inferred. Comparatively, the graphene-like thin film contained fewer structural defects (according to the results in Figure 9, the thicker the PDA film, the more defects generated after carbonization). For materials with graphene-like structures, an increase in the concentration of point defects and single vacancy defects will lead to a significant decrease in their Young’s modulus [28]. Furthermore, as the thickness decreased, the Young’s modulus within the graphene plane significantly increased [29]. This all indicates that the prepared thin graphene-like material had a higher Young’s modulus. Additionally, its multi-layered structure will partially retain its creep properties.
4. Conclusions
By investigating the impact of varying pH values on the formation of aggregates on the surface of deposited PDA film, distinct effects were observed across different pH value intervals. Within the range of 7.9 to 8.2, pH predominantly influences film thickness, while in the interval of 8.2 to 8.5, pH primarily affects the aggregation of particles on the film surface. For the deposition time below 90 min and the pH values between 7.9 and 8.5, the thickness of the PDA film exhibits a linear relationship with time. The deposition of a PDA film with minimal aggregates was achieved at pH 8.2. This was attributed to the various concentrations of the protons or OH− in the solutions. Solutions with a deficiency in the amount of OH− tend to donate more protons to saturate the dangling bonds of dopamine molecules, reducing their chemical activity and inhibiting their aggregation, while excessive OH− can promote the self-polymerization of dopamine molecules that move freely in the solution, resulting in more aggregates on the film surface [30,31,32]. To investigate the effects of different concentrations on the formation of aggregates on the PDA film surface, a pH of 8.2 was maintained. For the deposition time below 90 min, the film thickness exhibited a linear relationship with solution concentration and deposition time. A PDA film with negligible subtle aggregates and only a minimal quantity of large aggregates was formed at a solution concentration of 1.5 mg/mL.
Finally, to produce a thin and smooth film without surface aggregates, the deposition time was gradually increased under the conditions of pH 8.2 and the concentration of 1.5 mg/mL. It was observed that at a deposition time of 20 min, a continuous, smooth, and uniform PDA film with a thickness of 14 nm was successfully deposited on the SiO2 substrate. Utilizing the prepared PDA as a precursor, a graphene-like film was obtained through a high-temperature carbonization process. According to the Raman spectrum and the four-terminal sensing analysis, the multilayered graphene derived from the film deposited with the optimized parameters showed fewer structural defects and higher electrical conductivity compared to the carbonized products obtained from thicker PDA films and the films with surface aggregates. With optimized pH value and dopamine solution concentration, the structure of the deposited PDA film was improved, so the finally prepared graphene-like product possesses better structural properties. The XPS results also indicate that the carbonization products of the PDA film with a smooth surface and without surface aggregates are primarily composed of carbon atoms bonded in a cross-linked honeycomb lattice structure. Moreover, the nanoindentation analysis verified that the fabricated graphene-like film had good mechanical properties. Therefore, it is quite suitable for the application in flexible electronics.
Supplementary Materials
The following supporting information can be downloaded at: https://www.mdpi.com/article/10.3390/cryst13040607/s1, Figure S1: XRD curves of the smooth areas of the film and the surface aggregates; Figure S2: pH value detection of each reaction solution, (a) pH = 7.9, (b) pH = 8.2 and (c) pH = 8.5; Figure S3: Color comparison of the deposition solutions after 90 min in dark environment; Figure S4: The size and quantity of the aggregates calculated based on the surface SEM images (50×) of the same thickness PDA films deposited for different time length on SiO2 substrates under (a) pH = 7.9, (b) pH = 8.2 and (c) pH = 8.5; Figure S5: (a) SEM images of cross-sections of the PDA films prepared on SiO2 substrates at a concentration of 0.5 mg/mL; EDS analysis on (b) the aggregated particle and (c) on the smooth area of the film (without aggregates); Figure S6: Statistical graph of particle size and quantity of surface aggregates calculated through the 50× magnified SEM images of films deposited under (a) c = 1.5 mg/mL and (b) c = 2 mg/mL; Figure S7: The surface AFM image and the test position for Figure 8g.
Author Contributions
Conceptualization, D.W. and Q.W.; methodology, D.W. and T.P.; validation, D.W. and N.D.; preparation, D.W.; writing—review and editing, Q.W. and Z.L. All authors have read and agreed to the published version of the manuscript.
Funding
This research was funded by Key R&D Project in Shaanxi Province “Brain-inspired computing device based on two-dimensional material/polymer semiconductor heterojunction” (No.: 2020GXLH-Z-012).
Institutional Review Board Statement
Not applicable.
Informed Consent Statement
Not applicable.
Data Availability Statement
Not applicable.
Conflicts of Interest
The authors declare no conflict of interest.
References
- Lee, H.; Dellatore, S.M.; Miller, W.M.; Messersmith, P.B. Mussel-inspired surface chemistry for multifunctional coatings. Science 2007, 318, 426–430. [Google Scholar] [CrossRef] [PubMed]
- Yu, X.; Fan, H.; Liu, Y.; Shi, Z.; Jin, Z. Characterization of carbonized polydopamine nanoparticles suggests ordered supramolecular structure of polydopamine. Langmuir 2014, 30, 5497–5505. [Google Scholar] [CrossRef] [PubMed]
- Yang, H.-C.; Pi, J.-K.; Liao, K.-J.; Huang, H.; Wu, Q.-Y.; Huang, X.-J.; Xu, Z.-K. Silica-decorated polypropylene microfiltration membranes with a mussel-inspired intermediate layer for oil-in-water emulsion separation. ACS Appl. Mater. Interfaces 2014, 6, 12566–12572. [Google Scholar] [CrossRef]
- Lee, K.; Park, M.; Malollari, K.G.; Shin, J.; Winkler, S.M.; Zheng, Y.; Park, J.H.; Grigoropoulos, C.P.; Messersmith, P.B. Laser-induced graphitization of polydopamine leads to enhanced mechanical performance while preserving multifunctionality. Nat. Commun. 2020, 11, 4848. [Google Scholar] [CrossRef]
- Xiao, C.; Chu, X.; Yang, Y.; Li, X.; Zhang, X.; Chen, J. Hollow nitrogen-doped carbon microspheres pyrolyzed from self-polymerized dopamine and its application in simultaneous electrochemical determination of uric acid, ascorbic acid and dopamine. Biosens. Bioelectron. 2011, 26, 2934–2939. [Google Scholar] [CrossRef]
- Awasthi, A.K.; Gupta, S.; Thakur, J.; Gupta, S.; Pal, S.; Bajaj, A.; Srivastava, A. Polydopamine-on-liposomes: Stable nanoformulations, uniform coatings and superior antifouling performance. Nanoscale 2020, 12, 5021–5030. [Google Scholar] [CrossRef]
- Kang, S.M.; Ryou, M.-H.; Choi, J.W.; Lee, H. Mussel- and diatom-inspired silica coating on separators yields improved power and safety in Li-Ion Batteries. Chem. Mater. 2012, 24, 3481–3485. [Google Scholar] [CrossRef]
- Liu, R.; Mahurin, S.M.; Li, C.; Unocic, R.R.; Idrobo, J.C.; Gao, H.; Pennycook, S.J.; Dai, S. Dopamine as a carbon source: The controlled synthesis of hollow carbon spheres and yolk-structured carbon nanocomposites. Angew. Chem. 2011, 123, 6931–6934. [Google Scholar] [CrossRef]
- Kong, J.; Yee, W.A.; Yang, L.; Wei, Y.; Phua, S.L.; Ong, H.G.; Ang, J.M.; Li, X.; Lu, X. Highly electrically conductive layered carbon derived from polydopamine and its functions in SNO2-based lithium-ion battery anodes. Chem. Commun. 2012, 48, 10316. [Google Scholar] [CrossRef]
- Li, R.; Parvez, K.; Hinkel, F.; Feng, X.; Müllen, K. Bioinspired wafer-scale production of highly stretchable carbon films for transparent conductive electrodes. Angew. Chem. 2013, 125, 5645–5648. [Google Scholar] [CrossRef]
- Lim, K.H.; Kweon, H.; Kim, H. Polydopamine-derived nitrogen-doped graphitic carbon for a bifunctional oxygen electrode in a non-aqueous li-O2battery. J. Electrochem. Soc. 2017, 164, A1595–A1600. [Google Scholar] [CrossRef]
- Byun, S.-J.; Lim, H.; Shin, G.-Y.; Han, T.-H.; Oh, S.H.; Ahn, J.-H.; Choi, H.C.; Lee, T.-W. Graphenes converted from polymers. J. Phys. Chem. Lett. 2011, 2, 493–497. [Google Scholar] [CrossRef]
- Zhou, P.; Deng, Y.; Lyu, B.; Zhang, R.; Zhang, H.; Ma, H.; Lyu, Y.; Wei, S. Rapidly-deposited polydopamine coating via high temperature and vigorous stirring: Formation, characterization and Biofunctional Evaluation. PLoS ONE 2014, 9, e113087. [Google Scholar] [CrossRef] [PubMed]
- Zhao, M.-X.; Li, J.; Gao, X. Eliminating diffusion limitations at the solid–liquid interface for rapid polymer deposition. ACS Biomater. Sci. Eng. 2017, 3, 782–786. [Google Scholar] [CrossRef]
- Zhao, M.-X.; Li, J.; Gao, X. Gradient coating of polydopamine via CDR. Langmuir 2017, 33, 6727–6731. [Google Scholar] [CrossRef]
- Kim, H.W.; McCloskey, B.D.; Choi, T.H.; Lee, C.; Kim, M.-J.; Freeman, B.D.; Park, H.B. Oxygen concentration control of dopamine-induced high uniformity surface coating chemistry. ACS Appl. Mater. Interfaces 2013, 5, 233–238. [Google Scholar] [CrossRef]
- Li, Y.; Choi, J.; Sun, Z.; Russell, T.P.; Carter, K.R. Fabrication of sub-20 nm patterns using dopamine chemistry in self-aligned double patterning. Nanoscale 2018, 10, 20779–20784. [Google Scholar] [CrossRef]
- Du, X.; Li, L.; Behboodi-Sadabad, F.; Welle, A.; Li, J.; Heissler, S.; Zhang, H.; Plumeré, N.; Levkin, P.A. Bio-inspired strategy for controlled dopamine polymerization in basic solutions. Polym. Chem. 2017, 8, 2145–2151. [Google Scholar] [CrossRef]
- Tien, H.-W.; Huang, Y.-L.; Yang, S.-Y.; Hsiao, S.-T.; Liao, W.-H.; Li, H.-M.; Wang, Y.-S.; Wang, J.-Y.; Ma, C.-C.M. Preparation of Transparent, Conductive Films by Graphenenanosheet Deposition on Hydrophilic or Hydrophobic Surfaces through Control of the ph Value. J. Mater. Chem. 2012, 22, 2545–2552. [Google Scholar] [CrossRef]
- Xi, Z.-Y.; Xu, Y.-Y.; Zhu, L.-P.; Wang, Y.; Zhu, B.-K. A facile method of surface modification for hydrophobic polymer membranes based on the adhesive behavior of poly(dopa) and poly(dopamine). J. Membr. Sci. 2009, 327, 244–253. [Google Scholar] [CrossRef]
- Ball, V.; Frari, D.D.; Toniazzo, V.; Ruch, D. Kinetics of polydopamine film deposition as a function of ph and dopamine concentration: Insights in the polydopamine deposition mechanism. J. Colloid Interface Sci. 2012, 386, 366–372. [Google Scholar] [CrossRef] [PubMed]
- Wang, Z.; Xu, C.; Lu, Y.; Wei, G.; Ye, G.; Sun, T.; Chen, J. Microplasma-Assisted Rapid, chemical oxidant-free and controllable polymerization of dopamine for surface modification. Polym. Chem. 2017, 8, 4388–4392. [Google Scholar] [CrossRef]
- Bernsmann, F.; Ponche, A.; Ringwald, C.; Hemmerlé, J.; Raya, J.; Bechinger, B.; Voegel, J.-C.; Schaaf, P.; Ball, V. Characterization of dopamine−melanin growth on silicon oxide. J. Phys. Chem. C 2009, 113, 8234–8242. [Google Scholar] [CrossRef]
- Lee, M.; Lee, S.-H.; Oh, I.-K.; Lee, H. Microwave-Accelerated Rapid, chemical oxidant-free, material-independent surface chemistry of poly(dopamine). Small 2016, 13, 1600443. [Google Scholar] [CrossRef]
- Gong, W.; Chen, W.; He, J.; Tong, Y.; Liu, C.; Su, L.; Gao, B.; Yang, H.; Zhang, Y.; Zhang, X. Substrate-independent and large-area synthesis of carbon nanotube thin films using zno nanorods as template and dopamine as carbon precursor. Carbon 2015, 83, 275–281. [Google Scholar] [CrossRef]
- Klosterman, L.; Riley, J.K.; Bettinger, C.J. Control of heterogeneous nucleation and growth kinetics of dopamine-melanin by altering substrate chemistry. Langmuir 2015, 31, 3451–3458. [Google Scholar] [CrossRef]
- Huang, X.; Rao, W.; Chen, Y.; Ding, W.; Zhu, H.; Yu, M.; Chen, J.; Zhang, Q. Infrared Emitting Properties and environmental stability performance of aluminum/polymer composite coating. J. Mater. Sci. Mater. Electron. 2016, 27, 5543–5548. [Google Scholar] [CrossRef]
- Hao, F.; Fang, D.; Xu, Z. Mechanical and Thermal Transport Properties of Graphene with Defects. Appl. Phys. Lett. 2011, 99, 041901. [Google Scholar] [CrossRef]
- Lee, C.; Wei, X.; Kysar, J.W.; Hone, J. Measurement of the Elastic Properties and Intrinsic Strength of Monolayer Graphene. Science 2008, 321, 385–388. [Google Scholar] [CrossRef] [PubMed]
- Yang, H.-C.; Wu, Q.-Y.; Wan, L.-S.; Xu, Z.-K. Polydopamine gradients by oxygen diffusion controlled autoxidation. Chem. Commun. 2013, 49, 10522. [Google Scholar] [CrossRef]
- Madhurakkat Perikamana, S.K.; Lee, J.K.; Shin, Y.M.; Ahmad, T.; Kim, S.-jeong; Park, K.M.; Shin, H. Oxygen-dependent generation of a graded polydopamine coating on nanofibrous materials for controlling stem cell functions. J. Mater. Chem. B 2017, 5, 8865–8878. [Google Scholar] [CrossRef] [PubMed]
- Liebscher, J.; Mrówczyński, R.; Scheidt, H.A.; Filip, C.; Hădade, N.D.; Turcu, R.; Bende, A.; Beck, S. Structure of Polydopamine: A Never-Ending Story? Langmuir 2013, 29, 10539–10548. [Google Scholar] [CrossRef] [PubMed]


Disclaimer/Publisher’s Note: The statements, opinions and data contained in all publications are solely those of the individual author(s) and contributor(s) and not of MDPI and/or the editor(s). MDPI and/or the editor(s) disclaim responsibility for any injury to people or property resulting from any ideas, methods, instructions or products referred to in the content. |
© 2023 by the authors. Licensee MDPI, Basel, Switzerland. This article is an open access article distributed under the terms and conditions of the Creative Commons Attribution (CC BY) license (https://creativecommons.org/licenses/by/4.0/).