1. Introduction
Additive Manufacturing (AM) is a production process that generates physical objects layer by layer [
1]. The advantages of using AM include complex shapes and optimized geometries that would require multiple production steps or parts that are not feasible with conventional manufacturing techniques [
2]. Production on-location and the omission of investment in production tooling makes the manufacturing of individualized products feasible and reduces the logistic efforts [
3]. Two prominent metal AM processes, Laser-Powder Bed Fusion (L-PBF) and Laser Metal Deposition (LMD), use a fiber laser to melt and solidify metal powder particles to create near-net-shape geometries. While the L-PBF process commonly works with layer thicknesses of 20–60 µm, the layer thickness for LMD can reach up to 2 mm [
4,
5].
This study is about comparing the two different AM-technologies L-PBF and LMD with regards to the mechanical properties of manufactured and heat-treated samples. As the increasing manufacturing of tools and dies with AM processes are becoming more relevant, high-strength tool steel 1.2709 is the material of choice for this study. Although studies on the subject have already been carried out in [
6,
7,
8,
9,
10], the influence of the manufacturing process on the result of heat treatments is not considered here. To extend the state of knowledge, the process influence on the mechanical properties of heat-treated samples is also investigated in this study. With the exact knowledge of which process-dependent mechanical properties are obtained for components, a better process selection can be made, which ultimately results in improved part quality. For example, some components may need a mechanical property profile more typical of L-PBF and others more typical of LMD. At this point, however, process-specific tolerances are excluded for the time being. The goal of the study is to gain a better understanding of the process outcomes and being able to make better decisions on this basis when it comes to choosing AM-technologies for a product.
2. Materials and Methods
This section gives a brief overview of the technologies used and their main differences. After a comparison of the two manufacturing processes, the material that is the focus of the study is presented. Finally, the experimental procedures are explained.
2.1. Laser Powder Bed Fusion (L-PBF)
A laser selectively melts the powder layer-by-layer. The layers fuse through the melting and subsequent solidification of the powder onto a substrate plate or previous layers. In L-PBF, the powder feedstock is typically produced by gas, high-pressure water or rotary atomization, producing typically particle size ranges between 10 and 60 µm [
11]. The complete melting and solidification of the powder material is achieved by a high-energy fiber laser (up to 1 kW), which locally exposes the layer contour. In each case, the already solidified layer underneath the exposed layer is also re-melted. The combination of an extremely small weld pool (a few mm
3) and the laser speed (500 mm/s to 1500 mm/s) leads to the extremely high cooling rates (10
4 K/s to 10
6 K/s) typical of L-PBF [
12]. These unbalanced cooling conditions result in a typically fine microstructure with a preferential crystallographic and morphological orientation of the grains in the build direction [
13,
14,
15]. Due to the extremely rapid solidification, thermal stresses are induced, and micro segregations are caused [
12]. In addition, because of the successive exposure of the powder material, the respective previously exposed layers are subjected to a complex heat treatment. The microstructural characteristics of the L-PBF process and the mechanical properties can be specifically changed by a targeted heat treatment [
16,
17].
2.2. Laser Metal Deposition
In contrast to the L-PBF process, the LMD process is characterized by the simultaneous delivery of powder and laser. As shown in
Figure 1, metal powder in the form of particles is carried within an inert gas flow through the channels of a coaxial nozzle. A laser heat source, directed through the inner opening of the nozzle, creates a locally allocated melt pool on a chosen substrate. The fine metal powder particles are then melted within the melt pool and fused to the substrate. By placing welds next to each other and stacking the created layers, a 3D object is created. Besides creating whole 3D parts, the process can also be used to repair high-value parts by, e.g., filling in worn-out regions of a die-cast tool. By facilitating special powder delivery systems, it is also possible to change or mix different powders during the process to create graded materials. The particle size of typically used powder in the LMD process ranges between 50 and 150 µm. [
18]
2.3. Process Comparison of L-PBF and LMD
As both, the L-PBF and the LMD process are subject to this study, a comparison of the most important process features is done. The LMD process can be seen as superior in scalability and productivity. When building bigger parts, just a scaled-up kinematic for the powder-head is needed, whereas scaling up the L-PBF-process comes with the challenges of, e.g., containing the necessary high powder mass and dealing with the amount of (material depending) smoke development due to the increased scanning area per layer. As for comparing the two processes further, they differ greatly when it comes to the deposition rate. With LMD, a deposition rate of ~700 cm
3/h can be achieved, whereas with L-PBF, only a deposition rate of ~171 cm
3/h is possible [
19,
20]. This is contrasted by the possible process tolerances of L-PBF and LMD. To produce fine structures without desired or possible reworking, only L-PBF comes into question. Due to the process, near-net-shape production with deviations <1 mm is hardly possible with LMD [
21]. The processes also differ in laser power and scan speed, which are the main governing factors for cooling and solidification. Cooling rates in the L-PBF process can reach up to 10
6 K/s compared to 10
5 K/s in the DED process [
22]. As a result, parts manufactured by L-PBF show finer grain sizes, lower primary dendrite arm spacing and an increased dislocation density [
23,
24].
2.4. 1.2709 as Additive Manufacturing Material
The combined properties of nanometer-sized intermetallic precipitates and a martensitic matrix gives 1.2709 as part of the maraging steel family its exceptional mechanical properties. The use of nickel in the chemical composition instead of carbon like in traditional high-strength steel production makes for a steel that has great weldability. This makes it a well-suited candidate for use in the manufacturing of, e.g., forming tools. The high toughness makes for long lifetime, and wear on the tool can easily be repaired by welding and retooling. To match different needs of various applications, 1.2709 tool steel can be heat-treated. Solution annealing is carried out to minimize the amount of austenite in the martensitic matrix. To archive a higher strength and material hardness, the steel is then put through an aging treatment wherein intermetallic phases and precipitates ensure hardening. An example heat-treatment route for solution annealing is 2 h at 940 °C (±10 °C), followed by rapid air-cooling below 32 °C at a rate of 10–60 °C/min. For gaining peak hardness and strength, the material should be held at 490 °C (±10 °C), followed by air-cooling [
25]. This heat treatment route was selected only as an example for the study’s objective to generate a starting point for comparative study between the LMD and L-PBF processes.
2.5. Experimental Procedure
The particle size distributions of the powder feedstock for both AM technologies were investigated using the dynamic image analysis technique in a QICPIC machine (Sympatec GmbH, Clausthal-Zellerfeld, Germany). L-PBF samples were manufactured with a DMG MORI Lasertec 2nd Generation with a 1 kw Yt:YAG fiber laser and a Gaussian laser profile with a minimum laser spot diameter of 70 µm. LMD samples were fabricated on a DMG MORI LT65 3D Only with a 3 kW fiber laser and a laser spot diameter of 3 mm. The specific process parameters are shown in
Table 1.
L-PBF sample density was investigated on a total of five cubes of 10 mm × 10 mm × 10 mm; for the DED samples, the clamping surface of tested tensile strength samples were used. The samples were ground and polished to achieve a proper surface finish for pore detection. Material density was determined by light optical microscopy using a Keyence VHX 6000 at a magnification of 200×. To investigate the microstructure, polished samples were etched with a 3% nital (HNO3) acid. As-built samples were etched for 40 s, and heat-treated samples were etched for 80 s. The L-PBF test samples were produced out of thin-walled structures with a thickness of 3 mm. They were printed, cut from the build plate, and machined to their final geometries by wire electron discharge machining (wire-edm). The LMD samples were manufactured by creating multiple blocks with the dimensions 100 mm × 20 mm × 20 mm via the process. These blocks were then cut into the final shape of the specimens, which then were cut into multiple layers with 3 mm thickness using wire-edm (
Figure 2).
Heat treatment was performed for 6 h at 490 °C with subsequent air-cooling to room temperature. Vickers hardness measurements HV10 were conducted on polished samples using an ATM Carat 930 hardness tester (ATM—Advanced Materialography GmbH, Mammelzen, Germany). Quasi-static tensile tests were conducted on a servo-hydraulic MTS 810 test machine according to DIN 6892-1 with a traversing speed of the crosshead of 2 mm/min. Digital image correlation (DIC) was used for strain measurement for the L-PBF-samples using a GOM ARAMIS 5M system at 5 frames per second. The strain of the LMD samples was measured using the extensometer “Epsilon 3542-020M-050-ST” with a gauge length of 20 for less complex preparation and data handling since the DIC did not show unexpected local strain differences.
3. Results
The following chapter deals with the results of the investigations carried out. First, the powder used for both processes was characterized to ensure a certain quality standard. Then, the material density and microstructure of the specimens produced were analyzed. The defects found were examined and characterized. Finally, the hardness, surface roughness and mechanical properties of the specimens were determined.
3.1. Particle-Size Distribution
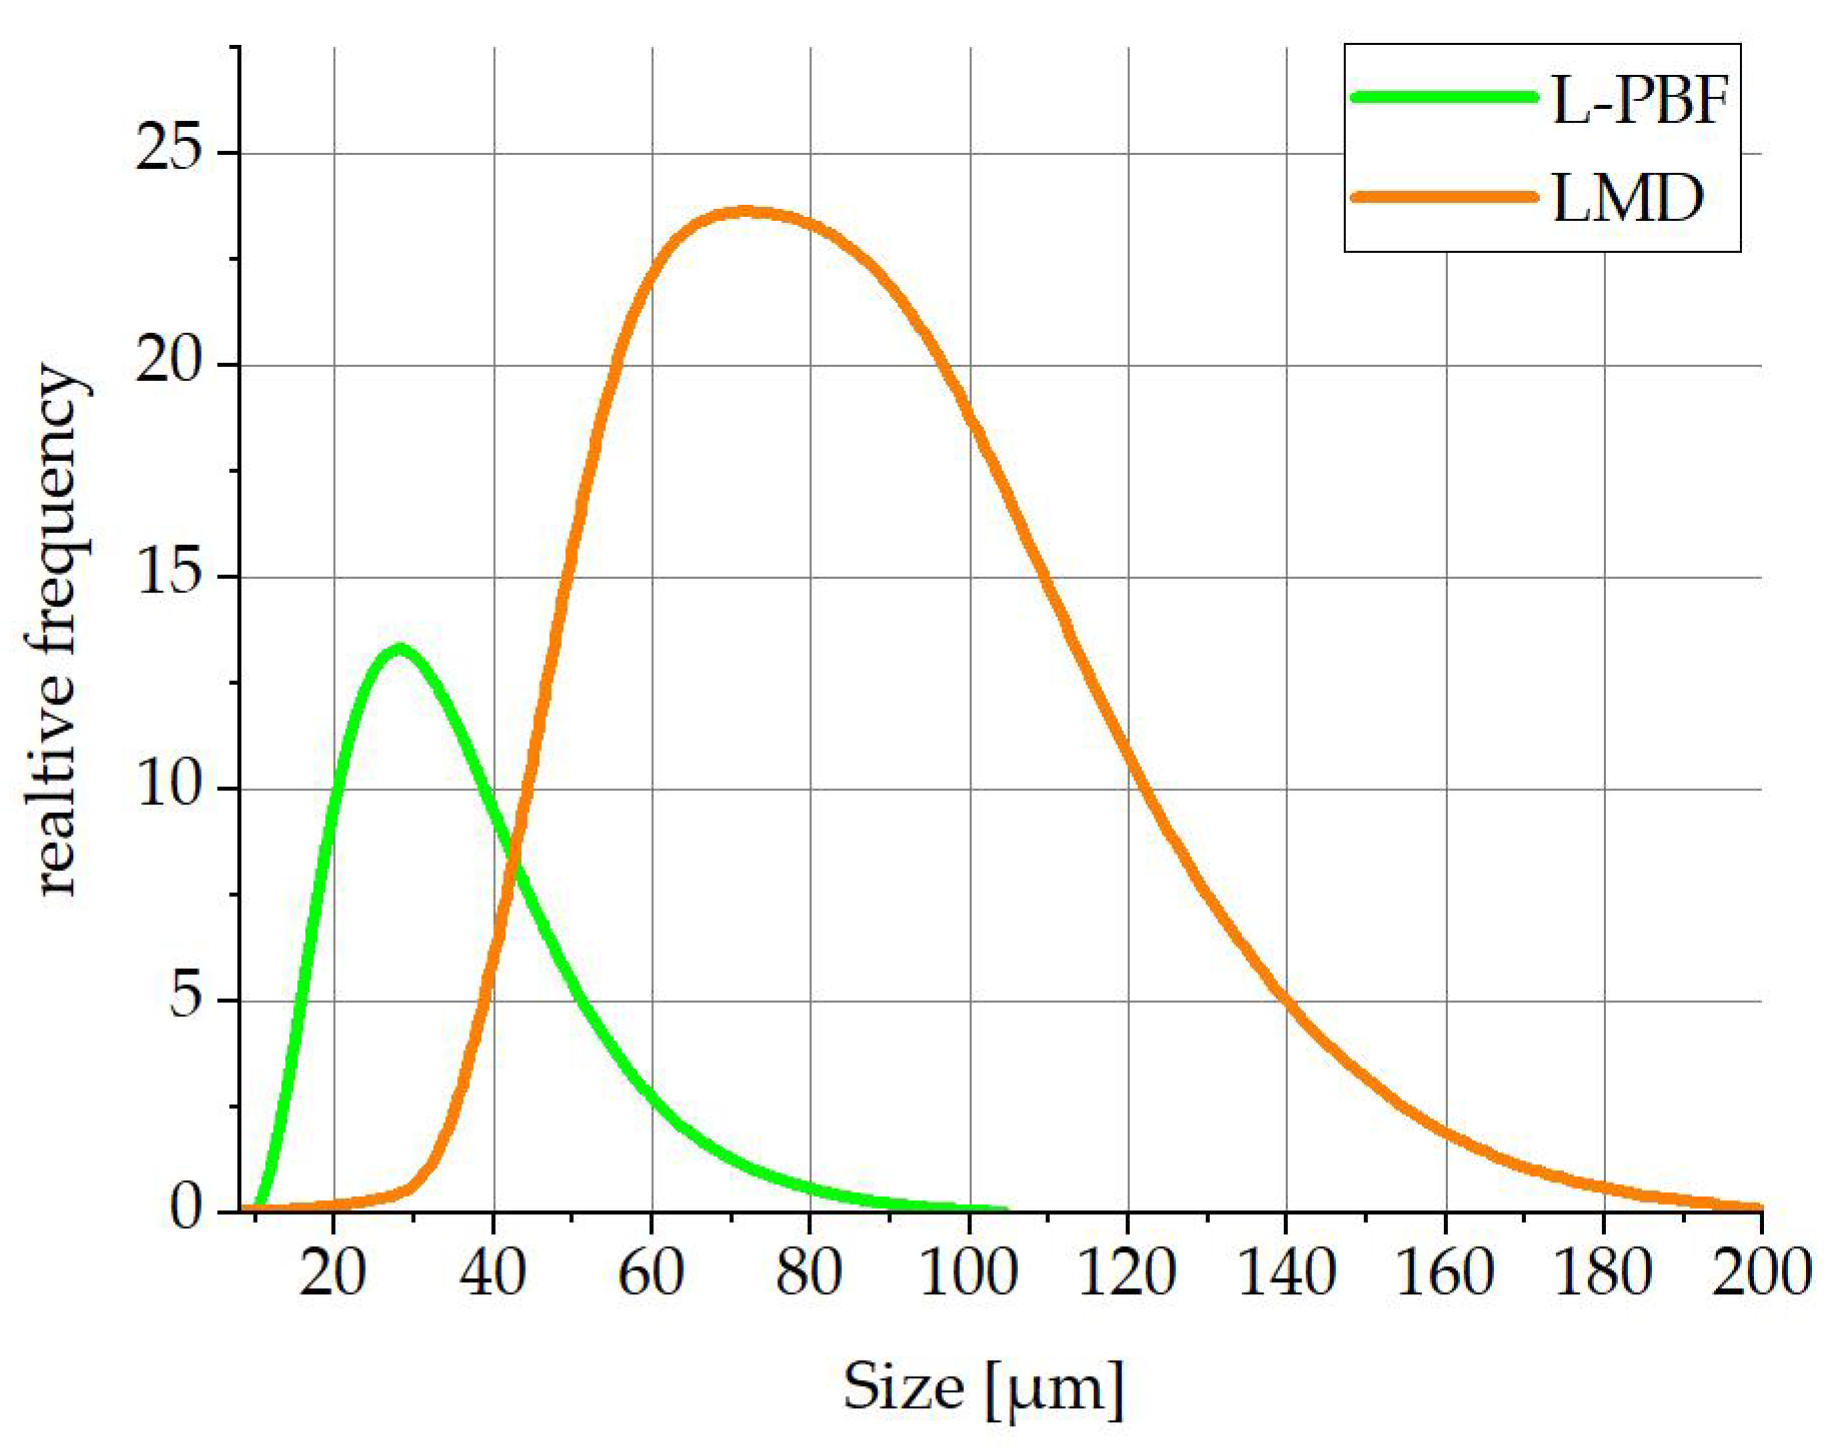
In
Figure 3, the particle size distributions of the used L-PBF and LMD powders in micrometer is depicted. The L-PBF powder consists of smaller particles, with 10% of all measured particles (d10) being smaller than 17.7 µm and 90% of all measured particles (d90) being smaller than 45 µm. The powder for the LMD process features coarser powder particles with d10 = 47.5 µm and d90 = 109.6 µm.
3.2. Material Density and Microstructural Analysis
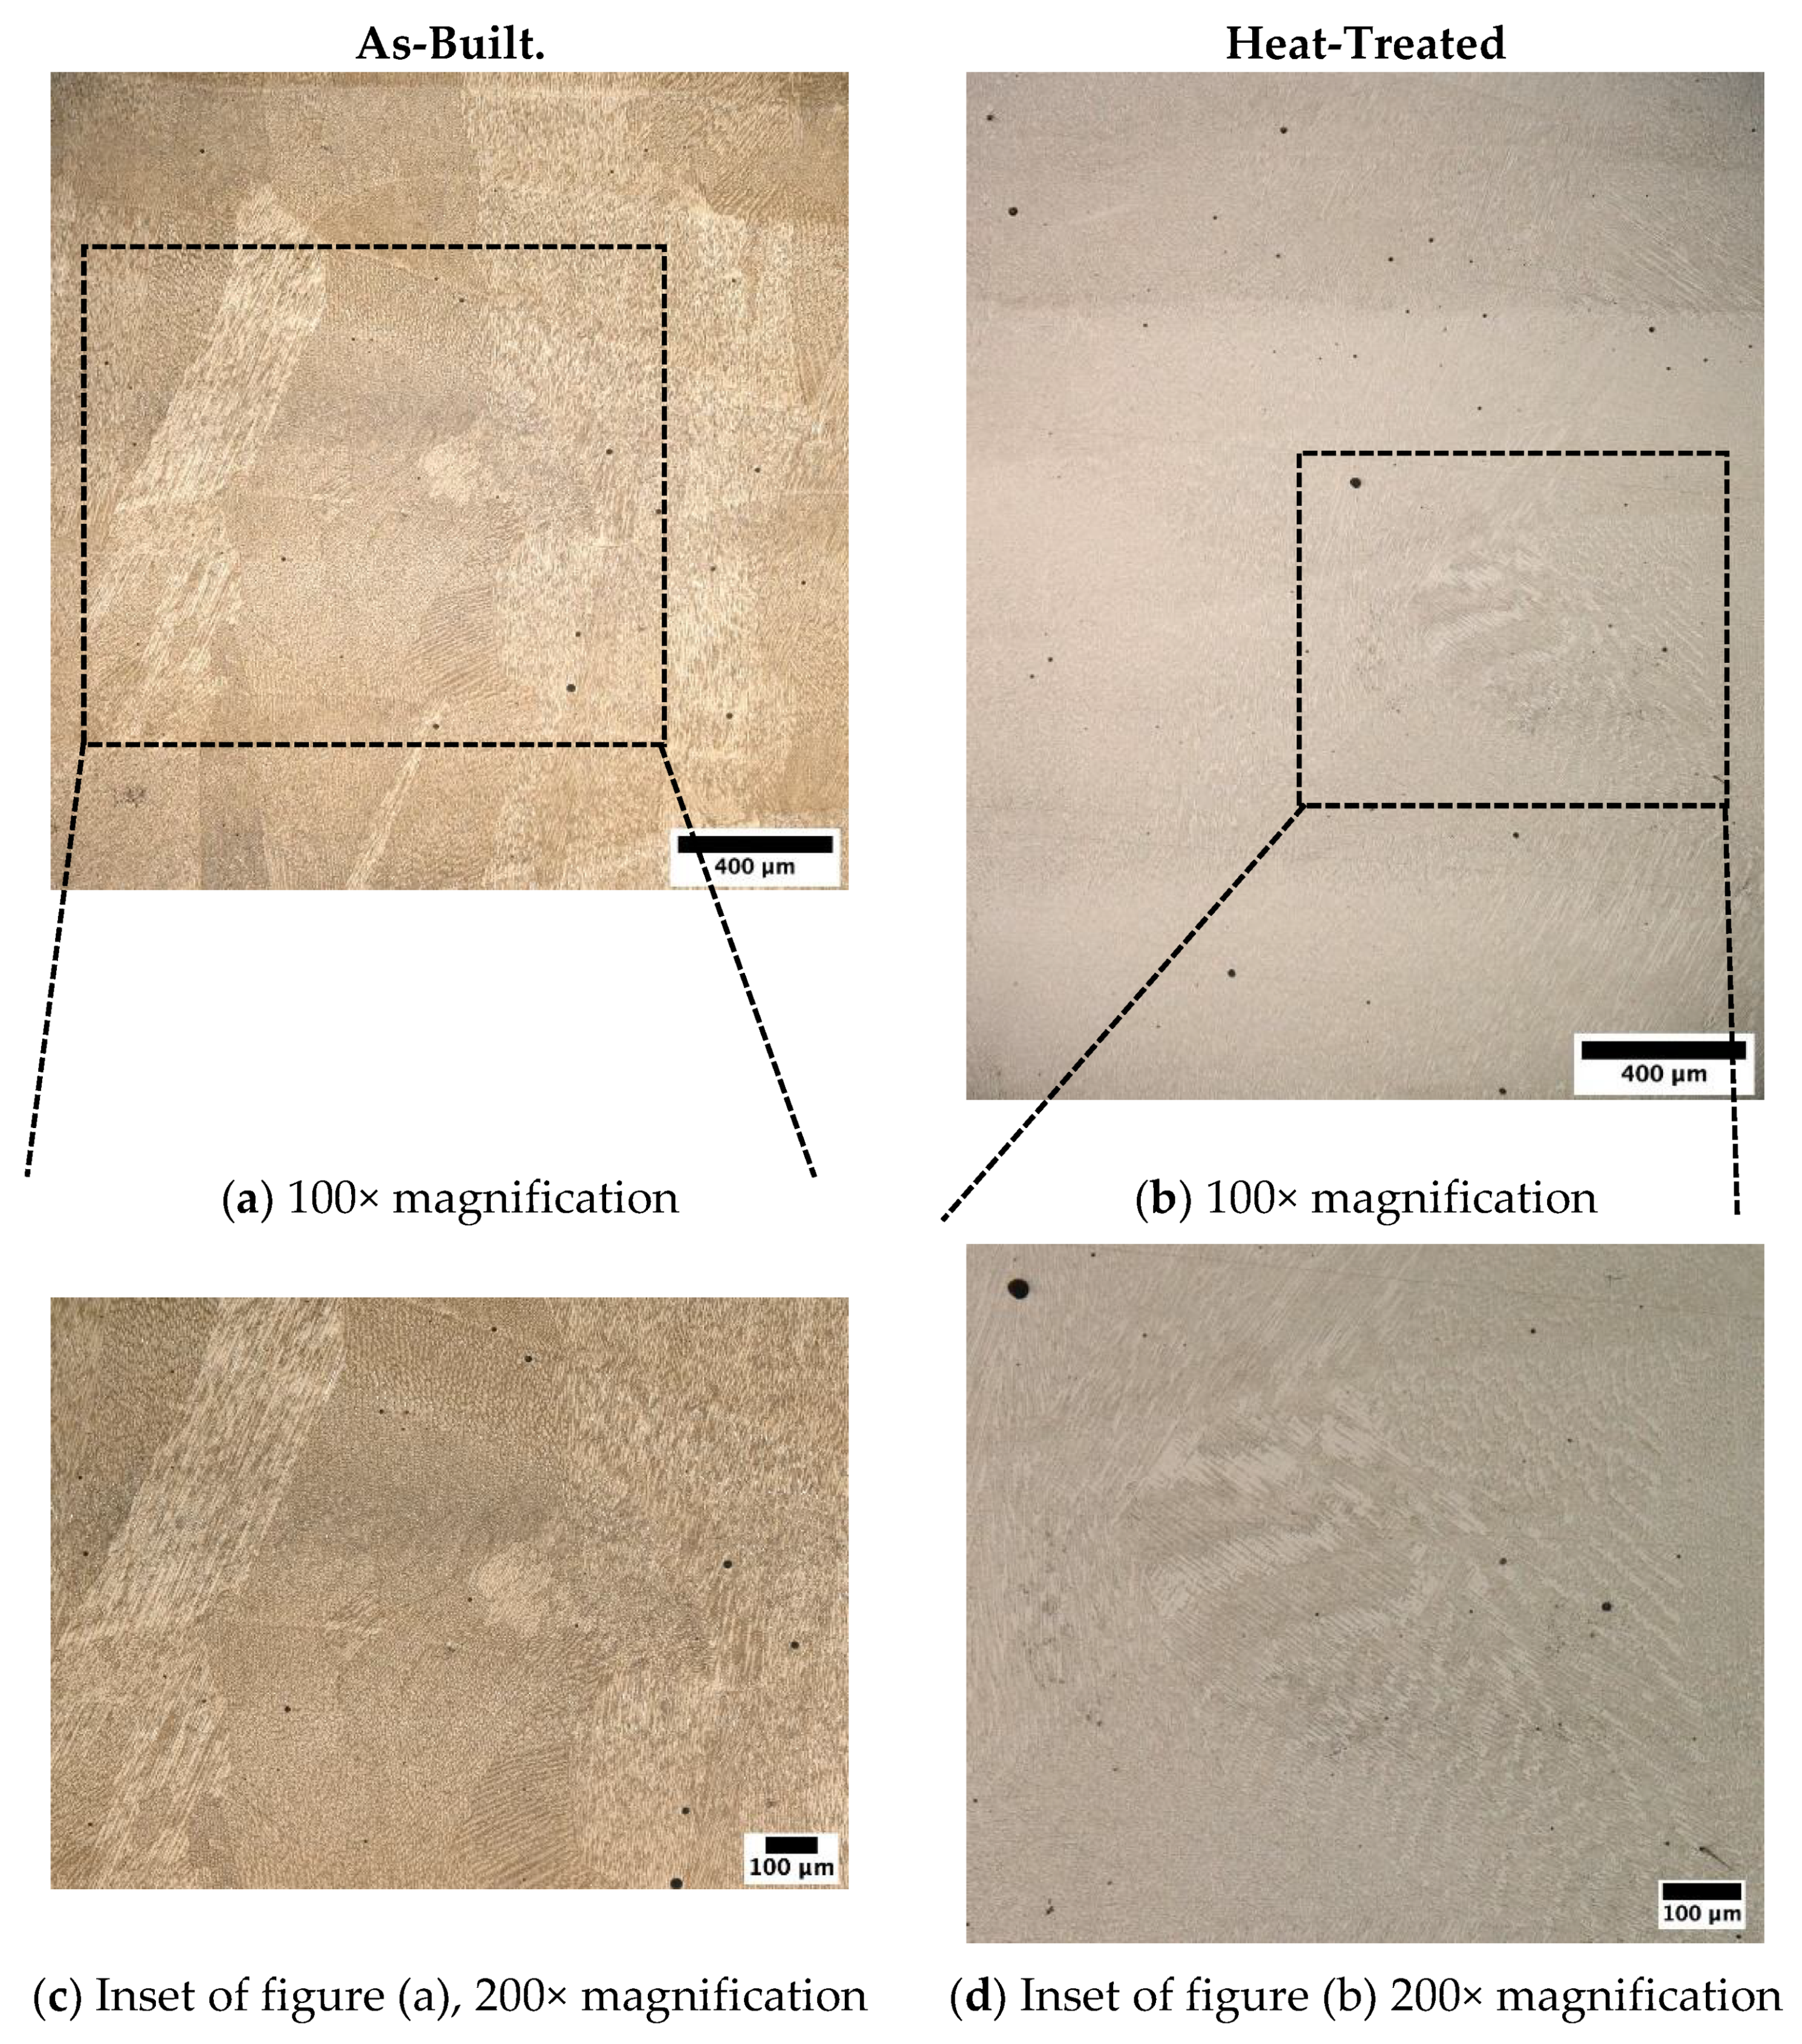
The material density after processing was investigated for five L-PBF cubes. The average density was 99.91% with a maximum density of 99.95% and a minimum density of 99.86%. One etched sample taken from the clamping area of a non-tested tensile stress specimen is shown in
Figure 4. Etching revealed the characteristic grain structure and melt pool shape in the as-built condition.
The density of the LMD samples were investigated on three tested tensile test samples. The clamping area has been ground and polished for microscopic measurements. The investigation shows an average density of 98.86%, with a maximum density of 99.3% and a minimum density of 98.5%.
The L-PBF microstructure has a finer microstructure in comparison with the LMD sample since the rapid cooling of the molten powder during the L-PBF process results in a fine grain size. LMD features lower cooling rates that enable the growth of larger grains and generate a comparatively coarse microstructure. Boundaries of the L-PBF melt pools are depicted by white lines. The average width and height of the melt pools perpendicular to the investigated surface are 109 µm and 126 µm, respectively. The defects feature mainly spherical gas pores. Cellular structures within and across the melt pool beads are visible. These structures can reach across multiple layers.
At higher magnifications using SEM, the cellular structure of the material becomes more apparent. In the as-built state, a continuous cellular structure with different orientations is divided by grain boundaries (indicated by black lines). The cell boundaries are elevated and show a homogeneous size within the grain boundaries. The interface between cell structures with different orientations is immediate, with no visible transition in size or orientation between the regions. In comparison, the heat-treated sample features a coarser, discontinued cell structure, likely due to the formation of Ni-rich precipitations and the phase transformation of martensite into austenite along the cellular boundaries. Elongated lath-like structures exist next to the less-defined cell structures. A boundary between the areas of different structures is still visible. However, this boundary is no longer as pronounced as in the as-built state.
The etched LMD samples are shown in
Figure 5. Contrary to the L-PBF samples, the melt pool sizes are not as pronounced since the scale of the deposition size of the LMD process is multiple decades higher. Even at low magnifications, the cellular grain structure can be identified. The formed grains are both detained within a layer and can grow over several layers. The grains can reach lengths up to multiple millimeters. When comparing as-built and heat-treated samples, it can be observed that the grains grow slightly coarser after treatment.
3.3. Defect Analysis
For the analysis of the defects in the processed materials, pictures of ground and polished specimens were taken with a microscope. With the use of grayscale manipulation of the taken images (see
Figure 6), pores could be identified and classified by size in µm
2 and aspect ratio. Herein, only pores with an area >50 µm
2 were considered, since smaller defects are classified as artifacts from preparing the specimens or improper lighting conditions while taking pictures.
When correlating the aspect ratio to the area of measured pores for both processes, a difference is noticeable. The graphs in
Figure 7 show that pores in the L-PBF process are mainly clustered around an area <500 µm and an aspect ratio <3, whereas LMD pores show a distribution, with most of the pores located within the aspect ratio of 2. This shows that pores measured in LMD tend to have a round shape within a wider spectrum of pore sizes (area) than in the L-PBF process.
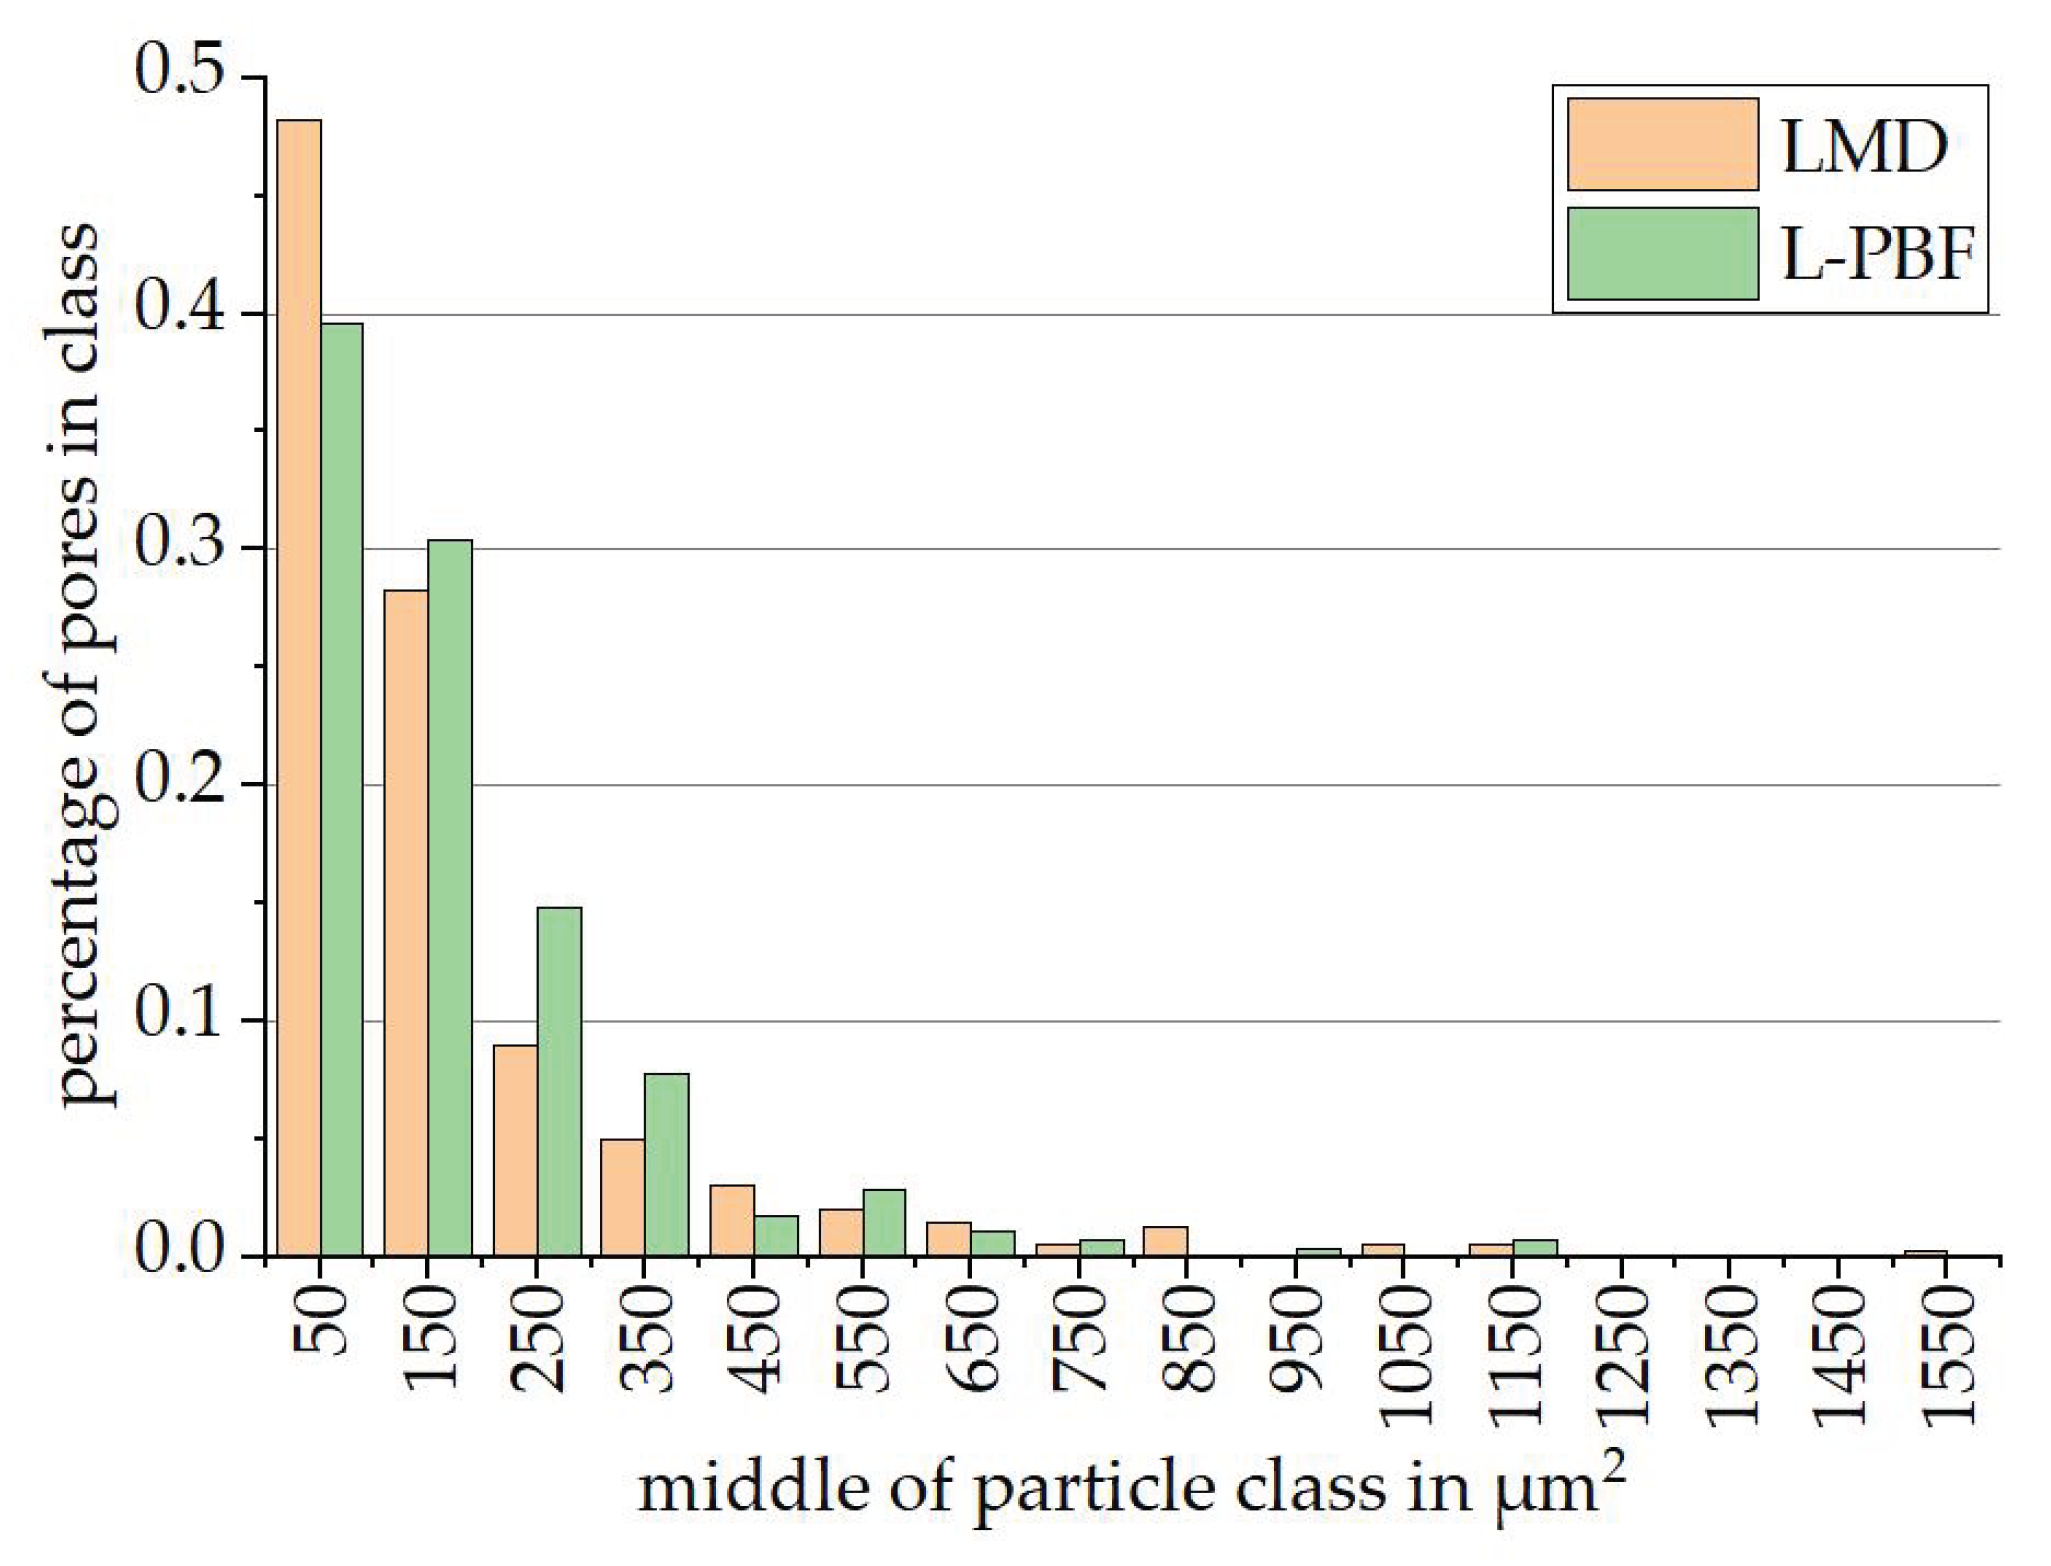
Additionally, the pore size distributions of both processes were compared. As shown in
Figure 8, more than 50% of pores in the LMD sample have an area around 50 µm and pores up to a size of ~1400 µm occur. L-PBF samples on the other hand have only ~40% of pores with an area around 50 µm, and the biggest pores measure ~1150 µm. In summary, LMD samples consist of mostly small pores with fewer middle-size pores and very few but rather big pores. L-PBF have a quasi-even pore-size regression, with the biggest pores still smaller compared to those detected in LMD samples.
3.4. Hardness
The hardness of each specimen has been determined using an ATM Carat 930 hardness tester. A pattern consisting of nine indents for the hardness determination has been applied to individual specimens, and the hardness was averaged accordingly. As shown in
Figure 9, the heat treatment has led to a significant increase in hardness for both the L-PBF and LMD samples (L-PBF: +63%, LMD: +77%). When comparing the obtained hardness between the two processes, a difference is discernible. Regardless of material state, the LMD samples show a lower hardness. The difference in measured hardness accounts to 87 HV10 in the as-built samples and 101 HV10 in the heat-treated samples. For the as-built state, the finer microstructure, decreased grain size and increased dislocation density of the L-PBF process increases the hardness relative to the LMD samples [
26,
27]. In addition, the overall porosity of LMD samples is higher, further contributing to a reduction in hardness [
9]. The heat treated samples show increased hardness values as a result of the formation of intermetallic phases during aging at temperatures between 450 °C and 550 °C [
28,
29].
3.5. Surface Roughness
Surface roughness was measured in the length and thickness directions (see
Figure 10a). The L-PBF samples were printed as rectangles with net shape thicknesses of 2 and 3 mm and the thickness-side facing the build plate. After printing and heat treatment the samples were then given their final contour via wire EDM, leaving the surface in as-built L-PBF quality. The LMD samples were cut fully out of blocks using wire EDM thus making both side- and surface-quality dependent on the wire EDM result. As can be seen in
Figure 10b, the results of the surface-roughness measurement differ between processes and measured area. Generally, Ra and Rz are lower for LMD samples except for the side roughness. This is explained by the fact that the L-PBF surface was not postprocessed, whereas the side and surface of the LMD samples were both manufactured by wire EDM. The lower surface roughness can be explained by the lower cutting velocity due to there being more material to cut through during the sample manufacturing via wire EDM. The sample’s contour was first cut out of the massive block with dimensions 8 × 55 × 100 mm and was subsequently separated into samples of the desired thickness of 3 mm.
3.6. Mechanical Properties (Quasi Static Tensile Strength Testing)
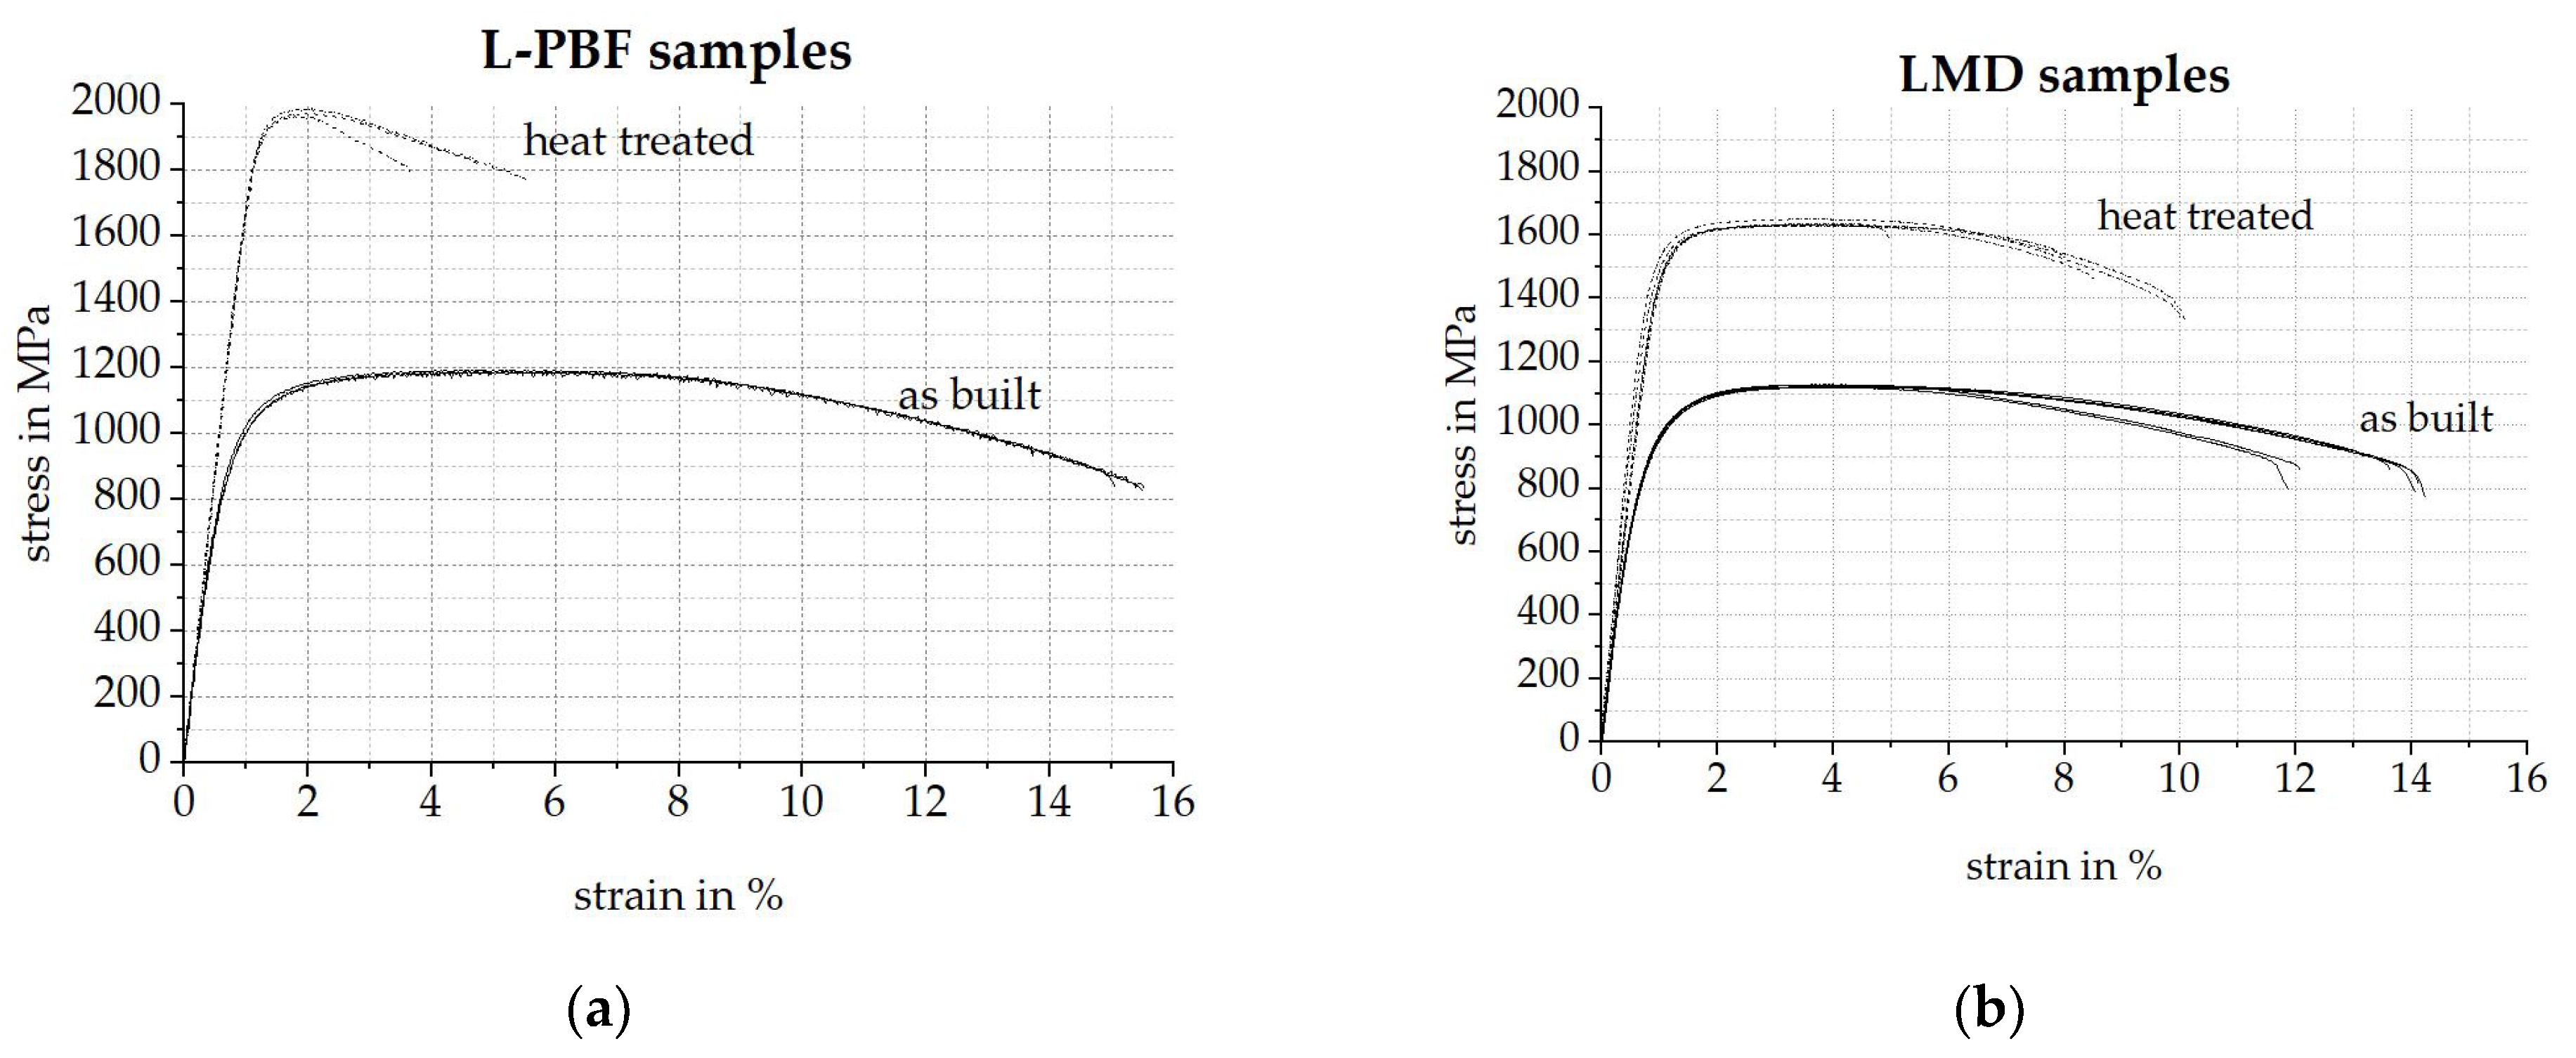
The test results on the mechanical properties of the specimens produced by L-PBF and LMD are shown in
Figure 11, with the correlating stress–strain diagrams in
Figure 12. The heat treatment of the respective specimens has the desired effect. Tensile and fracture strength were significantly increased for both processes. The L-PBF specimens show an increase in tensile strength of ~111%, while the LMD specimens show an increase of ~79%. Yield strength of the heat-treated L-PBF specimens was increased by ~66% and for the LMD specimens by ~55%. Also noted is a slight increase in Young’s modulus by ~6.7% for L-PBF and ~9.3% for LMD. These increases are accompanied by a reduction in the fracture strain of the material of ~75% for L-PBF and ~50% for LMD.
As with the hardness, the greater strength of the L-PBF samples results from the fine grain size and increased dislocation density in comparison to the LMD process caused by repeated heating and fast cooling [
30,
31].
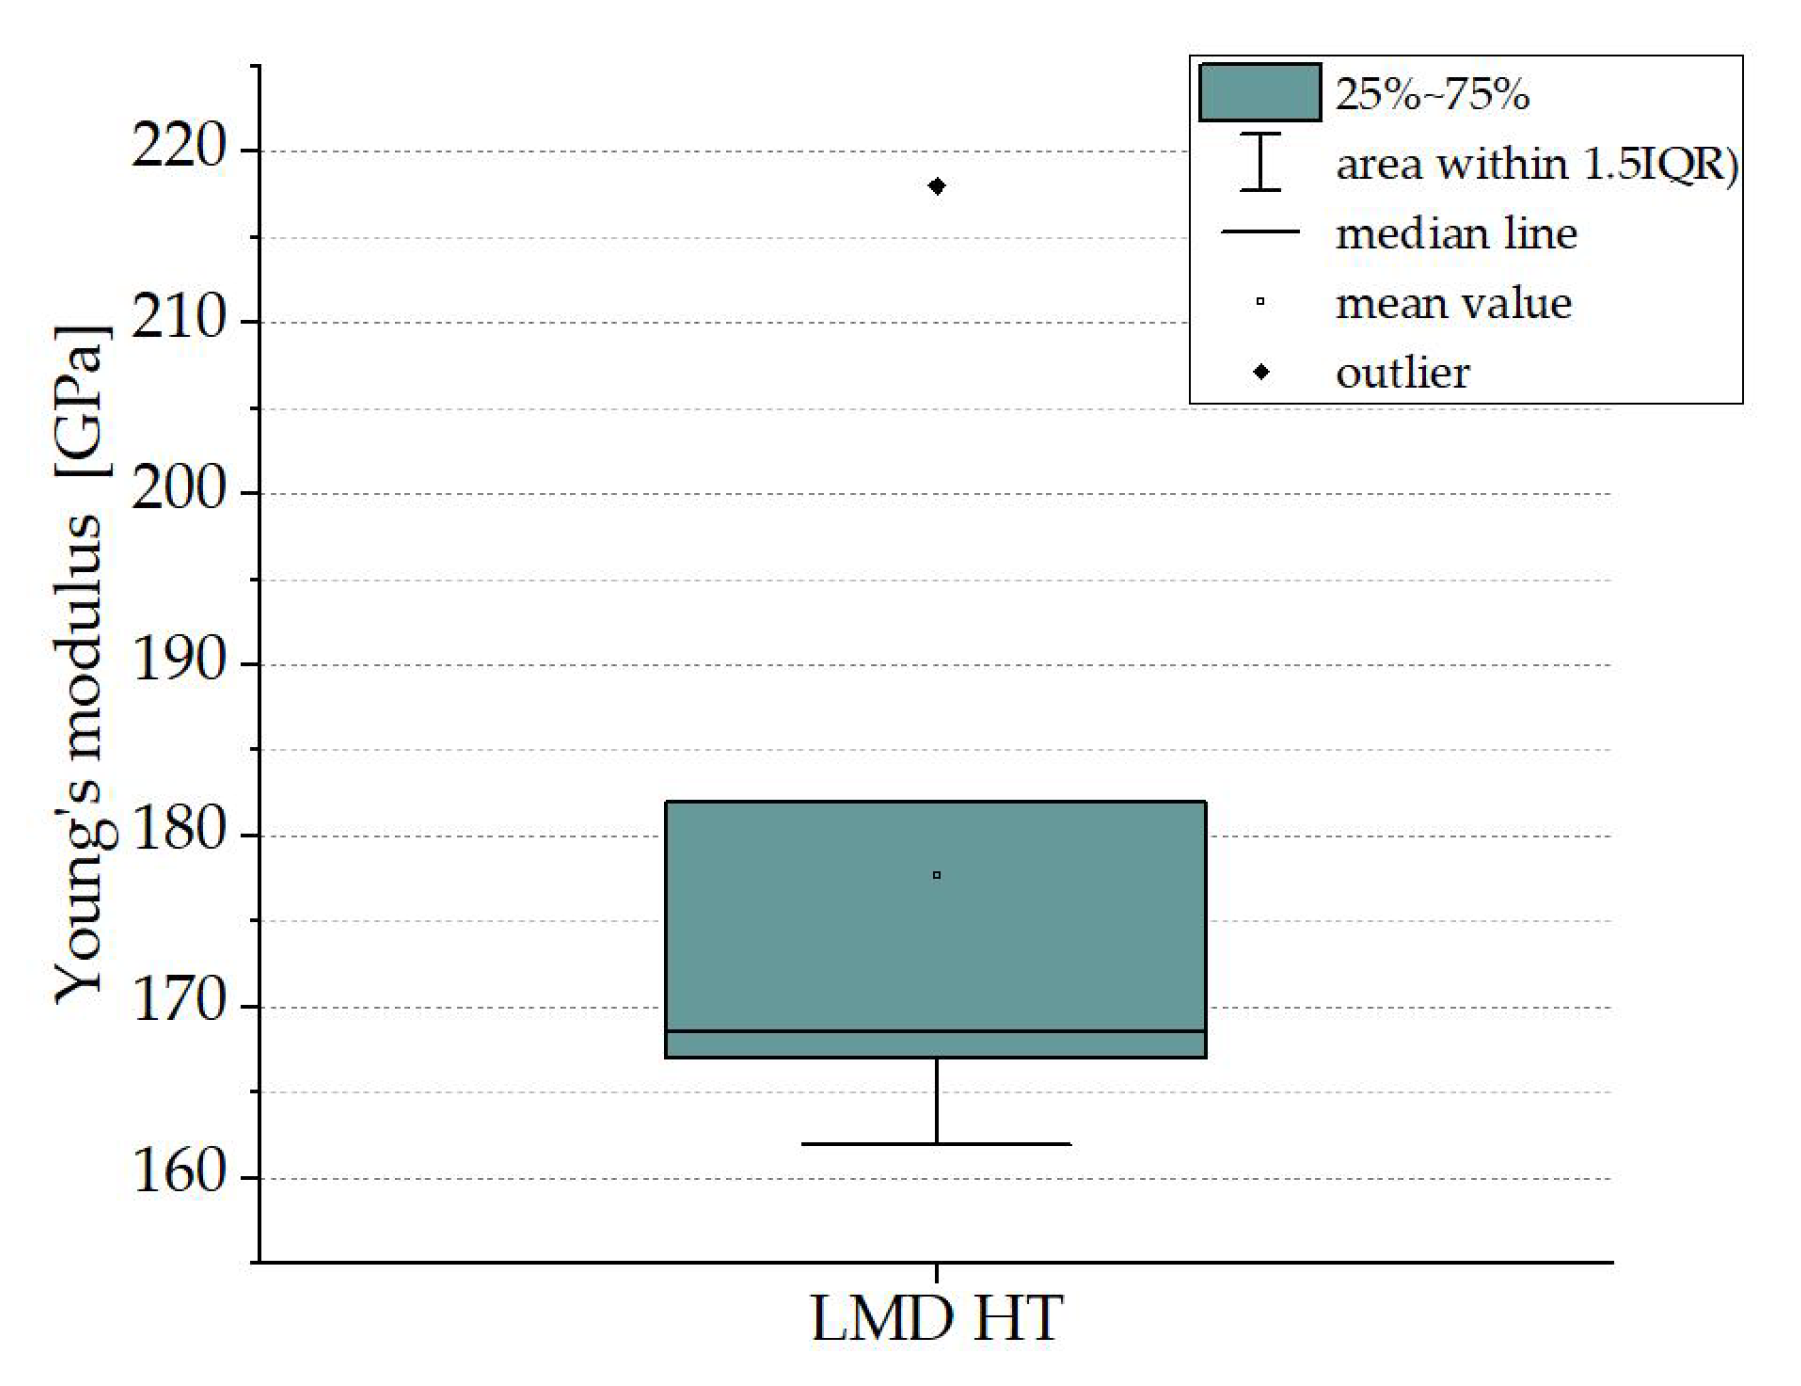
As shown in
Figure 11, there is an increase in the deviation of the mechanical properties, Young’s modulus and fracture strain, for the LMD manufactured and heat-treated samples. After reviewing the captured data for Young’s modulus, the investigators could conclude that these are a statistical outlier since the value of one of the measured YM lies above 1.5 times the interquartile range (IQR) (see
Figure 13). This could not be proven statistically for the facture strain though. Herein, further investigation needs to be done in order to fully understand this material behavior after heat treatment.
4. Discussion
Based on the results of the carried-out investigations, it can be said that the chosen AM-process has no significant impact on the as-built mechanical properties of the processed material 1.2709. However, when the material is being heat-treated after the AM-processing, a different picture emerges. The improvements in UTS (19% higher) and yield strength (22% higher) for L-PBF manufactured parts are superior to those manufactured via LMD. With Young’s modulus (6% higher) and fracture strain (27% higher), LMD samples are performing better than L-PBF-manufactured samples. This can have several reasons. The difference in mechanical properties could emerge from a difference in the microstructure due to the different thermal histories of the parts during production. While L-PBF manufactured parts undergo very locally concentrated heat inputs, LMD samples tend to reach much higher temperatures throughout a greater volume of the part. This in combination with the lower cooling rates leads to a significant difference in the grain size of L-PBF- and LMD-manufactured samples that could be confirmed by the microscopic analysis of the samples. The difference in mechanical properties after treatment makes LMD-manufactured parts slightly more suitable for use cases, in which the parts stiffness is of greater emphasis. However, L-PBF-manufactured parts are better used in scenarios wherein the parts strength is important.
Author Contributions
Conceptualization, S.G., D.N. and D.L.; methodology, S.G. and D.N.; software, C.B.; validation, S.G., D.N. and C.B.; investigation, S.G. and D.N.; resources, T.T.; data curation, S.G. and D.N.; writing—original draft preparation, S.G., D.N. and T.T.; writing—review and editing, S.G., D.N. and T.T.; visualization, S.G. and D.N.; supervision, T.T.; funding acquisition, T.T. All authors have read and agreed to the published version of the manuscript.
Funding
This research received no external funding. The article publishing charges was paid for by the University of Paderborn.
Informed Consent Statement
Not applicable.
Data Availability Statement
Not applicable.
Acknowledgments
Special thanks going to Nadine Buitkamp for her support in making the SEM-Images.
Conflicts of Interest
The authors declare no conflict of interest.
References
- Gibson, I.; Rosen, D.W.; Stucker, B. Additive Manufacturing Technologies; Springer: Boston, MA, USA, 2010; ISBN 978-1-4419-1119-3. [Google Scholar]
- Chekurov, S.; Kajaste, J.; Saari, K.; Kauranne, H.; Pietola, M.; Partanen, J. Additively manufactured high-performance counterflow heat exchanger. Prog. Addit. Manuf. 2019, 4, 55–61. [Google Scholar] [CrossRef]
- Javaid, M.; Haleem, A.; Singh, R.P.; Suman, R.; Rab, S. Role of additive manufacturing applications towards environmental sustainability. Adv. Ind. Eng. Polym. Res. 2021, 4, 312–322. [Google Scholar] [CrossRef]
- Nguyen, Q.B.; Luu, D.N.; Nai, S.; Zhu, Z.; Chen, Z.; Wei, J. The role of powder layer thickness on the quality of SLM printed parts. Arch. Civ. Mech. Eng. 2018, 18, 948–955. [Google Scholar] [CrossRef]
- Katayama, S. Handbook of Laser Welding Technologies; Woodhead Publ.: Oxford, UK, 2013; ISBN 978-0-85709-264-9. [Google Scholar]
- Marchese, G.; Garmendia Colera, X.; Calignano, F.; Lorusso, M.; Biamino, S.; Minetola, P.; Manfredi, D. Characterization and Comparison of Inconel 625 Processed by Selective Laser Melting and Laser Metal Deposition. Adv. Eng. Mater. 2017, 19, 1600635. [Google Scholar] [CrossRef]
- Zhang, Y.; Huang, W. Comparisons of 304 austenitic stainless steel manufactured by laser metal deposition and selective laser melting. J. Manuf. Process. 2020, 57, 324–333. [Google Scholar] [CrossRef]
- Alkhayat, M.; Khavkin, E.; Gasser, A.; Meiners, W.; Kelbassa, I. Comparison of geometrical properties of parts manufactured by powder bed based (SLM) and powder fed based (LMD) laser additive manufacturing technologies. In International Congress on Applications of Lasers & Electro-Optics; ICALEO® 2014: 33rd International Congress on Laser Materials Processing; Laser Microprocessing and Nanomanufacturing: San Diego, CA, USA; pp. 740–745. ISBN 978-1-940168-02-9.
- Awd, M.; Tenkamp, J.; Hirtler, M.; Siddique, S.; Bambach, M.; Walther, F. Comparison of Microstructure and Mechanical Properties of Scalmalloy® Produced by Selective Laser Melting and Laser Metal Deposition. Materials 2017, 11, 17. [Google Scholar] [CrossRef]
- Zheng, D.; Li, R.; Yuan, T.; Xiong, Y.; Song, B.; Wang, J.; Su, Y. Microstructure and mechanical property of additively manufactured NiTi alloys: A comparison between selective laser melting and directed energy deposition. J. Cent. South Univ. 2021, 28, 1028–1042. [Google Scholar] [CrossRef]
- Dawes, J.; Bowerman, R.; Trepleton, R. Introduction to the Additive Manufacturing Powder Metallurgy Supply Chain. Johns. Matthey Technol. Rev. 2015, 59, 243–256. [Google Scholar] [CrossRef]
- Herzog, D.; Seyda, V.; Wycisk, E.; Emmelmann, C. Additive manufacturing of metals. Acta Mater. 2016, 117, 371–392. [Google Scholar] [CrossRef]
- Haase, C.; Bültmann, J.; Hof, J.; Ziegler, S.; Bremen, S.; Hinke, C.; Schwedt, A.; Prahl, U.; Bleck, W. Exploiting Process-Related Advantages of Selective Laser Melting for the Production of High-Manganese Steel. Materials 2017, 10, 56. [Google Scholar] [CrossRef]
- Zhao, X.; Li, S.; Zhang, M.; Liu, Y.; Sercombe, T.B.; Wang, S.; Hao, Y.; Yang, R.; Murr, L.E. Comparison of the microstructures and mechanical properties of Ti–6Al–4V fabricated by selective laser melting and electron beam melting. Mater. Des. 2016, 95, 21–31. [Google Scholar] [CrossRef]
- Bontha, S.; Klingbeil, N.W.; Kobryn, P.A.; Fraser, H.L. Effects of process variables and size-scale on solidification microstructure in beam-based fabrication of bulky 3D structures. Mater. Sci. Eng. A 2009, 513, 311–318. [Google Scholar] [CrossRef]
- Tezel, T.; Kovan, V. Heat treatment effect on fatigue behavior of 3D-printed maraging steels. RPJ 2022, 28, 175–184. [Google Scholar] [CrossRef]
- Afkhami, S.; Dabiri, M.; Alavi, S.H.; Björk, T.; Salminen, A. Fatigue characteristics of steels manufactured by selective laser melting. Int. J. Fatigue 2019, 122, 72–83. [Google Scholar] [CrossRef]
- Jambor, T. Funktionalisierung von bauteiloberflächen durch Mikro-Laserauftragsschweißen. Ph.D. Thesis, RWTH AACHen University, Aachen, Germany, October 2012. [Google Scholar]
- SLM. SLM 800. Available online: https://www.slm-solutions.com/products-and-solutions/machines/slm-800/ (accessed on 2 May 2022).
- International Congress on Applications of Lasers & Electro-Optics; TRUMPF, Ed. ICALEO® 2015: 34th International Congress on Laser Materials Processing; Laser Microprocessing and Nanomanufacturing: Atlanta, GA, USA, 2015.
- Gruber, S.; Grunert, C.; Riede, M.; López, E.; Marquardt, A.; Brueckner, F.; Leyens, C. Comparison of dimensional accuracy and tolerances of powder bed based and nozzle based additive manufacturing processes. J. Laser Appl. 2020, 32, 32016. [Google Scholar] [CrossRef]
- Jägle, E.A.; Sheng, Z.; Wu, L.; Lu, L.; Risse, J.; Weisheit, A.; Raabe, D. Precipitation Reactions in Age-Hardenable Alloys During Laser Additive Manufacturing. JOM 2016, 68, 943–949. [Google Scholar] [CrossRef]
- Zhang, Q.; Hao, S.; Liu, Y.; Xiong, Z.; Guo, W.; Yang, Y.; Ren, Y.; Cui, L.; Ren, L.; Zhang, Z. The microstructure of a selective laser melting (SLM)-fabricated NiTi shape memory alloy with superior tensile property and shape memory recoverability. Appl. Mater. Today 2020, 19, 100547. [Google Scholar] [CrossRef]
- Bertsch, K.M.; Meric de Bellefon, G.; Kuehl, B.; Thoma, D.J. Origin of dislocation structures in an additively manufactured austenitic stainless steel 316L. Acta Mater. 2020, 199, 19–33. [Google Scholar] [CrossRef]
- EOS. EOS ToolSteel 1.2709: Material Data Sheet. Available online: https://www.eos.info/03_system-related-assets/material-related-contents/metal-materials-and-examples/metal-material-datasheet/werkzeugstahl_ms1_cx/material_datasheet_eos_toolsteel_1.2709_premium_en_2020_web.pdf (accessed on 5 December 2022).
- Weng, S.; Huang, Y.H.; Xuan, F.Z.; Luo, L.H. Correlation between Microstructure, Hardness and Corrosion of Welded Joints of Disc Rotors. Procedia Eng. 2015, 130, 1761–1769. [Google Scholar] [CrossRef]
- Liu, Q.; Wang, Y.; Zheng, H.; Tang, K.; Ding, L.; Li, H.; Gong, S. Microstructure and mechanical properties of LMD–SLM hybrid forming Ti6Al4V alloy. Mater. Sci. Eng. A 2016, 660, 24–33. [Google Scholar] [CrossRef]
- Kim, D.; Kim, T.; Ha, K.; Oak, J.-J.; Jeon, J.B.; Park, Y.; Lee, W. Effect of Heat Treatment Condition on Microstructural and Mechanical Anisotropies of Selective Laser Melted Maraging 18Ni-300 Steel. Metals 2020, 10, 410. [Google Scholar] [CrossRef]
- Kučerová, L.; Burdová, K.; Jeníček, Š.; Chena, I. Effect of solution annealing and precipitation hardening at 250 °C–550 °C on microstructure and mechanical properties of additively manufactured 1.2709 maraging steel. Mater. Sci. Eng. A 2021, 814, 141195. [Google Scholar] [CrossRef]
- Godec, M.; Malej, S.; Feizpour, D.; Donik, Č.; Balažic, M.; Klobčar, D.; Pambaguian, L.; Conradi, M.; Kocijan, A. Hybrid additive manufacturing of Inconel 718 for future space applications. Mater. Charact. 2021, 172, 110842. [Google Scholar] [CrossRef]
- Kučerová, L.; Zetková, I.; Jeníček, Š.; Burdová, K. Production of Hybrid Joints by Selective Laser Melting of Maraging Tool Steel 1.2709 on Conventionally Produced Parts of the Same Steel. Materials 2021, 14, 2105. [Google Scholar] [CrossRef] [PubMed]
| Disclaimer/Publisher’s Note: The statements, opinions and data contained in all publications are solely those of the individual author(s) and contributor(s) and not of MDPI and/or the editor(s). MDPI and/or the editor(s) disclaim responsibility for any injury to people or property resulting from any ideas, methods, instructions or products referred to in the content. |
© 2023 by the authors. Licensee MDPI, Basel, Switzerland. This article is an open access article distributed under the terms and conditions of the Creative Commons Attribution (CC BY) license (https://creativecommons.org/licenses/by/4.0/).


