Abstract
The durability assessment of additively manufactured parts needs to account for both surface-breaking material discontinuities and surface-breaking porosity and how these material discontinuities interact with parts that have been left in the as-built state. Furthermore, to be consistent with the airworthiness standards associated with the certification of metallic parts on military aircraft the durability analysis must be able to predict crack growth, as distinct from using a crack growth analysis in which parameters are adjusted so as to match measured data. To partially address this, the authors recently showed how the durability of wire arc additively manufactured (WAAM) 18Ni-250 maraging steel specimens, where failure was due to the interaction of small surface-breaking cracks with surface roughness, could be predicted using the Hartman–Schijve variant of the NASGRO crack growth equation. This paper illustrates how the same equation, with the same material parameters, can be used to predict the durability of a specimen where failure is due to surface-breaking porosity.
1. Introduction
The 1969 in-flight failure of the of F-111 D6ac steel wing pivot fitting is credited [1] with accelerating the introduction of linear elastic fracture mechanics-based assessment of the durability and damage tolerance (DADT) of aircraft structures into the United States Air Force (USAF). As a result, MIL-STD-1530D [2] mandates the use of linear elastic fracture mechanics (LEFM) for both the design and the through-life assessment of military aircraft. This requirement is also contained in the US Joint Services Structural Guidelines JSSG2006 [3], and in the USAF guidelines for the acceptance of additively manufactured (AM) parts [4]. However, as remarked in ASTM F2792-12a [5], the build process associated with AM parts can result in rough surfaces. Indeed, as implied in [4] and aptly illustrated in a large number of papers in the open literature [6,7,8,9,10,11,12,13,14,15,16,17,18,19,20,21,22,23,24,25,26,27,28,29,30,31,32,33,34], the existence of surface-breaking material discontinuities and/or near-surface porosity either in-isolation and/or when combined rough surfaces can significantly degrade the fatigue performance of an AM part. In this context, it should be noted that, as per various standards and guidelines [2,3,4], the durability assessment of both conventionally built and AM parts should assume an equivalent damage size (EIDS) of no less than 0.01 inch (0.254 mm). Furthermore, as discussed in [4], the DADT analysis of an AM part must consider the effect of surface roughness, surface-breaking porosity, and surface-breaking material defects.
Previous works by Beretta and Romano [21] suggested that the analysis of surface-breaking and near-surface material discontinuities could be performed by modelling them as if they were a surface-breaking crack. Indeed, Matsuo et al. [23] used this approach to determine estimates of the fatigue thresholds associated with a range of AM build processes. Variants of this approach have also been used [7,35,36] to estimate the fatigue lives of AM parts. However, when computing the fatigue life of an AM part, these approaches have generally used the da/dN versus ΔK curves determined from tests performed as per the main body of the ASTM fatigue test standard ASTM E647 [37]. Unfortunately, the use of the long crack da/dN versus ΔK curve can result in values of the equivalent initial damage size (EIDS) that are dependent on the flight load spectrum, see [27,38,39,40]. Hence, for any arbitrary da/dN versus ΔK curve, while an EIDS can generally be chosen such that the computed life matches the measured life, the calculated, measured and computed crack growth curves can differ significantly.
To illustrate this latter point, let us consider cracking in the Boeing F/A-18 Y488 bulkhead, which was an AA7050-T7451 aluminium alloy component, subjected to an operational flight load spectrum, reported in [27,38,39,40]. Figure 1 presents the measured crack growth history given in [27,40,41] for this problem together with the predicted curve obtained using the measured small crack da/dN versus ΔK curve that was also given in [27,38,39,40]. This study also revealed that the crack growth history computed using the long crack da/dN versus ΔK curve and the measured initial crack size was very non-conservative. However, [27] revealed that if an analysis is performed assuming an EIDS of approximately 0.069 mm, then the computed life obtained using the long crack da/dN versus ΔK curve will be in good agreement with the measured test life, see Figure 1. Unfortunately, unlike the predicted crack growth history obtained using the small crack da/dN versus ΔK curve (determined from constant amplitude fatigue tests) and the measured initial crack size, the crack depth history computed using the long crack da/dN versus ΔK curve and an EIDS of 0.069 mm differed markedly from that seen in the test, see Figure 1.
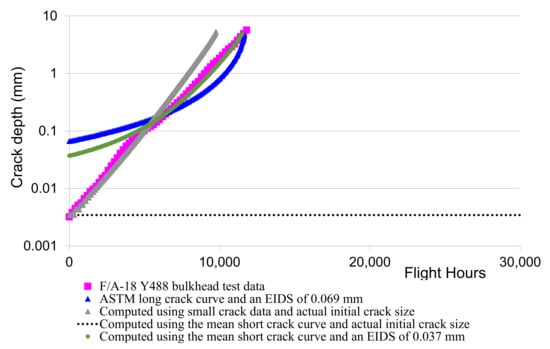
Figure 1.
The measured and computed crack growth histories obtained using different da/dN versus ΔK curves and the associated (different) EIDS.
Figure 1 also contains the predicted curve obtained using the mean short crack curve obtained in [42] for the growth of short cracks in AA7050-T7451. In this instance, in order to match the measured test life, an EIDS of approximately 0.037 mm is required, see Figure 1. However, while the crack growth history post a crack length of approximately 0.1 mm is in good agreement with the test measurements, the crack growth history sub approximately 1 mm differs from the experimental measurements. The need to use an EIDS that differs markedly from the size of the measured initial material discontinuity means that this approach cannot be classified as a prediction.
A related finding is reported in [43], where a crack closure-based crack growth equation was used to analyse the same problem described above. In this instance, while [43] only analysed crack growth post a depth of approximately 0.1 mm, it was reported that when the short-crack equation determined in [43] for crack growth in AA7050-T7451 under constant amplitude loads was used to predict the crack growth in the F/A-18-Y488 bulkhead test, the resultant crack growth versus flight hours curve was quite non-conservative. Reference [43] also presented the crack growth history for AA7050-T7451 specimens tested under a mini-TWIST flight load spectrum. (Mini-TWIST is a civil aircraft wing load spectrum.) This study also found that when the short crack equation determined in [43] for crack growth in AA7050-T7451 under constant amplitude loads was used to predict crack growth, in this case for cracks with an initial depth of approximately 0.2 mm, the resultant crack growth versus flight hours curve was also non-conservative. As such, these studies did not establish the predictive capability required in MIL-STD-1530D. In this context, it should be noted that [44] had revealed how the measured small crack da/dN versus ΔK curve can, provided that crack closure concepts are not used, be used to accurately compute the growth of small cracks in AA7050-T7451 under mini-TWIST test loads.
A similar finding was also reported in [45], where it was shown that when using a crack closure-based crack growth equation the analyses performed using the small crack da/dN versus ΔK curve, which was determined under a simple marker-block load spectrum, to compute crack growth under an operational flight load spectrum had to assume an initial crack size that differed from test measurements and/or had to use a modified crack growth equation. (In other words, the methodology presented in [45] could not be used to predict crack growth, and was not consistent with the “building-block” approach mandated in MIL-STD-1530D and JSSG2006.) It was also shown that the measured small crack da/dN versus ΔK curve had little R ratio dependency, see Figure 2. This observation, i.e., the lack of an obvious R ratio dependency is a feature of many short crack da/dN versus ΔK curves, see [46]. Since crack closure is based on the assumption of a R ratio dependency, see Appendix A, this raises a question with respect to the use of crack closure-based equations for durability analyses.
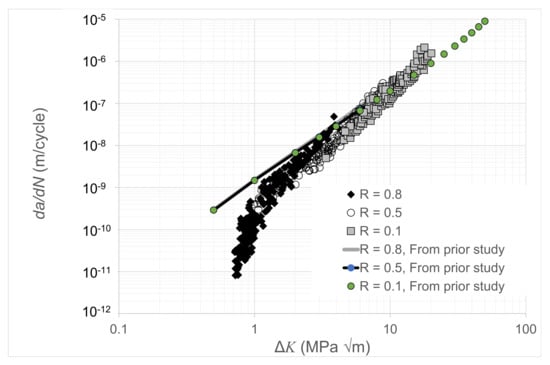
Figure 2.
The measured small crack curves given in [44] for the growth of small cracks in AA7075-T7351 together with the predicted worst-case small crack curve given in [46] for this material.
Reference [45] also stated that the small crack curve needed to improve the crack growth predictions given in [45] for AA7075-T7351 should lie to the left of the da/dN versus ΔK curves shown in Figure 2. In this context, although not noted in [45], the worst-case small crack da/dN versus ΔK curves needed to predict the growth of small naturally occurring cracks in AA7075-T7351 were previously given in [47], where they were used to predict the fastest growing cracks in AA7075-T7351 specimens that were repaired using cold spray. These curves are also shown in Figure 2, where it can be seen that they are consistent with the statement outlined in the previous sentence in that for da/dN < 10−8 m/cycle they are to the left of the curves given in [45]. Here, it should be noted that these curves were obtained from the Hartman–Schijve representation of crack growth in AA7075-T7351 and had the fatigue threshold term set to 0.1 MPa √m. This approach to determining a first approximation of the small crack growth equation will be discussed in the next few paragraphs.
Having noted that [27,39,40,44] revealed how to use the small crack growth equation to accurately predict the growth of small cracks under realistic flight load spectra, it should also be noted that the author’s recent paper [28] used the same approach to illustrate how to use the small crack da/dN versus ΔK curve to predict the durability of WAAM 18Ni-250 maraging steel specimens, where failure was due to the interaction of small surface-breaking cracks with surface roughness. In each case, the analyses used the Hartman–Schijve variant of the NASGRO crack growth equation, viz:
where a is the crack length/depth, N is the number of cycles, D and p are material constants, and the Schwalbe crack driving force ∆κ [48] is given by the expression
Here, A is the apparent cyclic fracture toughness, and the term ΔK is defined as:
where Kmax and Kmin are the maximum and minimum values of K in a cycle, and ∆Kthr is the fatigue threshold. The values of D and p used in [28] were D = 2.0 10−10 and p = 2. In [28], the small crack da/dN versus ΔK curve was estimated as per [39,40,41,46,47,49,50,51], and as mentioned above, by setting the threshold term ∆Kthr to a small value, namely ∆Kthr = 0.1 MPa √m.
We have previously mentioned the important role that the 1969 F111 D6ac wing pivot failure had in the adoption of LEFM for DADT analyses. It has been highlighted previously [51] that cracks in D6ac steel essentially have no R ratio dependency and hence no crack closure. Nevertheless, as noted in [51], the crack-closure-free da/dN versus ΔK curve(s) did not correspond to the crack growth curve needed to assess crack growth in the F-111 wing pivot fitting. It was also noted that, as first shown in [39], the crack growth history in this test could be accurately predicted using Equations (1) and (2) using the values of D and p determined from long crack tests on D6ac steel and setting the term ∆Kthr = 0.1 MPa √m.
This approach has also been used to predict crack growth in durability tests on a range of both conventionally and AM-built coupons, and also in several full-scale fatigue tests [27,28,29,30,34,39,40,41,42,44,49,50,51,52,53,54,55]. Indeed, [56] used a similar formulation to study the growth of subsurface cracks in a tool steel. As such, the purpose of this paper is to highlight the generic nature of this approach to computing the durability of both conventionally manufactured and AM metallic structures. To this end, we investigate whether this methodology, i.e., using Equations (1) and (2) with the material constants as used in the prior study [28], namely A = 150 MPa m, D = 2.0 10−10, ∆Kthr = 0.1 MPa √m and p = 2, can be used to predict the durability of a WAAM 18Ni 250 maraging steel specimens, which, as noted in [57], are widely used in the aerospace industry, where failure occurs due to cracks that nucleate and subsequently grow from surface-breaking porosity.
2. Materials and Methods
This paper addresses the research gap associated with the LEFM-based assessment of the durability of WAAM parts with surface breaking porosity. To be consistent with the authors prior paper on the effect of the surface-breaking cracks on the durability of WAAM 18Ni-250 maraging steel specimens with rough surfaces [28] and the methodology presented in [27,28,29,30,34,39,40,41,42,44,49,50,51,52,53,54,55] for the durability analyses of both conventionally and AM built parts, this paper uses the same crack growth equation and methodology used in [28].
A series of constant-amplitude fatigue tests was performed on WAAM 18Ni-250 maraging steel specimens, where the build process had been modified (using low purity argon gas) to create significant porosity within the as printed test specimen. Prior to testing, the surface roughness of the specimens was measured using a laser scanner (Artec3D Leo, Santa Clara, CA, USA). The scanner used has an accuracy of approximately 0.1 mm. Once the specimen had failed, the size and shape of the porosity were measured using various microscopy methods: optical stereo microscopy (Olympus SZ51, Tokyo, Japan) and scanning electron microscopy (Zeiss Supra 40VP SEM, Jena, Germany). To enable the crack growth history to be established using quantitative fractography, the specimens were subjected to a repeated marker-block load spectrum.
The durability analyses started with the crack size being taken as shown in the tests. The stress intensity factor (K) solutions around this initial crack were determined, as per [28], using the alternating finite element analysis approach outlined in [58,59]. At each stage in the analysis process, the increment in the crack length (da) resulting from a given load cycle (N) was calculated using the crack growth equation given in [28], namely:
This increment in crack length/depth was then used to determine the subsequent size and shape of the crack. The crack growth analysis was repeated until at some point around the crack front the value of Kmax exceeded the cyclic fracture toughness value of the material, which, as in [28], was taken to be 150 MPa √m.
3. The Effect of Surface-Breaking Porosity on Crack Growth
Let us now illustrate the ability of Equations (1) and (2) to predict the durability of a WAAM 18Ni-250 maraging steel specimen with surface-breaking porosity. Whereas the authors’ prior study [28] on the durability of WAAM 18Ni-250 maraging steel specimens focused on specimens with rough surfaces, it was decided to also test a specimen where the surface had been machined flat, see Figure 3. This was to evaluate whether the same durability analysis could be used to predict failure due to cracks that nucleated from surface-breaking porosity. To assist in this goal, i.e., to create surface-breaking material porosity, the build process was modified by lowering the purity of the argon shielding gas, which in turn created defects in the final build. As can be seen in Figure 4, this modification to the build process did indeed result in large surface-breaking porosity.
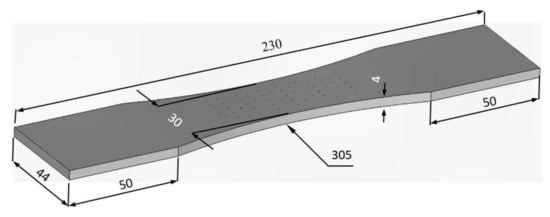
Figure 3.
Specimen geometry.
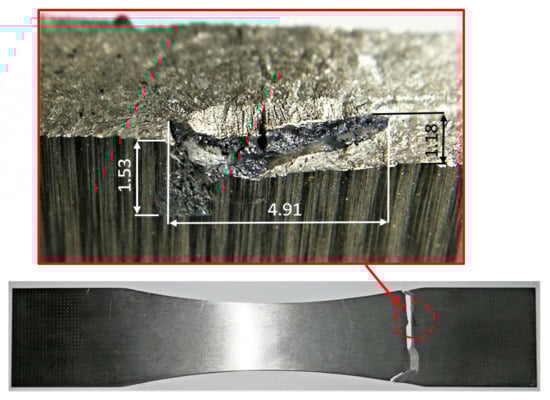
Figure 4.
Expanded view of the failure and the near-surface defect.
Two specimens were tested. To enable the crack growth histories to be determined the specimens were subjected to the same test spectrum. This spectrum was a series of repeated load blocks that consisted of 1200 cycles at R = 0.1, and 8000 cycles at R = 0.5. The maximum value of the load in each load block was Pmax = 29 kN.
3.1. Specimen 1
Failure in Specimen 1 was due to cracks that nucleated from the large surface-breaking porosity shown in Figure 4, Figure 5 and Figure 6. It was found that failure occurred as a result of multiple cracks that nucleated along the periphery of the porosity and subsequently linked to form a single macro crack which then led to the failure of the specimen.
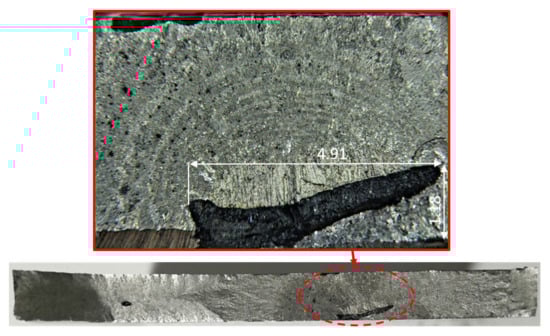
Figure 5.
Expanded view of the failure surface.
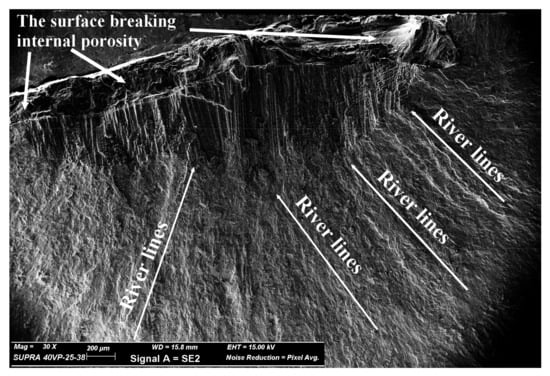
Figure 6.
SEM image of the critical location showing the multiple initiation sites. Here, it should be noted that, for clarity, the image is inverted with respect to Figure 4. The scale, magnification factor, etc., are shown in the figure.
In order to perform the durability analysis of this specimen, the topography of the specimen was measured via the laser scanner to create a CAD model that included both the surface roughness and the surface-breaking porosity, see Figure 7. As in [28], the CAD model was used to create two different finite element (FE) models. This was done to establish that the stress field associated with the finite element model had “converged”. Two different mesh densities were investigated. One had 455,667 nodes and 302,099 ten-noded iso-parametric tetrahedral elements. The other had 3,716,916 nodes and 2,582,879 ten-noded iso-parametric tetrahedral elements. As in [28], both models were created using auto-meshing. The stress fields associated with these two different meshes differed by less than 2.1%. The stress field associated with the fine mesh is shown in Figure 8. Here, it should be noted that since we were only interested in comparing the results of the two different meshes, the analysis used a fixed remote load of 50 kN rather than the load of 29 kN that was used in the experimental test.
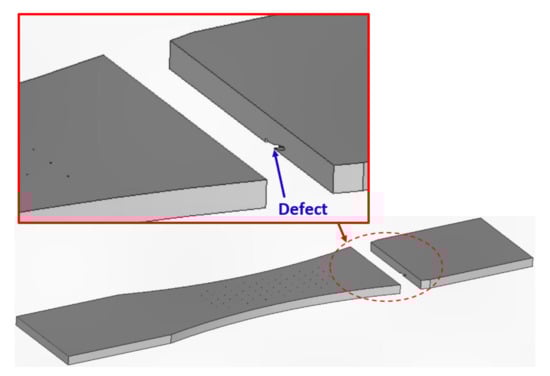
Figure 7.
The CAD model.
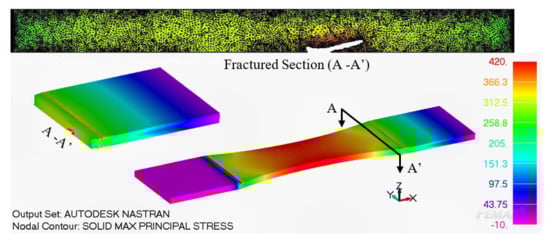
Figure 8.
The maximum principal stress at a remote load of 50 kN, the stress units are in MPa.
A durability analysis of this specimen was then performed, as per [28], using the fine mesh and Equations (1) and (2) together with the values of the parameters given in [28], viz: D = 2.0 × 10⁻¹⁰, p = 2, A = 150 MPa √m and ∆Kthr = 0.1 MPa √m. (Details of the methodology used in the durability analysis can be found in [28].) The resultant computed and measured crack growth histories, post the mandated minimum equivalent initial damage size (EIDS) of 0.254 mm [4], are shown in Figure 9, where we see good agreement. In this analysis, the aspect ratio of the initial crack were taken to be as measured in the test, namely c/a = 1.67. Here, a is the crack depth, and 2c is the crack’s total length in the direction perpendicular to the crack’s maximum depth.
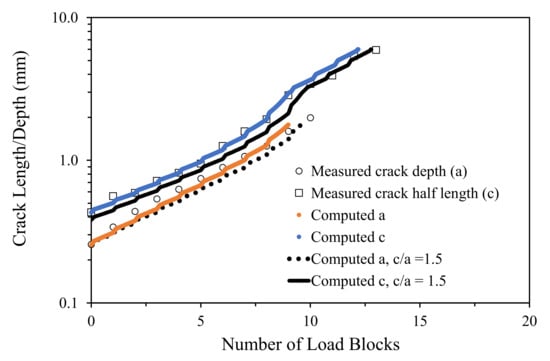
Figure 9.
Comparison between measured and computed crack growth histories.
Noting that the NASA Fracture Control Handbook NASA-HDBK-510 [60] suggests using an EIDS with an aspect ratio of 1.5, and that [61] showed that the durability analysis of a WAAM specimen tested with surfaces left in the “as-built” state performed using an EIDS with an aspect ratio of 1.0 can yield non-conservative results, the analysis was repeated for the case when the EIDS had a depth (a) of 0.254 mm and a surface half-crack length (c) of 0.381 mm, i.e., an aspect ratio (c/a) of 1.5. The computed crack growth histories are also shown in Figure 9. Figure 9 reveals that adopting the NASA-HDBK-510 suggestion of using an EIDS with an aspect ratio of 1.5 gave computed crack growth histories that were (also) in reasonably good agreement with the experimental measurements.
Since JSSG2006 [3] suggests that the EIDS should have an aspect ratio (c/a) of 1.0, the analyses were repeated for an EIDS with an aspect ratio of 1.0. Two such analyses were performed. One had an EIDS with a = c = 0.254 mm, and the other had an EIDS where a = c = 0.43 mm, i.e., assuming a depth equal to the measured surface half crack length. The resultant computed and measured growth histories are shown in Figure 10. Here, we see that if the initial EIDS is taken to have an aspect ratio (c/a) of one, then, to obtain a reasonable estimate of the crack growth histories, the assumed EIDS needs to be significantly greater than the actual crack depth. In this instance, while assuming that the crack depth was equal to the surface half crack length appears to yield good estimates for the surface crack length history, it initially underestimates the rate of crack growth the depth direction.
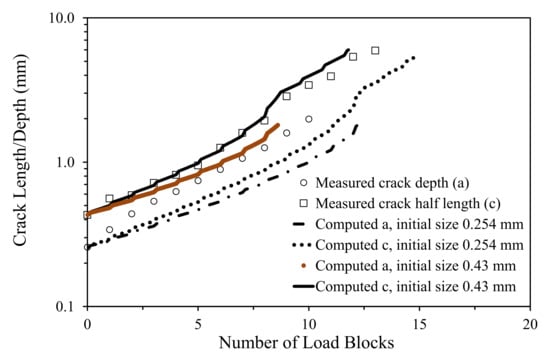
Figure 10.
Comparison between measured and computed crack growth histories, assuming and EIDS with c/a = 1.0.
3.2. Specimen 2
Failure in Specimen 1 was also associated with large surface-breaking porosity (see Figure 11 and Figure 12). In this specimen failure initiated at the centre line of the specimen (see Figure 11). Figure 12 and Figure 13 reveal that failure occurred as a result of cracks that nucleated along the periphery of the porosity and subsequently linked to form a single macro crack which then led to the failure of the specimen. While there was evidence of completely contained internal porosity (see Figure 12), there was little if any crack growth from these internal defects.
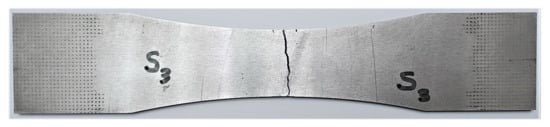
Figure 11.
Plan view of the failed specimen.
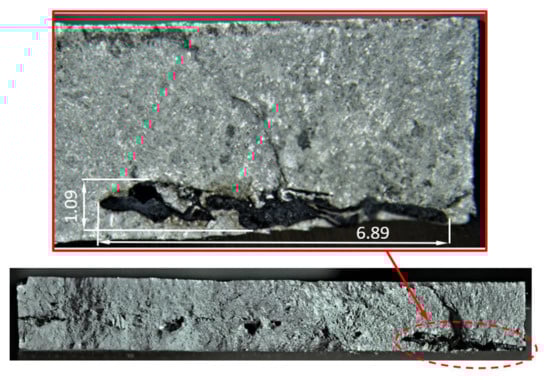
Figure 12.
Cracks initiated at the edges of the internal defect.
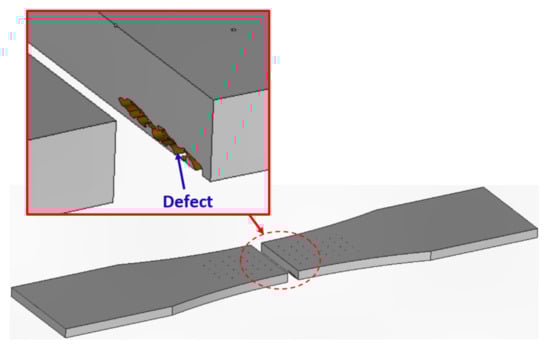
Figure 13.
Specimen 2 geometry.
As previously, a CAD model of the specimen was developed, see Figure 13, and used to create two different FE models. Two different mesh densities were investigated. One had 457,177 nodes and 303,890 ten-noded iso-parametric tetrahedral elements. The other had 755,061 nodes and 511,747 ten-noded iso-parametric tetrahedral elements, see Figure 14. As in [28], both models were created using auto-meshing. The stress fields associated with these two different meshes differed by less than 1.9%. The stress field associated with the fine mesh is shown in Figure 15.
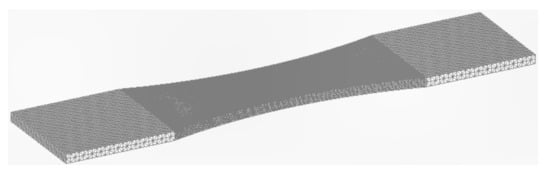
Figure 14.
Mesh 2: 511,747 ten-noded iso-parametric tetrahedral elements and 755,061 nodes.
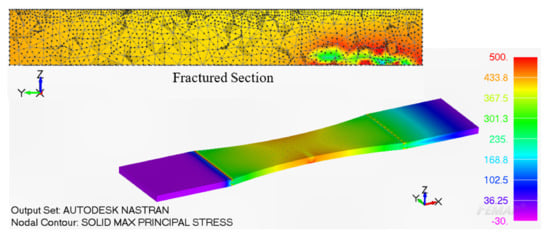
Figure 15.
The maximum principal stress for Specimen 2 at a remote load of 50 kN, the stress units are in MPa.
A durability analysis of Specimen 2 was performed using the same crack growth equation. The initial size of the crack used in this analysis was taken to be as per the first measurable crack size that was close to 0.254 mm, viz: a0 = 0.228 mm and c0 = 0.307 mm. Plots of the predicted measured and crack growth histories are shown in Figure 16 where we see good agreement. As previously the analysis was also repeated with an EIDS with an aspect ratio (c/a) of 1.5 such that a0 = 0.228 mm and c0 = 0.342 mm. The results of this analysis are also shown in Figure 16 where we see reasonably good agreement with the experimental measurements.
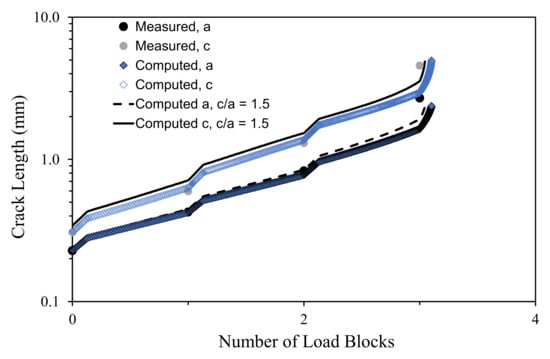
Figure 16.
The measured and computed crack depth/length histories.
The analyses were then repeated for an EIDS with an aspect ratio of 1.0. Two such analyses were performed. One with an EIDS with a = c = 0.254 mm, and the other with an EIDS where a = c = 0.307 mm, i.e., assuming a depth equal to the measured surface crack length. The resultant computed and measured crack growth histories are shown in Figure 17. Here, we see that if the initial EIDS is taken to have an aspect ratio (c/a) of one, then, to obtain a reasonable estimate of the durability of the specimen, the assumed EIDS must be significantly greater than the actual crack depth. In this instance, we again see that assuming that the crack depth was equal to the surface crack length, i.e., a = c = 0.307 mm, yields reasonable estimates for the surface crack length history.
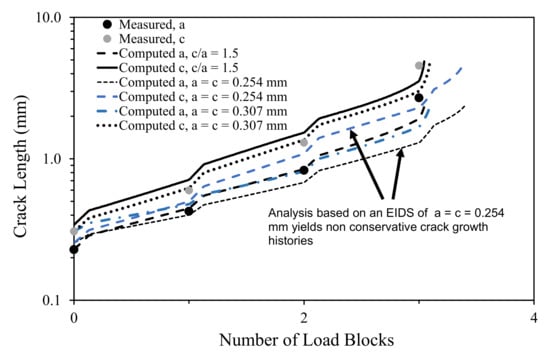
Figure 17.
Comparison between measured and computed crack growth histories using an EIDS with c/a = 1.0 and 1.5.
4. Conclusions
The ability to predict the growth of small sub-millimetre cracks associated with surface-breaking porosity is central to the airworthiness certification of AM metallic parts on military aircraft. Here, it should be stressed that the ability to be able to reasonably accurately compute crack growth histories by adjusting parameters in the crack growth equation so as to match measured data does not qualify as a prediction.
The present paper illustrates how the methodology developed in a range of previous studies into the durability analyses of both conventionally built and AM coupon tests, and full-scale fatigue tests can be used to predict the durability of WAAM 18Ni-250 maraging steel specimens, where failure is due to surface-breaking porosity. A feature of this study is that, as was the case for the durability predictions performed in the author’s previous paper on WAAM 18Ni-250 maraging steel specimens where failure occurred due to the integration of rough surfaces with small surface-breaking cracks, there are no adjustable parameters used in the analyses. As such, the present analyses are pure predictions.
We also see that, as previously found for cracks that originate from rough surfaces, whereas using an EIDS with an aspect ratio of one and a depth (a) equal to the surface crack length (c) yields acceptable estimates for the surface crack growth history, assuming an aspect ratio of 1.5, as suggested in NASA-HDBK-5010, resulted in a better estimate of the crack depth history.
Author Contributions
Project overview in Australia—R.J.; Testing—D.P.; Fractography—S.P.; Crack growth predictions—D.P.; Funding—A.S.M.A.; Conceptualisation and program overview—V.K.C. and A.B.; 1st draft of the paper—R.J. and A.S.M.A.; Overview and evaluation of the final paper and its relationship to certification—V.K.C. and R.J.; Specimen manufacture—A.B. and A.M. All authors have read and agreed to the published version of the manuscript.
Funding
R.J., A.S.M.A. and D.P. would like to acknowledge funding provided by the US Army International Technology Center, Indo-Pacific (ITC-IPAC), Tokyo, Contract No. FA520921P0164.
Data Availability Statement
This is an ongoing project and the data will be made at available at the completion of the project.
Conflicts of Interest
The authors declare no conflict of interest. The findings and conclusions or recommendations expressed in this paper are those of the authors and do not necessarily reflect the views of the ITC-IPAC.
Appendix A
The concept of crack closure is based on the papers by Elber [62,63], which introduced a function U(R) that was used to define a term ΔKeff, viz:
such that, for plastic wake induced crack closure, the resultant da/dN versus ΔKeff curves all fall onto a single curve regardless of the R ratio. Whenever, the measured da/dN versus ΔK curves essentially fall onto a single curve the function U(R) is approximately one. In such a case, the use of functions U(R) such as those used in [43,45], which are strong functions of R, are inappropriate.
References
- Tiffany, C.F.; Gallagher, J.P.; Babish, C.A., IV. Threats to Aircraft Structural Safety, Including a Compendium of Selected Structural Accidents/Incidents, Aeronautical Systems Center, Engineering Directorate, Wright-Patterson Air Force Base, ASC- TR-2010-5002. 2010. Available online: https://apps.dtic.mil/sti/pdfs/ADA519867.pdf (accessed on 18 February 2023.).
- MIL-STD-1530D, Department Of Defense Standard Practice Aircraft Structural Integrity Program (ASIP), 13 October 2016. Available online: http://everyspec.com/MIL-STD/MIL-STD.../download.php?spec=MIL-STD-1530D (accessed on 2 February 2023).
- Department of Defense Joint Service Specification Guide, Aircraft Structures, JSSG-2006, October 1998. Available online: https://daytonaero.com/usaf-structures-bulletins-library/ (accessed on 2 February 2023).
- Durability and Damage Tolerance Certification for Additive Manufacturing of Aircraft Structural Metallic Parts; Structures Bulletin EZ-SB-19-01; Wright Patterson Air Force Base: Greene, OH, USA, 2019.
- ASTM F2792-12a; Standard Terminology for Additive Manufacturing Technologies. ASTM: West Conshohocken, PA, USA, 2012.
- Greitemeier, D.; Palm, F.; Syassen, F.; Melz, T. Fatigue performance of additive manufactured TiAl6V4 using electron and laser beam melting. Int. J. Fatigue 2017, 94, 211–217. [Google Scholar] [CrossRef]
- Greitemeier, D.; Dalle Donne, C.; Syassen, F.; Eufinger, J.; Melz, T. Effect of surface roughness on fatigue performance of additive manufactured Ti-6Al-4V. Mater. Sci. Technol. 2016, 32, 629–634. [Google Scholar] [CrossRef]
- Kahlin, M.; Ansell, H.; Moverare, J.J. Fatigue behaviour of notched additive manufactured Ti6Al4V with as-built surfaces. Int. J. Fatigue 2017, 101, 51–60. [Google Scholar] [CrossRef]
- Kahlin, M.; Ansell, H.; Moverare, J.J. Fatigue behaviour of additive manufactured Ti6Al4V, with as-built surfaces, exposed to variable amplitude loading. Int. Fatigue 2017, 103, 352–363. [Google Scholar] [CrossRef]
- Chan, K.S. Characterization and analysis of surface notches on Ti-alloy plates fabricated by additive manufacturing techniques. Surf. Topogr. Metrol. Prop. 2015, 3, 4. [Google Scholar] [CrossRef]
- Leuders, S.; Vollmer, M.; Brenne, F.; Troster, T.; Niendorf, T. Fatigue Strength Prediction for Titanium Alloy TiAl6V4 Manufactured by Selective Laser Melting. Metall. Mater. Trans. A 2014, 46, 3816–3823. [Google Scholar] [CrossRef]
- Li, P.; Warner, D.H.; Fatemi, A.; Phan, N. Critical assessment of the fatigue performance of additively manufactured Ti-6Al-4V and perspective for future research. Int. J. Fatigue 2016, 85, 30–143. [Google Scholar] [CrossRef]
- Pegues, J.; Roach, M.; Williamson, R.S.; Shamsaei, N. Surface roughness effects on the fatigue strength of additively manufactured Ti-6Al-4V. Int. J. Fatigue 2018, 116, 543–552. [Google Scholar] [CrossRef]
- Gorelik, M. Additive manufacturing in the context of structural integrity. Int. J. Fatigue 2017, 94, 168–177. [Google Scholar] [CrossRef]
- Sandgren, H.R.; Zhai, Y.; Lados, D.A.; Shade, P.A.; Schuren, J.C.; Groeber, M.A.; Kenesei, P.; Gavras, A.G. Characterization of fatigue crack growth behavior in LENS fabricated Ti-6Al-4V using high-energy synchrotron X-ray microtomography. Addit. Manuf. 2016, 12, 132–141. [Google Scholar] [CrossRef]
- Zhai, Y.; Galarraga, H.; Lados, D.A. Microstructure, static properties, and fatigue crack growth mechanisms in Ti-6Al-4V fabricated by additive manufacturing: LENS and EBM. Eng. Fail. Anal. 2016, 69, 3–14. [Google Scholar] [CrossRef]
- Zhai, Y.; Lados, D.A.; Brown, E.J.; Vigilante, G.N. Fatigue crack growth behavior and microstructural mechanisms in Ti-6Al-4V manufactured by laser engineered net shaping. Int. J. Fatigue 2016, 93, 51–63. [Google Scholar] [CrossRef]
- Cao, F.; Zhang, T.; Ryder, M.A.; Lados, D.A. A Review of the Fatigue Properties of Additively Manufactured Ti-6Al-4V. JOM 2018, 70, 349–357. [Google Scholar] [CrossRef]
- Torries, B.; Imandoust, A.; Beretta, S.; Shao, S.; Shamsaei, N. Overview on Microstructure- and Defect-Sensitive Fatigue Modeling of Additively Manufactured Materials. JOM 2018, 70, 1853–1862. [Google Scholar] [CrossRef]
- Beretta, S.; Romano, S. A comparison of fatigue strength sensitivity to defects for materials manufactured by AM or traditional processes. Int. J. Fatigue 2017, 94, 178–191. [Google Scholar] [CrossRef]
- Romano, S.; Brukner-Foit, A.; Brandao, A.; Gumpinger, J.; Ghidini, T.; Beretta, S. Fatigue properties of AlSi10Mg obtained by additive manufacturing: Defect-based modelling and prediction of fatigue strength. Eng. Fract. Mech. 2018, 187, 165–189. [Google Scholar] [CrossRef]
- Romano, S.; Nezhadfar, P.D.; Shamsaei, N.; Seifi, M.; Beretta, S. High cycle fatigue behavior and life prediction for additively manufactured 17-4PH stainless ssteel: Effect of sub-surface porosity and surface roughness. Theor. Appl. Fract. Mech. 2020, 106, 102477. [Google Scholar] [CrossRef]
- Matsuo, H.; Tanaka, Y.; Morokoshi, S.; Yagura, H.; Uchida, T.; Yamamoto, Y.; Murakami, Y. Influence of Defects, Surface Roughness and HIP on the Fatigue Strength of Ti-6Al-4V Manufactured by Additive Manufacturing. Int. J. Fatigue 2018, 117, 163–179. [Google Scholar] [CrossRef]
- Edwards, P.; Ramulu, M. Effect of build direction on the fracture toughness and fatigue crack growth in selective laser melted Ti-6Al-4V. Fatigue Fract. Eng. Mater. Struct. 2015, 38, 1228–1236. [Google Scholar] [CrossRef]
- Haijun Gong, H.; Rafi, K.; Starr, T.; Stucker, B. Effect of Defects on Fatigue Tests of As-Built TI-6AL-4V Parts Fabricated by Selective Laser Melting. Available online: sffsymposium.engr.utexas.edu/Manuscripts/2012/2012-39-Gong.pdf. (accessed on 3 February 2023).
- Bagehorn, S.; Wehr, J.; Maier, H.J. Application of mechanical surface finishing processes for roughness reduction and fatigue improvement of additively manufactured Ti-6Al-4V parts. Int. J. Fatigue 2017, 102, 135–142. [Google Scholar] [CrossRef]
- Jones, R.; Raman, R.K.S.; Iliopoulos, A.P.; Michopoulos, J.G.; Phan, N.; Peng, D. Additively manufactured Ti-6Al-4V replacement parts for military aircraft. Int. J. Fatigue 2019, 124, 227–235. [Google Scholar] [CrossRef]
- Peng, D.; Jones, R.; Ang, A.S.M.; Michelson, A.; Champagne, V.; Birt, A.; Pinches, S.; Kundu, S.; Alankar, A.; Singh Raman, R.K. Computing the durability of WAAM 18Ni 250 Maraging steel specimens. Fatigue Fract. Eng. Mater. Struct. 2022, 45, 3535–3545. [Google Scholar] [CrossRef]
- Sanaei, N.; Fatemi, A. Defect-based fatigue life prediction of L-PBF additive manufactured metals. Eng. Fract. Mech. 2021, 244, 107541. [Google Scholar] [CrossRef]
- Sanaei, N.; Fatemi, A. Defects in additive manufactured metals and their effect on fatigue performance: A state-of-the-art review. Prog. Mater. Sci. 2021, 117, 100724. [Google Scholar] [CrossRef]
- Tammas-Williams, S.; Withers, P.J.; Todd, I.; Prangnell, P.B. The Influence of Porosity on Fatigue Crack Initiation in Additively Manufactured Titanium Components. Sci. Rep. 2017, 7, 7308. [Google Scholar] [CrossRef]
- Ferro, P.; Fabrizi, A.; Berto, F.; Savio, G.; Meneghello, R.; Rosso, S. Defects as a root cause of fatigue weakening of additively manufactured AlSi10Mg components. Theor. Appl. Fract. Mech. 2020, 108, 102611. [Google Scholar] [CrossRef]
- Renzo, D.A.; Maletta, C.; Sgambitterra, E.; Furgiuele, F.; Berto, F. Surface roughness effect on multiaxial fatigue behavior of additively manufactured Ti6Al4V alloy. Int. J. Fatigue 2022, 163, 107022. [Google Scholar] [CrossRef]
- Shamir, M.; Zhang, X.; Syed, A.K. Characterising and representing small crack growth in an additive manufactured titanium alloy. Eng. Fract. Mech. 2021, 253, 107876. [Google Scholar] [CrossRef]
- Yadollahi, A.; Mahtabi, M.J.; Khalili, A.; Doude, H.R.; Newman, J.C., Jr. Fatigue life prediction of additively manufactured material: Effects of surface roughness, defect size, and shape. Fatigue Fract. Eng. Mater. Struct. 2018, 41, 1602–1614. [Google Scholar] [CrossRef]
- Walker, K.; Liu, Q.; Brandt, M. Evaluation of fatigue crack propagation behaviour in Ti-6Al-4V manufactured by selective laser melting. Int. J. Fatigue 2017, 104, 302–308. [Google Scholar] [CrossRef]
- ASTM E647-13; Measurement of Fatigue Crack Growth rates. ASTM: West Conshohocken, PA, USA, 2013.
- Lincoln, J.W.; Melliere, R.A. Economic Life Determination for a Military Aircraft. AIAA J. Aircr. 1999, 36, 737–742. [Google Scholar] [CrossRef]
- Jones, R. Fatigue crack growth and damage tolerance. Fatigue Fract. Eng. Mater. Struct. 2014, 37, 463–483. [Google Scholar] [CrossRef]
- Jones, R.; Singh Raman, R.K.; McMillan, A.J. Crack growth: Does microstructure play a role? Eng. Fract. Mech. 2018, 187, 190–210. [Google Scholar] [CrossRef]
- Jones, R.; Peng, D.; Singh, R.R.K.; Huang, P.; Tamboli, D.; Matthews, N. On the growth of fatigue cracks from corrosion pits and manufacturing defects under variable amplitude loading. JOM 2015, 67, 1385–1391. [Google Scholar] [CrossRef]
- Jones, R.; Rans, C.; Iliopoulos, A.P.; Michopoulos, J.G.; Phan, N.; Peng, D. Modelling the Variability and the Anisotropic Behaviour of Crack Growth in SLM Ti-6Al-4V. Materials 2021, 14, 1400. [Google Scholar] [CrossRef]
- Walker, K.F.; Wang, C.H.; Newman, J.C., Jr. Closure measurement and analysis for small cracks from natural discontinuities in an aluminium alloy. Int. J. Fatigue 2016, 82, 256–262. [Google Scholar] [CrossRef]
- Tamboli, D.; Barter, S.; Jones, R. On the growth of cracks from etch pits and the scatter associated with them under a miniTWIST spectrum. Int. J. Fatigue 2018, 109, 10–16. [Google Scholar] [CrossRef]
- Jones, M.; Main, B.; Maxfield, K.; Barter, S.; Das, R. Predicting Fatigue Crack Growth through the Small and Long Crack Regimes for a Military Transport Aircraft Loading Spectrum using FASTRAN. Int. J. Fatigue 2023, 171, 107576. [Google Scholar] [CrossRef]
- Jones, R.; Tamboli, D. Implications of the lead crack philosophy and the role of short cracks in combat aircraft. Eng. Fail. Anal. 2013, 29, 149–166. [Google Scholar] [CrossRef]
- Peng, D.; Tang, C.; Matthews, N.; Jones, R.; Kundu, S.; Singh Raman, R.K.; Alankar, A. Computing the Fatigue Life of Cold Spray Repairs to Simulated Corrosion Damage. Materials 2021, 14, 4451. [Google Scholar] [CrossRef]
- Schwalbe, K.H. On the Beauty of Analytical Models for Fatigue Crack Propagation and Fracture-A Personal Historical Review. J. ASTM Intl. 2010, 7, 3–73. [Google Scholar] [CrossRef]
- Jones, R.; Cizek, J.; Kovarik, O.; Ang, A.; Champagne, V. Observations on comparable aluminium alloy crack growth curves: Additively manufactured Scalmalloy® as an alternative to AA5754 and AA6061-T6 alloys? Add. Manuf. Lett. 2022, 2, 100026. [Google Scholar] [CrossRef]
- Jones, R.; Molaei, R.; Fatemi, A.; Peng, D.; Phan, N. A note on computing the growth of small cracks in AM Ti-6Al-4V. Procedia Struct. Integr. 2020, 28, 364–369. [Google Scholar] [CrossRef]
- Jones, R.; Huang, P.; Peng, D. Crack growth from naturally occurring material discontinuities under constant amplitude and operational loads. Int. J. Fatigue 2016, 91, 434–444. [Google Scholar] [CrossRef]
- Shamir, M.; Igwemezie, V.; Lotfian, S.; Asif, H.; Ganguly, S.; Mehmanparast, A.; Jones, R. Assessment of mechanical and fatigue crack growth properties of wire + arc additively manufactured mild steel components. Fatigue Fract. Eng. Mater. Struct. 2022, 45, 2978–2989. [Google Scholar] [CrossRef]
- Molent, L. Thoughts on Fatigue Certification of Metal Additive Manufacturing for Aircraft Structures, Keynote Lecture, EASA-FAA Industry-Regulator AM Event, Cologne, Germany, 2021. Available online: https://www.easa.europa.eu/presentations-2021-easa-faa-industry-regulator-am-event (accessed on 2 March 2023).
- Main, B.; Evans, R.; Walker, K.; Yu, X.; Molent, L. Lessons from a fatigue prediction challenge for an aircraft wing shear tie post. Int. J. Fatigue 2019, 123, 53. [Google Scholar] [CrossRef]
- Jones, R.; Peng, D. A Building Block Approach to Sustainment and Durability Assessment: Experiment and Analysis. In Reference Module in Materials Science and Materials Engineering, Elsevier Reference Collection, Comprehensive Structural Integrity, 2nd ed.; Elsevier: Amsterdam, The Netherlands, 2022; Available online: https://www.sciencedirect.com/science/article/pii/B9780128229446000360 (accessed on 2 March 2023).
- Masuda, K.; Oguma, N.; Ishihara, S.; McEvily, A.J. Investigation of subsurface fatigue crack growth behavior of D2 tool steel (JIS SKD11) based on a novel measurement method. Int. J. Fatigue 2020, 133, 105395. [Google Scholar] [CrossRef]
- Hall, A.M.; Slunder, C.J. The Metallurgy, Behavior, and Application of the 18-Percent Nickel Maraging Steels, NASA Special Publication NASA SP-5051. 1968. Available online: https://apps.dtic.mil/sti/pdfs/ADA382105.pdf (accessed on 19 February 2023).
- Pitt, S.; Jones, R.; Atluri, S.N. Further studies into interacting 3D cracks. Comput. Struct. 1999, 70, 583–597. [Google Scholar] [CrossRef]
- Atluri, S.N.; Park, J.H.; Punch, E.F.; O’Donohue, P.E.; Jones, R. Composite Repairs of Cracked Metallic Aircraft, Federal Aviation Administration, DOT/FAA/CT-92/32, May 1993. Available online: https://www.tc.faa.gov/its/worldpac/techrpt/ct92-32.pdf (accessed on 2 March 2023).
- NASA-HDBK-5010, Fracture Control Handbook for Payloads, Experiments, and Similar Hardware, May 2005, Revalidated 2012. Available online: https://standards.nasa.gov/standard/nasa/nasa-hdbk-5010 (accessed on 2 March 2023).
- Peng, D.; Jones, R.; Ang, A.S.M.; Michelson, A.; Champagne, V.; Birt, A. Further thoughts on EIDS and the durability analysis of WAAM 18Ni 250 steel with rough surfaces. Fatigue Fract. Eng. Mater. Struct. 2022. [Google Scholar] [CrossRef]
- Elber, W. Fatigue crack cyclic closure tension under cyclic tension. Eng. Fract. Mech. 1970, 2, 37–45. [Google Scholar]
- Elber, W. The Significance of Crack Closure. ASTM STP 486; ASTM: West Conshohocken, PA, USA, 1971; pp. 230–242. [Google Scholar] [CrossRef]


Disclaimer/Publisher’s Note: The statements, opinions and data contained in all publications are solely those of the individual author(s) and contributor(s) and not of MDPI and/or the editor(s). MDPI and/or the editor(s) disclaim responsibility for any injury to people or property resulting from any ideas, methods, instructions or products referred to in the content. |
© 2023 by the authors. Licensee MDPI, Basel, Switzerland. This article is an open access article distributed under the terms and conditions of the Creative Commons Attribution (CC BY) license (https://creativecommons.org/licenses/by/4.0/).