Abstract
Iron-based materials, especially magnetite nanocrystals, have found extensive applications in many fields. Novel challenges focus on a deeper understanding of interactions between magnetite and biological macromolecules for developing further applications in diagnostic and treatment methods in medicine. Inspired by ferritin, the iron storage protein occurring in bacteria, plant, animal, and human cells, we developed an artificial ferritin-like material known as magnetoferritin. We present structural studies of magnetoferritin samples prepared using a controlled in vitro physicochemical synthesis. Considerable structural and size changes were observed by increasing the iron content and post-synthesis treatment. We propose the modulation of colloidal stability by using suitable solvents. Ultraviolet and visible spectroscopy, dynamic light scattering, colloidal stability measurements, infrared spectroscopy, and small-angle X-ray scattering methods were employed. The presented results aid in increasing the effectiveness of the various applications of magnetoferritin according to specific industrial requirements.
1. Introduction
The self-arrangement of molecules resulting in increasing complexity is one of the properties of life. Laboratory conditions allow for small molecular components to be organized into higher structures in specific constrained environments or mediums. For life organization, two basic mathematical paradoxes are known:
- (a)
- The time paradox: a few moments lead to rapidly “finding” the right combinations for molecular binding to form functional biological structures, while on the other hand, computational search requires high energy or is time-consuming;
- (b)
- The geometric paradox: the mathematical counting of large length/surface of DNA molecule versus DNA folding into living cell nuclei with a few µm size.
Here, statistical methods fail, and similar mathematical approaches lead to the conclusion of improbability or almost impossibility of life formation. The new mathematical concept for life sciences needs calculations, including time, quantum physics, gravity versus Brown motion, flow and diffusion, molecular collision and fusion, tunneling phenomena, barriers and membrane properties, temperature, molecular chemical composition, size, shape, morphology, design, form, geometry, concentration, medium property and composition or density [1,2].
The model object, apoferritin, was chosen as a known and well-described material to clarify the structural arrangements of the components (subunits) dependent on the environment [3]. Apoferritin can store free iron from the surrounding medium to form ferritin metalloprotein with a size up to 12 nm. Ferritin functions include protecting cells against free radical production and iron release for various purposes according to changes in the medium [4]. Ferritin’s structure and function vary depending on the ratio of H (heavy) and L (light) protein chains, leading to specific roles in specific organs. For example, brain ferritin structure demands higher oxygen consumption; liver ferritin provides catalysis for xenobiotic transformation; heart ferritin needs regular rhythms and easy iron entry and release; placental ferritin provides energy storage; and muscular ferritin needs rapid iron output for muscle growth and formation [5]. The significant advantage of this model’s material selection is the quasi-spheroidal shape suitable for mathematical simulation and theory formulations [6]. The modern trend of the last few decades is searching for magnetite (Fe3O4)-based materials, which should simultaneously meet high stability and biocompatibility for biomedical applications [7,8]. The greatest challenge is overcoming the two common problems during such material preparation:
- (1)
- Experiments aimed at maintaining material biocompatibility led to Fe-based minerals formation with lower magnetization and low crystalline or almost amorphous state;
- (2)
- Experiments focused on increasing particle stability in (bio)ferrofluids led to a decrease in biocompatibility (partial or total destruction of the biocomponents).
Material types generated using the first approach can be suitable for magnetic resonance imaging as standards for the diagnosis of neurodegenerative disorders [9]. Material properties can be predetermined according to the technological setup of medium/aqueous environment modifications. Parameters such as the iron amount, pH value, or synthesis temperature can significantly change the activity of the prepared materials. The development of colloids with homogenously dispersed particles reason is an obviation of aggregate formation and protein flocculation. The main task is side effects elimination, such as protein activity loss, immunological reaction, or blood clogging with aggregates [10,11].
The second approach is more suitable for medical or pharmaceutical use, for which the minimalization of particle size and elimination of toxic effects of (bio)ferrofluid are the main aims in cancer cell imaging or targeted anticancer drug delivery [12,13,14]. However, the consequence of the second process is protein unfolding, its partial decomposition or destruction [10,11]. Oxidation conditions or decreases in concentration drive the electron transfer to achieve equilibrium in the direction of the electrochemical gradient between the protein cavity and surroundings [15,16]. The latest study suggests various harmful substances reduction owing to the electron transfer [17]. The redox reactions of iron in an aqueous environment lead to green technology development, following natural iron cycles. Artificial ferritin-like materials offer potential application possibilities in environmentalism as decontamination agents, biosensors, catalysts in analytical chemistry, nanodevices, or nanocarriers for vaccine design [17,18,19,20,21,22,23]. Each material application requires the optimal technology process and apparatus design selection [5]. Commonly used laboratory conditions necessary for magnetite nanoparticle synthesis include high temperatures (above 50 °C) and alkaline pH > 8, based on the co-precipitation method with a precise ratio of Fe2+ and Fe3+ ions in an aqueous solution. Nevertheless, an investigation of the intermediate phase, formed during the reaction pathway, signifies the sensitivity of chemical composition, size distribution, and crystallinity of nanoparticles on the properties of the surrounding liquid medium. The setup of physicochemical conditions before, during, and after synthesis allows for the preparation of various bio-ferrofluids types:
- -
- Nano-crystallized Fe3O4 surrounded by apoferritin with a completely closed structure;
- -
- Nano-crystallized Fe3O4 surrounded by apoferritin with unfolded structure;
- -
- Nano-crystallized Fe3O4 surrounded by apoferritin with destroyed structure;
- -
- Other minerals such as γ-Fe2O3 or FeOOH surrounded by apoferritin with destroyed structure;
- -
- Aggregates and amorphous ferritin-like matter in two-phase system of precipitated solid in liquid.
Since the first synthesis of artificial ferritin (magnetoferritin), intensive studies continue to highlight the significance of this material in nanotechnology practice [24,25]. Specifically, post-synthesis modifications by drugs, surfactants, signal molecules, and antibodies expand its wide range of usability [5]. Efficiency, the possibility for magnetic separation, degradability, simplicity, and the rate of chemical preparation are the main advantages of similar Fe-based nanocrystals in liquid (ferrofluids) [26]. Some controversial discoveries support efforts to prove diverging hypotheses. The magnetite nanocrystal origin presented in healthy or dysfunctional tissues (neurodegenerative or cancer) is not fully understood yet. A temperature above 65 °C and strongly alkaline pH, necessary for magnetite mineralization, cannot be achieved in living tissues [27]. The expected precursor may be an iron ferritin core composed of ferrihydrite-like minerals combined with an iron-overloading effect with the help of various additives [28]. The role of magnetite in human tissues can be associated with catalytic, signal, memory, or communication roles [29].
In this work, in vitro-prepared magneto ferritin samples were studied using different methods. Synchrotron radiation allowed for the study of magnetoferritin particles in the liquid phase. The particle sizes were analyzed using small-angle X-ray scattering (SAXS) data. Standard physicochemical methods, including ultraviolet–visible spectroscopy, dynamic light scattering, and zeta-potential measurements, complemented our interpretations. The results show variations in protein arrangement that are dependent on the synthesis technology process, leading to the formation of various Fe-based minerals crystallization [30,31]. Specifically, the inorganic part of materials directly affects protein structure. The preparation procedure determines the final material’s properties and function. By revealing the effect of different conditions on the properties of magnetoferritin, it becomes possible to choose specifically designed laboratory procedures for specific bio-ferrofluid applications.
2. Materials and Methods
2.1. Chemicals
Ammonium ferrous sulfate hexahydrate (Mohr’s salt), (NH4)2Fe(SO4)2.6H2O; equine spleen apoferritin A3641-1G (c = 47 mg/mL); ethanol, C2H6O; horse spleen ferritin F4503-1G (c = 44 mg/mL); hydrogen peroxide, H2O2; N-(1,1-dimethyl-2-hydroxyethyl)-3-amino-2-hydroxypropanesulfonic acid, AMPSO; sodium hydroxide, NaOH; sodium chloride, NaCl; and trimethylamine N-oxide, (CH2)3NO were obtained from SIGMA-Aldrich (Saint-Louis, Missouri, USA), Coomassie brilliant blue from Fluka; hydrochloric acid, HCl from ITES; potassium thiocyanate, KSCN from Slavus; and phosphoric acid, H3PO4 from Centralchem. For inert atmosphere simulation, nitrogen gas was used, and all solutions were prepared using deionized water and heavy water, D2O, respectively.
2.2. Sample Preparation
First, apoferritin solution, dispersed in 0.05 AMPSO buffer, was adjusted using a 2 M NaOH solution to a final pH value of 8.6 and heated to 60–70 °C. Reactants (0.1 M Mohr’s salt and 0.07 M (CH2)3NO) were added into the reaction mixture in a stoichiometric ratio 3:2 ten times for 100 min using syringes while maintaining constant temperature and stirring on a magnetic stirrer with heating IKA C-MAG HS 7. The oxygen presence in deionised water was substituted using N2 for ~1 h saturation to achieve anaerobic aqueous conditions. Reaction bottles were hermetically enclosed and thus prepared solutions protected against oxygen entry. Various concentrations of ferrous ions were added into the magnetoferritin (MFer) reaction, thus allowing for the preparation of samples with different loading factors (LF: the average number of iron atoms per one apoferritin biomacromolecule). To obtain powders, an IlshinEurope TFD5503 freeze-dryer was used after freezing samples at 20 °C for about 8 h. Freeze-drying was performed in vacuum and temperatures below −55 °C for about 24 h.
2.3. Quantitative Ultraviolet and Visible Spectroscopic Analysis of Loading Factors
LF levels were determined using the quantitative method on a UV–VIS spectrophotometer SPECORD 40 (Analytik Jena, Jena, Germany) at 25 °C with a precision of about 1%. First, the sample reacted with 3% H2O2 in an acid medium of 35% concentrated HCl at 50 °C for 30 min. The oxidized Fe3+ ions in the presence of 1M KSCN formed the red thiocyanate complex of Fe[Fe(SCN)6] measured at the light wavelength of 450 nm. The regression equation from the linear calibration curve allowed us to calculate the iron mass concentration. The mass concentration of native apoferritin (NA), cNA, was obtained using the standard Bradford method. The absorbance of the blue-colored complex of Bradford agent with protein residues was best visible at the light wavelength of 595 nm after 5 min of incubation at 25 °C. From the calculated ratio of cFe a cNA using a molecular weight of native apoferritin (MNA ~ 481,200 Da) and iron (AFe ~ 55.845 Da), the LF of MFer was calculated. The synthesis of uncoated magnetite particles (MPs) allowed us to perform comparable studies. Apoferritin solution replaced the same volume of 0.15 mol/L sodium chloride (NaCl) solution under analogous conditions as MFer synthesis with LF ~ 500.
NFe = cFe * 6.022 * 1023/AFe
NNA = cNA * 6.022 * 1023/MNA
NEXPERIMENTAL = NFe/NNA
NEXPERIMENTAL = LF = cFe * 481,200 (Sigma data A3641-1G)/cNA * 55.845
2.4. Measurement of Dynamic Light Scattering on Magnetoferritin Nanoparticles
The hydrodynamic diameter of MFer colloidal solution was measured with Zetasizer NanoZS 3600 (Malvern Instruments, Malvern, UK), using dynamic (quasi-elastic) light scattering (DLS). This method allowed for the analysis of the intensity fluctuations of scattered light from MFer particles in solution, which perform Brownian motion. The diffusion rate of MFer in the liquid medium is related to size. The average hydrodynamic diameter <DHYDR> was measured in triplicate using disposable polystyrene cuvettes in the protein data analysis mode at 25 °C. The hydrodynamic diameter was displayed in the Zetasizer software 7.11 as the maximum of the distribution curve, plotted as the percentage of particle number according to their hydrodynamic size.
2.5. Colloidal Stability and Total Charge Determination
Zeta potential was investigated using laser Doppler velocimetry combined with electrophoresis on Zetasizer NanoZS 3600 (Malvern Instruments, Malvern, UK) at 25 °C. Zeta potential, ζ, the parameter of colloidal stability, generates between the shear (slipping) plane of the solid particle in a conducting liquid and the bulk of the liquid. After the application of the electrical field, the particle moves in a liquid medium. Electrophoretic mobility, depending on the strength of the electric field or voltage gradient, is related to ζ and medium viscosity. Zeta potential is a parameter of colloidal stability that varies according to electrolyte concentration and pH change. Colloidal stability measurements were performed within one minute after the filling of folded capillary cells in the auto mode of the data analysis.
2.6. Infrared Spectroscopy
Interaction between infrared radiation and sample allows for the study of vibrational states within molecules. The presence of carbon covalent bonds inside the apoferritin structure affected by iron loading was assessed via the infrared spectroscopy method using a VERTEX 80 v vacuum Fourier transform infrared (FT-IR) spectrometer (Bruker Corporation, Billerica, Massachusetts, USA). The aqueous samples, placed on a ZnSe holder, were measured after drying.
2.7. Small-Angle X-Ray Scattering
SAXS experiments were carried out at the P12 BioSAXS beamline of the European Molecular Biology Laboratory (EMBL) and the storage ring PETRA III of the Deutsches Elektronen Synchrotron (DESY, Hamburg, Germany) at 20 °C with synchrotron radiation wavelength of 0.1 nm and q-range of 0.11–4.4 nm−1 [32]. Experimental data were normalized to the transmitted beam intensity. The background scattering of the aqueous buffer was subtracted from the measured data.
3. Results
3.1. Sample Profiles
We first examined the physicochemical properties of the prepared MFer samples (MFer01-MFer07). Table 1 summarizes the mass concentration of the protein, LF, hydrodynamic diameter (<DHYDR>), and colloidal stability (ζ—zeta potential). Specifically, the technological setup of the synthesis (temperature, solution pH, and freeze-drying process) and LF (Fe2+ solution amount) contributed to all measured parameter variations. Zeta potential confirmed good colloidal stability and negative surface charge of particles in colloidal solution with pH of >7 due to the dominant hydrophilic negatively charged amino-acid residues on the MFer surface. Particles with values around −30 mV pointed to a good protein solubility in water, necessary for bio-applications. Zeta potentials, related to aqueous medium viscosity, were affected by protein concentration, pH, or LF change. MFer particles were mutually repulsive and moved towards the positive electrode during the measurement. The low zeta potential of the ferritin (Fer) sample, diluted in 0.15 M NaCl solvent, was –19.5 mV. In contrast, the zeta potential of Apof and MFer samples, diluted in 0.05 M AMPSO buffer with pH 8.6, achieved higher values.

Table 1.
Summary of the basic physicochemical characterization of studied samples.
The MFer01 sample’s post-synthesis modification included the freeze-drying process to obtain the powder, followed by its dilution in H2O before zeta-potential measurement. Lyophilization led to the determination of the lowest colloidal stability of the MFer01 sample (Table 1). The negative total charge should provide stability thanks to electrostatic repulsion between the particles. Nevertheless, the low absolute value of ζ (mV) may suggest MFer particle agglomeration. Such MFer samples tend to time-dependent sedimentation due to the differences in the particle and carrier liquid mass densities.
The DLS method, used for particle size determination, represented a complementary method to SAXS for detailed structural interpretations. The first DLS output indicated size changes and magneto ferritin polydispersity. The hydrodynamic MFer size is defined by the same hydrodynamic friction as an ideal solid sphere would exhibit. It was not possible to extract structural information about objects’ shapes. The size distribution may signify the particle population with (a) non-globular, elongated, irregular shapes or (b) agglomerate arrangements. DLS measurements pointed to the polydispersity of samples containing agglomerates, while the small hydrodynamic diameter showed the presence of monodisperse particles (Table 1). The size distribution curves, displayed with maximum peaks between 11 and 75 nm for the samples, were plotted as the relative particle population (% of particle number) versus diameter (Figure 1).
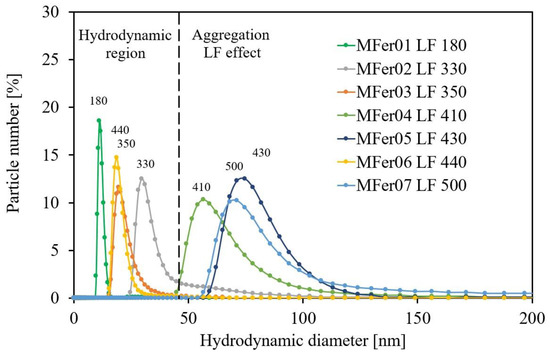
Figure 1.
Hydrodynamic size distribution curves for MFer01–MFer07 samples. All protein samples were diluted in AMSPO buffer 1:10 for DLS measurements.
The <DHYDR> growth for MFer04, MFer05, and MFer07 led to the conclusion that the LF ~ 400 can be a limit above which the structure of MFer becomes strongly affected by LF. On the other hand, the “hydrodynamic region” between 0 and 50 nm can be more influenced by liquid characteristics, such as concentration, solvent type, or pH. Moreover, hydrodynamic size depends on the ionic double-layer thickness around the particle, particle concentration, type, and viscosity of the solvent, as Figure 2a,b illustrates. While the iron loading caused larger <DHYDR> for MFer07, the large <DHYDR> of MFer04 and MFer05 prepared at increased synthesis temperature up to 69 °C (near the protein denaturation point) was the result of the thermal decomposition of the protein, as we have shown previously [31]. However, the high synthesis temperature increases the preference for Fe3O4 nanocrystal mineralization, necessarily accompanied by protein unfolding [30,31].
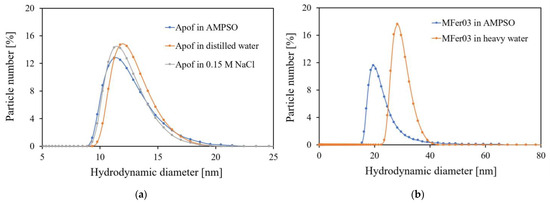
Figure 2.
Comparison of hydrodynamic size distributions: (a) 0.24 mg/mL apoferritin solutions with <DHYDR> of 11.22 nm for apoferritin diluted in 0.05 M AMPSO buffer with pH 8.6, 12.3 nm for apoferritin in distilled water, and 11.8 nm for 0.15 M NaCl apoferritin dispersion; (b) 0.1 mg/mL MFer03 solutions with <DHYDR> of 19.5 nm diluted in 0.05 M AMPSO buffer with pH 8.6 and 28.3 nm for MFer03 diluted in heavy water for comparison.
Each modern scattering method requires liquid sample adjustment. While during small-angle X-ray scattering (SAXS) measurements, photons are scattered by electron shells (electrons), the small-angle neutron scattering method allows for structural studies using neutron scattering on atomic nuclei. Despite the same mathematical principle to describe the SAXS and SANS mechanism, scattering differences enable information about additional neutron scattering length densities and contrasts. Delicate structural information can be obtained thanks to hydrogen substitution by their heavier isotope, deuterium, in the aqueous solvent. DLS measurements of MFer03 in AMPSO buffer (H isotope) and MFer powder dissolved in D2O could be the first indicator of changes in the size or structure of the MFer object shown in Figure 2b. Here, the percentage ratio of larger-sized MFer03 particles in D2O increased <DHYDR>. The freeze-drying process, used as a post-synthesis treatment, led to agglomerate formation after MFer03 powder dissolution in D2O. In this case, additional sample treatment is necessary for achieving homogeneity (e.g., ultrasonic waves).
3.2. Structural Variations Affected by Synthesis Technology
UV–Vis spectroscopy shows a hyperchromic shift at λMAX 280 nm absorption spectrum of a representative MFer06 sample synthesized in standard conditions (TSYNTHESIS 60–69 °C, pH 8.6) compared with pure apoferritin (Figure 3).
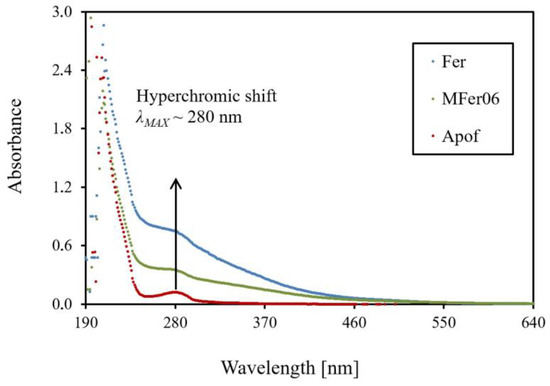
Figure 3.
Ultraviolet–visible absorption spectrum scans in the wavelength range of 190–700 nm for ferritin, MFer06, and apoferritin diluted to 0.1 mg/mL protein concentration.
The hyperchromic shift for pure proteins without metal presence could mean protein concentration decreasing caused by induced protein destruction/ decomposition/ unfolding. On the other hand, the highest vertical shift for ferritin with the same protein concentration of 0.1 mg/mL as MFer06 and apoferritin shows more likely the absorption growth effect due to iron binding. Providing the ferritin globular structure is maintained, besides the ultraviolet light absorption, the light scattering on metallic nanocrystals in the Fer and MFer06 (bio)ferrofluid, depending on the LF, could occur. In our previous works, MFer protein structure destroying was observed and calculated from small-angle scattering data as the effect of LF, pH and temperature [30,31].
Figure 4 illustrates infrared absorption spectra in regions between 4000 and 500 cm−1. The IR measurements of pure magnetic nanoparticles (MPs) prepared as comparable material in buffer without protein presence, ferritin apoferritin, MFer02, and MFer07 solutions showed two characteristic regions sensitive to concrete sample property. The “function group” region (4000–1500 cm−1) could signify changes in the protein concentration/solution pH. The “fingerprint” region (1500–600 cm−1) is typical for metal IR bands. This LF-dependent region could identify unknown MFer or Fer samples compared with the Apof standard. IR spectroscopy has a high potential for the development of quantification analysis methods when maintaining the same buffer, pH, and protein concentration in ferritin-like (bio)ferrofluids. A complementary method to the magnetic resonance imaging of cancer or neurodegenerative tissues could help better specify Fe lesions. The rapid measurement of IR with C-Fe bond quantification would contribute to the native ferritins and magnetite recognition after standardization and calibration processes.
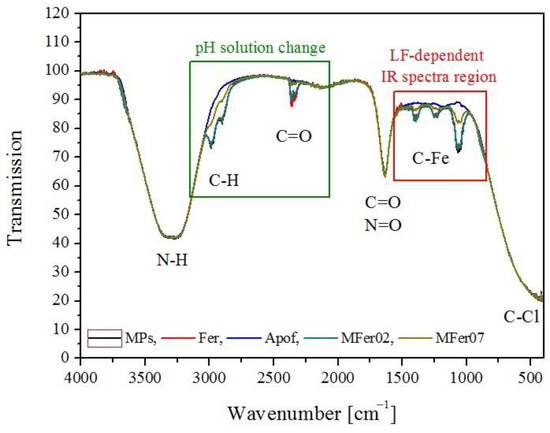
Figure 4.
Comparison of infrared spectra for pure magnetic particles (MPs), ferritin (Fer), apoferritin (Apof), MFer02, and MFer07.
The mathematical principle of hydrodynamic size calculation based on the Stokes–Einstein equation assumes a spherical particle shape. In the case of elongated objects, such as unfolded proteins and protein chains, the <DHYDR> parameter increases. In contrast to DLS, the small-angle X-ray scattering on MFer particles allows for the observation of shape differences between native Apof, Fer, and MFer derivates. The structural and size polydispersity of MFer samples, containing monodisperse, polydisperse, and disassembled structures, was indirectly confirmed through Fourier transformation of scattering intensities to obtain the pair distance distribution (PDD) functions p(r) using the GNOM program. Table 2 summarizes the results of the data analysis. The radius of gyration (Rg), maximum diameter (Dmax), and the forward scattering intensity (I0) point to the presence of MFer agglomerates in solutions. The same Dmax values of Fer and MFer samples indicate partial protein shell destruction. The information on the shape characteristics obtained from the PDD data analysis includes the average value of all objects. The calculated radius of gyration for MFer samples is larger than the pure apoferritin shell and could point to intact, destroyed or agglomerated particles in the solution.
Table 2.
Summary of fitting parameters for p(r) construction.
Figure 5 presents PDD function comparisons for Apof, Fer, MFer03, MFer04, and MFer05. The MFer04 sample tends to copy the asymmetrical shape of the p(r) function for native Fer. Nevertheless, according to Table 1, its hydrodynamic size is about three times larger than that of Fer. These findings may point to the structural similarity with Fer, while the presence of aggregates in the MFer04 sample is not excluded (see Figure 1). The marked difference in PDD shapes of MFer04 compared with MFer03 and MFer05 may be the consequence of the post-synthesis ultrasonic treatment of the MFer04 sample. Various acoustic frequencies are commonly used in medicine for diagnosis by elastic wave reflections from body objects, purification through rapid impulses of the liquid, where vibrant solvent molecules collide with purified particles/material in a solvent, or agglomerate decomposition. The ultrasonication process dispersed agglomerates, increasing particle distance for MFer04.
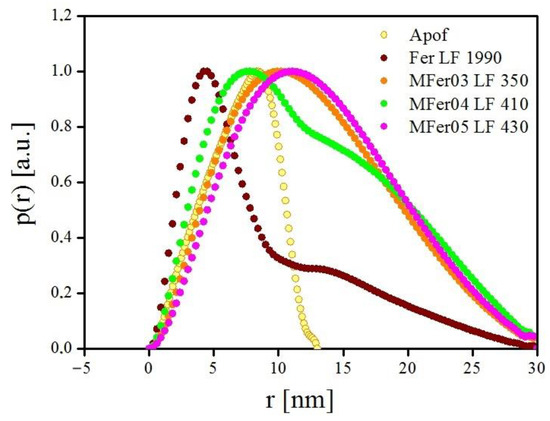
Figure 5.
PDD graphs of apoferritin (Apof), ferritin with LF 1990 (Fer), magnetoferritin with LF 350 (MFer31), 410 (MFer04) and 430 (MFer 05).
Table 3 summarizes the main results of monitoring the long-term physicochemical behavior of the MFer samples. The modifications during the synthesis technology process and post-synthesis treatments indicate the flexibility of the physical parameters that responded to the MFer liquid system’s hydrodynamic changes, especially in terms of mass and nanocrystal type, including solvent viscosity modulated by ionic variations. This study suggests ultrasonic wave application for increasing the distance between MFer agglomerates. The ability to destroy electrostatic, magnetic, or protein–protein attraction could contribute to a homogeneous sample state and preparation for the subsequent adjustments and various MFer particle surface coverages for medical practice.
Table 3.
The overview of monitored properties (parameters) using different methods with specific results after sample synthesis and post-synthesis modulation (freeze-drying process; changes in temperature, pH, or reagent concentration during synthesis; dilution; powder dissolutions; solvents substitution; and ultrasonic waves application).
4. Discussion
The study of nanocrystalline materials in a liquid state requires the selection of suitable experimental methods. Particles in a solution perform a random motion. After exceeding a specific size limit, mass, and repulsion, particles tend to succumb to the force of gravity and settle. Therefore, the physics of condensed matter must necessarily combine the physics of solids and pure liquids. Modifying lab processes can customize (bio)ferrofluids for practical use. A huge challenge and a modern trend is controlling the sensitivity of the protein biocomponent to maintain its stability under specific environmental conditions. At the same time, regulation is necessary for the high catalytic activity of the inorganic iron-containing component.
The DLS results allow for the study of MFer size transitions through hydrodynamic dimensional regions based on synthesis or environmental conditions. The size point of MFer particles, which starts the transition of random movement to LF-dependent movement, and, respectively, the phase transition of MFer dimension, which initiates falling to gravitational action, were graphically denoted. Graphical division was probably affected by surrounding medium characteristics. If we had a pure medium - for instance, deionized water and MFer particles scattered in it - this transition interface would be highly influenced by the size, shape, chemical composition, and weight of the MFer particles, as well as the steric effect in water, which structural changes and transitions strongly depend on temperature. The solidified liquid containing such particles can prevent time-dependent sedimentation and create thin films and displays for bio-nanotechnology. The magnetic field applied on the magnetically sensitive MFer material can allow for the design of various patterns and thin films. Electric and magnetic field effects related to liquid crystal behavior are predominantly studied. However, thermal regulation (high sensitivity to cooling and heating of a specific medium) could be a suitable way of changing patterns in thin films and images designed under the magnetic/electric field influence [33]. IR data with LF-dependent region could help to identify the unknown amount of MFer or Fer particles in samples compared to the Apof standard. IR spectroscopy has a high potential for quantitative analysis when maintaining the same buffer type, pH, and protein concentration in ferritin-like (bio)ferrofluids. SAXS and DLS show an average size of the entire molecular population. Unlike DLS, SAXS provides more specific information about the molecular shape, polydispersity degree, and fractal dimensions and allows for 3D molecular modeling. A combination of spectroscopic methods can define the appropriate technological procedure for the determination of the required MFer characteristics.
5. Conclusions
This work describes the effect of the physicochemical conditions of aqueous environment and preparation procedures on the size and protein structure of ferritin derivate, magnetoferritin. We investigated various post-synthesis adjustments, namely freeze-drying, ultrasonic wave, and different solvents. While the technological synthesis process mainly focuses on obtaining specific nanocrystal types via iron precursor mineralization during the formation of magnetoferritin, the solvent type and viscosity are more significantly associated with additional colloidal stability modulation. Our results indicate that the magnetoferritin sample structure, disrupted by extreme synthesis technological conditions (temperature or pH), may be restored through suitable adjustments to solvent viscosity. Different physicochemical synthesis conditions and post-synthesis modifications can lead to the preparation of the most effective material with specific requirements for applied research. Besides its potential practical use in biomedicine or nanotechnology, e.g., for diagnostic standards, biosensors, and biological display design, magneto ferritin proves promising in environmentally friendly applications, e.g., in decontamination methods, toxin analysis assays, or for development of nano-catalysis.
Author Contributions
Conceptualization and writing—original draft preparation, L.B.; methodology, formal analysis, investigation, L.B. and K.Z.; validation, K.Z.; resources, data curation, A.N. and O.T.; writing—review and editing, A.N., O.T., V.I.P., V.M.G. and L.A.; supervision, V.I.P., V.M.G., L.A., M.T. and P.K.; project administration, funding acquisition, N.T., M.T. and P.K. All authors have read and agreed to the published version of the manuscript.
Funding
This work was supported by the Slovak Research and Development Agency under the Contract no. APVV-22-0060. The APC was funded by Crystals journal management.
Data Availability Statement
Data sharing is not applicable.
Acknowledgments
The authors thank the Scientific Grant Agency of the Ministry of Education, Science, Research and Sport of the Slovak Republic and the Slovak Academy of Sciences (VEGA) No. 2/0071/24 and 2/0043/21.
Conflicts of Interest
The authors declare no conflict of interest.
References
- Gider, S.; Awschalom, D.D.; Douglas, T.; Mann, S.; Chaparala, M. Classical and quantum magnetic phenomena in natural and artificial ferritin proteins. Science 1995, 268, 77–80. [Google Scholar] [CrossRef]
- Divine, R.; Dang, H.V.; Ueda, G.; Fallas, J.A.; Vulovic, I.; Sheffler, W.; Saini, S.; Zhao, Y.T.; Raj, I.X.; Morawski, P.A.; et al. Designed proteins assemble antibodies into modular nanocages. Science 2021, 372, eabd9994. [Google Scholar] [CrossRef]
- Jurado, R.; Adamcik, J.; Sánchez-Ferrer, A.; Bolisetty, S.; Mezzenga, R.; Gálvez, N. Understanding the Formation of Apoferritin Amyloid Fibrils. Biomacromolecules 2021, 22, 2057–2066. [Google Scholar] [CrossRef]
- Lou, X.; Jingyi, L.; Wang, C.; Song, Y.; Zhu, L.; You, Y.; Zhang, J.; Hu, J.; Xu, X.; Xu, X.; et al. Self-oriented ferritin nanocages mitigate iron overload-induced oxidative stress for acute kidney injury. Chem. Eng. J. 2023, 466, 143227. [Google Scholar] [CrossRef]
- Mohanty, A.; Parida, A.; Raut, R.K.; Behera, R.K. Ferritin: A Promising Nanoreactor and Nanocarrier for Bionanotechnology. ACS Bio Med. Chem. Au 2022, 2, 258–281. [Google Scholar] [CrossRef]
- Tan, Y.; Tsang, P.K.H.; Dobrosavljević, V. Disorder-dominated quantum criticality in moiré bilayers. Nat. Commun. 2022, 13, 7469. [Google Scholar] [CrossRef]
- Novoselova, I.P.; Neusch, A.; Brand, J.S.; Otten, M.; Safari, M.R.; Bartels, N.; Karg, M.; Farle, M.; Wiedwald, U.; Monzel, C. Magnetic Nanoprobes for Spatio-Mechanical Manipulation in Single Cells. Nanomaterials 2021, 11, 2267. [Google Scholar] [CrossRef]
- Xu, H.; Li, S.; Liu, Y.S. Nanoparticles in the diagnosis and treatment of vascular aging and related diseases. Signal Transduct. Target. Ther. 2022, 7, 231. [Google Scholar] [CrossRef]
- Kumar, A.; Nandwana, V.; Ryoo, S.R.; Ravishankar, S.; Sharma, B.; Pervushin, K.; Dravid, V.P.; Lim, S. Magnetoferritin enhances T2 contrast in magnetic resonance imaging of macrophages. Mater. Sci. Eng. C Mater. Biol. Appl. 2021, 128, 112282. [Google Scholar] [CrossRef]
- Kim, M.; Rho, Y.; Jin, K.S.; Ahn, B.; Jung, S.; Kim, H.; Ree, M. pH-dependent structures of ferritin and apoferritin in solution: Disassembly and reassembly. Biomacromolecules 2011, 12, 1629. [Google Scholar] [CrossRef]
- Tomchuk, O.V.; Avdeev, M.V.; Aksenov, V.L.; Shulenina, A.V.; Ivankov, O.I.; Ryukhtin, V.; Vékás, L.; Bulavin, L.A. Temperature-dependent fractal structure of particle clusters in aqueous ferrofluids by small-angle scattering. Colloids Surf. A Physicochem. Eng. Asp. 2021, 613, 126090. [Google Scholar] [CrossRef]
- Pandrangi, S.L.; Chittineedi, P.; Chalumuri, S.S.; Meena, A.S.; Neira Mosquera, J.A.; Sánchez Llaguno, S.N.; Pamuru, R.R.; Mohiddin, G.J.; Mohammad, A. Role of Intracellular Iron in Switching Apoptosis to Ferroptosis to Target Therapy-Resistant Cancer Stem Cells. Molecules 2022, 27, 3011. [Google Scholar] [CrossRef] [PubMed]
- Xu, X.; Tian, K.; Lou, X.; Du, Y. Potential of Ferritin-Based Platforms for Tumor Immunotherapy. Molecules 2022, 27, 2716. [Google Scholar] [CrossRef] [PubMed]
- Zhang, W.; Taheri-Ledari, R.; Ganjali, F.; Afruzi, F.H.; Hajizadeh, Z.; Saeidirad, M.; Qazi, F.S.; Kashtiaray, A.; Sehat, S.S.; Hamblin, M.R.; et al. Nanoscale bioconjugates: A review of the structural attributes of drug-loaded nanocarrier conjugates for selective cancer therapy. Heliyon 2022, 8, e09577. [Google Scholar] [CrossRef]
- Gupta, N.K.; Pasula, R.R.; Karuppannan, S.K.; Ziyu, Z.; Tadich, A.; Wang, L.; Qi, D.; Bencok, P.; Lim, S.; Nijhuis, C.A.; et al. Switching of the mechanism of charge transport induced by phase transitions in tunnel junctions with large biomolecular cages. J. Mater. Chem. C 2021, 9, 10768–10776. [Google Scholar] [CrossRef]
- Singh, N.; Sherin, G.R.; Mugesh, G. Antioxidant and Prooxidant Nanozymes: From Cellular Redox Regulation to Next-Generation Therapeutics. Angew. Chem. Int. Ed. 2023, 135, e202301232. [Google Scholar] [CrossRef]
- Balejčíková, L.; Tomašovičová, N.; Zakuťanská, K.; Baťková, M.; Kováč, J.; Kopčanský, P. Dechlorination of 2,4,4′-trichlorobiphenyl by magnetoferritin with different loading factors. Chemosphere 2020, 260, 127629. [Google Scholar] [CrossRef]
- Šrédlová, K.; Cajthaml, T. Recent advances in PCB removal from historically contaminated environmental matrices. Chemosphere 2022, 287, 132096. [Google Scholar] [CrossRef]
- Munkholm, K.; Jacoby, A.S.; Vinberg, M.; Kessing, L.V. Ferritin as a potential disease marker in patients with bipolar disorder. J. Affect. Disord. 2023, 332, 247–253. [Google Scholar] [CrossRef]
- Reutovich, A.A.; Srivastava, A.K.; Arosio, P.; Bou-Abdallah, F. Ferritin nanocages as efficient nanocarriers and promising platforms for COVID-19 and other vaccines development. Biochim. Biophys. Acta Gen. Subj. 2023, 1867, 130288. [Google Scholar] [CrossRef]
- Guo, J.; Lyu, S.; Qi, Y.; Chen, X.; Yang, L.; Zhao, C.; Wang, H. Molecular evolution and gene expression of ferritin family involved in immune defense of lampreys. Dev. Comp. Immunol. 2023, 146, 104729. [Google Scholar] [CrossRef] [PubMed]
- Romero, G.; Park, J.; Koehler, F.; Pralle, A.; Anikeeva, P. Modulating cell signalling in vivo with magnetic nanotransducers. Nat. Rev. Methods Primers 2022, 2, 92. [Google Scholar] [CrossRef]
- Rosato, E.; Bonelli, M.; Locatelli, M.; de Grazia, U.; Tartaglia, A.; Savini, F.; D’Ovidio, C. Forensic Biochemical Markers to Evaluate the Agonal Period: A Literature Review. Molecules 2021, 26, 3259. [Google Scholar] [CrossRef] [PubMed]
- Aslan, T.N. Relaxivity properties of magnetoferritin: The iron loading effect. J. Biosci. Bioeng. 2022, 133, 474–480. [Google Scholar] [CrossRef]
- Yu, J.; Cao, C.; Fang, F.; Pan, Y. Enhanced Magnetic Hyperthermia of Magnetoferritin through Synthesis at Elevated Temperature. Int. J. Mol. Sci. 2022, 23, 4012. [Google Scholar] [CrossRef]
- Roman, A.-M.; Voiculescu, I.; Cimpoeşu, R.; Istrate, B.; Chelariu, R.; Cimpoeşu, N.; Zegan, G.; Panaghie, C.; Lohan, N.M.; Axinte, M.; et al. Microstructure, Shape Memory Effect, Chemical Composition and Corrosion Resistance Performance of Biodegradable FeMnSi-Al Alloy. Crystals 2023, 13, 109. [Google Scholar] [CrossRef]
- Kirschvink, J.L.; Kobayashi-Kirschvink, A.; Woodford, B.J. Magnetite biomineralization in the human brain. Proc. Natl. Acad. Sci. USA 1992, 89, 7683. [Google Scholar] [CrossRef]
- Tofanello, A.; Bronzato, J.D.; Rettori, C.; Nascimento, O.R.; Nantes-Cardoso, I.L. Conversion of ferritin ferrihydrite core to magnetite by gold ions binding and the derived nanoparticle formation. J. Nanostruct. Chem. 2022, 12, 401–416. [Google Scholar] [CrossRef]
- Bellinger, M.R.; Wei, J.; Hartmann, U.; Cadiou, H.; Winklhofer, M.; Banks, M.A. Conservation of magnetite biomineralization genes in all domains of life and implications for magnetic sensing. Proc. Natl. Acad. Sci. USA 2022, 119, e2108655119. [Google Scholar] [CrossRef]
- Balejčíková, L.; Saksl, K.; Kováč, J.; Martel, A.; Garamus, V.M.; Avdeev, M.V.; Petrenko, V.I.; Almásy, L.; Kopčanský, P. The Impact of Redox, Hydrolysis and Dehydration Chemistry on the Structural and Magnetic Properties of Magnetoferritin Prepared in Variable Thermal Conditions. Molecules 2021, 26, 6960. [Google Scholar] [CrossRef]
- Balejcíková, L.; Kovác, J.; Garamus, V.M.; Avdeev, M.V.; Petrenko, V.I.; Almásy, L.; Kopcanský, P. Influence of synthesis temperature on structural and magnetic properties of magnetoferritin. Mendeleev. Commun. 2019, 29, 279–281. [Google Scholar] [CrossRef]
- Blanchet, C.E.; Spilotros, A.; Schwemmer, F.; Graewert, M.A.; Kikhney, A.; Jeffries, C.M.; Franke, D.; Mark, D.; Zengerle, R.; Cipriani, F.; et al. Versatile Sample Environments and Automation for Biological Solution X-Ray Scattering Experiments at the P12 Beamline (PETRA III, DESY). J. Appl. Crystallogr. 2015, 48, 431–443. [Google Scholar] [CrossRef] [PubMed]
- Kopčanský, P.; Balejčíková, L.; Molčan, M.; Štrbák, O.; Šafárik, I.; Baldíková, E.; Procházková, J.; Angelová, R.; Zelená Pospiskova, K.; Rajňák, M.; et al. Magnetic Nanoparticles Change the Properties of Traditional Materials and Open up New Application Possibilities. In Material Aspects of Ferrofluids, 1st ed.; CRC Press: Boca Raton, FL, USA, 2023; pp. 214–250. ISBN 978-1-032-22798-6. [Google Scholar]
Disclaimer/Publisher’s Note: The statements, opinions and data contained in all publications are solely those of the individual author(s) and contributor(s) and not of MDPI and/or the editor(s). MDPI and/or the editor(s) disclaim responsibility for any injury to people or property resulting from any ideas, methods, instructions or products referred to in the content. |
© 2023 by the authors. Licensee MDPI, Basel, Switzerland. This article is an open access article distributed under the terms and conditions of the Creative Commons Attribution (CC BY) license (https://creativecommons.org/licenses/by/4.0/).