Article

A Luminescent MOF Based on Pyrimidine-4,6-dicarboxylate Ligand and Lead(II) with Unprecedented Topology

by
Laura Razquin-Bobillo
1,†,
Oier Pajuelo-Corral
1,†,
Andoni Zabala-Lekuona
1,
Iñigo Vitorica-Yrezabal
2,
Jose Angel García
3,
Jose M. Moreno
2,
Antonio Rodríguez-Diéguez
2 and
Javier Cepeda
1,*
1
Departamento de Química Aplicada, Facultad de Química, Universidad del País Vasco/Euskal Herriko Unibertsitatea (UPV/EHU), 20018 Donostia, Spain
2
Departamento de Química Inorgánica, Facultad de Ciencias, Universidad de Granada, 18071 Granada, Spain
3
Departamento de Física, Facultad de Ciencia y Tecnología, Universidad del País Vasco/Euskal Herriko Unibertsitatea (UPV/EHU), 48940 Leioa, Spain
*
Author to whom correspondence should be addressed.
These authors contributed equally to this work.
Crystals 2023, 13(10), 1490; https://doi.org/10.3390/cryst13101490
Submission received: 22 September 2023 / Revised: 3 October 2023 / Accepted: 9 October 2023 / Published: 13 October 2023

Abstract

:
In the present work, we report on a 3D MOF of {[Pb53-OH)(μ3-NO3)36-pmdc)3]·H2O}n formula (pmdc = pyrimidine-4,6-dicarboxylate) synthesized by an oven-heated, solvent-free procedure. The large connectivity afforded by the three ligands in their coordination to lead(II) ions grows cubic building units characterized by a central Pb atom with an unusual coordination index of 12 and 6 pmdc ligands occupying the faces. These cubic units are linked to one another giving rise to a quite condensed structure that represents an unprecedented topology showing the (4·62)6(43)2(45·610)3(45·68·82)6(46·69)6(612·83) point symbol. The crystalline material has been characterized by routine physico-chemical techniques to confirm its purity, and its thermal behaviour has been also studied by thermogravimetric and thermodiffractometric analyses. The solid presents a greenish blue photoluminescent emission based on pmdc ligands, as revealed by time-dependent density-functional theory (TDDFT) calculations, which is substantially more intense than in the free H2pmdc ligand according to its improved quantum yield. The emissive capacity of the material is further analysed according to decreasing temperature of the polycrystalline sample, finding that sizeable, long-lasting phosphorescence is present.

1. Introduction

During the last two decades, the preparation and characterization of metal–organic frameworks (MOFs) [1] has received an increasing attention because these materials possess outstanding microporosity consisting of specific surface areas higher than 7000 m2 g−1 but also pore volumes larger than 4 cm3 g−1 [2,3]. That structural feature is also accompanied by a wide topological diversity [4] that is not only capable for modulating the pore volume and size but also the surface functionalities according to the selection of the basic constituents of the framework: metal ions and organic ligands selection [5,6,7]. Nowadays, in spite of all the steps taken on structural prediction from the coordination characteristics between most of metal ions (mainly transition metal ions) and several chemical functions of ligands [8], controlling the final framework is still challenging, particularly for representative elements given their usually large coordination environments [9], a fact that prevents the simplification of the networks on the basis of nodes and spacers (foundations of reticular chemistry) [10,11,12]. In fact, synthetic efforts in designing novel coordination polymers have primarily focused on the use of s-, d-, or f-block metal ions [13,14,15,16], while less attention has been paid to p-block ions despite their significance in working fields such as electroluminescence, photovoltaic conversion, fluorescent sensors, and organic light-emitting diodes [17,18,19]. As a heavy p-block metal ion, lead(II) presents a large ion radius, flexible coordination environment, and variable stereochemical activity, which provides unique opportunities for achieving unusual architectures with uncommon properties [20,21].
On another level, the presence of both ligands and metal ions disposed in an ordered manner along the framework imbues these materials with other relevant properties such as magnetism [22,23,24], catalysis [25], electronics [26], spintronics [27], and photoluminescence (PL) [17,28]. In particular, luminescent coordination polymers (CPs) are currently an important branch of these sorts of compounds and are known to provide tunable emission derived from not only their framework but also their interplay with surrounding medium (solvents, guest molecules, and composites) [29]. As a consequence, the number of applications deriving from PL properties of MOFs has been multiplied in such a way that today it serves as a basis for many purposes, such as the chemical sensing of ions, biomolecules (including biomarkers and antibiotics), the pH of a solution, temperature, and pressure [30,31,32,33,34]. Focusing on the inherent luminescence arising from the framework, the emission may be derived from metal ions and/or organic ligands. Particularizing to the latter, ligand-centered emissions often originate from π-systems or charge transfer complexes formed between neighboring ligands in the excited state, so their presence plays an essential role in the PL properties. That emission capacity is often improved in CPs because the coordination affords rigidity to the ligand that reduces the vibrational motions leading to the quenching of PL. Moreover, the presence of metal ions lacking quenching derived from intraionic electronic transitions (such as d-d transitions occurring for most of transition elements) and/or heavy ions affording a spin–orbit coupling effect stabilizing excited states may also help in promoting PL in MOFs [35].
Based on the previous ideas and persuaded by our propose to crystallize coordination polymers and MOFs with interesting PL properties [34,36], in the present work we are describing the preparation and characterization of a new 3D MOF based on a pyrimidine-4,6-dicarboxylate (pmdc) ligand and lead(II). Such a combination can be considered as a logical step in view of our previous success of pmdc to give rise to luminescent compounds with zinc(II) and lanthanide(III) ions [37,38]. On the present case, we employ lead(II) with the aim of generating an unusual topological framework on the basis of its great coordination capacity to carboxylate groups and the premise suggesting that such a heavy ion might afford good PL properties to the material. A complete computational study is also performed to shed light on those properties.

2. Results and Discussion

2.1. Solvent-Free Synthetic Approach
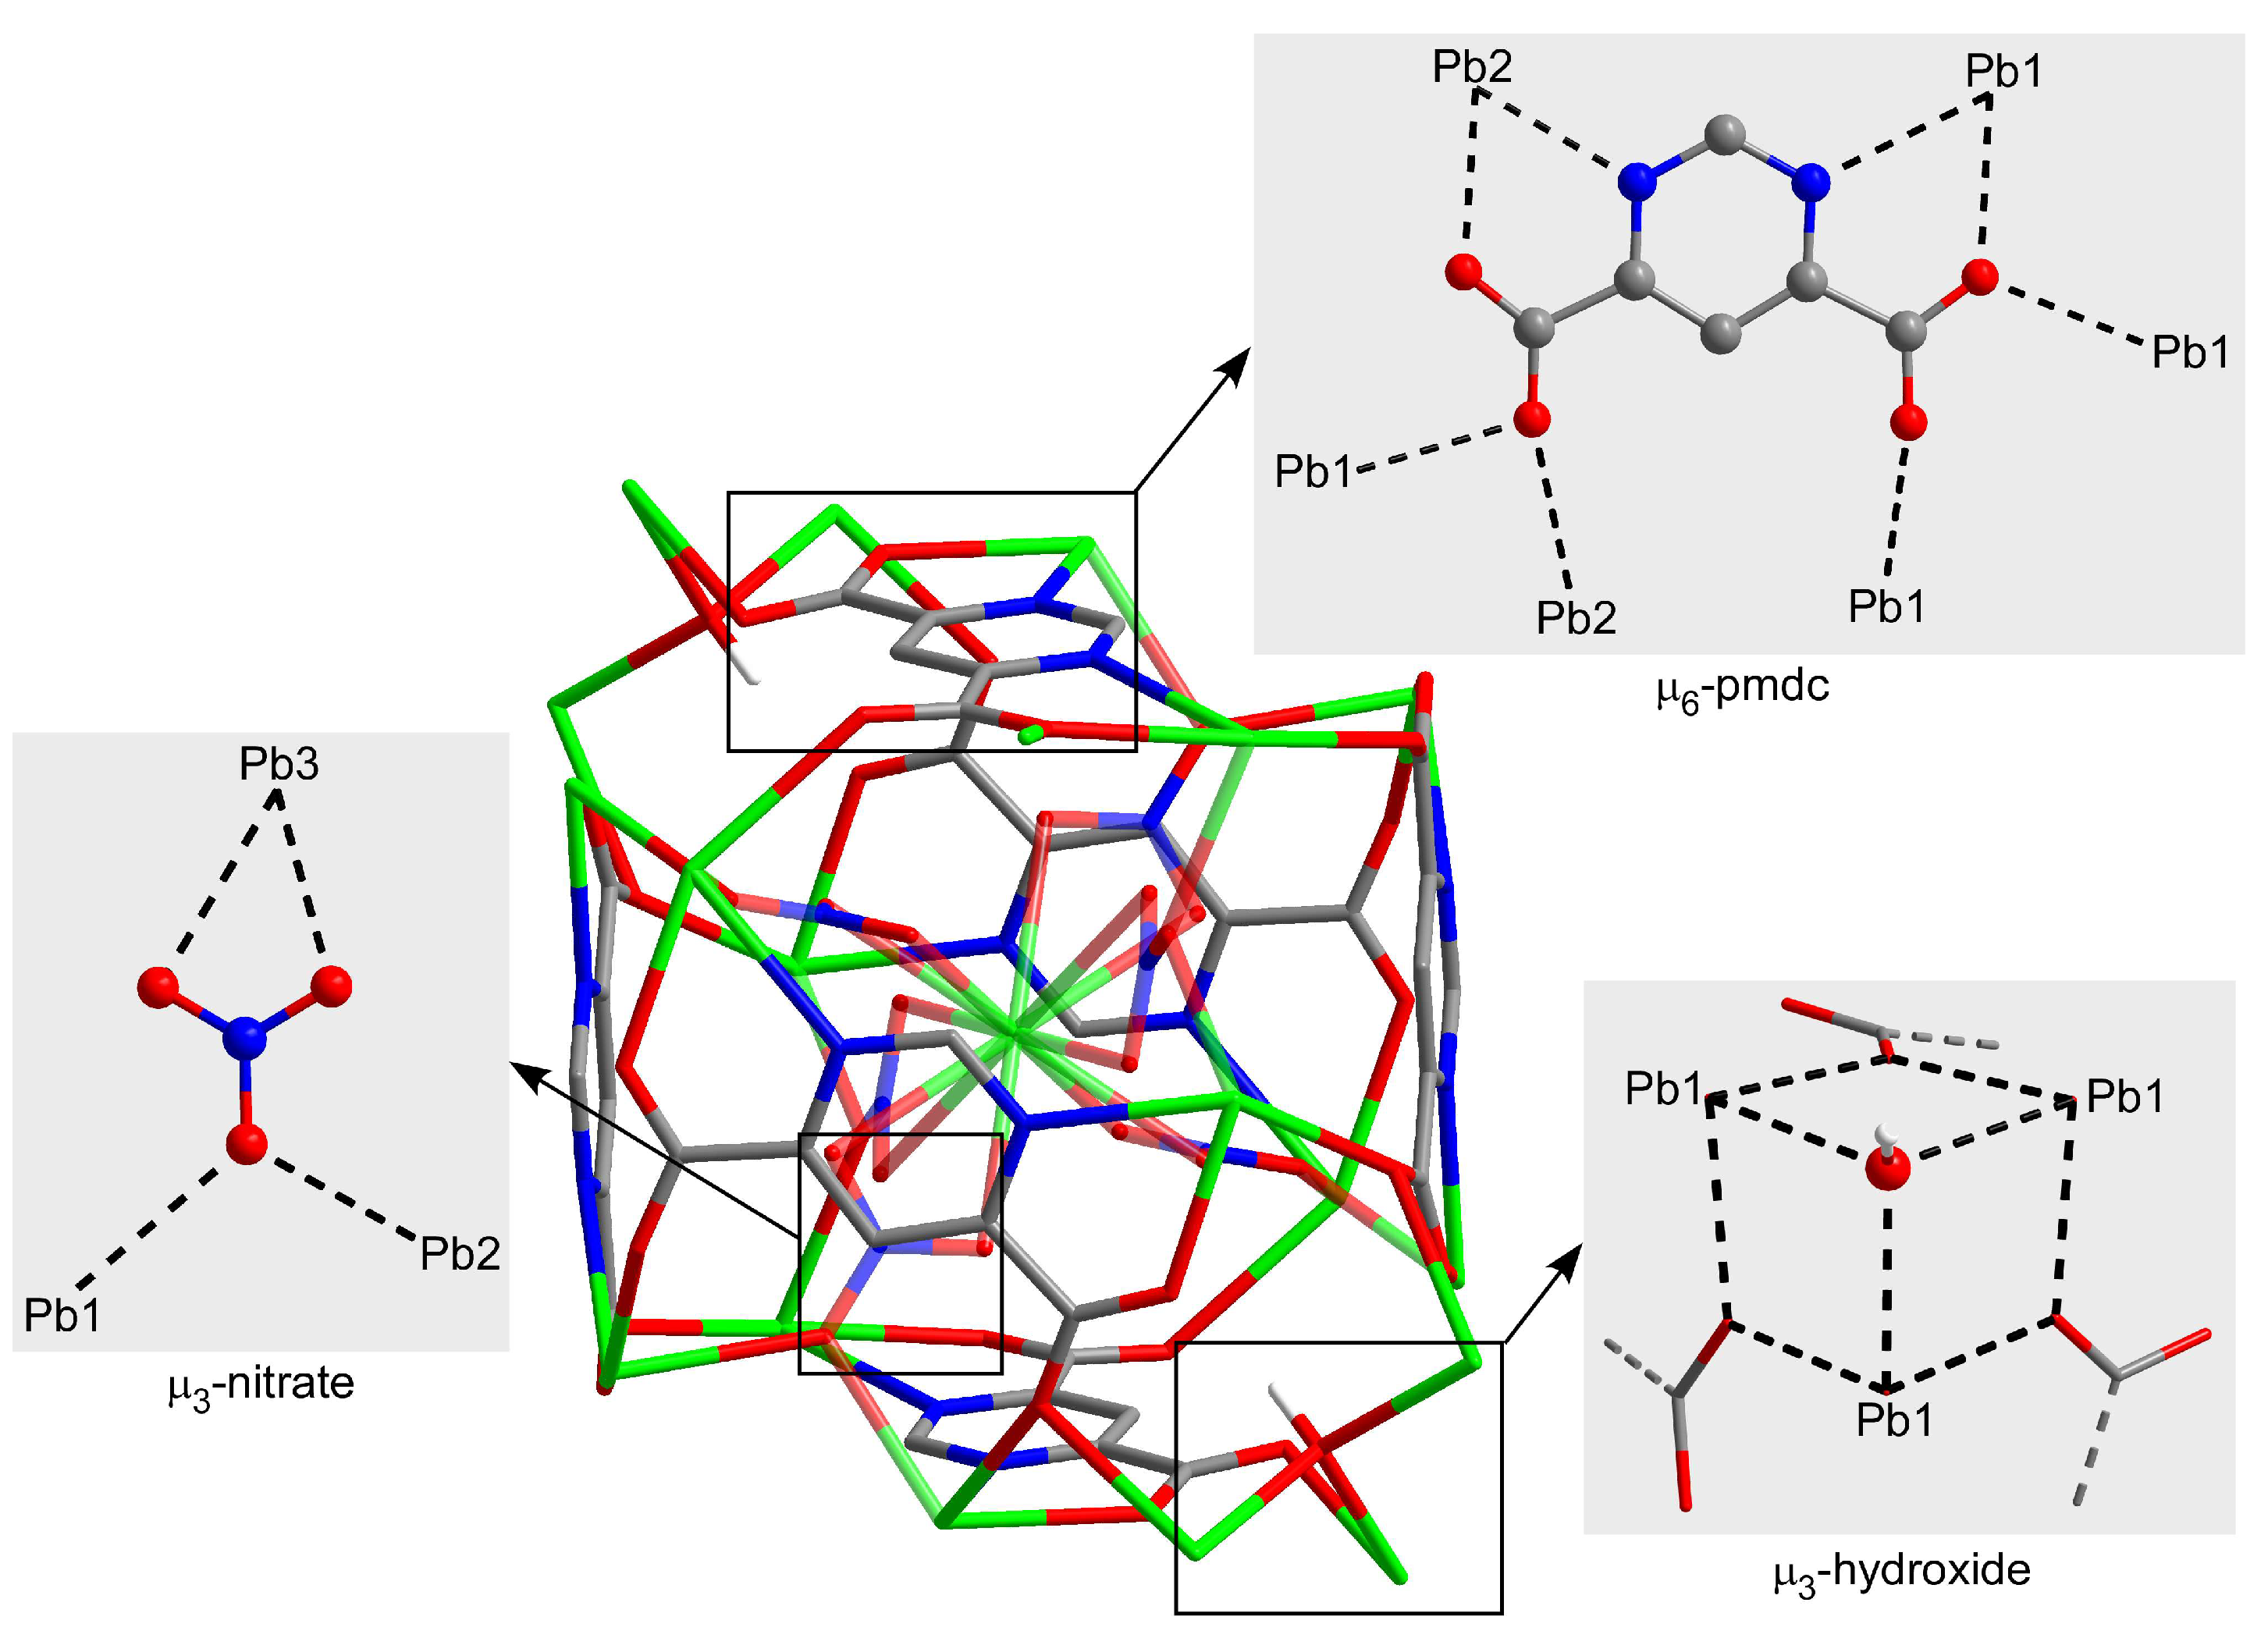
The present lead-based MOF has been obtained through a less habitual synthetic procedure, coined by us and others as solvent-free, which has been largely used in the preparation of organic molecules [39,40] but scarcely employed in the case of metal–organic compounds [41,42]. The solvent-free synthesis, which consists of the mechano-chemical mixture of the reagents followed by thermal treatment, has been widely considered as a procedure that respects the principles of “green chemistry”, and therefore it presents some important advantages over other procedures: (i) it does not require further purification steps by chromatography or recrystallization, (ii) it often saves reaction time because the reaction is completed more rapidly (sometimes in only few minutes), (iii) no specialized equipment is necessary and energy consumption is lower than other procedures (heating the solvent requires more energy), (iv) the reactions can be completed without a protection/deprotection sequences of a functional group, and (v) the reaction is easily scaled up to industrial scale and no big investments are required [43,44]. In particular, for the synthesis of metal–organic compounds, this alternative procedure to the main solvothermal method was successfully employed from 2012 on in the preparation of metal-azolate MOFs starting from metal oxide or hydroxides [45,46]. As observed in those works, the solvent-free procedure has been shown to render pure and crystalline materials in a very high yield, in such a way that it may be considered as a cheaper and less polluting approach compared to those conventional methods (evaporation or solvothermal methods) that require an organic (often pollutant) solvent. Furthermore, this method has also been considered as a promising way for the construction of composites since the lack of solvent enables a direct in situ growth of the MOFs onto another material matrix without further purification [47,48]. In particular, these sorts of procedures improve the processing of MOFs’ particles with other materials (due to their brittleness, insolubility, difficulty in molding, and low compatibility), all of which facilitates the fabrication of thin films and coatings, among other advanced materials, possessing large environmental applicability, such as their use as filters to capture pollutants. When we first employed this methodology, we observed that its success is mainly due exclusively to the reagents used, particularly with regard to their ease in forming a melt during the acid–base reaction taking place. As an example, diazole/triazole-like ligands are characterized by low melting points that favour the formation of melts in which metal oxides and hydroxides are reacted. The latter metal sources count on the advantage of consisting of anions that cannot remain in the mixture as impurities [49]. Accordingly, we focused on other reagents to reproduce the formation of the melt by selecting metal salts that are melted upon relatively low temperature to extend the use of the solvent-free procedure to ligands possessing high melting point such as pmdc [38]. For instance, the use of hygroscopic metal salts (often hydrated salts) in combination with organic carboxylic acids may lead, after being ground, sealed, and heated, to the complete mixture of the reagents and the presence of enough water resulting from the acid–base reaction to allow for the crystallization of a MOF. Moreover, some anions such as nitrates and acetates acknowledge the capacity to be decomposed during the heating process to avoid their presence in the final product [50].
On that basis, the synthesis followed in the present case has been carefully selected to meet all the previous key points. Lead(II) nitrate and pyrimidine-4,6-dicarboxylic acid are mixed in a mortar and, once smoothly hand-ground, the resulting mixture is placed into an airtight glass vessel that is oven-heated for 2 days at 150 °C to allow the crystallization of a MOF, while the nitric acid formed during the acid–base reaction is decomposed and released when the vessel is opened at room temperature.

2.2. Structural Description of {[Pb53-OH)(μ3-NO3)36-pmdc)3]·H2O}n (1)

Compound 1 crystallizes in the R 3 ¯ c space group and consists of a highly condensed 3D framework where the Pb(II) atoms are linked through μ6-pmdc ligands in addition to the μ3-hydroxide and μ3-nitrate anions. The asymmetric unit contains three different lead atoms, each one showing a different coordination environment. The Pb1 atom shows a heptacoordinated NO6Pb chromophore that best resembles a capped trigonal prism, though it is also close to a capped octahedron [S(ctpr) = 2.16/S(coc) = 2.87] according to the continuous shape measurements calculated with the SHAPE program [51]. The environment is formed by one chelating and three monodentate pmdc ligands, a nitrate anion, and the hydroxide anion. The Pb2 atom coordinates to two N,O-chelating pmdc ligands, two nitrate anions, and to two monodentate pmdc ligands with slightly larger bond distances (Table 1), thus rendering an octacoordinated polyhedron resembling a slightly distorted square antiprism [S(sapr) = 1.77]. The coordination sphere of the Pb3 atom, meanwhile, is fully occupied by twelve nitrate oxygen atoms leading to a distorted cuboctahedron [S(coc) = 1.83] (Figure 1). Despite the astonishing coordination environment with that high coordination number, it must be remarked that such a geometry has been previously reported for other lead(II)-based complexes [52,53,54] deposited in the CCDC [55], although this is the first example in which such a fragment pertains to an extended network of a MOF.
On its part, the crystallographically unique pmdc ligand exhibits a previously non-reported κ2N11,O1712N13,O181O171O172O182O182 coordination mode in which it is coordinated to six Pb centres. In detail, pmdc acts as a bridge between equivalent Pb1 and Pb2 atoms imposing Pb···Pb distances ranging from 4.04 to 7.22 Å depending on the ligand group involved (i.e., only the carboxylate group or the carboxylate and the pyrimidine ring). As a consequence of such a tangle of links, cubic building units are formed whose faces are occupied by the pmdc ligands and metal ions decorate the vertexes and edges. The Pb3 atom is placed in the centre of the cube linking the Pb1 and Pb2 atoms through the nitrato bridging ligands. It is also worth mentioning that Pb1 atoms exhibit a large mutual connectivity, being connected themselves by means of the hydroxide anion that dispose them in a triangular shape (Figure 2).
The cubic building units are self-assembled by sharing the edges in such a way that each one is surrounded by twelve units, giving rise to a highly condensed 3D framework that consists of a six-nodal network ((3-c)2(3-c)6(6-c)6(6-c)6(6-c)3(6-c) stoichiometry, taking into account that Pb1, Pb2, Pb3 and pmdc act as 6-c nodes and that nitrate and hydroxide act as 3-c nodes) possessing a (4.62)6(43)2(45.610)3(45.68.82)6(46.69)6(612.83) point symbol (Figure S3), which is a new topology that has been registered as jcr4 in the TOPOS database (Figure 3) [56].
The crystallization water molecules are occluded within isolated small voids that are generated in the framework between the pmdc ligands of two adjacent cubes, being highly disordered without any remarkable interaction with the 3D crystal building (Figure S4).

2.3. Thermal Behaviour

The thermogravimetric measurement was performed in a polycrystalline sample of compound 1 as an additional characterization to verify the chemical formula (Figure 4). Starting from room temperature, the compound does not exhibit any mass loss upon heating up to 100 °C despite the presence of a crystallization water molecule. However, the TG curve experiences a very slight decrease in the 150–300 °C range whose mass loss corresponds to a water molecule. Therefore, it can be confirmed that compound 1 possesses a complete lattice water molecule per formula unit (calc. 1.0, exp. 1.2% of mass loss), which finds it difficult to be released from the framework since it is occluded within the isolated pores. In the thermodiffractometric study conducted over samples from the same batch, it is observed that the compound preserves its crystal structure because the diffractograms are practically unchanged up to 210 °C. From this temperature on, the PXRD patterns show a significant shift of most of their maxima to higher 2θ angles, which is consistent with the gradual loss of the lattice molecules and subsequent compression of the framework. The loss of water, which presents a weak endothermic character in view of the DTA curve, is followed by the structural collapse in which the pmdc ligand and nitrate and hydroxide anions are decomposed. This step leads to PbO as the final residue of combustion (cald. 36.4, exp. 37.0% of mass remained in the experiment) above 400 °C after two successive exothermic processes.
The dehydrated amorphous compound obtained at ca. 300 °C cannot revert back into the pristine material, neither by gas diffusion nor by water soaking procedures. To end up with the thermal characterization in the first one, the anhydrous powder was placed into a closed vessel containing an isolated open vessel of water, in such a way that a water-saturated atmosphere is generated. In the second one, the product is soaked in water for 6 h and filtered. Amorphous products were obtained in both experiments, confirming the irreversibility of the thermal dehydration, which is in agreement with the possible structural collapse occurring to the compound.

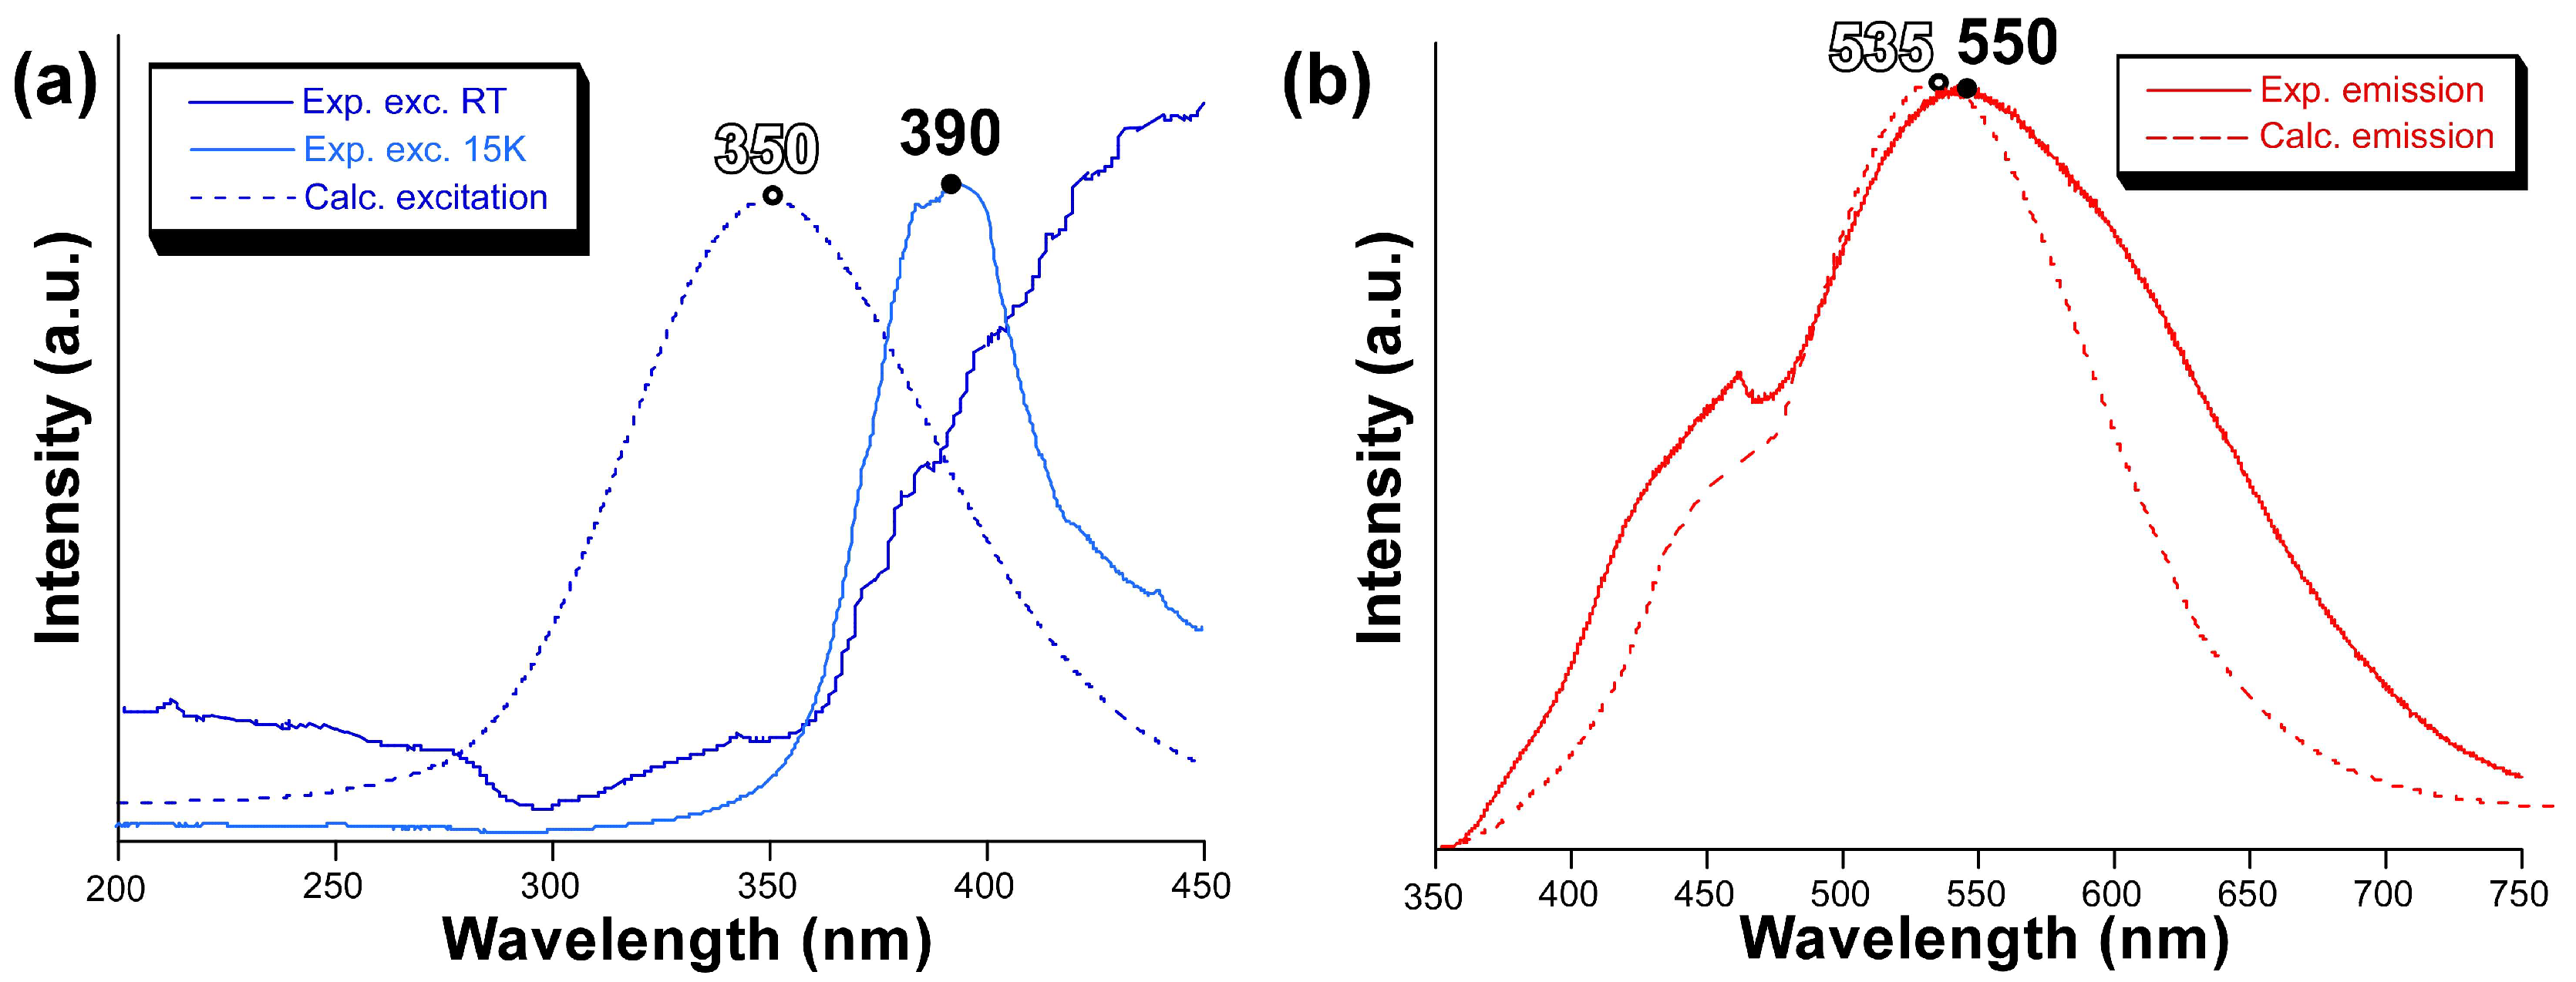
2.4. Photoluminescence Properties

We explored the photoluminescence properties of compound 1 in view of the good emissive properties previously shown by CPs based on the pmdc ligand [38]. To start with, the emission spectrum recorded at room temperature on a polycrystalline sample (Figure 5a) presents a wide band covering the whole visible spectrum that is composed of two main contributions with the maxima peaking at ca. 460 and 550 nm. Focusing on the wavelength of the emission maximum, the excitation spectrum reveals the presence of a very weak band in the 300–360 nm range followed by the main band (peaking at 450 nm) that cannot be completely observed due to its overlap with the emission. The first excitation band is concordant with the diffuse reflectance spectrum (Figure S14) in which the occurrence of at least two bands is observed in the 220–400 nm range. Compared to the spectroscopic data of the free H2pmdc ligand (in which λex,max = 335 and λem,max = 435 nm), compound 1 shows a strong red shift of 115 nm (Figure S7), meaning that the photoluminescence properties of this compound cannot be fully explained on the basis of the usual electronic transitions of the π-π* electronic of pmdc. The emission lifetime was also measured for both emission maxima (Figure S8). The signal was very weak for the first shoulder (λem,max = 460 nm) and the lifetime very short, so it had to be estimated by deconvolution with an appropriate instrument refinement file (τ = 2.8(1) ns). The maxima of λem,max = 550 nm presented a larger lifetime of 72(3) µs (averaged over two components, see ESI) estimated from the general multiexponential expression (It = A0 + A1exp(t/τ1) + A2exp(t/τ2)). Moreover, the emission quantum yield (QY) measured for compound 1 almost doubles that of the H2pmdc ligand recorded under an equivalent experimental setup: 1.7(2)% vs. 0.8(2)%, respectively.
In view of the observed spectra, TDDFT calculations were performed on a suitable model of compound 1 consisting of a monomeric anionic fragment containing all ligands, which was previously optimized at DFT level (see computational details and Figure S9). According to the results obtained with Gaussian software (Figure 5b), the main excitations occurring in the compound are related with two theoretical electronic transitions: (i) LUMO ← HOMO-5 occurring at 395 nm and (ii) LUMO ← HOMO-7 at 335 nm, which would give rise to the seventh (S7) and tenth (S10) excited states. Although both excitations possess high oscillator strengths, it must be highlighted that the former is much higher than the latter (see Table S3). Moreover, both HOMO-5 and HOMO-7 orbitals are mainly located over the coordinated hydroxide and carboxylate groups, while HOMO-7 also possesses some participation of the non-bonding electrons of Pb(II). Considering that LUMO is assigned as a π* orbital of one of the pmdc ligands, the PL excitation of this compound may have both a mixed ligand-to-metal charge transfer (LMCT) and ligand-to-ligand charge transfer (LLCT) origin. These results mean that, under the employed experimental setup with the λex = 325 nm laser excitation, and though the absorbed energy could be enough as to excite the S10 state, the S7 state could more probably be involved in the PL excitation process. In any case, given that these states are unlikely to be directly involved in the emission process according to Kasha’s rule [57,58], which anticipates the lowest-lying state to be the emission donor, we focused on the optimization of the first excited state (S1) to elucidate the theoretical luminescence energy. According to this calculation, the S1 lies 18,868 cm−1 (530 nm) above the ground state, meaning that the PL emission occurs from that state and that there must be an energy transfer from S7 and S10 during the structure relaxation.
To confirm the validity of the previous calculations, we also computed the excitation and emission spectra by means of the ESD module in ORCA using the same mononuclear model. The calculated excitation spectrum shows a symmetric band peaking at 350 nm, suggesting that there is a slight blue shift of the calculated band with respect to the experimentally measured one (Figure 6), whose maximum seems to be over 400 nm although the band might be somewhat mixed with the emission. Nonetheless, the excitation band for the main emission (λem = 550 nm) may be well observed experimentally at 15 K, in which the excitation band is centred at 390 nm, thus confirming the slight blue shift for the calculated spectrum. On its part, the calculated emission spectrum reproduces the band maximum of the experimental measurement very well with a small blue shift of ∆ = 15 nm. However, the shape is not that accurate although the calculated spectrum presents a distinguishable shoulder in the region of 460 nm.
The PL characterization of the material was also conducted at a low temperature by placing the sample into a close cryostat linked to a helium pump. The emission spectrum recorded at the same conditions (λex = 325 nm) resembles that of RT, although the first shoulder (λem = 460 nm) becomes a well-defined and somewhat structured band (with higher relative intensity compared to RT, Figure S10). Moreover, the main band, at λem,max = 525 nm at 15 K, is somewhat split in such a way that the resulting wide maxima is broadened and covers the region of 500–600 nm. The occurrence of the band at 600 nm as well as the increasing intensity of the band at 460 nm seems to be a consequence of the decreasing non-radiative vibrational quenching due to the low temperature, because the excitation spectra collected at all emission wavelengths show the same pattern (Figure S11). This fact means that there is no significant change in the radiative pathways by the effect of the temperature. The experimental lifetimes were also estimated for the two main bands of the emission spectrum for comparative purposes. Surprisingly, the first band (λem = 460 nm) consists of a slightly shorter fluorescent process (τ = 0.8(2) ns), an opposite result to the usual trend by which lowering the temperature brings an enlargement of the lifetimes due to a decrease in the vibrational quenching (Figure S12). However, this unexpected behaviour may be understood with the analysis of the second and dominant band of λem,max = 525 nm, for which the average lifetime is substantially lengthened (2337(56) µs at 15 K vs. 72(3) µs at RT). Such a large lifetime, in the range of milliseconds, may be classified within the low part of long-lived phosphorescence [17], an emission that leads to an afterglow that is traced by the human eye once the excitation source is turned off. The large difference in the emission lifetime between the first and second bands is clearly observed in the time-resolved emission spectra (TRES) experiment conducted at a low temperature (Figure S13). Immediately after the absorption of the pulsed light, the first band fully disappears and the emission spectrum consists of a unique and symmetrical band centred at 525 nm, which is maintained along the whole experiment. In this regard, it is worth noticing that the second band (at low temperature) contains at least two bands of different lifetimes given that the high intensity around 550–600 nm is rapidly vanished after 1 ms in the TRES.

3. Materials and Methods

3.1. Synthesis of {[Pb53-OH)(μ3-NO3)36-pmdc)3]·H2O}n (1)

Single crystals of compound 1 were obtained by following a solvent-free synthesis in which stoichiometric amounts of H2pmdc (0.0306 g, 0.15 mmol) and Pb(NO3)2 (0.0497 g, 0.15 mmol) were mixed and hand-grinded carefully to avoid the formation of a melt at room temperature. Then, the solid mixture was rapidly transferred into a glass tube which, once sealed, led to the hermetically closed reaction vessel. The vessel was placed in an autoclave and heated up to 150 °C for 48 h, after which it was slowly cooled down (5 °C/min) to room temperature. Finally, the product was gently washed with a water/ethanol solution to remove the rest of the unreacted reagent. Yield: 90% (based on metal). Anal. Calc. for C18H9N9O2Pb5 (%): C, 12.32; H, 0.52; N, 7.18; Pb, 59.02. Found: C, 12.68; H, 0.63; N, 7.12; Pb, 59.15.
It is worth noting that performing the synthesis in the 150–210 °C range also leads to a pure sample of the compound but in the form of polycrystalline powder.

3.2. Physical Measurements

Elemental analysis (C, H, N) was performed on the polycrystalline sample of compound 1 by using a Euro EA Elemental Analyser while the lead content of the sample was determined by means of ICP-AES measurements performed on a Horiba Yobin Yvon Activa spectrometer. FTIR spectrum was collected in the 4000–400 cm−1 spectral region and measured on a FTIR 8400S Shimadzu spectrometer using KBr pellets. The study of the thermal analysis (TG/DTA) was performed on a TA Instruments SDT 2960 instrument under synthetic air (79% N2/21% O2), applying a heating rate of 5 °C/min.

3.3. X-ray Diffraction Data Collection and Structure Determination

Single crystal X-ray diffraction (SCXRD) data collection was acquired at 100(2) K on an Agilent Technologies Supernova diffractometer (λCu-κα = 1.5418 Å) and the data reduction was performed by means of the CrysAlisPro program [59]. The crystal structure was solved by direct methods using the SHELXT program [60] and refined with Olex2 (1.5 version) software [61], including all reflections by means of full-matrix least-squares (Table 2). Hydrogen atoms were located in the difference Fourier map, but their position was fixed using riding models involving isotropic thermal displacement parameters of 120% those of their parent atoms, except for the hydroxide anion, in which thermal ellipsoids of 150% were applied. Moreover, the lattice water molecule could not be properly refined because it showed an extremely large displacement parameter owing to its partial absence in the crystal, as confirmed by thermal gravimetric analysis (see ESI). CCDC 2295990 contains the supplementary crystallographic data for this paper. These data can be obtained free of charge via http://www.ccdc.cam.ac.uk/conts/retrieving.html (or from the CCDC, 12 Union Road, Cambridge CB2 1EZ, UK; Fax: +44-1223-336033; E-mail: [email protected]).
Powder X-ray diffraction (PXRD) patterns were measured on a Philips X’PERT diffractometer using monochromatic Cu-Kα radiation (λ = 1.5418 Å) in the 5 < 2θ < 50° (2θ) range using a fixed slit, a step size of 0.02°, and an acquisition time of 2.5 s per step. Pattern matching analysis of the full diffractogram was performed with the FULLPROF program [62] using the cell parameters and space group from the SCXRD experiment. The thermodiffractometry was conducted at room temperature and acquiring a diffractogram in the 5 < 2θ < 38° range every 20 °C (following a heating rate of 5 °C/min) in the 30–410 °C range.

3.4. Photoluminescence Measurements

Photoluminescence excitation and emission spectra were acquired on an Edinburgh Instruments FLS920 spectrometer equipped with a close cycle helium cryostat. All measurements were conducted under high vacuum (of ca. 10−9 mbar) to avoid the presence of oxygen or water in the sample holder. An IK3552R-G HeCd continuous laser (325 nm) and a Müller-Elektronik-Optik SVX1450 Xe lamp were employed as excitation sources for the steady-state measurements, whereas a pulsed light-emitting diode (LED, λ = 340 nm) or laser diode LDH-P-C-375 (λ = 375 nm) was used for the decay curves. The fluorescence counts were detected on a photomultiplier tube (PMT) coupled to the spectrometer. The overall quantum yield (%) was measured in solid state and at room temperature by means of a Horiba Quanta–φ integrating sphere using an Oriel Instruments MS257 lamp as excitation source and an iHR550 spectrometer from Horiba to analyze the emission. Photographs taken on irradiated polycrystalline samples of compound 1 were performed with an Olympus optical microscope illuminated with a Hg lamp and equipped with a CCD detector.

3.5. Computational Calculations

Computational calculations were carried out on an excerpt cut from X-ray coordinates of compound 1 consisting of a central Pb(II) ion containing all the complete ligand molecules. The model, possessing the [Pb(pmdc)4(OH)(NO3)]8− formula, was optimized with the Gaussian 16 package [63] keeping some constraints for the bonds and angles of the coordination shell as well as some dihedral angles of the pmdc ligand and performing a frequency calculation to confirm that the geometry corresponds to an energy minimum. These calculations were conducted with DFT with the hybrid B3LYP functional [64,65] and the 6-31G+(d) basis set [66] for all atoms except for Pb(II), for which the LANL2DZ [67] basis set and the corresponding effective core potential (ECP) were employed. PL spectra were calculated with two different strategies. On the one hand, the 70 lowest excitation states were calculated by the TDDFT method implemented in the Gaussian 16 package to identify the main excitations during the absorption process. The results were analysed with GaussSum [68] and molecular orbitals plotted with GaussView 6 [69]. On the other hand, the ground and first excited states were also optimized with the ORCA 5.0.3 program [70,71] at DFT level of theory with B3LYP and employing a ZORA Hamiltonian in order to account for relativistic effects [72] as well as the atom-pairwise dispersion correction with the Becke–Johnson damping scheme (D3BJ) [73,74]. Several constraints were added in order to freeze most of the free rotations of the non-coordinating pmdc ligands in the employed model, in order to mimic the real situation of the 3D crystal. The appropriate ZORA-def2-TZVP basis set was selected for C, H, N, and O atoms, whereas a SARC-ZORA-TZVP basis set was selected for Pb, including coulomb and exchange contributions [75,76]. Then, excitation and emission spectra were computed with the modules using the hessians of the optimized geometries of the S0 and S1 states and the spin–orbit coupling (SOC) matrix elements.

4. Conclusions

A 3D metal–organic framework, with {[Pb53-OH)(μ3-NO3)36-pmdc)3]·H2O}n (1) formula, has been crystallized by reacting pyrimidine-4,6-dicarboxylic acid with lead(II) nitrate with a mechano-thermal procedure in the absence of a solvent. Compound 1 is obtained as a pure product because both the main byproduct (nitric acid) and the rest of the unreacted reagents are dissolved during the washing procedure. In addition to pmdc ligands showing a hexadentate coordination mode, nitrate and hydroxide ions present in the reaction medium also act as ligands of the MOF, which presents an intricate structure possessing an unprecedented topology with the (4.62)6(43)2(45.610)3(45.68.82)6(46.69)6(612.83) point symbol. Owing to the coordination of pmdc to Pb(II) ions in the framework, PL properties of the MOF are improved with respect to the free H2pmdc ligand, because luminescence brightness is increased and quantum yield is almost doubled up to 1.7% for compound 1. The overall panchromatic emission of the compound at room temperature is due to the occurrence of two bands of different nature in terms of emission durability, being composed of a blue, fluorescent component and a yellowish green phosphorescence in view of their lifetimes. Moreover, TDDFT calculations also point to the participation of other ligands or even the metal ion (LLCT and/or LMCT) as possible reasons for the PL observed in the material. Interestingly, the MOF acquires long-lived phosphorescence at temperatures below liquid nitrogen reaching a lifetime of around 2 ms at 15 K that makes this compound the unique pmdc-based example showing luminescent emission lasting in the range of milliseconds.

Supplementary Materials

The following supporting information can be downloaded at: https://www.mdpi.com/article/10.3390/cryst13101490/s1, Figure S1. Packing of compound 1 along the c axis viewing direction; Figure S2. Packing of compound 1 along the a axis viewing direction; Figure S3. Crystal packing of compound 1 drawn in the form of topological network (top) and molecular framework (bottom); Figure S4. Crystal packing of compound 1 showing the isolated voids (golden solid) containing water molecules; Table S1. Continuous shape measurements for the coordination environments for compound 1. The lowest SHAPE values are shown in bold blue, indicating best fits; Figure S5. Pattern-matching analysis of polycrystalline sample of compound 1; Table S2. Main IR absorption bands (cm−1) for compound 1; Figure S6. Comparison of the FTIR spectra of compound 1 and the free H2pmdc ligand; Figure S7. Excitation (λem = 435 nm) and emission (λex = 335 nm) spectra of H2pmdc ligand recorded at room temperature; Figure S8. Decay curves of the emission of compound 1 at room temperature for the main emission maxima; Figure S9. Monomeric model taking from the X-ray coordinates used for the calculations of the PL properties of compound 1; Table S3. Calculated main excitation and emission energies (nm), singlet electronic transitions, and associated oscillator strengths of a model of compound 1 in gas phase; Figure S10. Emission spectrum of compound 1 collected at 15 K under monochromatic laser light (λex = 325 nm); Figure S11. Comparison of the low temperature excitation spectra collected over the two maxima observed in the emission of compound 1; Figure S12. Decay curves of the emission of compound 1 at low temperature for the main emission maxima; Figure S13. TRES recorded at 15 K for compound 1 showing a selection of spectra. Figure S14. Diffuse reflectance spectrum acquired on a polycrystalline sample of compound 1.

Author Contributions

Conceptualization, J.C.; methodology, J.C.; software, J.M.M., I.V.-Y. and L.R.-B.; validation, J.M.M., J.A.G. and A.Z.-L.; formal analysis, J.A.G. and A.R.-D.; investigation, L.R.-B. and J.C.; resources, J.C.; data curation, O.P.-C., J.A.G. and J.C.; writing—original draft preparation, L.R.-B. and J.C.; writing—review and editing, A.R.-D. and J.C.; visualization, A.Z.-L., O.P.-C. and I.V.-Y.; supervision, J.C.; project administration, A.R.-D. and J.C.; funding acquisition, A.R.-D. and J.C. All authors have read and agreed to the published version of the manuscript.

Funding

This research was funded by Gobierno Vasco/Eusko Jaurlaritza (IT1755-22, IT1722-22 and IT1500-22) and Junta de Andalucía (ProyExcel_00386 and FQM-394). This publication is also part of the I+D+i projects of PGC2018-102052-A-C22 and PGC2018-102052-B-C21 codes, funded by MCIN/ AEI/10.13039/501100011033/ and “FEDER Una manera de hacer Europa”.

Institutional Review Board Statement

Not applicable.

Informed Consent Statement

Not applicable.

Data Availability Statement

The data supporting this study’s findings are available from the corresponding author upon reasonable request.

Acknowledgments

The authors are thankful for the technical and human support provided by SGIker of UPV/EHU and European funding (ERDF and ESF) and wish to acknowledge the terrific help of all reviewers of the present manuscript whose comments helped to improve the quality of the work. L.R.-B. is grateful to the UPV/EHU for her predoctoral fellowship.

Conflicts of Interest

The authors declare no conflict of interest.

Sample Availability

Samples of the compound reported in this work are available from the authors.

References

  1. Batten, S.R.; Champness, N.R.; Chen, X.M.; Garcia-Martinez, J.; Kitagawa, S.; Öhrström, L.; O’Keeffe, M.; Suh, M.P.; Reedijk, J. Terminology of Metal-Organic Frameworks and Coordination Polymers (IUPAC Recommendations 2013). Pure Appl. Chem. 2013, 85, 1715–1724. [Google Scholar] [CrossRef]
  2. Farha, O.K.; Eryazici, I.; Jeong, N.C.; Hauser, B.G.; Wilmer, C.E.; Sarjeant, A.A.; Snurr, R.Q.; Nguyen, S.T.; Yazaydin, A.Ö.; Hupp, J.T. Metal-Organic Framework Materials with Ultrahigh Surface Areas: Is the Sky the Limit? J. Am. Chem. Soc. 2012, 134, 15016–15021. [Google Scholar] [CrossRef] [PubMed]
  3. Liu, X.; Zhang, L.; Wang, J. Design Strategies for MOF-Derived Porous Functional Materials: Preserving Surfaces and Nurturing Pores. J. Mater. 2021, 7, 440–459. [Google Scholar] [CrossRef]
  4. O’Keeffe, M.; Yaghi, O.M. Deconstructing the Crystal Structures of Metal-Organic Frameworks and Related Materials into Their Underlying Nets. Chem. Rev. 2012, 112, 675–702. [Google Scholar] [CrossRef]
  5. Feng, L.; Wang, K.-Y.; Lv, X.-L.; Yan, T.-H.; Zhou, H.-C. Hierarchically Porous Metal–Organic Frameworks: Synthetic Strategies and Applications. Natl. Sci. Rev. 2019, 7, 1743–1758. [Google Scholar] [CrossRef]
  6. Lu, W.; Wei, Z.; Gu, Z.Y.; Liu, T.F.; Park, J.; Park, J.; Tian, J.; Zhang, M.; Zhang, Q.; Gentle, T.; et al. Tuning the Structure and Function of Metal-Organic Frameworks via Linker Design. Chem. Soc. Rev. 2014, 43, 5561–5593. [Google Scholar] [CrossRef] [PubMed]
  7. Allendorf, M.D.; Stavila, V. Crystal Engineering, Structure-Function Relationships, and the Future of Metal-Organic Frameworks. CrystEngComm 2015, 17, 229–246. [Google Scholar] [CrossRef]
  8. Stock, N.; Biswas, S. Synthesis of Metal-Organic Frameworks (MOFs): Routes to Various MOF Topologies, Morphologies, and Composites. Chem. Rev. 2012, 112, 933–969. [Google Scholar] [CrossRef]
  9. Morsali, A.; Hashemi, L. Main Group Metal Coordination Chemistry. In Main Group Metal Coordination Polymers; John Wiley & Sons, Ltd.: Hoboken, NJ, USA, 2017; pp. 183–204. ISBN 9781119370772. [Google Scholar]
  10. Yaghi, O.M. Reticular Chemistry in All Dimensions. ACS Cent. Sci. 2019, 5, 1295–1300. [Google Scholar] [CrossRef]
  11. Taddei, M.; Howarth, A.J.; Uemura, T. Introduction to Molecular Engineering in MOFs: Beyond Reticular Chemistry. Mol. Syst. Des. Eng. 2023, 8, 700. [Google Scholar] [CrossRef]
  12. Fernandez, B.; Beobide, G.; Sanchez, I.; Carrasco-Marin, F.; Seco, J.M.; Calahorro, A.J.; Cepeda, J.; Rodriguez-Dieguez, A. Controlling Interpenetration for Tuning Porosity and Luminescence Properties of Flexible MOFs Based on Biphenyl-4,4′-Dicarboxylic Acid. CrystEngComm 2016, 18, 1282–1294. [Google Scholar] [CrossRef]
  13. García-Couceiro, U.; Castillo, O.; Cepeda, J.; Lanchas, M.; Luque, A.; Pérez-Yáñez, S.; Román, P.; Vallejo-Sánchez, D.; Garcia-Couceiro, U.; Castillo, O.; et al. Influence of the Synthetic Conditions on the Structural Diversity of Extended Manganese-Oxalato-1,2-Bis(4-Pyridyl)Ethylene Systems. Inorg. Chem. 2010, 49, 11346–11361. [Google Scholar] [CrossRef] [PubMed]
  14. Li, S.; Gao, Y.; Li, N.; Ge, L.; Bu, X.; Feng, P. Transition Metal-Based Bimetallic MOFs and MOF-Derived Catalysts for Electrochemical Oxygen Evolution Reaction. Energy Environ. Sci. 2021, 14, 1897–1927. [Google Scholar] [CrossRef]
  15. Sun, S.; Zhao, Y.; Wang, J.; Pei, R. Lanthanide-Based MOFs: Synthesis Approaches and Applications in Cancer Diagnosis and Therapy. J. Mater. Chem. B 2022, 10, 9535–9564. [Google Scholar] [CrossRef]
  16. Zhang, Y.; Liu, S.; Zhao, Z.-S.; Wang, Z.; Zhang, R.; Liu, L.; Han, Z.-B. Recent Progress in Lanthanide Metal–Organic Frameworks and Their Derivatives in Catalytic Applications. Inorg. Chem. Front. 2021, 8, 590–619. [Google Scholar] [CrossRef]
  17. San Sebastian, E.; Rodríguez-Diéguez, A.; Seco, J.M.; Cepeda, J. Coordination Polymers with Intriguing Photoluminescence Behavior: The Promising Avenue for Greatest Long-Lasting Phosphors. Eur. J. Inorg. Chem. 2018, 2018, 2155–2174. [Google Scholar] [CrossRef]
  18. Gutiérrez, M.; Martín, C.; Souza, B.E.; Van der Auweraer, M.; Hofkens, J.; Tan, J.-C. Highly Luminescent Silver-Based MOFs: Scalable Eco-Friendly Synthesis Paving the Way for Photonics Sensors and Electroluminescent Devices. Appl. Mater. Today 2020, 21, 100817. [Google Scholar] [CrossRef]
  19. Karmakar, A.; Li, J. Luminescent MOFs (LMOFs): Recent Advancement towards a Greener WLED Technology. Chem. Commun. 2022, 58, 10768–10788. [Google Scholar] [CrossRef]
  20. Parr, J. Some Recent Coordination Chemistry of Lead(Ll). Polyhedron 1997, 16, 551–566. [Google Scholar] [CrossRef]
  21. Xu, Y.; Yuan, D.; Han, L.; Ma, E.; Wu, M.; Lin, Z.; Hong, M. Mono- and Bilayered Lead(II)–Bpno Polymers with Unusual Low Energy Emission Properties (Bpno = 4,4′-Bipyridine N,N’-Dioxide). Eur. J. Inorg. Chem. 2005, 2005, 2054–2059. [Google Scholar] [CrossRef]
  22. Nadar, S.S.; Rathod, V.K. Magnetic-Metal Organic Framework (Magnetic-MOF): A Novel Platform for Enzyme Immobilization and Nanozyme Applications. Int. J. Biol. Macromol. 2018, 120, 2293–2302. [Google Scholar] [CrossRef]
  23. Mínguez Espallargas, G.; Coronado, E. Magnetic Functionalities in MOFs: From the Framework to the Pore. Chem. Soc. Rev. 2018, 47, 533–557. [Google Scholar] [CrossRef] [PubMed]
  24. Rinehart, J.D.; Long, J.R. Exploiting Single-Ion Anisotropy in the Design of f-Element Single-Molecule Magnets. Chem. Sci. 2011, 2, 2078–2085. [Google Scholar] [CrossRef]
  25. Yang, D.; Gates, B.C. Catalysis by Metal Organic Frameworks: Perspective and Suggestions for Future Research. ACS Catal. 2019, 9, 1779–1798. [Google Scholar] [CrossRef]
  26. Mancuso, J.L.; Mroz, A.M.; Le, K.N.; Hendon, C.H. Electronic Structure Modeling of Metal–Organic Frameworks. Chem. Rev. 2020, 120, 8641–8715. [Google Scholar] [CrossRef] [PubMed]
  27. Karnieli, A.; Tsesses, S.; Bartal, G.; Arie, A. Emulating Spin Transport with Nonlinear Optics, from High-Order Skyrmions to the Topological Hall Effect. Nat. Commun. 2021, 12, 1092. [Google Scholar] [CrossRef] [PubMed]
  28. Cui, Y.; Yue, Y.; Qian, G.; Chen, B. Luminescent Functional Metal–Organic Frameworks. Chem. Rev. 2012, 112, 1126–1162. [Google Scholar] [CrossRef]
  29. Liu, J.Q.; Luo, Z.D.; Pan, Y.; Kumar Singh, A.; Trivedi, M.; Kumar, A. Recent Developments in Luminescent Coordination Polymers: Designing Strategies, Sensing Application and Theoretical Evidences. Coord. Chem. Rev. 2020, 406, 213145. [Google Scholar] [CrossRef]
  30. Li, W.; Zhao, D.; Li, W.; Wen, R.; Liu, X.; Liu, L.; Li, T.; Fan, L. Chemorobust Dye-Encapsulated Framework as Dual-Emission Self-Calibrating Ratiometric Sensor for Intelligent Detection of Toluene Exposure Biomarker in Urine. Spectrochim. Acta Part A Mol. Biomol. Spectrosc. 2023, 296, 122637. [Google Scholar] [CrossRef]
  31. Wang, F.; Zhao, D.; Li, W.; Zhang, H.; Li, B.; Hu, T.; Fan, L. Rod-Shaped Units Based Cobalt(II) Organic Framework as an Efficient Electrochemical Sensor for Uric Acid Detection in Serum. Microchem. J. 2023, 185, 108154. [Google Scholar] [CrossRef]
  32. Yin, J.; Li, W.; Li, W.; Liu, L.; Zhao, D.; Liu, X.; Hu, T.; Fan, L. Heterometallic ZnHoMOF as a Dual-Responsive Luminescence Sensor for Efficient Detection of Hippuric Acid Biomarker and Nitrofuran Antibiotics. Molecules 2023, 28, 6274. [Google Scholar] [CrossRef] [PubMed]
  33. Wang, S.; Sun, B.; Su, Z.; Hong, G.; Li, X.; Liu, Y.; Pan, Q.; Sun, J. Lanthanide-MOFs as Multifunctional Luminescent Sensors. Inorg. Chem. Front. 2022, 9, 3259–3266. [Google Scholar] [CrossRef]
  34. Seco, J.M.; San Sebastián, E.; Cepeda, J.; Biel, B.; Salinas-Castillo, A.; Fernández, B.; Morales, D.P.; Bobinger, M.; Gómez-Ruiz, S.; Loghin, F.C.; et al. A Potassium Metal-Organic Framework Based on Perylene-3,4,9,10-Tetracarboxylate as Sensing Layer for Humidity Actuators. Sci. Rep. 2018, 8, 14414. [Google Scholar] [CrossRef]
  35. Cepeda, J.; Rodríguez-Diéguez, A. Tuning the Luminescence Performance of Metal-Organic Frameworks Based on D10metal Ions: From an Inherent Versatile Behaviour to Their Response to External Stimuli. CrystEngComm 2016, 18, 8556–8573. [Google Scholar] [CrossRef]
  36. Briones, D.; Leo, P.; Cepeda, J.; Orcajo, G.; Calleja, G.; Sanz, R.; Rodríguez-Diéguez, A.; Martínez, F. Alkaline-Earth Metal Based MOFs with Second Scale Long-Lasting Phosphor Behavior. CrystEngComm 2018, 20, 4793–4803. [Google Scholar] [CrossRef]
  37. Pajuelo-Corral, O.; García, J.A.; Castillo, O.; Luque, A.; Mendicute-Fierro, C.; Rodríguez-Diéguez, A.; Cepeda, J. A Lamellar Zn-Based Coordination Polymer Showing Increasing Photoluminescence upon Dehydration. Molecules 2023, 28, 5643. [Google Scholar] [CrossRef]
  38. Cepeda, J.; Beobide, G.; Castillo, O.; Luque, A.; Pérez-Yáñez, S. Structural Diversity of Coordination Compounds Derived from Double-Chelating and Planar Diazinedicarboxylate Ligands. Coord. Chem. Rev. 2017, 352, 83–107. [Google Scholar] [CrossRef]
  39. Zangade, S.; Patil, P. A Review on Solvent-Free Methods in Organic Synthesis. Curr. Org. Chem. 2019, 23, 2295–2318. [Google Scholar] [CrossRef]
  40. Tanaka, K.; Toda, F. Solvent-Free Organic Synthesis. Chem. Rev. 2000, 100, 1025–1074. [Google Scholar] [CrossRef]
  41. Mei, J.; Duan, A.; Wang, X. A Brief Review on Solvent-Free Synthesis of Zeolites. Materials 2021, 14, 788. [Google Scholar] [CrossRef]
  42. López-Cabrelles, J.; Romero, J.; Abellán, G.; Giménez-Marqués, M.; Palomino, M.; Valencia, S.; Rey, F.; Mínguez Espallargas, G. Solvent-Free Synthesis of ZIFs: A Route toward the Elusive Fe(II) Analogue of ZIF-8. J. Am. Chem. Soc. 2019, 141, 7173–7180. [Google Scholar] [CrossRef] [PubMed]
  43. Baig RB, N.; Varma, R.S. Solvent-Free Synthesis; Future Science Ltd.: London, UK, 2013; pp. 18–38. [Google Scholar] [CrossRef]
  44. Kharissova, O.V.; Kharisov, B.I.; González, C.M.O.; Méndez, Y.P.; López, I. Greener Synthesis of Chemical Compounds and Materials. R. Soc. Open Sci. 2019, 6, 191378. [Google Scholar] [CrossRef] [PubMed]
  45. Lin, J.-B.; Lin, R.-B.; Cheng, X.-N.; Zhang, J.-P.; Chen, X.-M. Solvent/Additive-Free Synthesis of Porous/Zeolitic Metal Azolate Frameworks from Metal Oxide/Hydroxide. Chem. Commun. 2011, 47, 9185–9187. [Google Scholar] [CrossRef] [PubMed]
  46. Pichon, A.; Lazuen-Garay, A.; James, S.L. Solvent-Free Synthesis of a Microporous Metal-Organic Framework. CrystEngComm 2006, 8, 211–214. [Google Scholar] [CrossRef]
  47. Ma, X.; Chai, Y.; Li, P.; Wang, B. Metal–Organic Framework Films and Their Potential Applications in Environmental Pollution Control. Acc. Chem. Res. 2019, 52, 1461–1470. [Google Scholar] [CrossRef]
  48. Chen, Y.; Li, S.; Pei, X.; Zhou, J.; Feng, X.; Zhang, S.; Cheng, Y.; Li, H.; Han, R.; Wang, B. A Solvent-Free Hot-Pressing Method for Preparing Metal–Organic-Framework Coatings. Angew. Chem. Int. Ed. 2016, 55, 3419–3423. [Google Scholar] [CrossRef]
  49. Lanchas, M.; Arcediano, S.; Aguayo, A.T.; Beobide, G.; Castillo, O.; Cepeda, J.; Vallejo-Sánchez, D.; Luque, A. Two Appealing Alternatives for MOFs Synthesis: Solvent-Free Oven Heating vs. Microwave Heating. RSC Adv. 2014, 4, 60409–60412. [Google Scholar] [CrossRef]
  50. Yuvaraj, S.; Fan-Yuan, L.; Tsong-Huei, C.; Chuin-Tih, Y. Thermal Decomposition of Metal Nitrates in Air and Hydrogen Environments. J. Phys. Chem. B 2003, 107, 1044–1047. [Google Scholar] [CrossRef]
  51. Alvarez, S.; Avnir, D.; Llunell, M.; Pinsky, M. Continuous Symmetry Maps and Shape Classification. The Case of Six-Coordinated Metal Compounds. New J. Chem. 2002, 26, 996–1009. [Google Scholar] [CrossRef]
  52. Cramer, R.E.; Mitchell, K.A.; Hirazumi, A.Y.; Smith, S.L. Crystal Structures of [Pb(NO3)6]4 and [Ba(NO3)6]4 Salts of 24-Pyrimidinium Crown 6 {5,12,19,26,33,40-Hexaamino-3,10,17,24,31,38-Hexamethyl [1.6](1,5)Pyrimidiniophane}. J. Chem. Soc. Dalt. Trans. 1994, 563–569. [Google Scholar] [CrossRef]
  53. Litecká, M.; Gyepes, R.; Vargová, Z.; Vilková, M.; Almáši, M.; Walko, M.; Imrich, J. Toxic Metal Complexes of Macrocyclic Cyclen Molecule—Synthesis, Structure and Complexing Properties. J. Coord. Chem. 2017, 70, 1698–1712. [Google Scholar] [CrossRef]
  54. Adhikari, B.B.; Ohto, K.; Schramm, M.P. P-Tert-Butylcalix[6]Arene Hexacarboxylic Acid Conformational Switching and Octahedral Coordination with Pb(Ii) and Sr(Ii). Chem. Commun. 2014, 50, 1903–1905. [Google Scholar] [CrossRef]
  55. Groom, C.R.; Bruno, I.J.; Lightfoot, M.P.; Ward, S.C. The Cambridge Structural Database. Acta Crystallogr. Sect. B Struct. Sci. Cryst. Eng. Mater. 2016, 72, 171–179. [Google Scholar] [CrossRef] [PubMed]
  56. Blatov, V.A.; Shevchenko, A.P.; Proserpio, D.M. Applied Topological Analysis of Crystal Structures with the Program Package Topospro. Cryst. Growth Des. 2014, 14, 3576–3586. [Google Scholar] [CrossRef]
  57. Khan, A.U.; Kasha, M. Mechanism of Four-Level Laser Action in Solution Excimer and Excited-State Proton-Transfer Cases. Proc. Natl. Acad. Sci. USA 1983, 80, 1767–1770. [Google Scholar] [CrossRef] [PubMed]
  58. del Valle, J.C.; Catalán, J. Kasha’s Rule: A Reappraisal. Phys. Chem. Chem. Phys. 2019, 21, 10061–10069. [Google Scholar] [CrossRef]
  59. Agilent CrysAlisPro. Data Collection and Processing Software for Agilent X-ray Diffractometers; Aglient Technologies: Yarnton, UK, 2014; Volume 44, pp. 1–53. [Google Scholar]
  60. Sheldrick, G.M. SHELXT—Integrated Space-Group and Crystal-Structure Determination. Acta Crystallogr. Sect. A Found. Crystallogr. 2015, 71, 3–8. [Google Scholar] [CrossRef]
  61. Dolomanov, O.V.; Bourhis, L.J.; Gildea, R.J.; Howard, J.A.K.K.; Puschmann, H. {\it OLEX2}: A Complete Structure Solution, Refinement and Analysis Program. J. Appl. Crystallogr. 2009, 42, 339–341. [Google Scholar] [CrossRef]
  62. Rodríguez-Carvajal, J. Recent Advances in Magnetic Structure Determination by Neutron Powder Diffraction. Phys. B Phys. Condens. Matter 1993, 192, 55–69. [Google Scholar] [CrossRef]
  63. Frisch, M.J.; Trucks, G.W.; Schlegel, H.B.; Scuseria, G.E.; Robb, M.A.; Cheeseman, J.R.; Scalmani, G.; Barone, V.; Petersson, G.A.; Nakatsuji, H.; et al. Gaussian16 {R}evision {C}.01. 2016. [Google Scholar]
  64. Becke, A.D. A New Mixing of Hartree-Fock and Local Density-Functional Theories. J. Chem. Phys. 1993, 98, 1372–1377. [Google Scholar] [CrossRef]
  65. Lee, C.; Yang, W.; Parr, R.G. Development of the Colle-Salvetti Correlation-Energy Formula into a Functional of the Electron Density. Phys. Rev. B 1988, 37, 785–789. [Google Scholar] [CrossRef] [PubMed]
  66. Ditchfield, R.; Hehre, W.J.; Pople, J.A. Self-Consistent Molecular-Orbital Methods. IX. An Extended Gaussian-Type Basis for Molecular-Orbital Studies of Organic Molecules. J. Chem. Phys. 1971, 54, 720–723. [Google Scholar] [CrossRef]
  67. Hay, P.J.; Wadt, W.R. Ab Initio Effective Core Potentials for Molecular Calculations. Potentials for the Transition Metal Atoms Sc to Hg. J. Chem. Phys. 1985, 82, 270–283. [Google Scholar] [CrossRef]
  68. O’Boyle, N.M.; Tenderholt, A.L.; Langner, K.M. Cclib: A Library for Package-Independent Computational Chemistry Algorithms. J. Comput. Chem. 2008, 29, 839–845. [Google Scholar] [CrossRef]
  69. Dennington, R.; Keith, T.A.; Millam, J.M. GaussView {V}ersion {6}. 2019. [Google Scholar]
  70. Neese, F.; Wennmohs, F.; Becker, U.; Riplinger, C. The ORCA Quantum Chemistry Program Package. J. Chem. Phys. 2020, 152, 224108. [Google Scholar] [CrossRef]
  71. Neese, F. Software Update: The ORCA Program System—Version 5.0. Wiley Interdiscip. Rev. Comput. Mol. Sci. 2022, 12, e1606. [Google Scholar] [CrossRef]
  72. Van Lenthe, E.; Snijders, J.G.; Baerends, E.J. The Zero-order Regular Approximation for Relativistic Effects: The Effect of Spin–Orbit Coupling in Closed Shell Molecules. J. Chem. Phys. 1996, 105, 6505–6516. [Google Scholar] [CrossRef]
  73. Grimme, S.; Ehrlich, S.; Goerigk, L. Effect of the Damping Function in Dispersion Corrected Density Functional Theory. J. Comput. Chem. 2011, 32, 1456. [Google Scholar] [CrossRef]
  74. Grimme, S.; Antony, J.; Ehrlich, S.; Krieg, H. A Consistent and Accurate Ab Initio Parametrization of Density Functional Dispersion Correction (DFT-D) for the 94 Elements H-Pu. J. Chem. Phys. 2010, 132, 154104. [Google Scholar] [CrossRef]
  75. Weigend, F.; Ahlrichs, R. Balanced Basis Sets of Split Valence, Triple Zeta Valence and Quadruple Zeta Valence Quality for H to Rn: Design and Assessment of Accuracy. Phys. Chem. Chem. Phys. 2005, 7, 3297–3305. [Google Scholar] [CrossRef] [PubMed]
  76. Stoychev, G.L.; Auer, A.A.; Neese, F. Automatic Generation of Auxiliary Basis Sets. J. Chem. Theory Comput. 2017, 13, 554–562. [Google Scholar] [CrossRef] [PubMed]
Figure 1. Coordination shells of the crystallographically independent metal ions: (a) Pb1, (b) Pb2 and (c) Pb3. Colour codes: nitrogen, blue; oxygen, red; and lead, green.
Crystals 13 01490 g001
Figure 2. Coordination modes of the ligands within the cubic building unit of compound 1. Colour codes: carbon, grey; hydrogen, white; nitrogen, blue; oxygen, red; and lead, green.
Crystals 13 01490 g002
Figure 3. Excerpt of the crystal structure of compound 1 (note that the crystallographically independent atoms are shown with ball&stick representation) and a topological view of the same fragment (in which the highly-connected nodes are displayed as balls).
Crystals 13 01490 g003
Figure 4. Thermo-structural behaviour of compound 1 analysed by means of a (a) thermodiffractometric study in the 30–410 °C temperature range and (b) thermogravimetry.
Crystals 13 01490 g004
Figure 5. (a) Experimental excitation (blue) and emission (red) spectra of compound 1 at RT. (b) Schematic representation of the most relevant calculated excitations.
Crystals 13 01490 g005
Figure 6. (a) Excitation and (b) emission spectra showing the measured (solid line) and calculated (dotted line) bands.
Crystals 13 01490 g006
Table 1. Selected coordination bond distances for the Pb(II) ions of compound 1 (Å) 1.
Pb1–N112.767(12)Pb2–N132.548(12)Pb3–O232.744(12)
Pb1–O1712.510(12)Pb2–N13d2.548(12)Pb3–O23h2.744(12)
Pb1–O171a2.432(11)Pb2–O1812.506(11)Pb3–O23i2.744(12)
Pb1–O172b2.753(12)Pb2–O181d2.506(11)Pb3–O23j2.744(12)
Pb1–O182c2.707(10)Pb2–O182e2.914(11)Pb3–O23k2.744(12)
Pb1–O112.478(11)Pb2–O182f2.914(11)Pb3–O23l2.744(12)
Pb1–O222.679(13)Pb2–O22b2.686(12)Pb3–O242.865(16)
Pb2–O22g2.686(12)Pb3–O24h2.865(16)
Pb3–O24i2.865(16)
Pb3–O24j2.865(16)
Pb3–O24k2.865(16)
Pb3–O24l2.865(16)
1 Symmetry codes: (a) −x + y + 1, −x + 1, z; (b) x − y − 1/3, x − 2/3, −z + 1/3; (c) −y + 1/3, −x + 2/3, z + 1/6; (d) y + 1/3, x − 1/3, −z + 1/6; (e) −y, x − y − 1, z; (f) x − y − 2/3, −y − 1/3, −z + 1/6; (g) x − 1/3, x − y − 2/3, z − 1/6; (h) y + 2/3, −x + y + 1/3, −z + 1/3; (i) x − y − 1/3, x − 2/3, −z + 1/3; (j) −y, x − y − 1, z; (k) −x + 2/3, −y − 2/3, −z + 1/3; and (l) −x + y +1, −x, z.
Table 2. Single crystal X-ray diffraction data and structure refinement details of compound 1.
Compound1
Empirical formulaC18H9N9O23Pb5
Formula weight (g mol−1)1755.31
Crystal systemTrigonal
Space groupR 3 ¯ c
a (Å)14.3004(2)
c (Å)53.369(1)
V (Å3)9451.8(3)
Z6
Reflections collected1944
Unique data/parameters1926/164
Rint0.0549
GoF (S) a1.260
R1 b/wR2 [I > 2σ(I)] c0.0521/0.1169
R1 b/wR2 [all] c0.0524/0.1170
a S = [∑w(F02 − Fc2)2/(Nobs − Nparam)]1/2. b R1 = ∑||F0|–|Fc||/∑|F0|; c wR2 = [∑w(F02 − Fc2)2/∑wF02]1/2; w = 1/[σ2(F02) + (aP)2 + bP] where P = (max(F02,0) + 2Fc2)/3 with a = 0.0001 and b = 2663.0154.
Disclaimer/Publisher’s Note: The statements, opinions and data contained in all publications are solely those of the individual author(s) and contributor(s) and not of MDPI and/or the editor(s). MDPI and/or the editor(s) disclaim responsibility for any injury to people or property resulting from any ideas, methods, instructions or products referred to in the content.

