Article

Effect of Cr Doping on the Structural, Optical and Dielectric Properties of MoO3 Microrods Synthesized by Sol-Gel Auto Combustion Method

1
Department of Physics, Riphah International University, Islamabad 44000, Pakistan
2
Electrical Engineering Department, College of Engineering, King Khalid University, Abha 61421, Saudi Arabia
3
Department of Physics, Government Postgraduate College Nowshera, Nowshera 24100, Pakistan
4
Department of Physics, College of Science, Qassim University, Buraydah 51452, Saudi Arabia
5
Mechanical Engineering Department, College of Engineering, King Khalid University, Abha 61421, Saudi Arabia
6
Research Center for Advanced Materials Science (RCAMS), King Khalid University Guraiger, Abha 61413, Saudi Arabia
7
Medical Instrumentation Techniques Engineering Department, Al-Mustaqbal University College, Babylon 51001, Iraq
8
Optical Department, College of Health and Medical Technology, Sawa University, Ministry of Higher Education and Scientific Research, Al-Muthanaa, Samawah 66001, Iraq
9
School of Material Science and Engineering, Beijing University of Technology, Beijing 100124, China
10
Faculty of Materials and Manufacturing, Beijing University of Technology, Beijing 100124, China
11
Department of Physics, College of Science and Arts in Al Badaya, Qassim University, Al Badayea 52571, Saudi Arabia
12
Department of Chemistry, College of Science, Taif University, Taif 21944, Saudi Arabia
*
Authors to whom correspondence should be addressed.
Crystals 2022, 12(9), 1259; https://doi.org/10.3390/cryst12091259
Submission received: 16 August 2022 / Revised: 2 September 2022 / Accepted: 2 September 2022 / Published: 5 September 2022
(This article belongs to the Special Issue Advances in Optoelectric Functional Crystalline Materials)

Abstract

:
In the present work, pure and Cr-doped MoO3 microrods were successfully prepared through the sol gel auto combustion method. The phase evaluation and microstructural, dielectric, and optical properties of synthesized samples were investigated by using X-ray diffraction (XRD), scanning electron microscopy (SEM), energy dispersive spectroscopy (EDS), and an impedance analyzer (1 MHz–3 GHz). All the samples showed hexagonal structure with space group (P63). According to Vegard’s law, lattice parameters increase with the increase in chromium (Cr3+) contents. In addition, the Williamson–Hall (W–H) plot was drawn for evaluating the micro-strain (εW-H) and crystallite size (DW-H) parameters. From microstructural analysis it was found that the size of microrods increased along with Cr3+ contents. Decreasing band gap energy was observed (from 2.98 to 2.71 eV) with increasing Cr3+ contents. The variation of the dielectric constant and tangent loss of MoO3 microrods with respect to frequency were analyzed.

1. Introduction

Transition metal oxides have been used in recent research innovations due to their excellent properties. They produce different phase structures due to their different metal–oxygen ratios. Molybdenum trioxide (MoO3) has good electrical, optical, and microwave dielectric properties due to its structural orientation [1]. MoO3 has wide band gap energy (2.8–3.6 eV) with n-type semiconductor conductivity [2]. Basically, there exist three polymorphous structures of MoO3: β-MoO3 (monoclinic), α-MoO3 (orthorhombic), and h-MoO3 (hexagonal). Thermodynamically, the structure of α-MoO3 is very stable and attractive for practical uses because of its anisotropic compositions along the (010) direction [3]. This anisotropic chemistry is created by stacking a bi-layer sheet of octahedral Mo2O6 bonded through Van der Waal forces. Due to intrinsic structural anisotropy and the ability of transformation of oxidation states between molybdenum-IV and V ions, α-MoO3 (orthorhombic) has been verified to have exceptional applications in the fields of catalysis, field emissions, lithium-ion batteries, energy storage devices, gas sensing, and electrochromic and photochromic devices [4,5].
Over the last couple of years, molybdenum trioxide has received extensive attention because of its many applications in various fields. The various significant aspects of molybdenum trioxide have led to this interest, including strong photo catalytic ability, battery device assembly, and Li storage performance [6]. As a result, MoO3 is widely employed in industry, including catalysts [7], field effect transistors [8], gas sensors, and battery electrodes [9]. Many researchers reported that MoO3 has outstanding properties and vast uses in the field of super capacitors, memory devices, OLEDs (organic light-emitting diodes), dielectric resonator devices, and solar cell equipment [10,11,12,13,14,15,16,17]. MoO3 has three polymorphic phases: (a) orthorhombic, (b) hexagonal, and (c) monoclinic. Of these phases, the orthorhombic phase is more stable, and along with bi-layered octahedral distortion it has good electrical, optical, and magnetic properties [18]. Many researchers study it and found it in the form of nanowires, nanorods, thin film, microrods, quantum dots, and nanobelts [19,20,21,22,23].
In the current research work, we focused on synthesizing chromium Cr-doped MoO3 microrods and use the sol gel auto combustion route. The effect of (Cr+3) cation substitution is simultaneously evaluated on structural and microstructural development and band gap energy of MoO3 microrods. Correspondingly, the prepared pure and Cr-doped MoO3 microrods were characterized using X-ray diffraction (XRD), scanning electron microscopy (SEM), energy dispersive spectroscopy (EDS), and diffuse reflectance spectroscopy (DRS).

2. Experimental Method

The Cr-substituted MoO3 microrods with 3 wt% and 6 wt% were prepared by the sol–gel auto combustion technique. The stoichiometric amounts of MoO3 (purity 99.97%, Sigma-Aldrich chemicals, St. Louis, MI, USA) and chromium chloride (purity 99.5%, Sigma-Aldrich chemicals, St. Louis, MI, USA) including those with with nitric acid were used to prepare the product powders. We used the nitric acid (HNO3) as a chelating agent to obtain a homogenous and straightforward solution. The solution was stirred with the help of a hot plate and magnetic stirrer at 90 °C for one hour to dissolve reactants in distilled water. Then, the concentration of chromium chloride (CrCl3) (3 wt%, and 6 wt%) was doped into the solution. At that point, the solution was stirred magnetically at 90 °C for 6 h, adding ammonia drop by drop to maintain the pH value at 6–7. At the end, the solution changed into a viscous brown gel and then self-combustion happened, as shown in the graphical abstract. After complete crushing and grinding, the fine powder was then used in vacuum furnace sintering at 500 °C for 2 h in the nitrogen and hydrogen atmosphere. X-ray diffractometer (XRD) (JDX-3532, JEOL, Japan) was used for studying the crystal structure of all fabricated samples functioned with Cu-K radiations of wavelength λ = 0.1540598 nm, at 45 × 103 V and 40 × 10−3 A in the 2θ range of 5–60°. The microstructures functional at 20 KV were analyzed using a scanning electron microscope (SEM) (JSM-5910, JEOL).

3. Results and Discussion
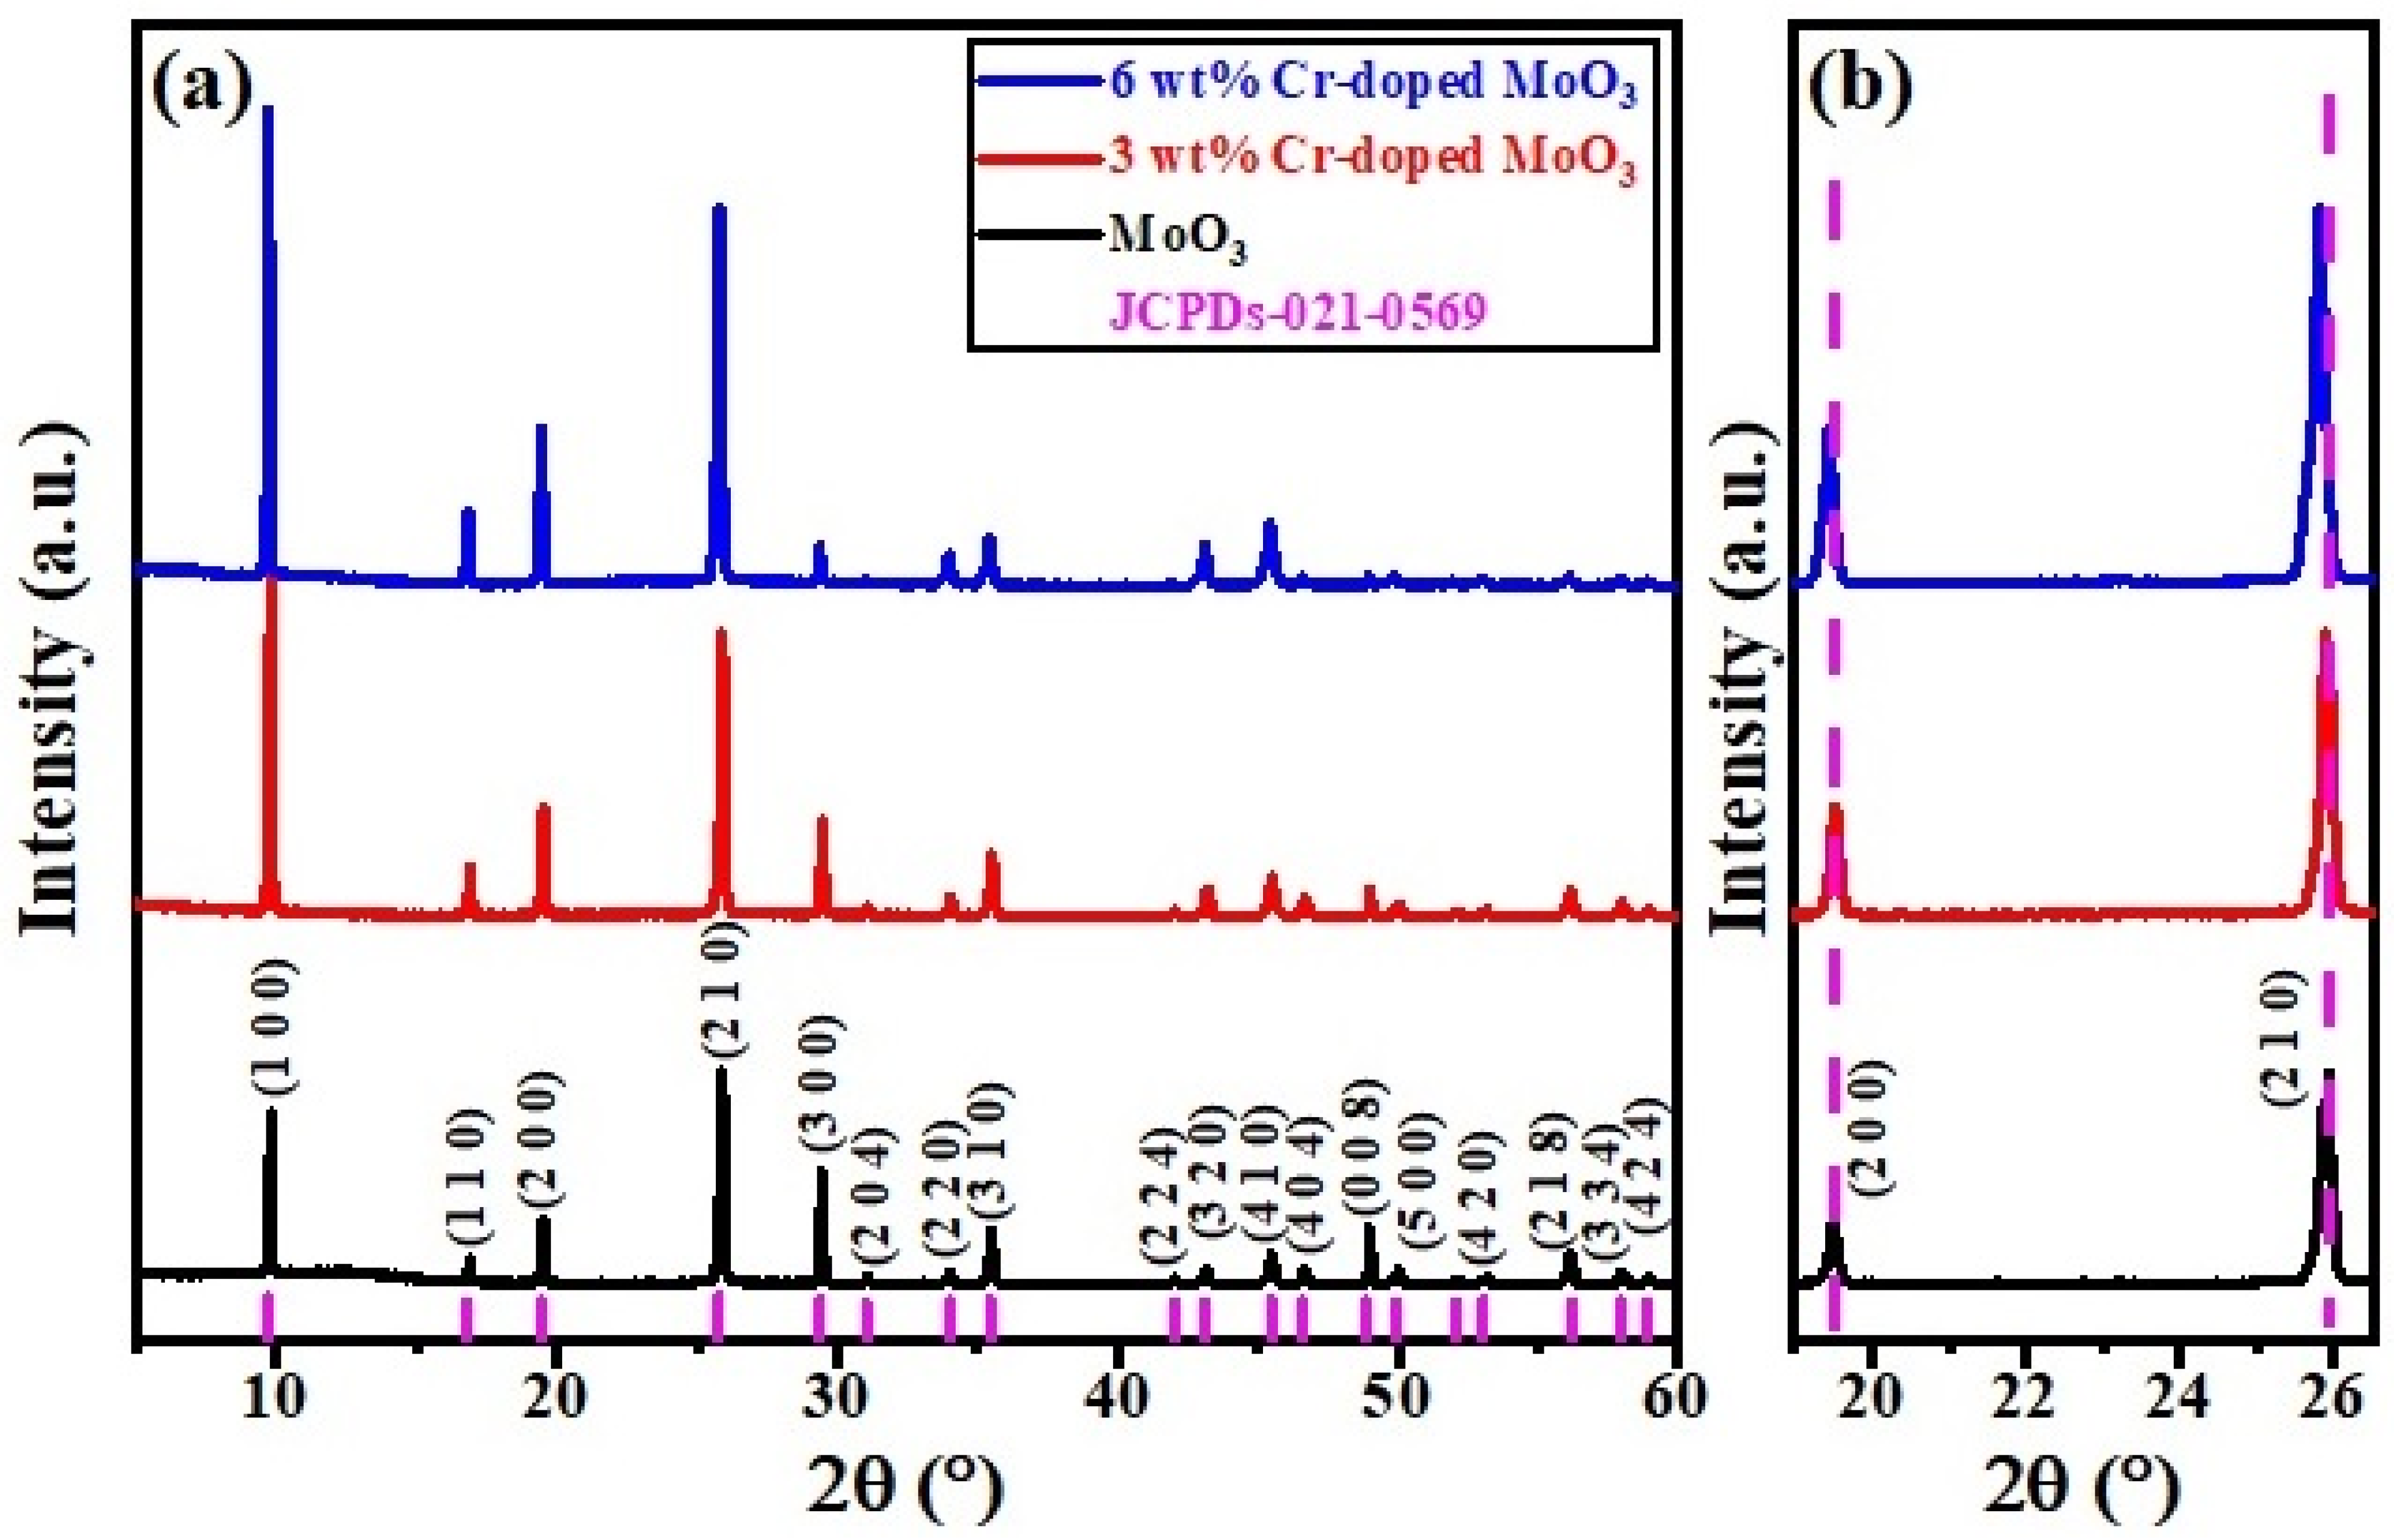
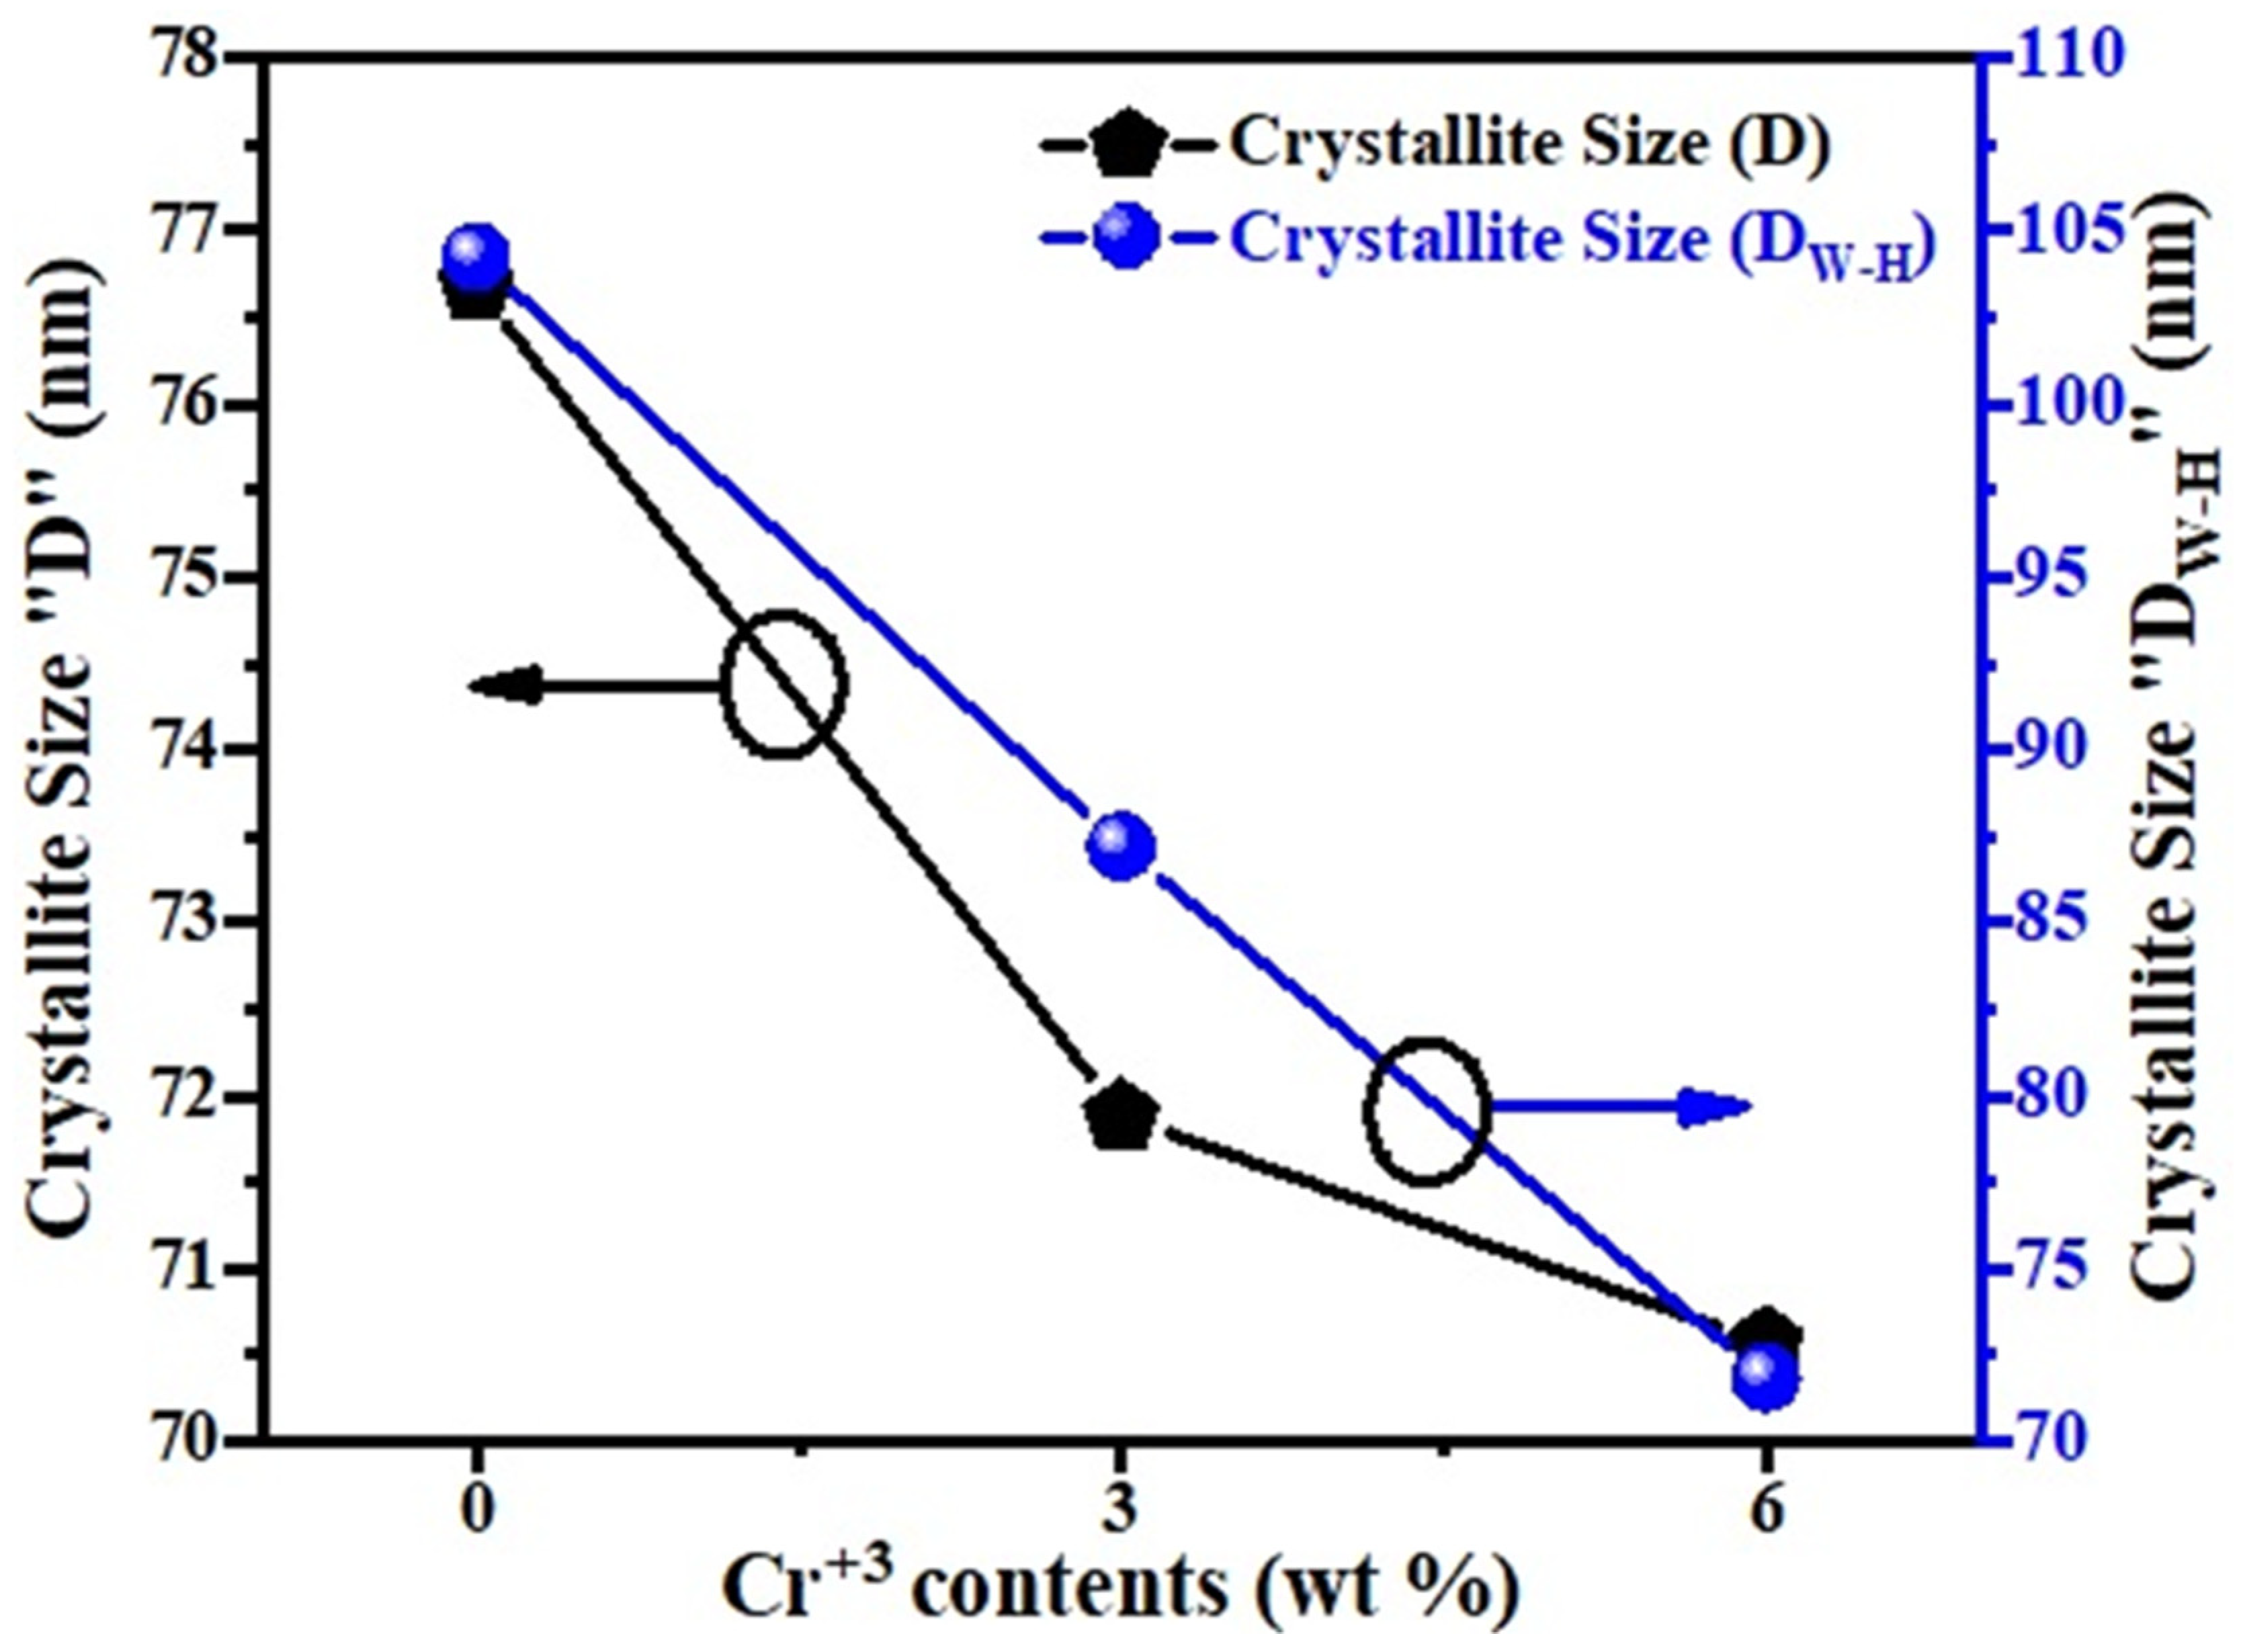
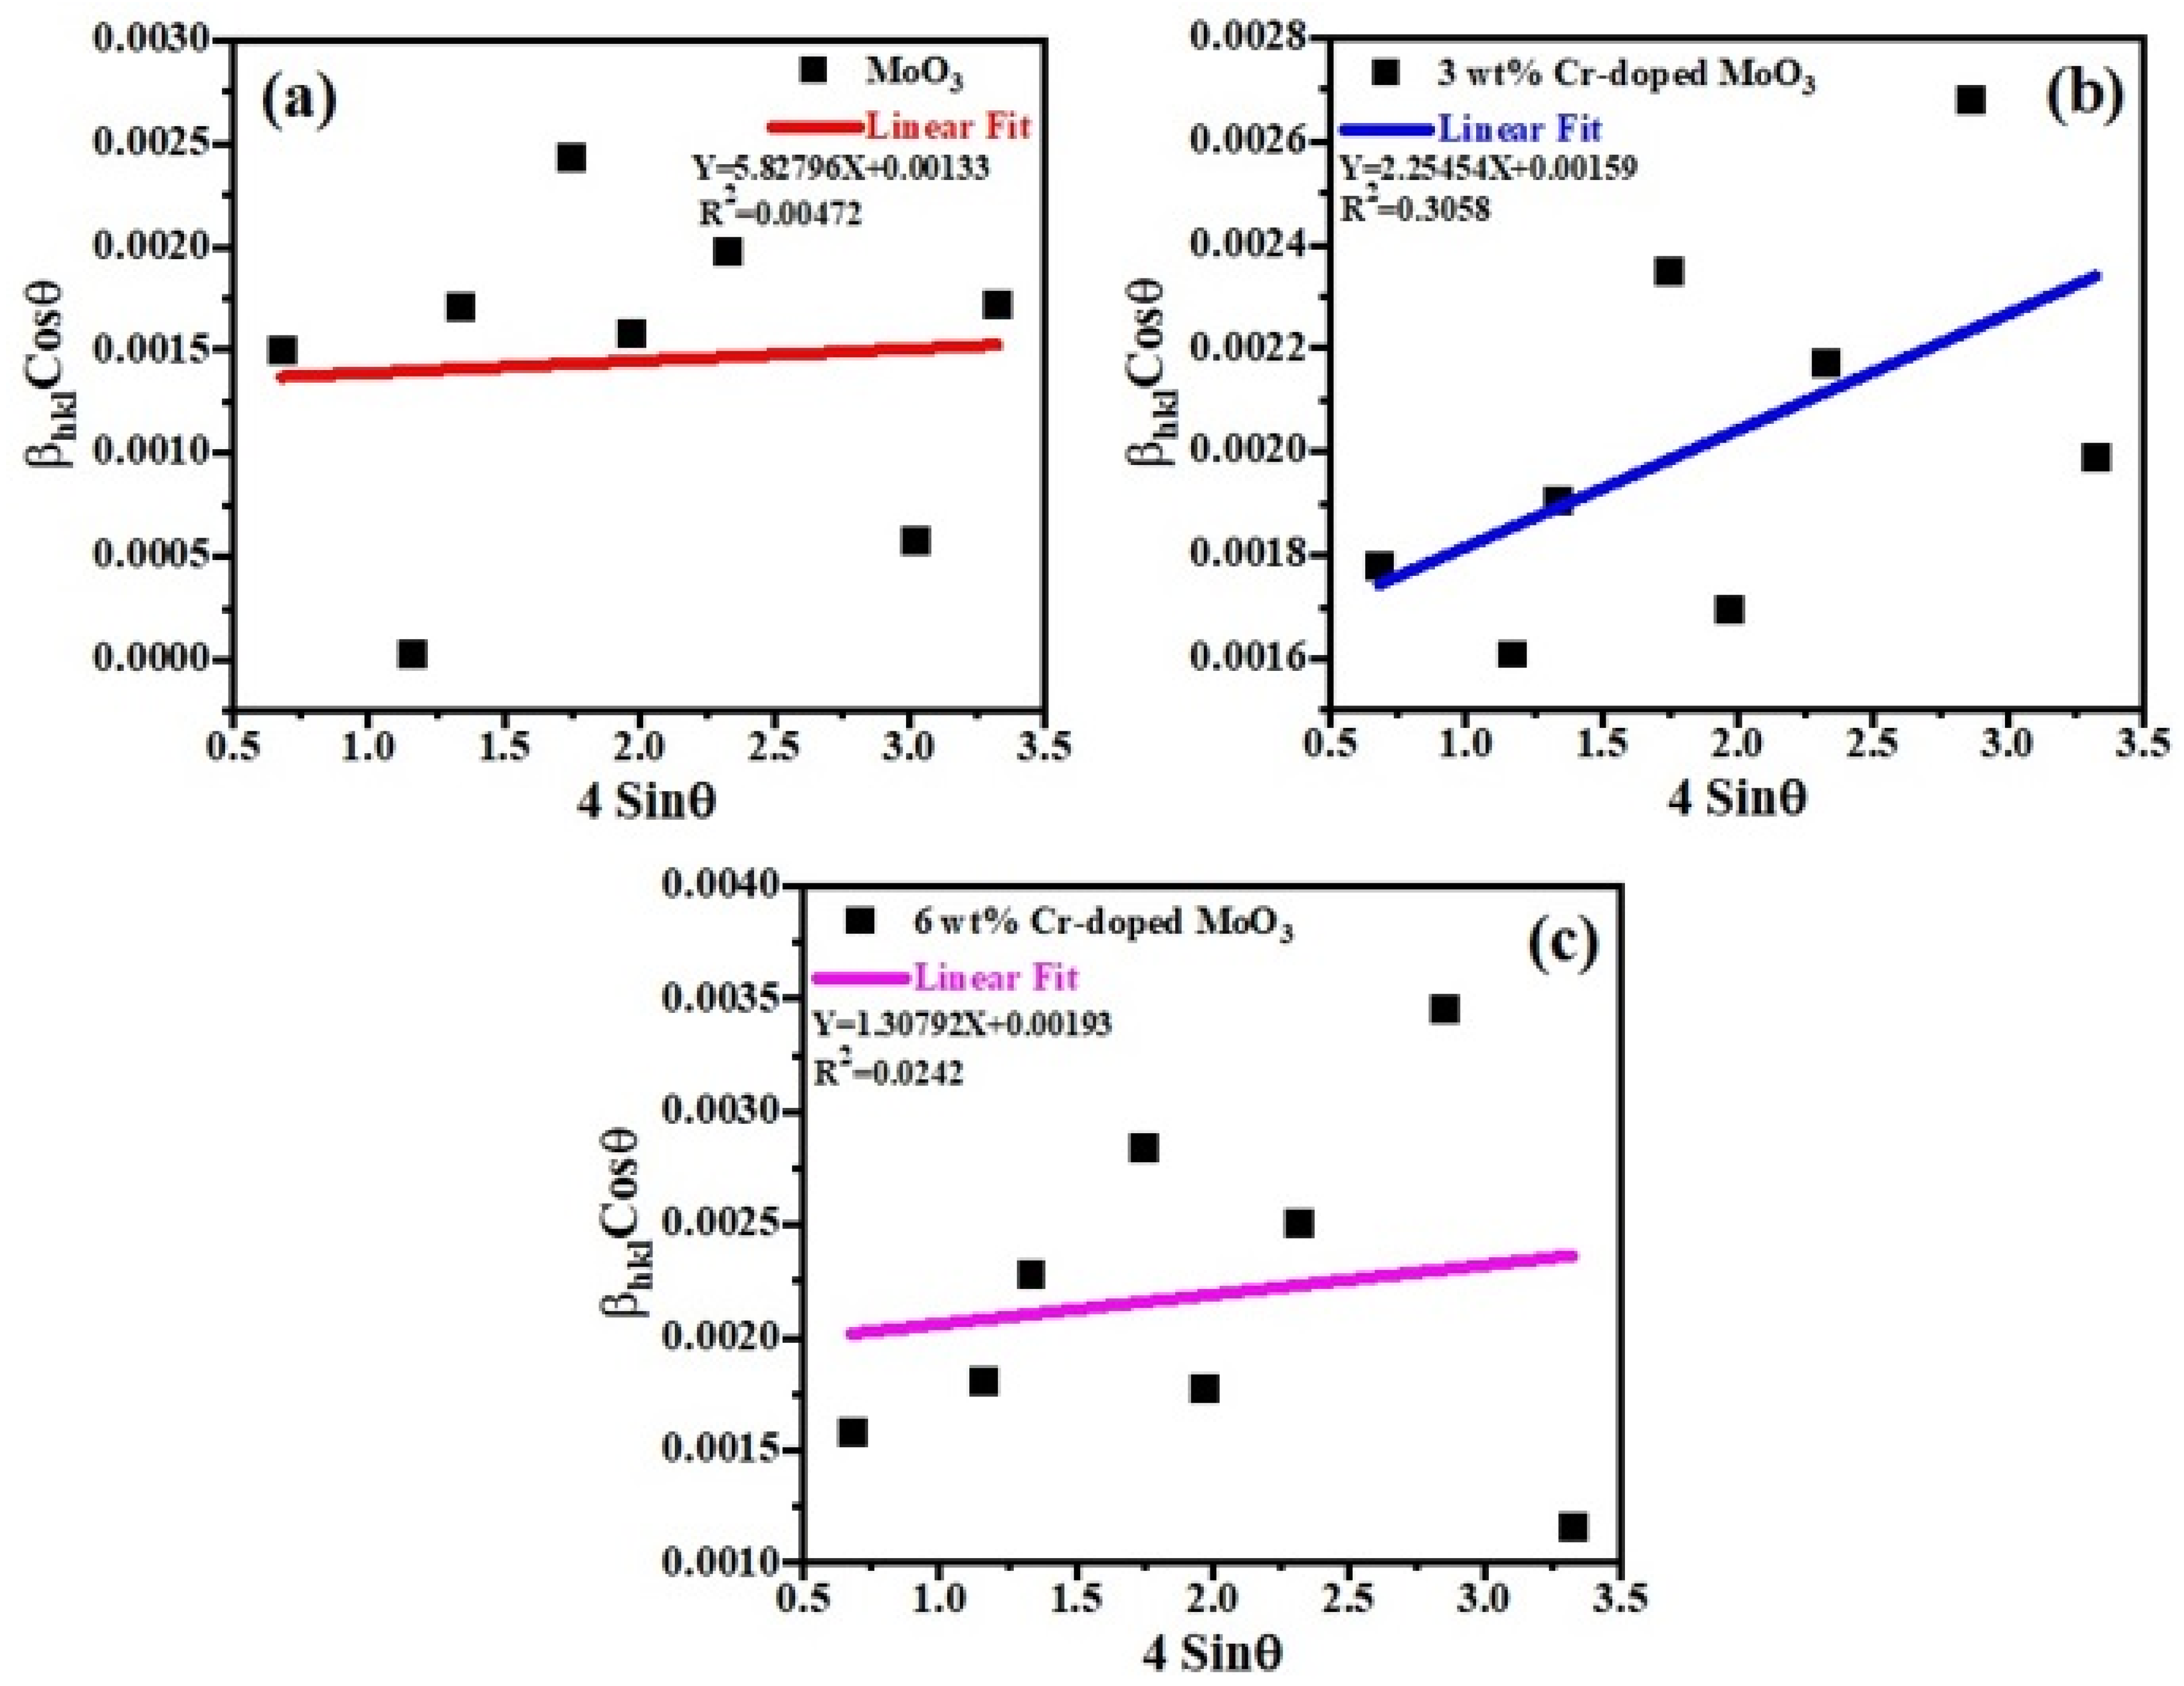
3.1. Phase Analysis

The crystal structure of the synthesized pure and Cr-doped MoO3 microrods was investigated by XRD method, as shown in Figure 1a,b. The observed diffraction peaks revealed the formation of a single-phase base composition MoO3 that corresponded to PDF card no. 00-021-0569, which shown the hexagonal crystal structure with space group (P63) [24,25]. The sharp and intense peaks depict the crystalline behavior of all the samples. Among these planes, the (2 1 0) plane at 26.07° revealed the maximum intensity. The base sample was indexed properly by using WinXpow software. It can also be observed that the lattice parameters as well as lattice volume increased with Cr-doped MoO3 microrods. Compared with the pure MoO3 sample, the corresponding diffraction peaks shifted to lower angles, the intensity of peaks increased, and the width of peaks also increased following the doping of Cr3+ contents. Moreover, the change of the peaks’ positions could be ascribed to the inhomogeneity and micro-strain in the samples or may be due to the substitution of the relatively larger ionic radius of Cr3+ (RCr = 0.61 Å) than Mo (RMo = 0.59 Å), which is consistent with the deduction of Bragg’s diffraction law (2dSinθ = mλ), as shown in Figure 1b [26,27].
The Debye Scherer equation is used to calculate the average crystalline size of all samples using the reflection of the 2θ value of the XRD data [28],
D = k λ β cos θ
where ‘D’ is the average crystallite size, the value of Scherer constant ‘k’ is 0.94, λ = 0.15406 nm is the wavelength of the X-ray beam, and β is the full-width half. This technique is used with XRD data, where the crystallite size (D) is associated with the expansion of intensive peaks. The instrumental contribution of β was removed before the analysis of the crystallite size and micro-strain.
Figure 2 presents the behavior of crystallite size. The crystallite size depended on the lattice micro-strain and radius of the substituted ions. It has been observed that generally the average crystallite size decreases with the increasing Cr3+ content (x), and this may be attributed to the growth of the crystal structure, which may be due to that the ionic radius of the substitution element, Cr3+, is larger than molybdenum [26].
A W–H (Williamson–Hall) plot is a very important technique for measuring the values of lattice parameters and crystallite size as well. Equation (2) was used to plot (W–H) graphs for all the samples [29].
β c o s θ = k λ D + 4 ε s i n θ
where β is the full width at half maximum (FWHM), θ is the Braggs angle, k is the size factor, λ is the wavelength of X-rays, and ‘D’ is the average crystallite size. Finding the slope of a linear plotted graph against 4 s i n θ gives the information about the lattice strain and crystalline size (DW–H) for all the samples (un-doped and Cr-doped), as shown in Figure 3 [30]. The effective values of crystallite size (DW–H) were measured by the Williamson–Hall (W–H) technique and were found to be 104.251 nm, 87.204 nm, and 71.842 nm for each sample. The average values of crystallite size (DW–H) and micro-strain (εWH) along with uncertainties were measured by the Williamson–Hall (W–H) technique, as shown in Table 1. Around the fitted line, the points are noticed to be widely scattered. It was observed that certain additional parameters of the characterized sample were not taken into consideration or some alternative method should have been adopted.

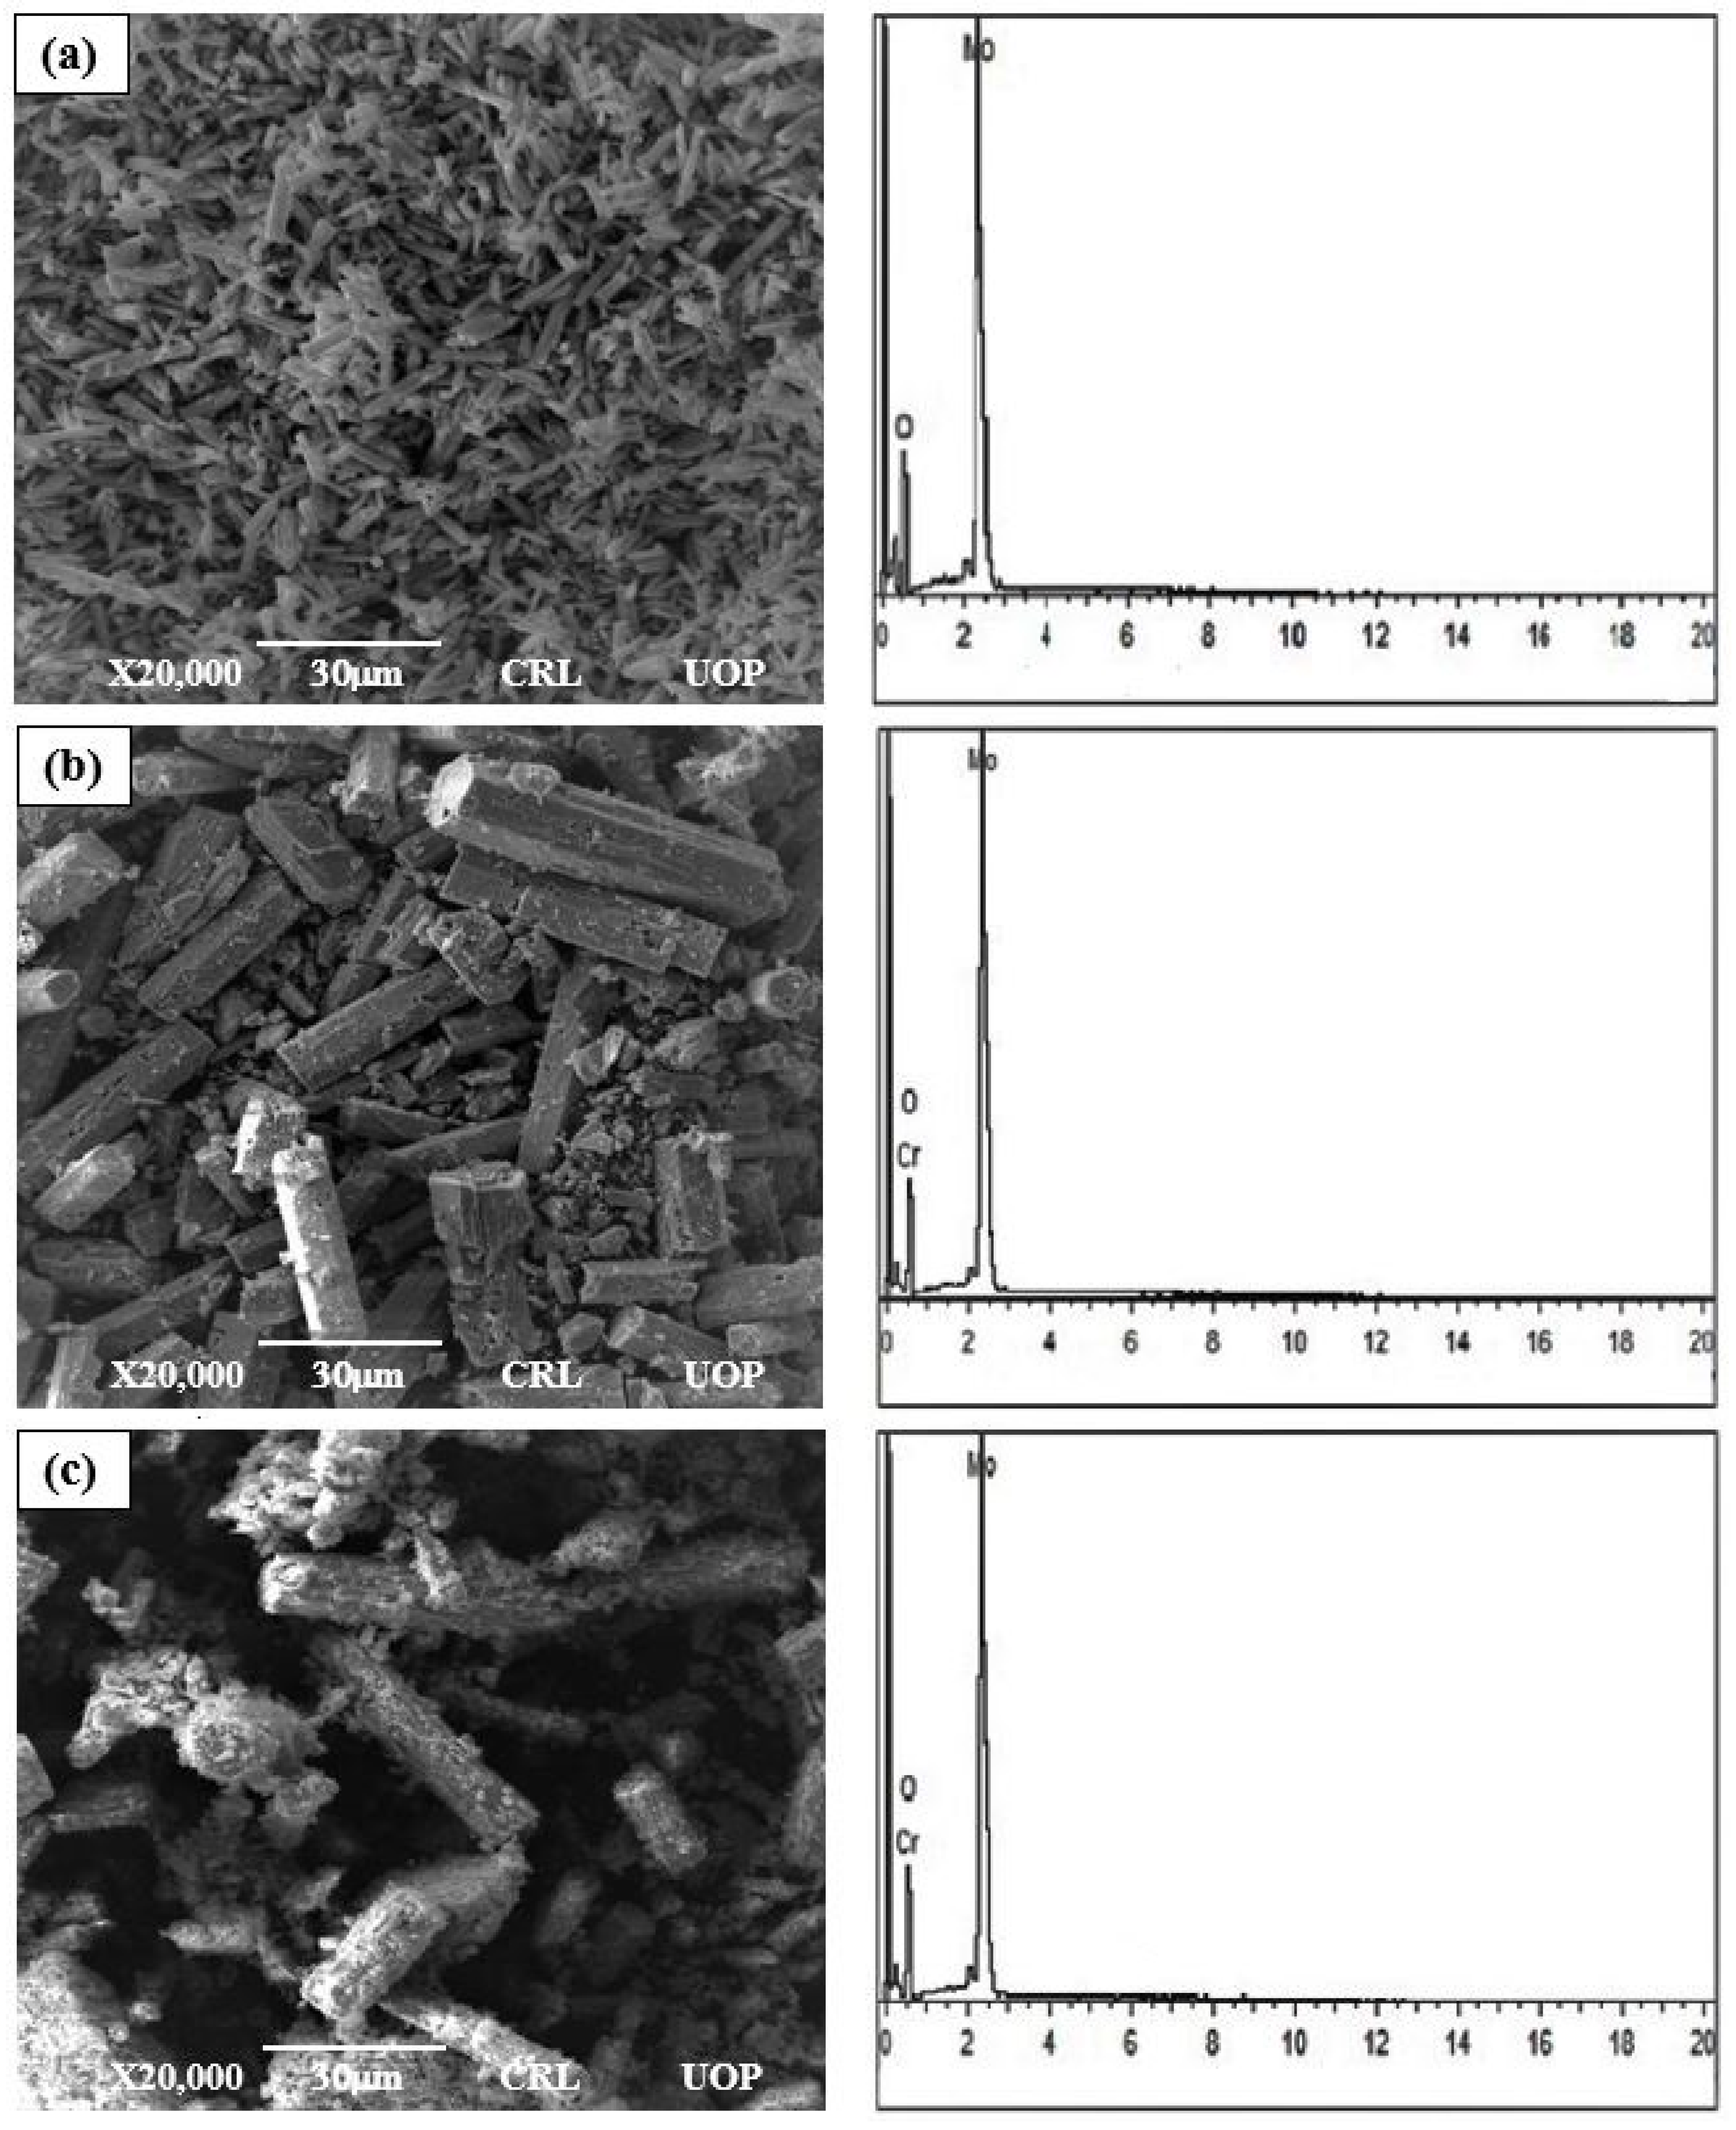
3.2. Surface Morphology

Figure 4a–c show the surface micrographs of un-doped and Cr-doped MoO3 microrods with ( × 20,000 ) magnification, respectively. In Figure 4a,b it can be clearly observed from SEM images that the size of microrods grow with the increase in Cr content. The surfaces of the synthesized rods are clean, but their crystal structures are found in spherical shape whose sizes are in the range of microns, which indicates its one-dimensional hexagonal rod geometry [6,31]. Figure 4c shows irregular surface structure microrods. Basically, these are the small microrods that are stacked together in a cluster shape, and their appearance shows to develop on the microrods’ surface [32]. It is clear from the image that the nanorods have poor morphology because the lengths and diameters of the nanorods are not uniform. The diameter of the microrods varies from 0.07 µm to 0.21 µm, seen by using ImageJ software. In addition, they are not well aligned in the direction perpendicular to the substrate. The reason for that may be that the surface of the substrate may not be smooth at the microscale or due to the miss-matching lattice structure, which greatly affects the morphology of microrods [33].
Figure 4a–c show that the EDX analysis was used to confirm the exact deposited number of elements in un-doped and Cr-doped MoO3 microrods. Figure 4b,c confirm the presence of Cr elements. The 3 wt% and 6 wt% of Cr was doped in the solid solution of MoO3 microrods. These compositions of Cr by atom % were calculated by using the following formulae:
C 1 = C 1 A 2 C 1 A 2 +   C 2 A 1 × 100 %
  C 2 = C 2 A 1 C 1 A 2 +   C 2 A 1 × 100 %
where C 1 is the atom %, C 1 is weight %, and A 1 is the atomic number of the un-doped elements, while   C 2 is the atom %, C 2 is weight %, and A 2   is the atomic number of the doped elements. Equations (3) and (4) represent the conversion of wt% into atom % of two elements. The values of all the samples by weight % and atom % are shown in Table 2.

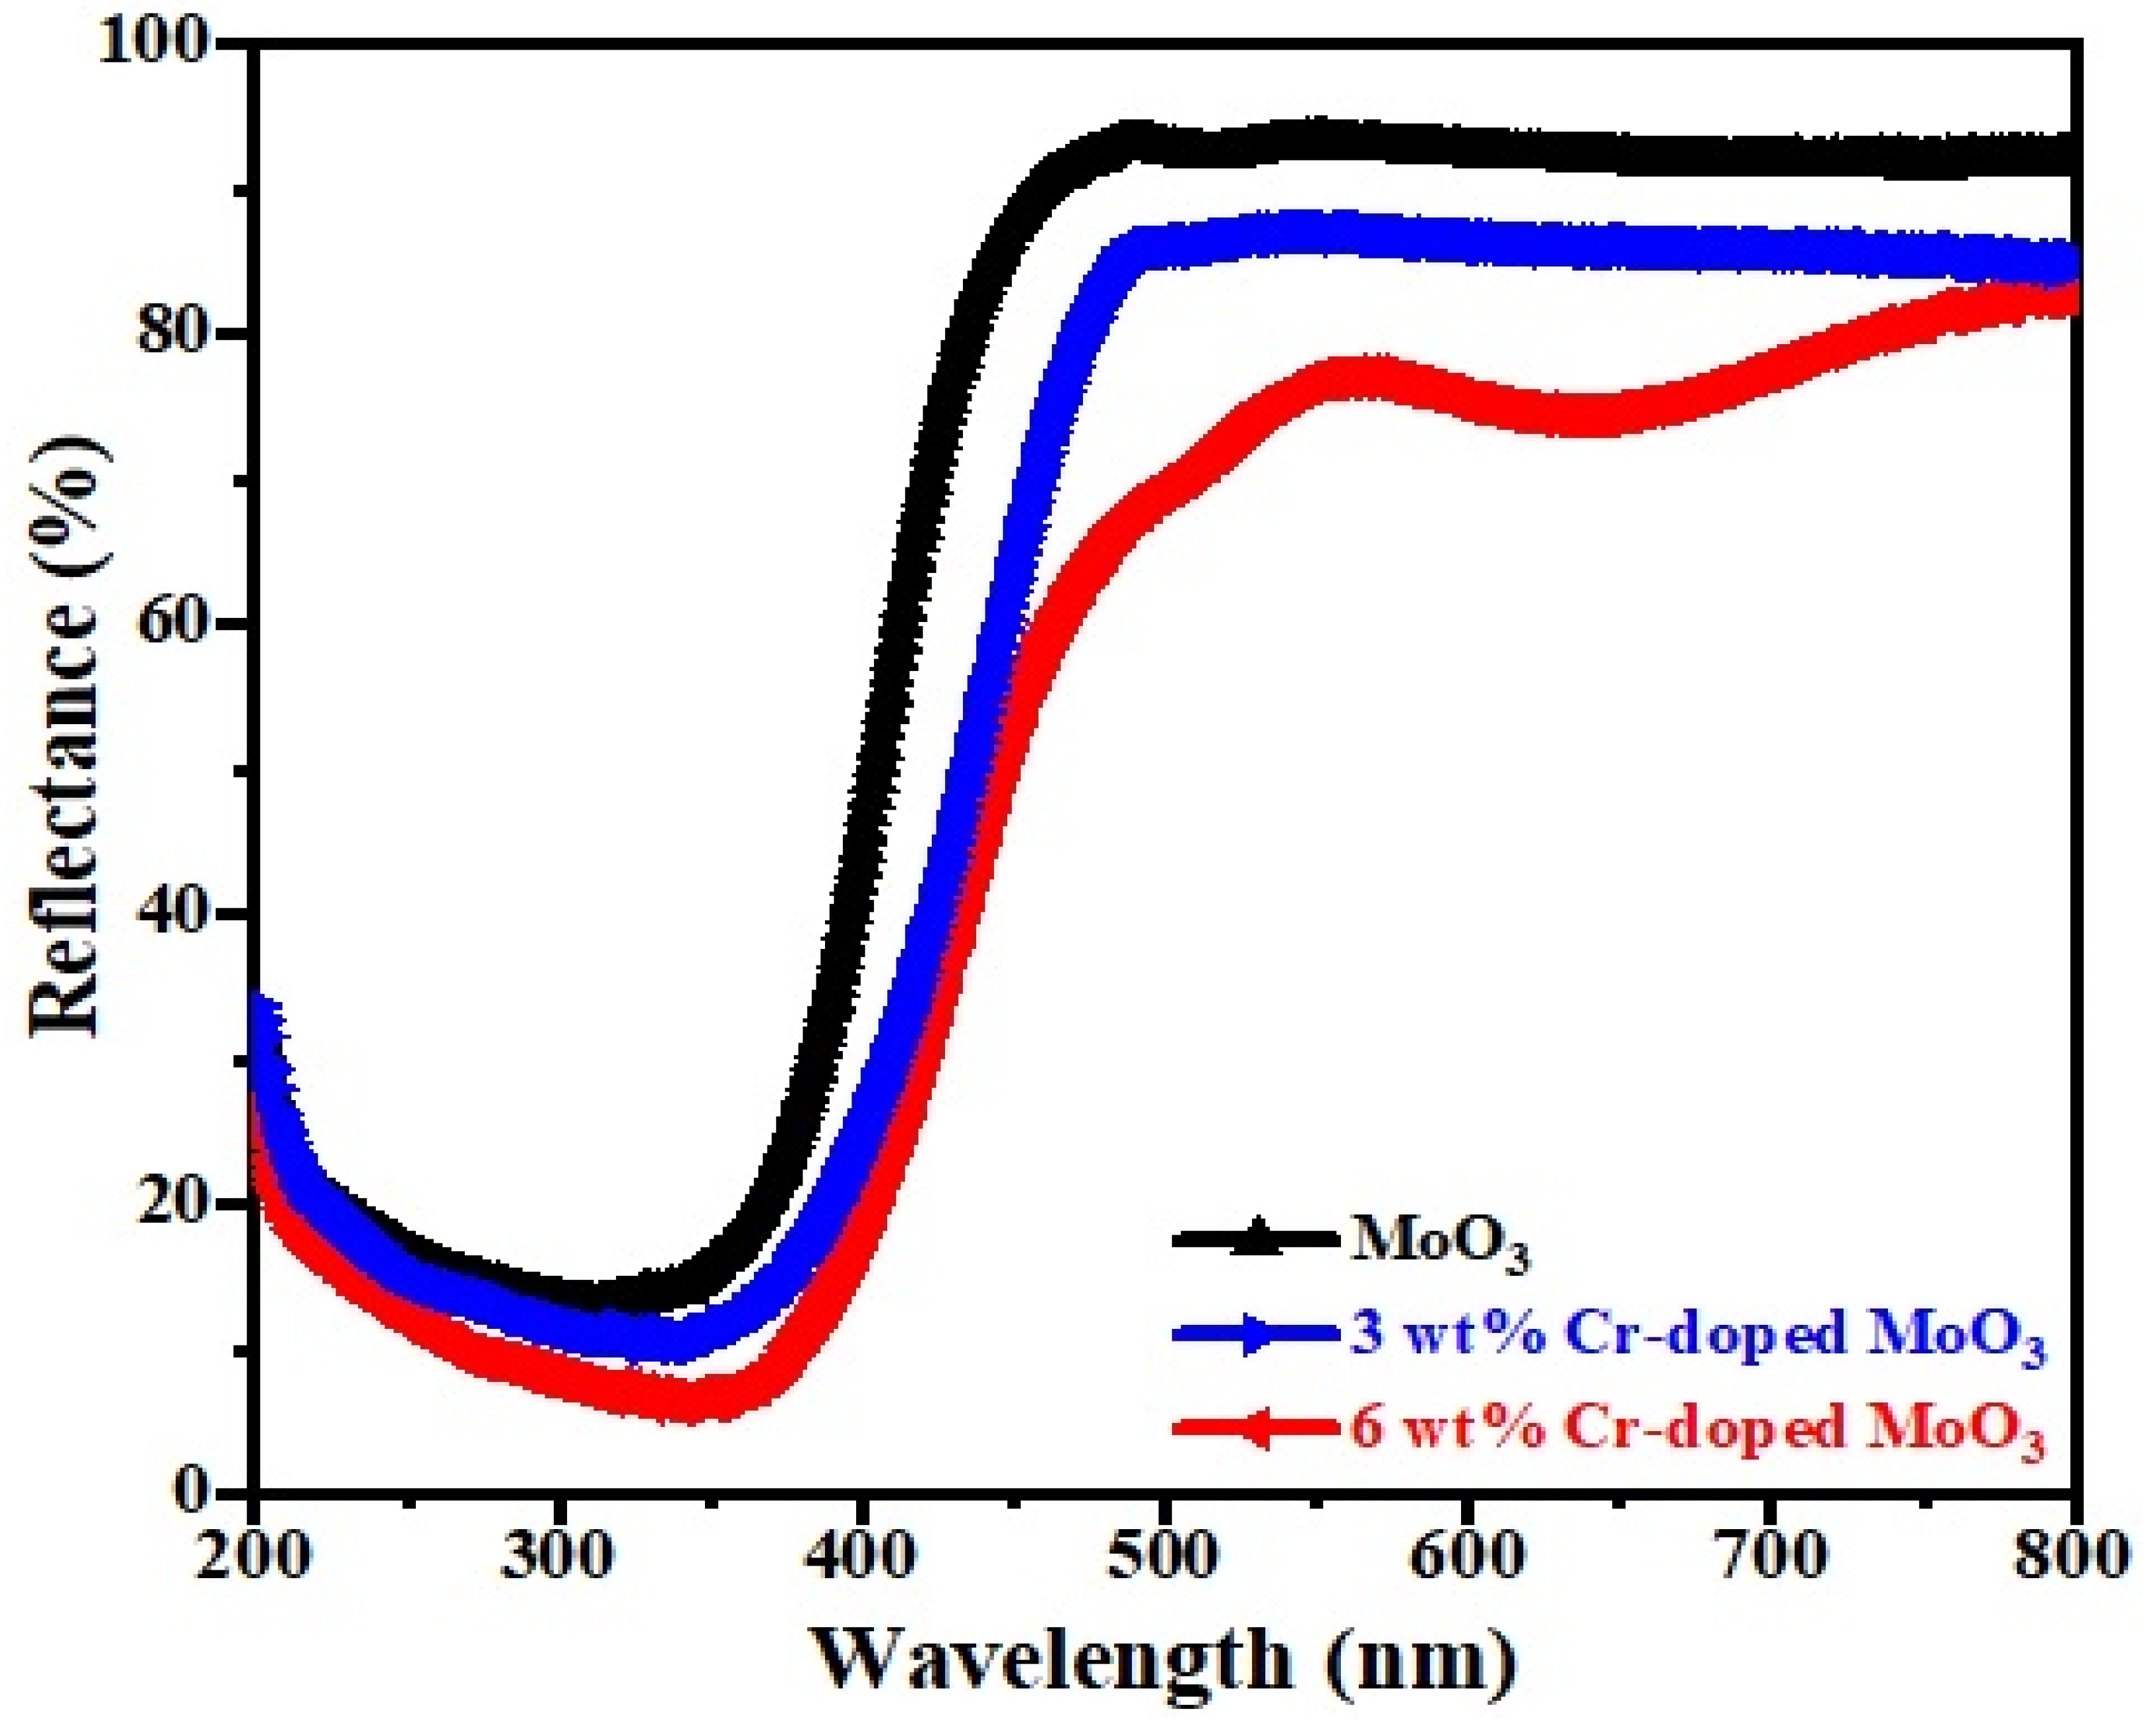
3.3. Diffuse Reflectance Spectroscopy

The optical absorption characterization of pure and Cr-doped MoO3 microrods was performed by diffuse reflectance spectra (DRS) in the range of 200 to 800 nm, as depicted in Figure 5. It was observed that there was a strong reflectance behavior between 450 nm and 500 nm that revealed the high absorption behavior within the visible region [34]. The sharp characteristic absorption band edge was found to be around 325 to 475 nm for each rod and the transition of the band gap was attributed to it by absorbing light from the visible range. The reflectance spectra demonstrated that the reflection percentage increased from 350 nm to 800 nm for upper absorption. The 340 nm spectrum indicated that the reflectance percentage was decreased due to the absorption behavior of the sample [35].

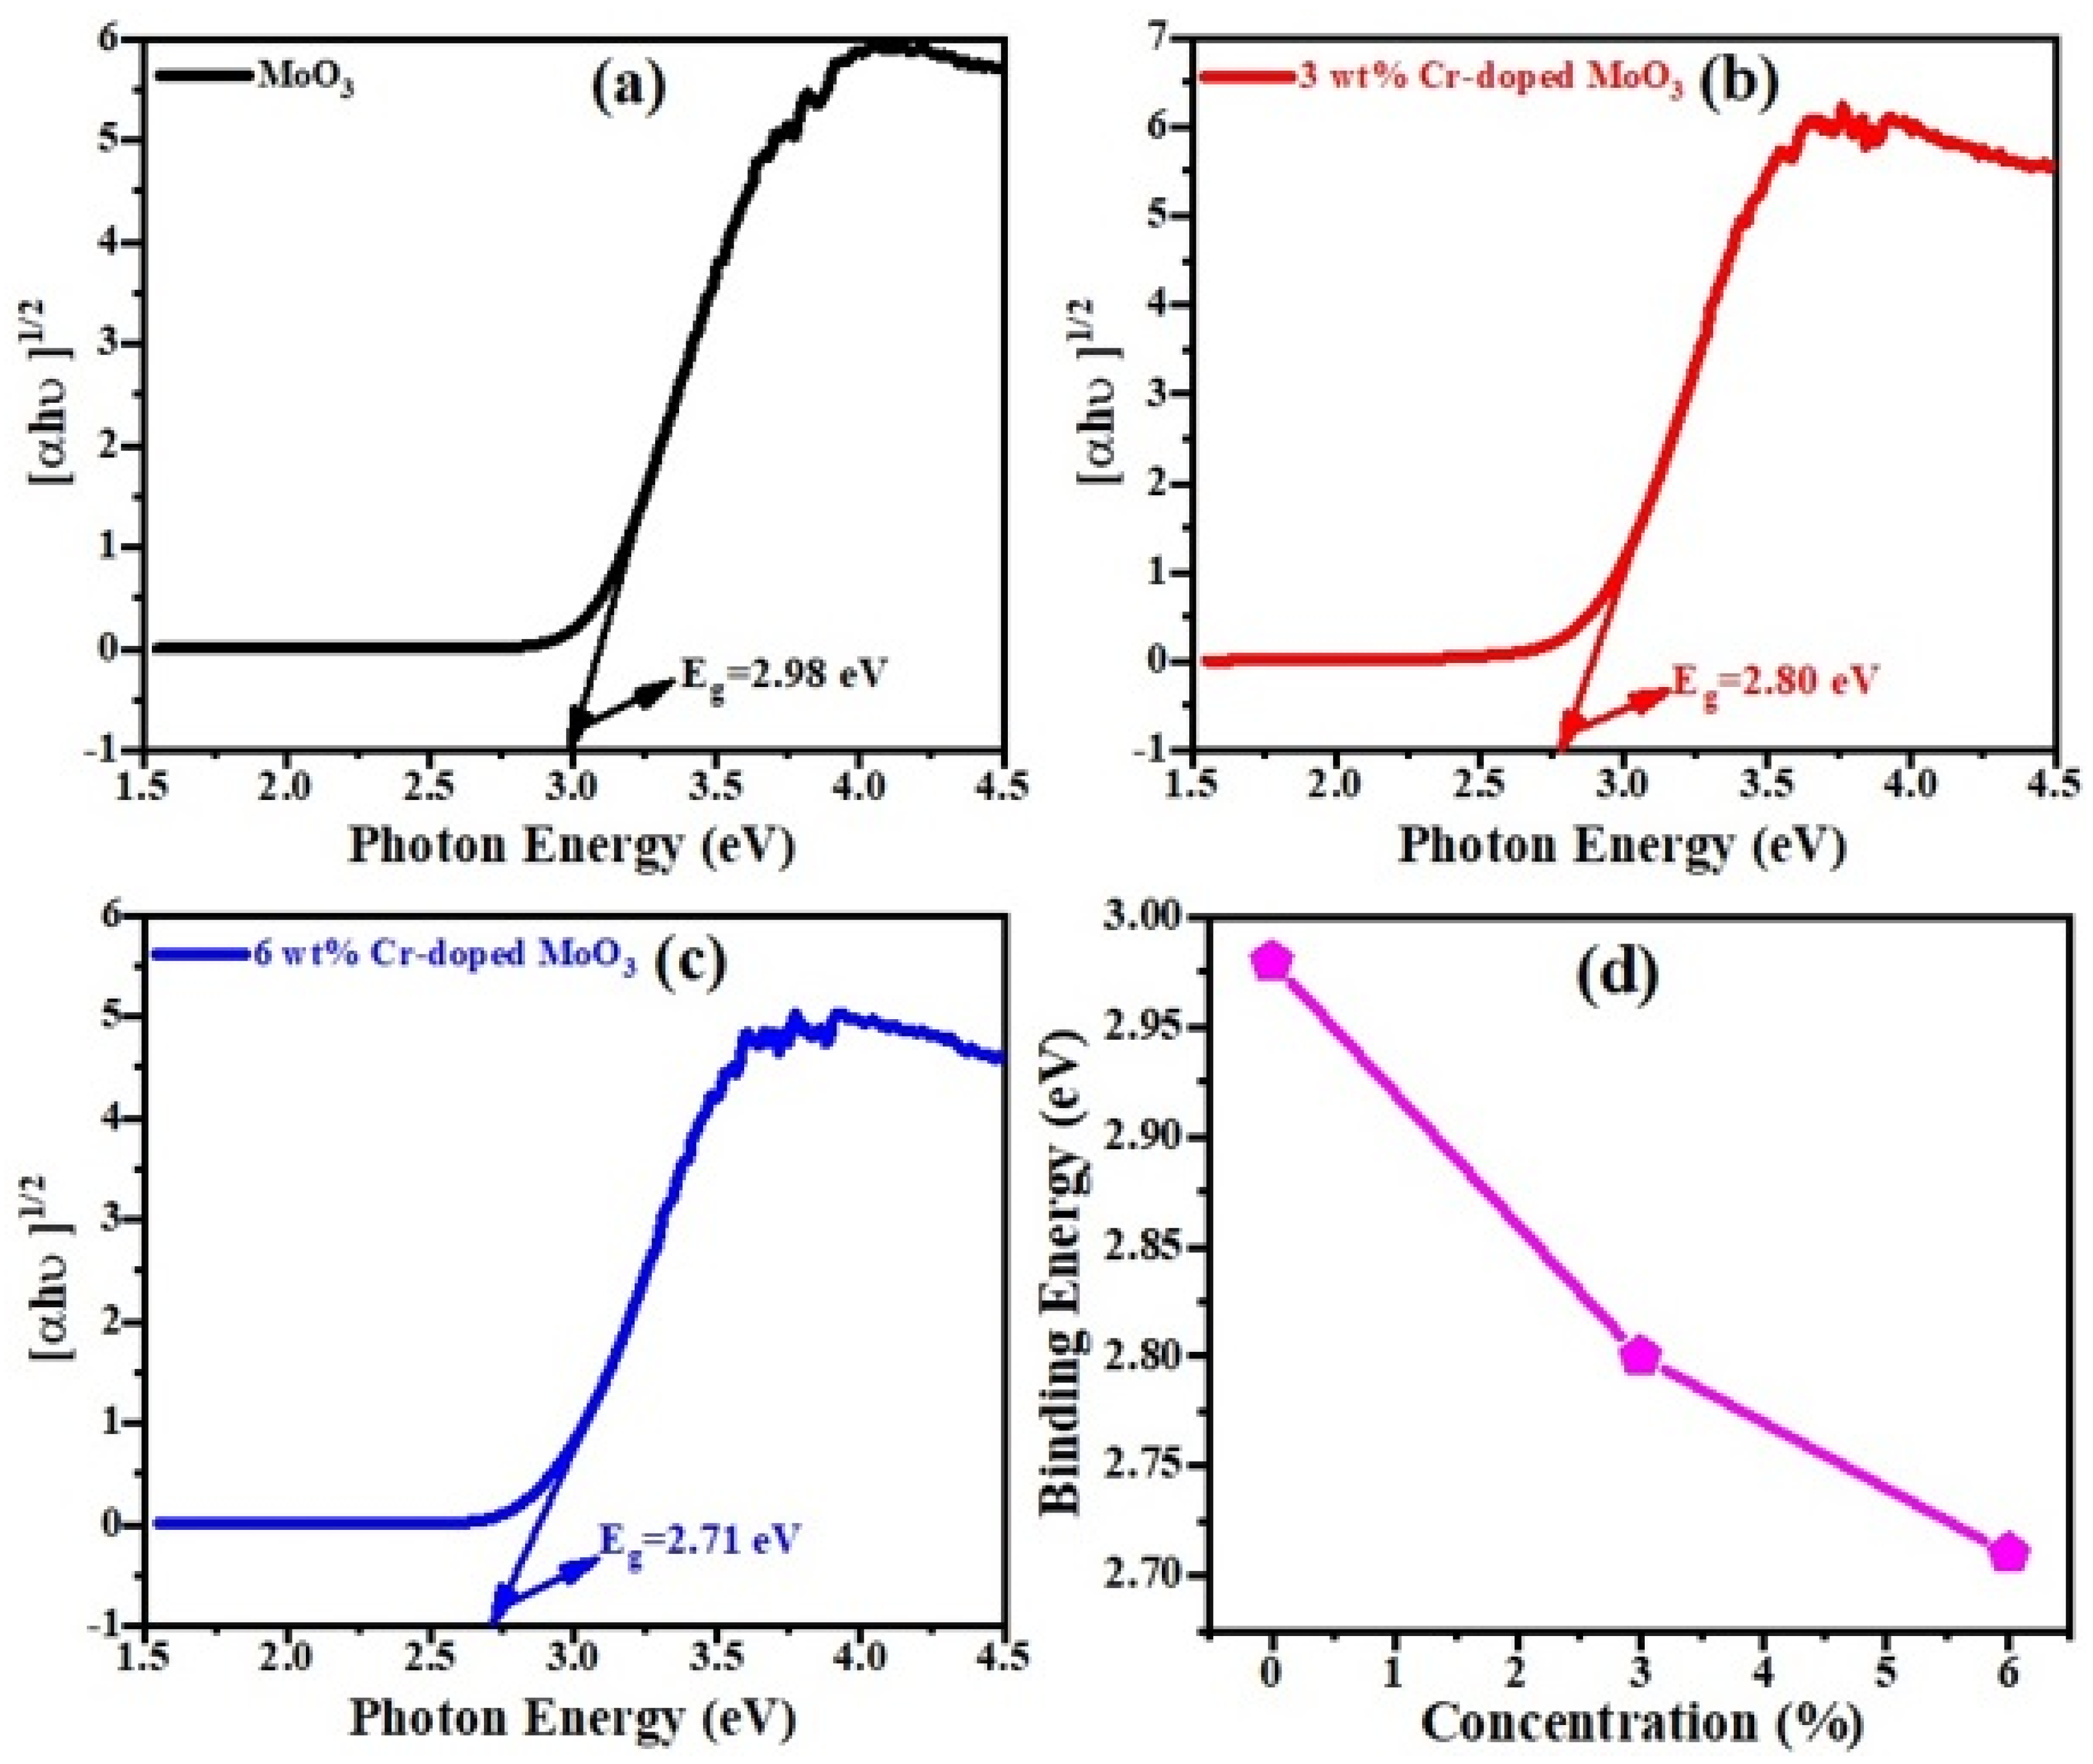
3.4. Optical Properties

Figure 6a–c show that the defect-free band structure was identified and the optical band gap was derived from the Kubeka–Munk function, which is [36];
F ( R ) = K ( λ ) S ( λ ) = ( 1 R ) n 2 R α = ( h v E g ) n h v                                                
where ‘F(R)’ is the re-emission function, ‘s(λ)’ is the scattering coefficient, ‘K(λ)’ is the absorption coefficient, ‘’ is the photon energy, ‘Eg’ is the band gap energy, ‘R’ is the diffuse reflectance, and ‘n’ is the exponent term that identifies the transition types, i.e., indirect transition (n = 1/2), direct transition (n = 2), indirect forbidden energy gap transitions (n = 1/3), and direct forbidden energy gap transition (n = 2/3). In this work, only indirect transition was considered for all samples. The band gap energy was predictable from the plot of F(R)2 and energy. Figure 6d shows the band gap energy of the un-doped and Cr-doped MoO3 microrods. The energy band gap of the pure MoO3 (2.98 eV) is greater than that of the Cr-doped MoO3 (2.71 eV). The band gap energy increases due to decreasing the particle size of the synthesized sample and reduces with increasing the dopants’ concentration, i.e., Cr or Ni [37,38,39]. Generally, band gap energy decreases with increasing doping compositions.
There is also the possibility of creating oxygen vacancy, which can also reduce the band gap energy of MoO3. The band gap energy values of pure and doping samples are shown in the Table 3.

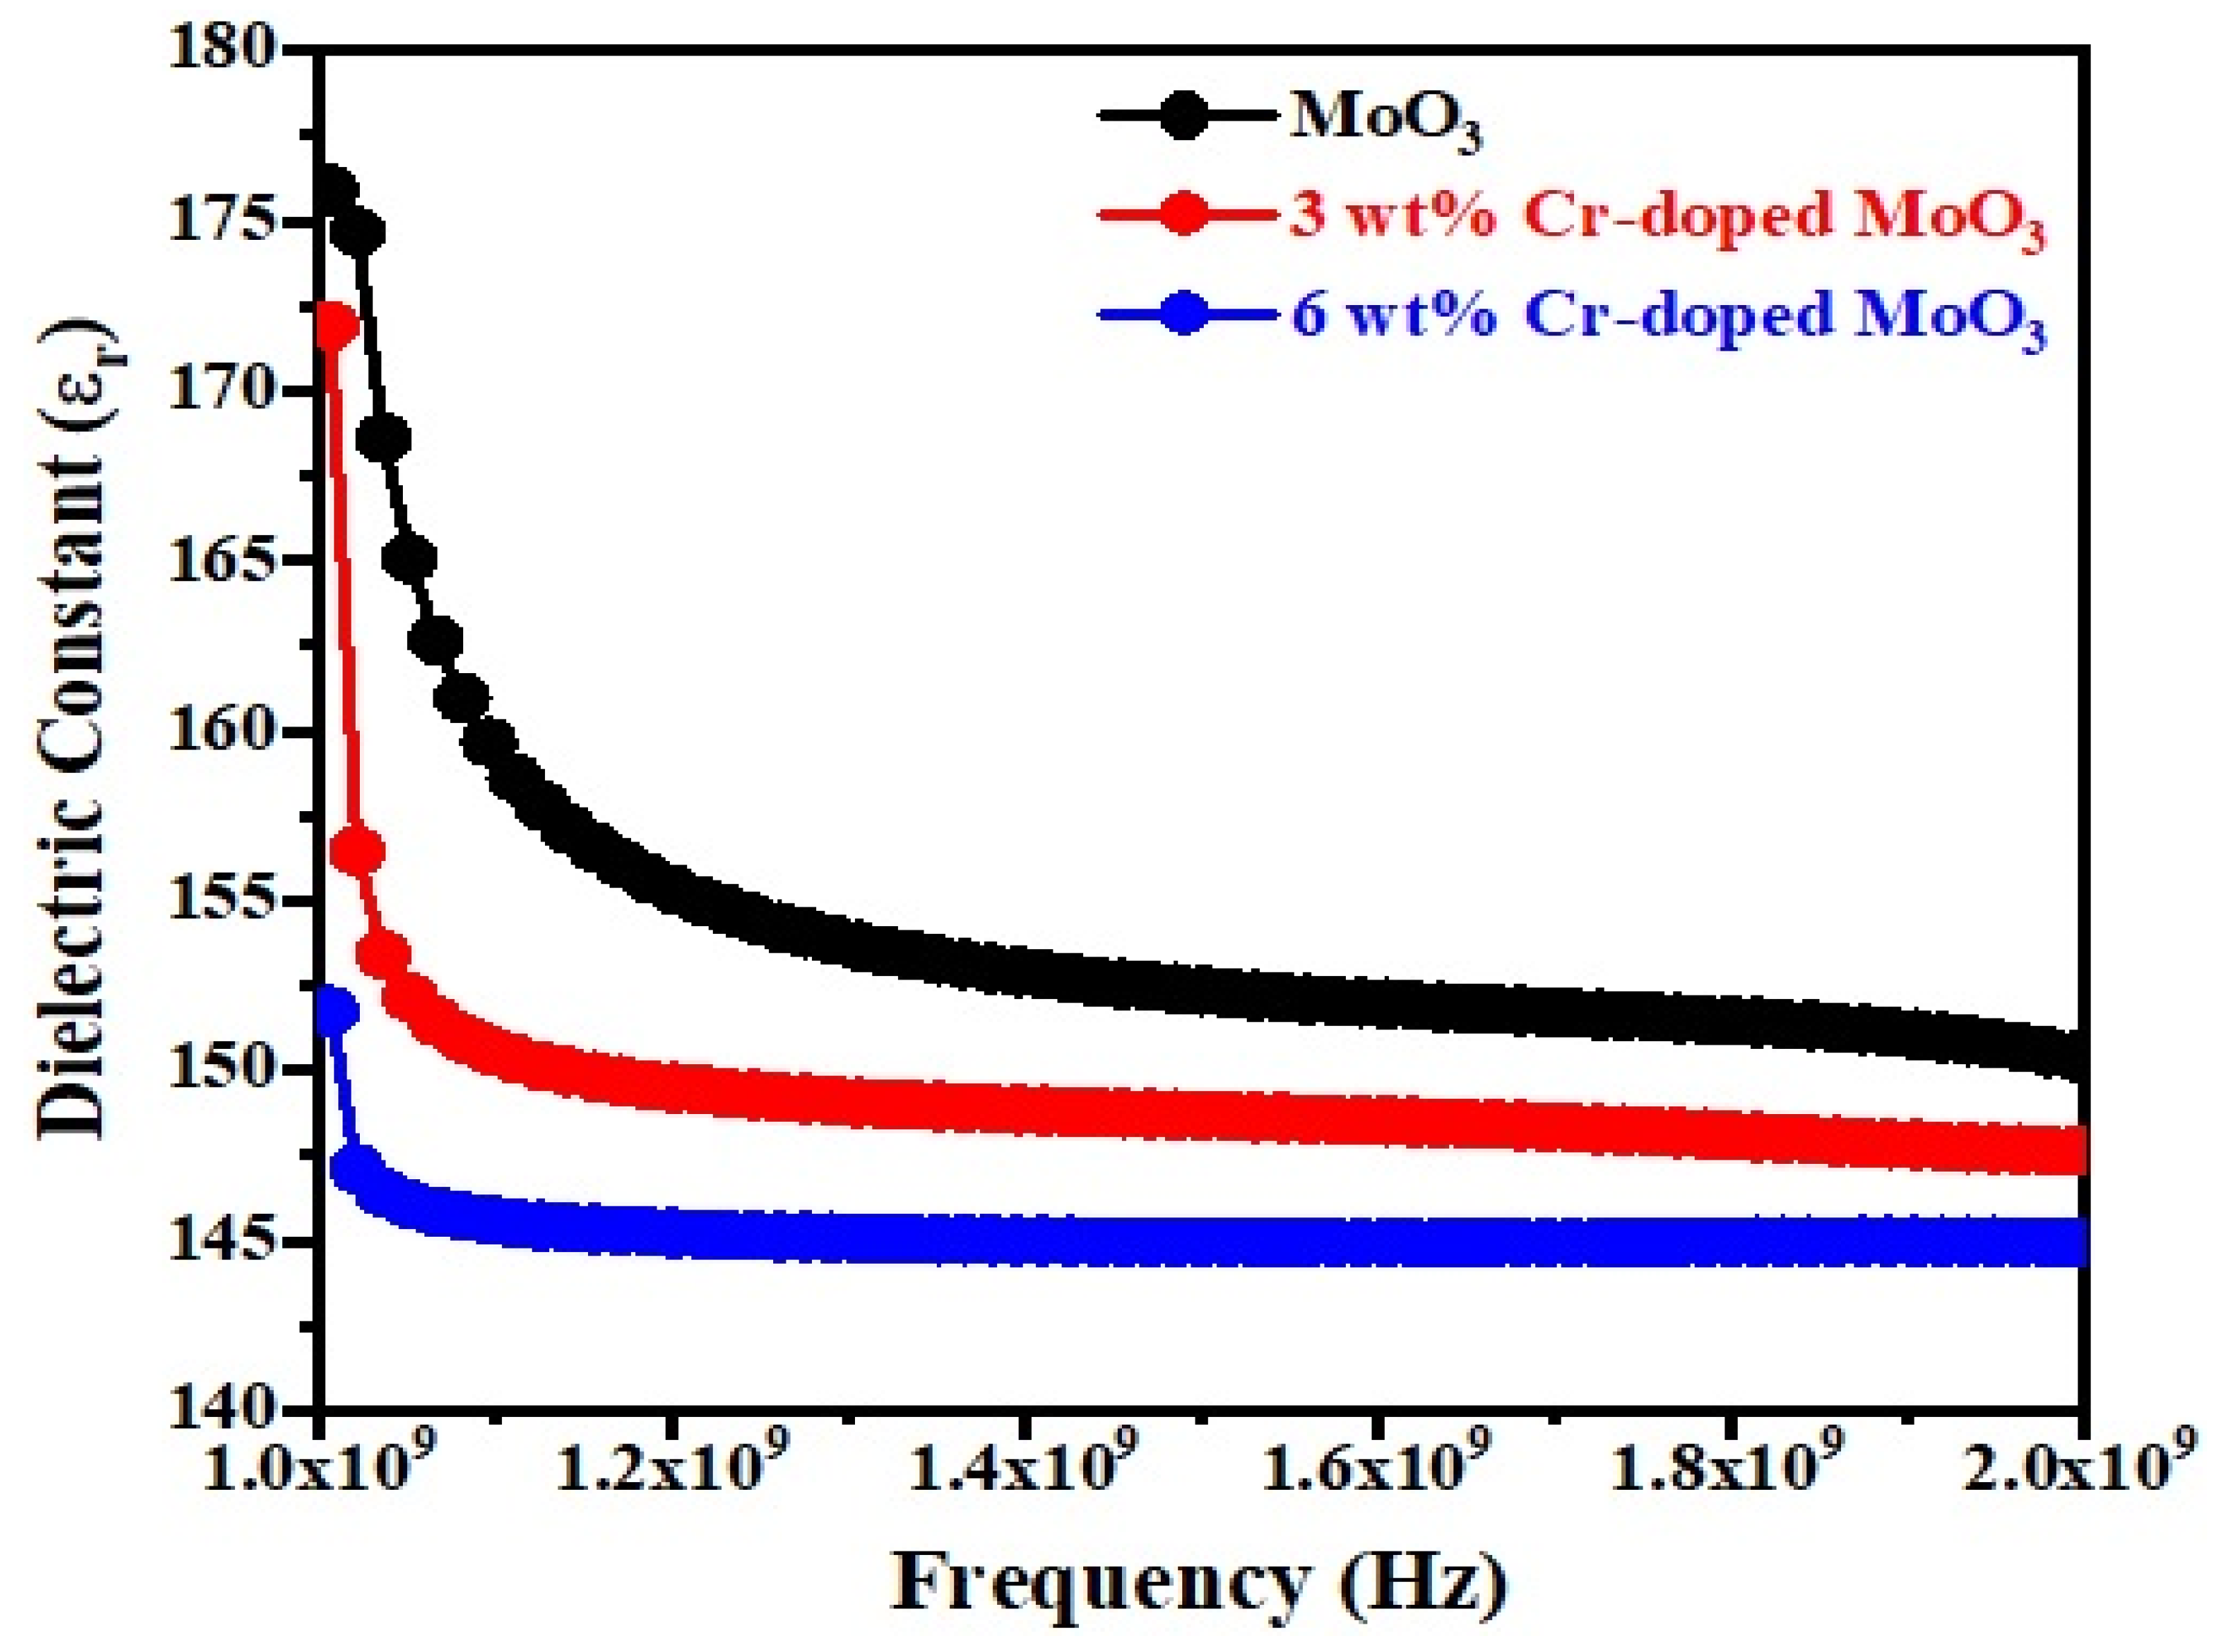
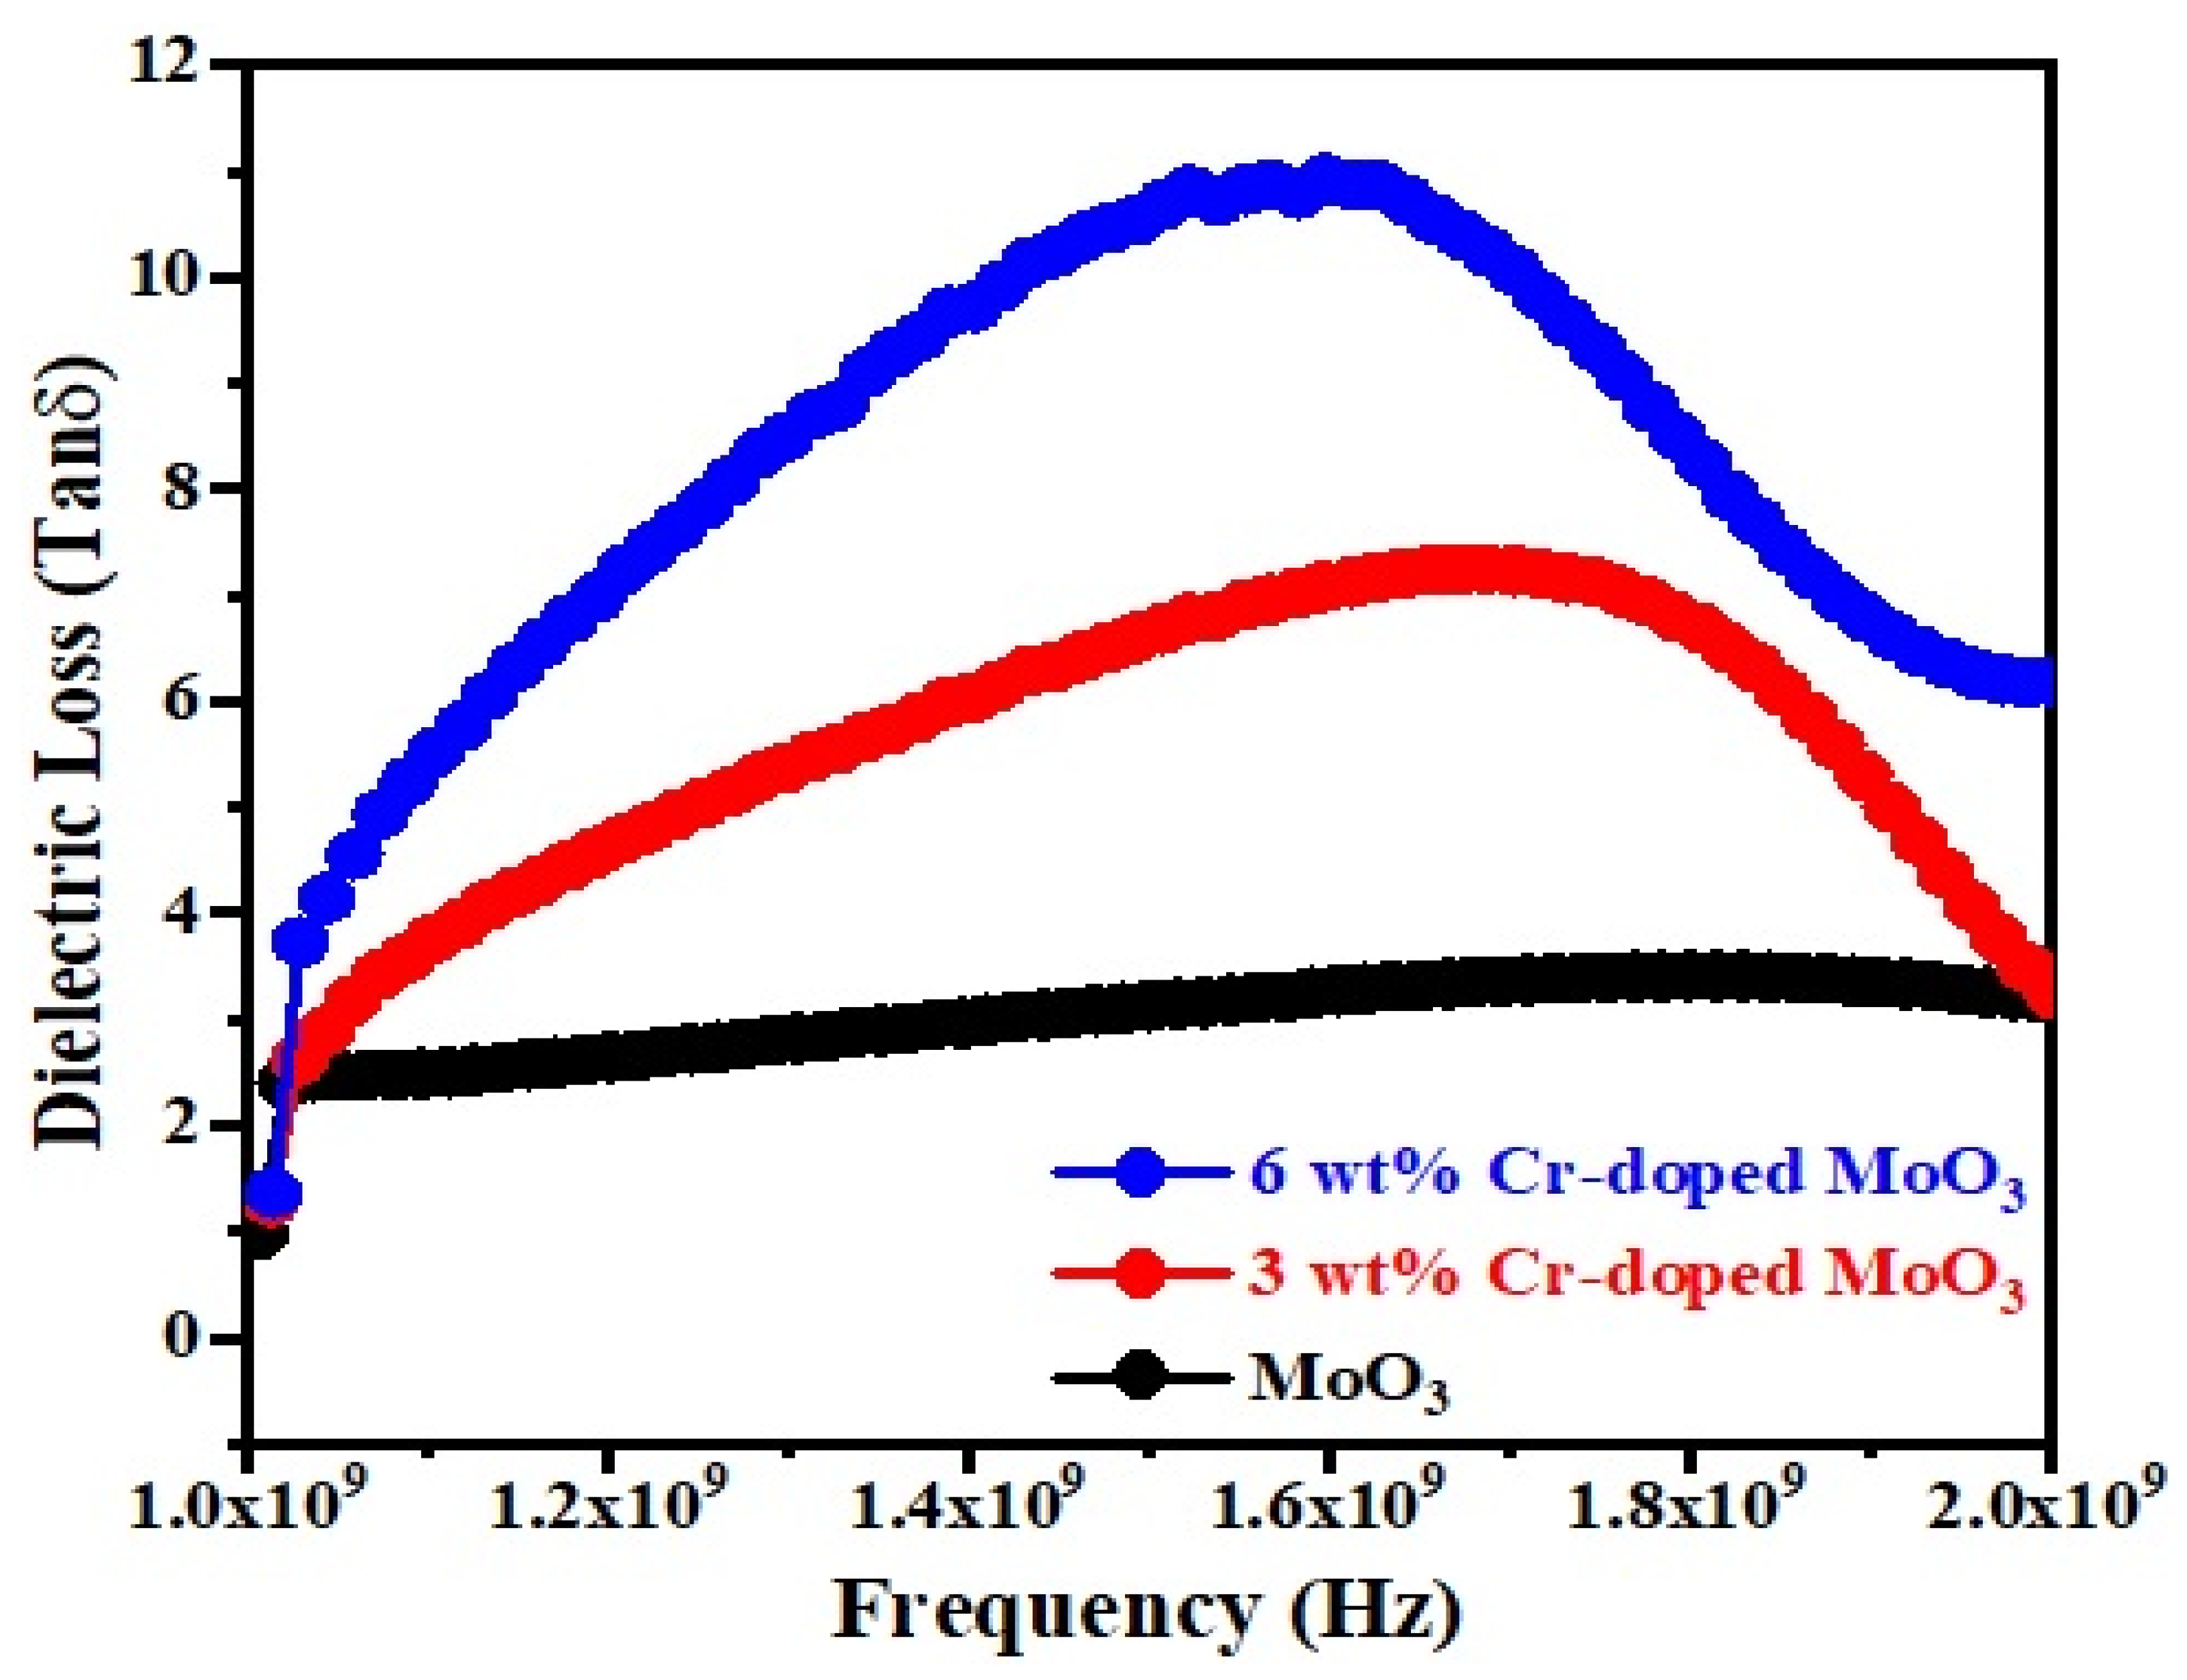
3.5. Dielectric Properties

Figure 7 and Figure 8 show the frequency dependence of the dielectric constant (εr) and dielectric loss (Tanδ) of un-doped and Cr-doped MoO3 microrods. The value of the dielectric constant of MoO3 decreases with the increases in frequency as well as Cr3+ (Figure 7). This might be due to the alignment of permanent dipoles with the direction of the electric field at lower frequencies, which contributes to the dielectric material’s total polarization. On the other hand, the dipole can no longer follow the field at higher frequencies since the field rapidly varies [40]. The dielectric loss of MoO3 increases with the increases in frequency as well as Cr3+ contents (Figure 8). It increases to a maximum value, after which it goes to a lower value. The peak is observed between 1.6–1.8 GHz frequency ranges. This may be due to the dielectric relaxation phenomena occurring in the compound [41]. The tangent loss (tanδ) caused by the dipole relaxation phenomena decreases with frequency, as seen in the tanδ frequency plots [42].

4. Conclusions

In the current study, pure and Cr-doped MoO3 microrods were successfully synthesized via the sol gel auto combustion method. The average crystallite size, lattice parameter, and average micro-strain value change when Cr3+ ions are doped in MoO3 were found. The formation of a hexagonal structure with P63 symmetry was confirmed by phase analysis. The average crystallite size (D) also decreased from 76.69 nm to 70.57 nm. The optical band gap energies of 2.98, 2.80, and 2.71 eV were recorded for 0 wt%, 3 wt%, and 6 wt% Cr-doped MoO3 microrods, respectively. The surface morphology of all the samples revealed the formation of microrods with different sizes (small and large). The micropores were observed in the group of hexagonal microrods. Dielectric studies showed that both the dielectric constant and tangent loss are frequency- as well as concentration-dependent. The obtained results declared that MoO3 is an appropriate host material for all the transition metals or minerals which are used for the application of optoelectronic devices.

Author Contributions

This work was carried out in collaboration among all authors. A.Z., N.K.S. and V.T. writing, review, editing and analysis of the manuscript. A.A. (Asad Ali) and M.A. (Mujahid Abbas) did the final review, corrections, and editing. M.M., A.A. (Aiyeshah Alhodaib), M.A. (Mona AlHarbi), N.K.S. and V.T. helps in Software and Validation. Z.H.K., A.H.J. and M.A. (Mohammed Aljohani) helps in prepared Content analysis, graphical arrangements and Formal analysis. All authors read and approved the final manuscript.

Funding

Deanship of Scientific Research at King Khalid University, Abha, Kingdom of Saudi Arabia through the General Research Project under grant number GRP/256/43.

Data Availability Statement

Generated data should be publicly available and cited in accordance with journal guidelines.

Acknowledgments

The authors extend their appreciation to the Deanship of Scientific Research at King Khalid University, Abha, Kingdom of Saudi Arabia for funding this work through the General Research Project under grant number GRP/256/43.

Conflicts of Interest

The authors declare no conflict of interest.

References

  1. Doss, V.A.; Chithambararaj, A.; Bose, A.C. Effect of reaction atmosphere on structural and optical properties of hexagonal molybdenum oxide (h-MoO3). AIP Conf. Proc. 2016, 1731, 050049. [Google Scholar]
  2. Hu, H.; Deng, C.; Xu, J.; Zhang, K.; Sun, M. Metastable h-MoO3 and stable α-MoO3 microstructures: Controllable synthesis, growth mechanism and their enhanced photocatalytic activity. J. Exp. Nano. 2015, 10, 1336–1346. [Google Scholar] [CrossRef]
  3. Wongkrua, P.; Thongtem, T.; Thongtem, S. Synthesis of h-and α-MoO3 by refluxing and calcination combination: Phase and morphology transformation, photocatalysis, and photosensitization. J. Nano Mater. 2013, 2013, 79. [Google Scholar]
  4. Brezesinski, T.; Wang, J.; Tolbert, S.H.; Dunn, B. Ordered mesoporous α-MoO3 with iso-oriented nanocrystalline walls for thin-film pseudocapacitors. Nat. Mater. 2010, 9, 146–151. [Google Scholar] [CrossRef]
  5. Ren, P.; Liu, X.; Zhang, K.; Zhang, P.; Teng, F.; Zhang, Z.; Xie, E.; Yan, P. Green photoluminescence from erbium-doped molybdenum trioxide. Mater. Lett. 2014, 122, 320–322. [Google Scholar] [CrossRef]
  6. Li, W.; He, S.; Feng, L.; Yang, W. Cr-doped a-MoO3 nanorods for the fast detection of triethylamine using a pulse-heating strategy. Mater. Lett. 2019, 250, 143–146. [Google Scholar] [CrossRef]
  7. Balendhran, S.; Deng, J.; Ou, J.Z.; Walia, S.; Scott, J.; Tang, J.; Wang, K.L.; Field, M.R.; Russo, S.; Zhuiykov, S.; et al. Enhanced Charge Carrier Mobility in Two-Dimensional High Dielectric Molybdenum Oxide. Adv. Mater. 2012, 25, 109–114. [Google Scholar] [CrossRef]
  8. Rahmani, M.B.; Keshmiri, S.H.; Yu, J.; Sadek, A.Z.; Al-Mashat, L.; Moafi, A.; Kalantar-Zadeh, K. Gas sensing properties of thermally evaporated lamellar MoO3. Sens. Actuators B Chem. 2010, 145, 13–19. [Google Scholar] [CrossRef]
  9. Chiang, T.H.; Yeh, H.C. The synthesis of α-MoO3 by ethylene glycol. Materials 2013, 6, 4609–4625. [Google Scholar] [CrossRef]
  10. Varghese, J.; Siponkoski, T.; Nelo, M.; Sebastian, M.T.; Jantunen, H. Microwave dielectric properties of low-temperature sinterable α-MoO3. J. Eur. Ceram. Soc. 2018, 38, 1541–1547. [Google Scholar] [CrossRef]
  11. Verma, R.; Raman, R.K.; Varadaraju, U.V. Disodium dimolybdate: A potential high-performance anode material for rechargeable sodium ion battery applications. J. Solid State Electrochem. 2016, 20, 1501–1505. [Google Scholar] [CrossRef]
  12. Xuan, H.C.; Zhang, Y.Q.; Xu, Y.K.; Li, H.; Han, P.D.; Wang, D.H.; Du, Y.W. A facile route to large-scale synthesis MoO2 and MoO3 as electrode materials for high-performance supercapacitors. Phys. Status Solidi (A) 2016, 213, 2468–2473. [Google Scholar] [CrossRef]
  13. Ke, H.; Saihuan, H.; Wei, Y.; Qifeng, T. Ag nanoparticles-decorated a-MoO3 nanorods for remarkable and rapid triethylamine-sensing response boosted by pulse-heating technique. J. Alloy. Compd. 2019, 808, 151704. [Google Scholar]
  14. Greiner, M.T.; Lu, Z.H. Thin-film metal oxides in organic semiconductor devices: Their electronic structures, work functions and interfaces. NPG Asia Mater. 2013, 5, e55. [Google Scholar] [CrossRef]
  15. Wang, Z.; Freer, R. Low firing temperature zinc molybdate ceramics for dielectric and insulation applications. J. Eur. Ceram. Soc. 2015, 35, 3033–3042. [Google Scholar] [CrossRef]
  16. Majhi, K.; Bertoluzzi, L.; Rietwyk, K.J.; Ginsburg, A.; Keller, D.A.; Lopez-Varo, P.; Anderson, A.Y.; Bisquert, J.; Zaban, A. Combinatorial Investigation and Modelling of MoO3Hole-Selective Contact in TiO2|Co3O4|MoO3All-Oxide Solar Cells. Adv. Mater. Interfaces 2015, 3, 1500405. [Google Scholar] [CrossRef]
  17. Atuchin, V.V.; Gavrilova, T.A.; Grigorieva, T.I.; Kuratieva, N.V.; Okotrub, K.A.; Pervukhina, N.V.; Surovtsev, N.V. Sublimation growth and vibrational microspectrometry of α-MoO3 single crystals. J. Cryst. Growth 2011, 318, 987–990. [Google Scholar] [CrossRef]
  18. Xu, B.; Li, Y.; Wang, G.; Zhao, D.; Pan, K.; Jiang, B.; Zhou, W.; Fu, H. In situ synthesis and high adsorption performance of MoO2/Mo4O11 and MoO2/MoS2 composite nanorods by reduction of MoO3. Dalton Trans. 2015, 44, 6224–6228. [Google Scholar] [CrossRef]
  19. Pujari, R.B.; Lokhande, V.C.; Kumbhar, V.S.; Chodankar, N.R.; Lokhande, C.D. Hexagonal microrods architectured MoO3 thin film for supercapacitor application. J. Mater. Sci. Mater. Electron. 2015, 27, 3312–3317. [Google Scholar] [CrossRef]
  20. Zhang, C.C.; Zheng, L.; Zhang, Z.M.; Dai, R.C.; Wang, Z.P.; Zhang, J.W.; Ding, Z.J. Raman studies of hexagonal MoO3 at high pressure. Phys. Status Solidi (B) 2011, 248, 1119–1122. [Google Scholar] [CrossRef]
  21. Joya, M.R.; Alfonso, J.E.; Moreno, L.C. Photoluminescence and Raman studies of α -MoO3 doped with erbium and neodymium. Curr. Sci. 2019, 116, 1690–1695. [Google Scholar]
  22. Nti, F.; Anang, D.A.; Han, J.I. Facilely synthesized NiMoO4/CoMoO4 nanorods as electrode material for high performance supercapacitor. J. Alloys Compd. 2018, 742, 342–350. [Google Scholar] [CrossRef]
  23. Lima, C.D.; Moura, J.V.; Pinheiro, G.S.; Araujo, J.F.; Gusmão, S.B.; Viana, B.C.; Freire, P.T.; Luz-Lima, C. Co-doped α-MoO3 hierarchical microrods: Synthesis, structure and phonon properties. Ceram. Int. 2021, 47, 27778–27788. [Google Scholar] [CrossRef]
  24. Shannon, R.D. Revised effective ionic radii and systematic studies of interatomic distances in halides and chalcogenides. Acta Crystallogr. Sect. A Cryst. Phys. Diffr. Theor. Gen. Crystallogr. 1976, 32, 751–767. [Google Scholar] [CrossRef]
  25. Saleem, S.; Jameel, M.H.; Akhtar, N.; Nazir, N.; Ali, A.; Zaman, A.; Rehman, A.; Butt, S.; Sultana, F.; Mushtaq, M.; et al. Modification in structural, optical, morphological, and electrical properties of zinc oxide (ZnO) nanoparticles (NPs) by metal (Ni, Co) dopants for electronic device applications. Arab. J. Chem. 2021, 15, 103518. [Google Scholar] [CrossRef]
  26. Wang, J.; Zhou, Q.; Wei, Z.; Xu, L.; Zeng, W. Experimental and theoretical studies of Zn-doped MoO3 hierarchical microflower with excellent sensing performances to carbon monoxide. Ceram. Int. 2020, 46, 29222–29232. [Google Scholar] [CrossRef]
  27. Ali, A.; Zaman, A.; Aldulmani, S.A.A.; Abbas, M.; Mushtaq, M.; Bashir, K.; Amami, M.; Althubeiti, K. Structural Evolution and Microwave Dielectric Properties of Ba1–xSrxTi4O9, (0.0 ≤ x ≤ 0.06) Ceramics. ACS Omega 2022, 7, 2331–2336. [Google Scholar] [CrossRef]
  28. Naresh, U.; Kumar, R.J.; Naidu, K.C.B. Optical, magnetic and ferroelectric properties of Ba0.2Cu0.8−xLaxFe2O4 (x = 0.2–0.6) nanoparticles. Ceram. Int. 2019, 45, 7515–7523. [Google Scholar] [CrossRef]
  29. Atuchin, V.V.; Gavrilova, T.A.; Kostrovsky, V.G.; Pokrovsky, L.D.; Troitskaia, I.B. Morphology and structure of hexagonal MoO3 nanorods. Inorg. Mater. 2008, 44, 622–627. [Google Scholar] [CrossRef]
  30. Dighore, N.; Jadhav, S.; Anandgaonker, P.; Gaikwad, S.; Rajbhoj, A. Molybdenum oxide nanoparticles as antimicrobial agents. J. Clust. Sci. 2016, 28, 109–118. [Google Scholar] [CrossRef]
  31. Zhao, B.C.; Sun, Y.P.; Zhang, S.B.; Song, W.H.; Dai, J.M. Ferromagnetism in Cr substituted SrMoO3 system. J. Appl. Phys. 2007, 102, 113903. [Google Scholar] [CrossRef]
  32. Li, Y.; Luo, N.; Sun, G.; Zhang, B.; Jin, H.; Lin, L.; Bala, H.; Cao, J.; Zhang, Z.; Wang, Y. Synthesis of porous nanosheets-assembled ZnO/ZnCo2O4 hierarchical structure for TEA detection. Sens. Actuators B Chem. 2019, 287, 199–208. [Google Scholar] [CrossRef]
  33. Khan, I.; Saeed, K.; Khan, I. Nanoparticles: Properties, applications and toxicities. Arab. J. Chem. 2019, 12, 908–931. [Google Scholar] [CrossRef]
  34. Chithambararaj, A.; Bose, A.C. Role of synthesis variables on controlled nucleation and growth of hexagonal molybdenum oxide nanocrystals: Investigation on thermal and optical properties. CrystEngComm 2014, 16, 6175–6186. [Google Scholar] [CrossRef]
  35. Sen, S.K.; Manir, M.S.; Nur, S.; Hossain, M.N.; Islam, M.J.; Alam, A.K.M.M.; A Hakim, M. Estimation of hydrothermally synthesized Iron incorporated 2D-sheet-like α-MoO3 microstructural and optical parameters treated by annealing temperature. Mater. Res. Express 2020, 7, 095005. [Google Scholar] [CrossRef]
  36. Arasu, P.A.; Williams, R.V. The dielectric studies on sol–gel routed molybdenum oxide thin film. J. Adv. Dielectr. 2017, 7, 1750011. [Google Scholar] [CrossRef]
  37. He, S.H.; Li, W.D.; Feng, L.; Yang, W. Rational interaction between the aimed gas and oxide surfaces enabling high-performance sensor: The case of acidic aMoO3 nanorods for selective detection of triethylamine. J. Alloy. Compd. 2019, 783, 574–582. [Google Scholar] [CrossRef]
  38. Wang, X.; Li, C.; Wang, Y.; Cai, T. n-Heptane isomerization over mesoporous MoOx and Ni-MoOx catalysis. J. Catal. Today 2004, 93, 135–140. [Google Scholar]
  39. Paparoni, F.; Mijiti, Y.; Kazim, S.; Minicucci, M.; Pinto, N.; D’Elia, A.; Macis, S.; Kim, C.; Huh, S.; Gunnella, R.; et al. Metallic Interface Induced Ionic Redistribution within Amorphous MoO 3 Films. Adv. Mater. Interfaces 2022, 9, 2200453. [Google Scholar] [CrossRef]
  40. Pradhan, S.K.; Das, S.N.; Bhuyan, S.; Behera, C.; Padhee, R.; Choudhary, R.N.P. Structural, dielectric and impedance characteristics of lanthanum-modified BiFeO3-PbTiO3 electronic system. Appl. Phys. A Mater. Sci. Processing 2016, 122, 604–613. [Google Scholar] [CrossRef]
  41. Kaur, P.; Kumar, S.; Negi, N.S.; Rao, S.M. Enhanced magnetism in Cr-doped ZnO nanoparticles with nitrogen co-doping synthesized using sol–gel technique. Appl. Nanosci. 2015, 5, 367–372. [Google Scholar] [CrossRef]
  42. Zakharova, S.; Schmidt, C.; Ottmann, A.; Mijowska, E.; Klingeler, R. Microwaveassisted hydrothermal synthesis and electrochemical studies of α-and h-MoO3. J. Solid State Electrochem. 2018, 22, 3651–3661. [Google Scholar] [CrossRef]
Figure 1. (a) XRD patterns of un-doped and Cr-doped MoO3 microrods. (b) Displays the zoomed view of (2 0 0) and (2 1 0) peak shifting toward lower angle.
Crystals 12 01259 g001
Figure 2. Plot of average crystallite size (D and DW-H) of un-doped and Cr-doped MoO3 (3 wt% and 6 wt%).
Crystals 12 01259 g002
Figure 3. Williamson–Hall (W-H) plots of (a) un-doped, (b) 3 wt%, and (c) 6 wt% Cr-doped MoO3.
Crystals 12 01259 g003
Figure 4. The SEM and EDX micrographs of the (a) un-doped, (b) 3%, (c) 6% Cr-doped MoO3.
Crystals 12 01259 g004
Figure 5. DRS spectra of un-doped and Cr-doped MoO3 samples.
Crystals 12 01259 g005
Figure 6. K-M function graph of (a) un-doped, (b) 3 wt%, (c) 6 wt% Cr-doped MoO3. (d) Optical band gap energy.
Crystals 12 01259 g006
Figure 7. Dielectric constant as a function of frequency of un-doped and Cr-doped MoO3.
Crystals 12 01259 g007
Figure 8. Dielectric loss as a function of frequency of un-doped and Cr-doped MoO3.
Crystals 12 01259 g008
Table 1. Data on (DWH) and (εWH) of un-doped and Cr-doped MoO3 microrods along with uncertainty.
CompositionAverage Crystalline Size (DW–H) Uncertainty in Average Crystallite Size (DW–H)Average Micro-Strain (εW–H)Uncertainty in Average Micro-Strain (εW–H)
MoO3104.251 nm±0.1585.828±0.462
3 wt% Cr-doped MoO387.204 nm±0.0062.255±0.391
6 wt% Cr-doped MoO371.842 nm±0.2221.308±1.392
Table 2. Elemental compositions by atom % and weight % of the Cr-doped MoO3 samples.
Elements Atom % (MoO3)Atom % (MoO3–3%Cr)Atom % (MoO3–6%Cr)Weight % (MoO3)Weight % (MoO3–3%Cr)Weight % (MoO3–6%Cr)
Molybdenum 66.6665.2563.8353.7752.9652.12
Chromium --1.102.21--1.523.10
Oxygen 33.3433.6533.9646.2345.5244.78
Total 100100100100100100
Table 3. Data on structural and physical parameters of un-doped and Cr-doped MoO3 microrods.
Compositiona = b (Å)c (Å)D (nm)Eg (eV)
MoO310.5314.8876.692.98
3% Cr-doped MoO310.5414.8871.882.80
6% Cr-doped MoO310.5514.8970.572.71
Eg = band gap energy; a, b and c = lattice parameters; D = average crystallite size.
Publisher’s Note: MDPI stays neutral with regard to jurisdictional claims in published maps and institutional affiliations.

