Article

Stress Relaxation during Artificial Aging of an AlSi7Cu0.5Mg Cast Alloy

by
René Wang
1,2,*,
Dinesh Ram
1,3,4,
Bernhard Stauder
5,
Ricardo Fernández Gutiérrez
5,
Elisabetta Gariboldi
6 and
Maria Cecilia Poletti
1,2
1
Christian Doppler Laboratory for Design of High-Performance Alloys by Thermomechanical Processing, Graz University of Technology, Kopernikusgasse 24/I, A-8010 Graz, Austria
2
Institute of Materials Science, Joining and Forming, Graz University of Technology, Kopernikusgasse 24/I, A-8010 Graz, Austria
3
Institut des Matériaux de Nantes Jean Rouxel (IMN), Nantes Université, CNRS UMR 6502, Polytech Nantes, Rue Christian Pauc, BP 50609, CEDEX 3, 44306 Nantes, France
4
Mines Saint-Étienne, Centre SMS/LGF UMR CNRS 5307, 158, Cours Fauriel, CEDEX 2, 42023 Saint-Étienne, France
5
Nemak Linz GmbH, Zeppelinstraße 24, A-4030 Linz, Austria
6
Dipartimento di Meccanica, Politecnico di Milano, Via Giuseppe La Masa 1, I-20156 Milano, Italy
*
Author to whom correspondence should be addressed.
Crystals 2022, 12(8), 1168; https://doi.org/10.3390/cryst12081168
Submission received: 28 July 2022 / Revised: 15 August 2022 / Accepted: 17 August 2022 / Published: 19 August 2022
(This article belongs to the Special Issue Microstructure Characterization and Design of Alloys)

Abstract

:
After casting and solidification, Al cast cylinder heads undergo a sequence of heat treatments to achieve the desired material properties. This sequence comprises solution heat treatment (SHT), quenching, and artificial aging. Internal stresses are formed due to temperature gradients in the complex geometry of the cylinder heads during quenching from the SHT temperature to room temperature. Especially high tensile stresses can produce damage during service. However, part of these internal stresses relaxes during the aging treatment. This work aims to systematically measure the relaxation of the stresses, as well as to phenomenologically model the amount and rate of relaxation. Cast specimens of AlSi7Cu0.5Mg are heat-treated in a furnace before relaxation in a creep testing machine. SHT and SHT plus aging at 180, 200, and 230 °C for 0 h, 0.5 h, 1 h, 4 h, and 6 h are carried out before testing. The relaxation of the stress at constant temperature and strain over 5 h is recorded at three different testing temperatures (180 °C, 200 °C, and 230 °C). The relaxation process is strongly dependent on the testing temperature: at 180 °C and 200 °C the equilibrium stress was already reached after around 1 h, and at 230 °C the equilibrium was reached after 3.5 h. The initial stress values do not influence the relaxation rate. A phenomenological relaxation model is developed to calculate the stress decrement over time and the equilibrium stress in the AlSi7Cu0.5Mg-alloy. The model allows for calculating the levels of residual stress at any time during artificial aging as a function of the thermal history of the alloy, the relaxation temperature, and the initial stress level. Complete relaxation of the initial stress is not reached within 5 h.

1. Introduction

Aluminium (Al) and its alloys are the most used metallic materials in industries after steel. The most significant advantage of Al alloys compared to steel is the ratio between strength and stiffness to weight [1,2]. Al cast alloys are applied in different areas, e.g., automotive, aerospace, and sports industries [3]. Strength and ductility can be improved due to a combination of alloying elements and heat treatments. The strength and hardness properties of age-hardenable Al alloys are improved by applying a heat treatment that usually comprises the following three steps [4]:
  • Solution heat treatment (SHT) at high temperatures to dissolve the alloying elements into the Al matrix.
  • Cooling with high cooling rates to suppress precipitation and to obtain a supersaturated solid solution.
  • Aging at room temperature (RT) (natural aging) or at higher temperature (artificial aging) to ensure a controlled formation of finely dispersed precipitates in the aluminium matrix.
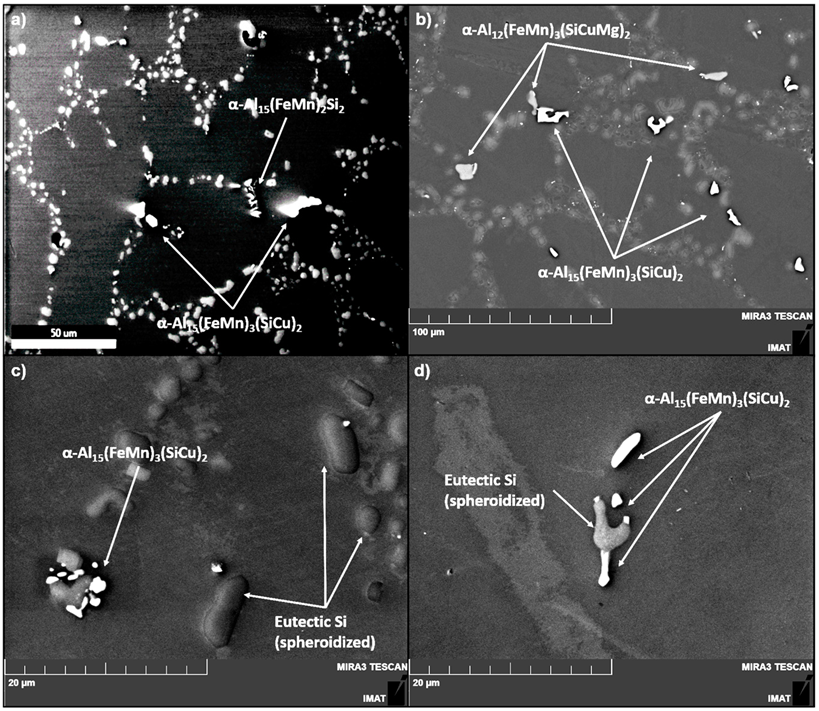
The presence of Si, Mg, and Cu in the AlSi7Cu0.5Mg alloy promotes the formation of metastable and stable intermetallic phases during aging: GP zones [5,6], β″-, β′-Mg2Si [7], θ″-, θ′-Al2Cu [4]and Q″-, Q′-Al5Mg8Si6Cu2 [1,8,9,10]. Additionally, primary phases such as eutectic Si and Fe and Mn-rich aluminides are present after the solidification and partially transformed during SHT. They are not modified by further exposure to the temperature/time of annealing treatments. The grain structure and average grain size do not change significantly at the aging temperatures, since the recrystallization temperature is much higher and the cast material is highly recrystallized [11,12].
After solution heat treatment, the quenching process in Al cast products provokes thermal gradients resulting from the complex geometry and inhomogeneous cooling leading to residual stresses. In the case of cylinder heads and engine blocks, unrelieved stresses can result in cracking and reduced cast component durability [13].
Godlewski et al. [13] investigated the relaxation of residual stresses during the aging of an E319 aluminium alloy using a sample with a geometry that provokes a significant amount of residual stresses during quenching. The samples were solution heat-treated for 4 h at 495 °C, followed by water quenching of the bottom side to 10 °C, and then artificially aged at different temperatures. After air quenching, strain gages were attached, the samples were sectioned at the bridges with a band saw, and the strain was recorded. The experimental data was then used to verify a stress relaxation model and implement it in an FEA. Phenomenological models to describe relaxation were already developed by G. R. Rao [14] and S. Rahimi [15]. Both models work well according to their published works, but multiple fitting parameters have to be used in both. Rahimi used three parameters in his model, and G. R. Raos used no less than eight parameters.
The prediction of the relaxation in a material during aging plays a significant role in designing the heat treatment process so that the required strength can be achieved, avoiding damage during service caused by residual stresses in the structure.
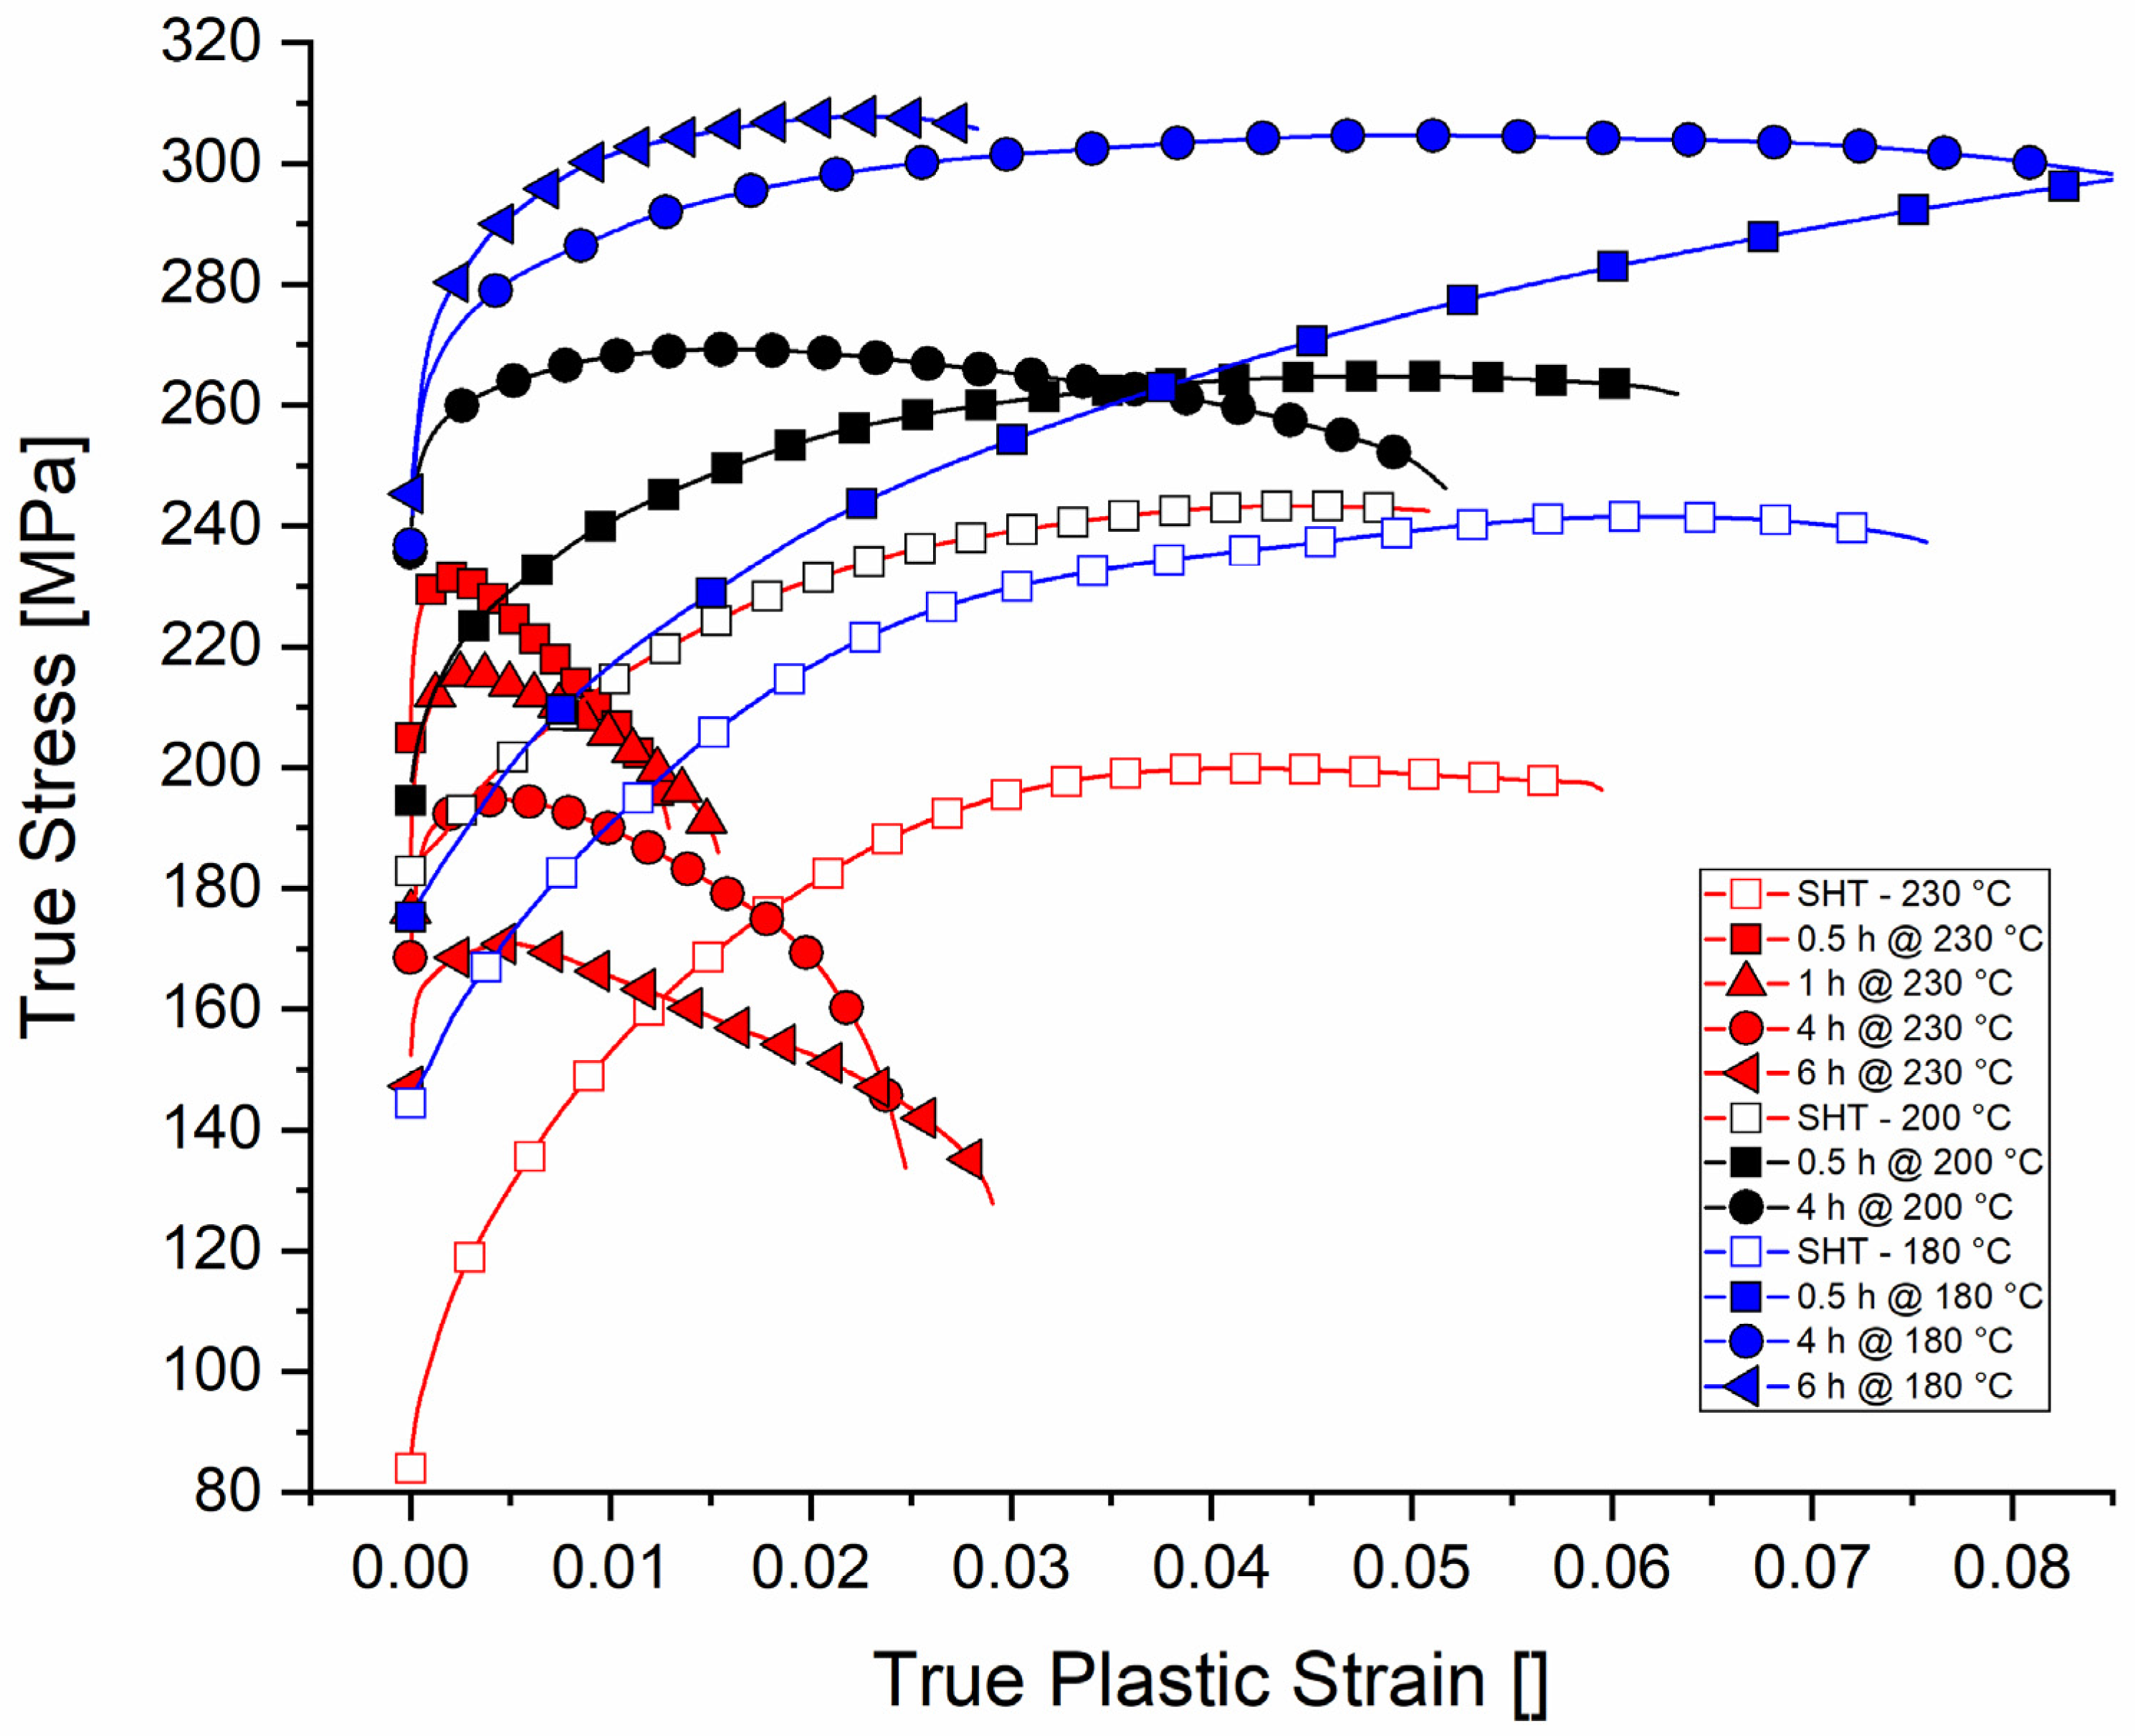
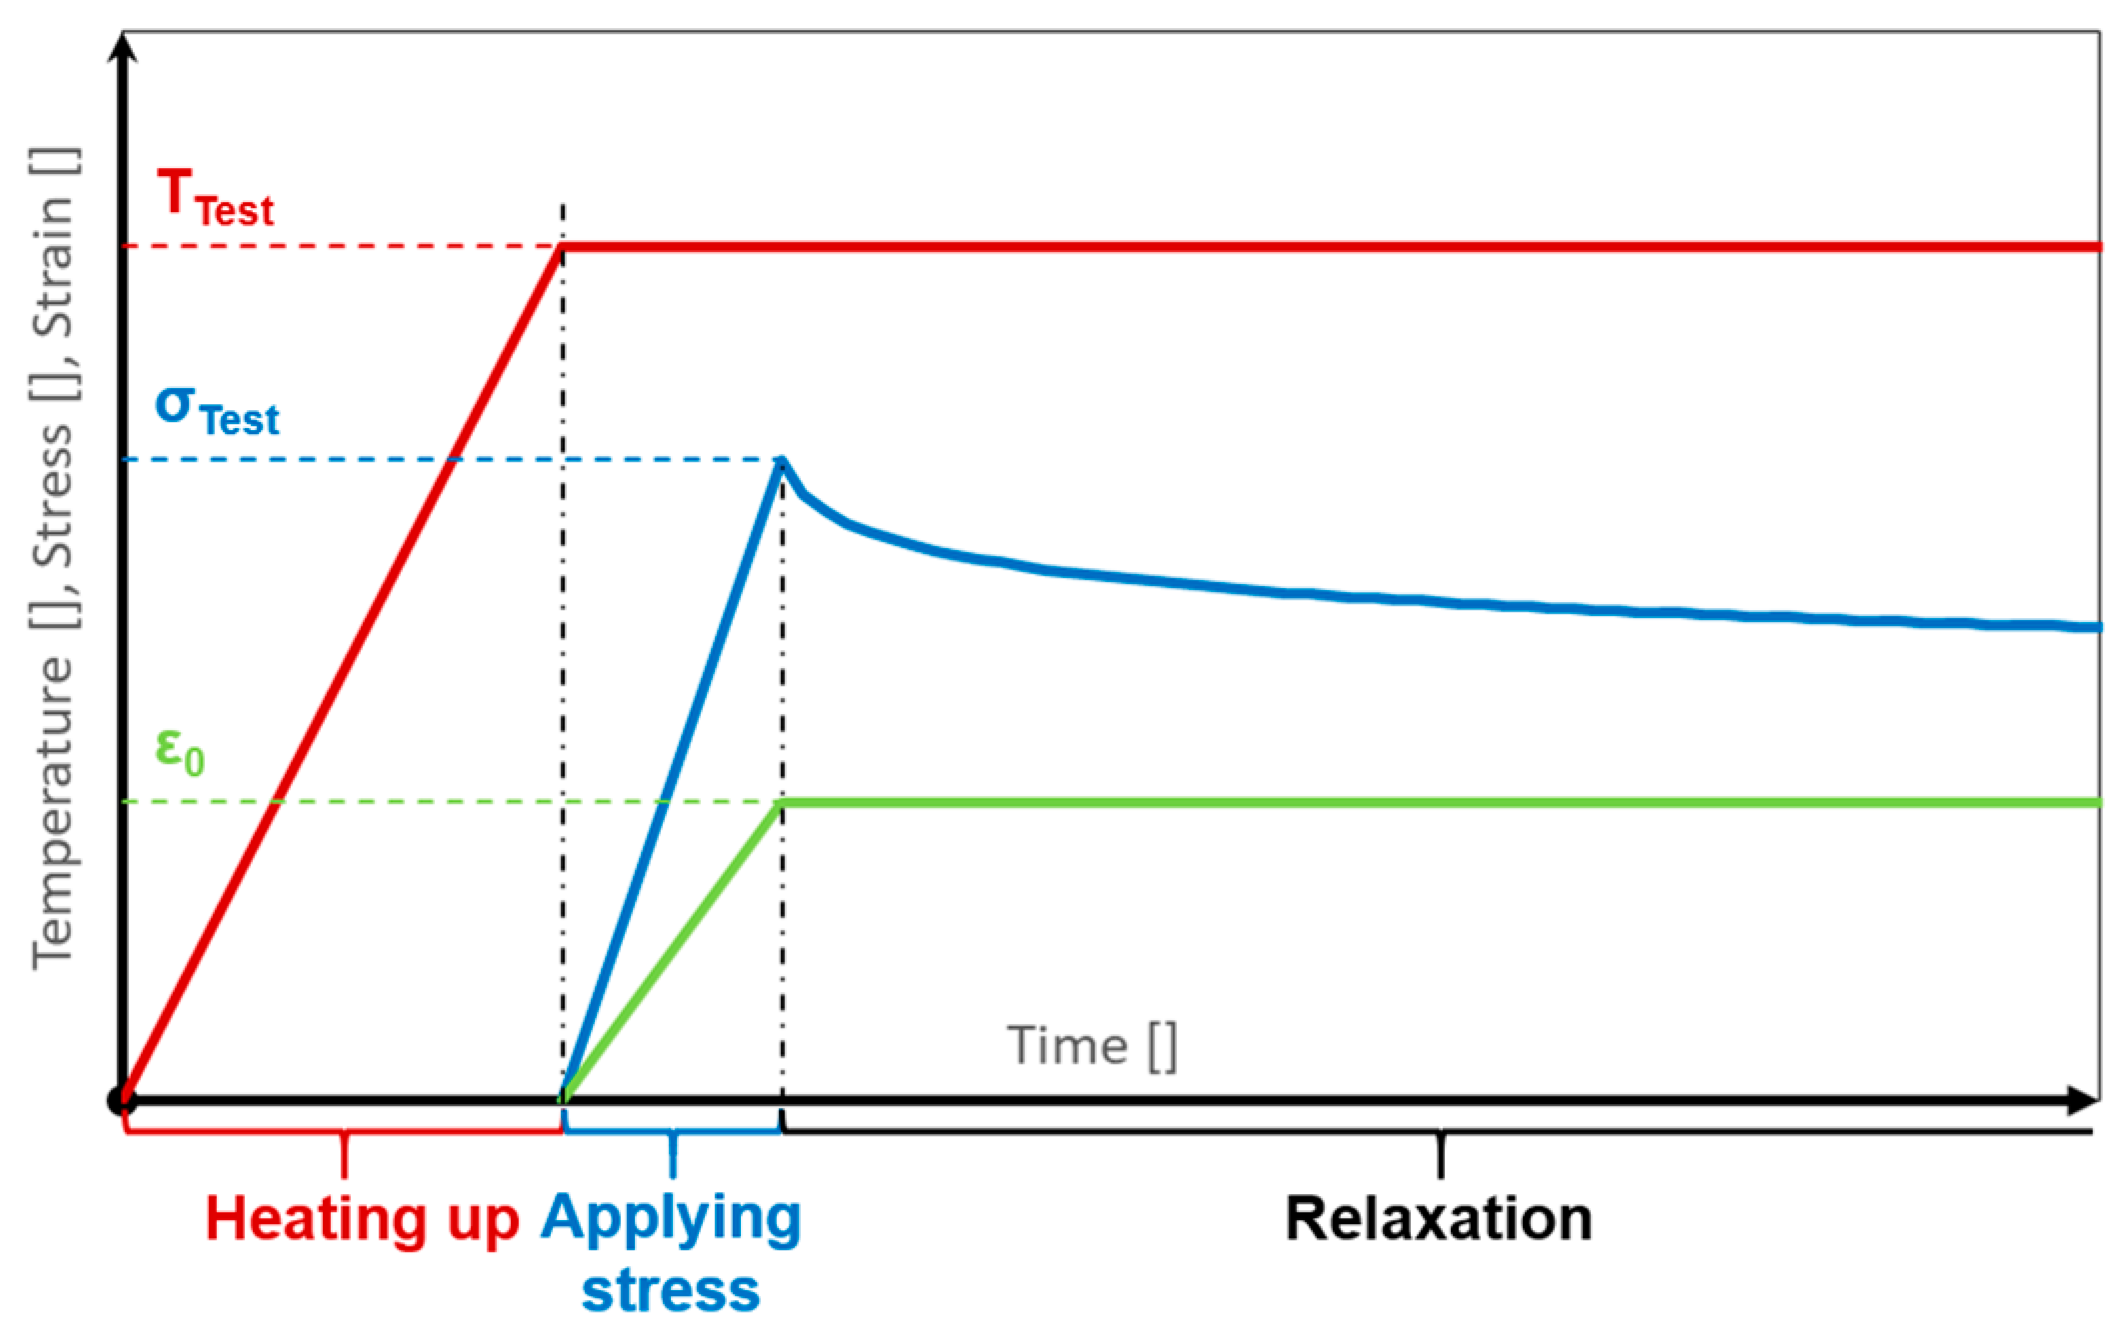
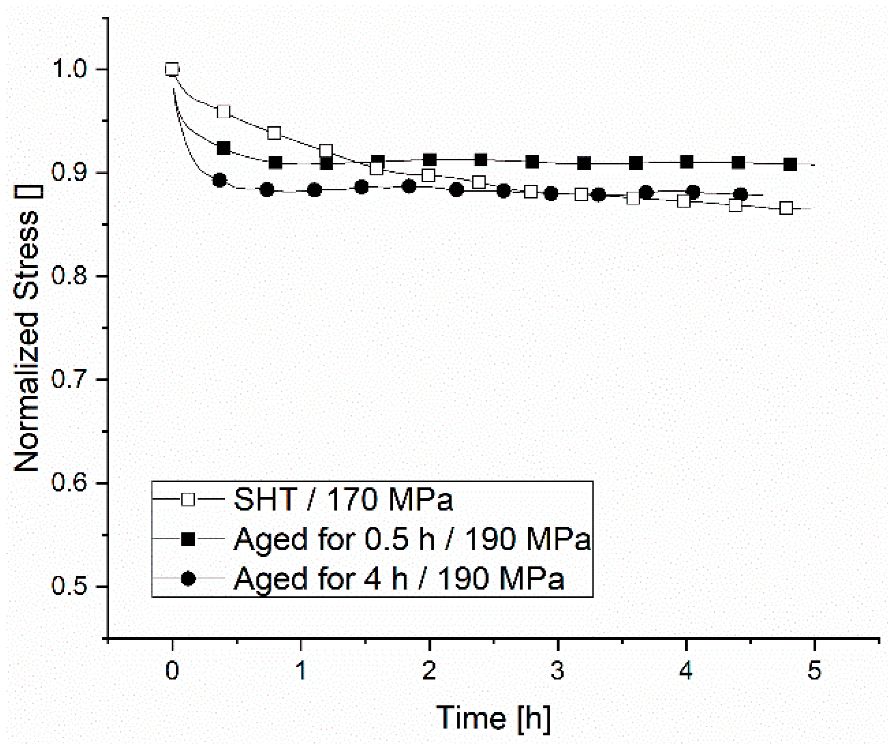
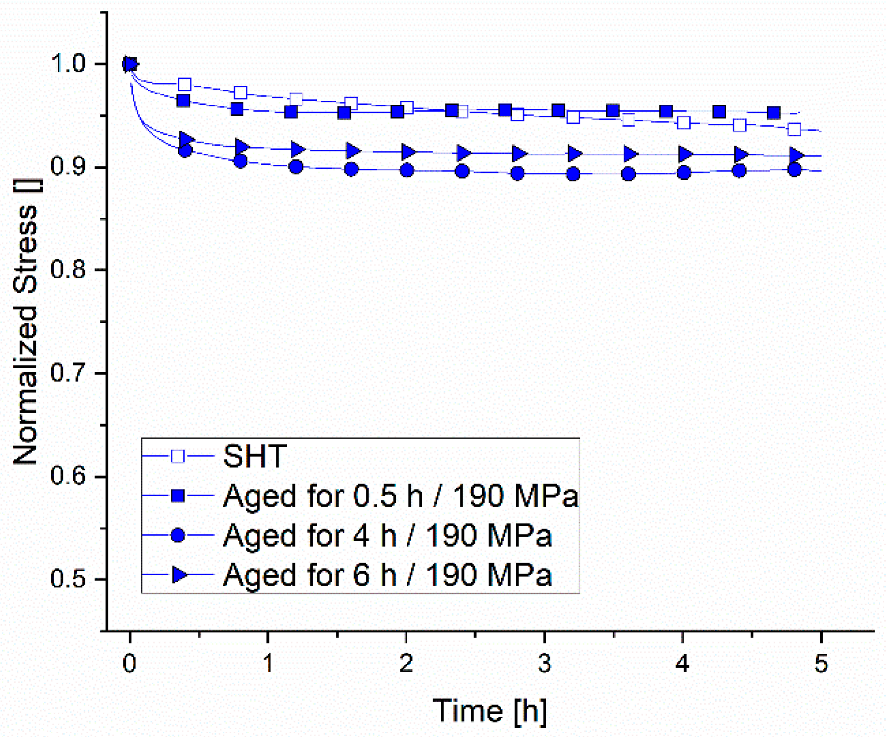
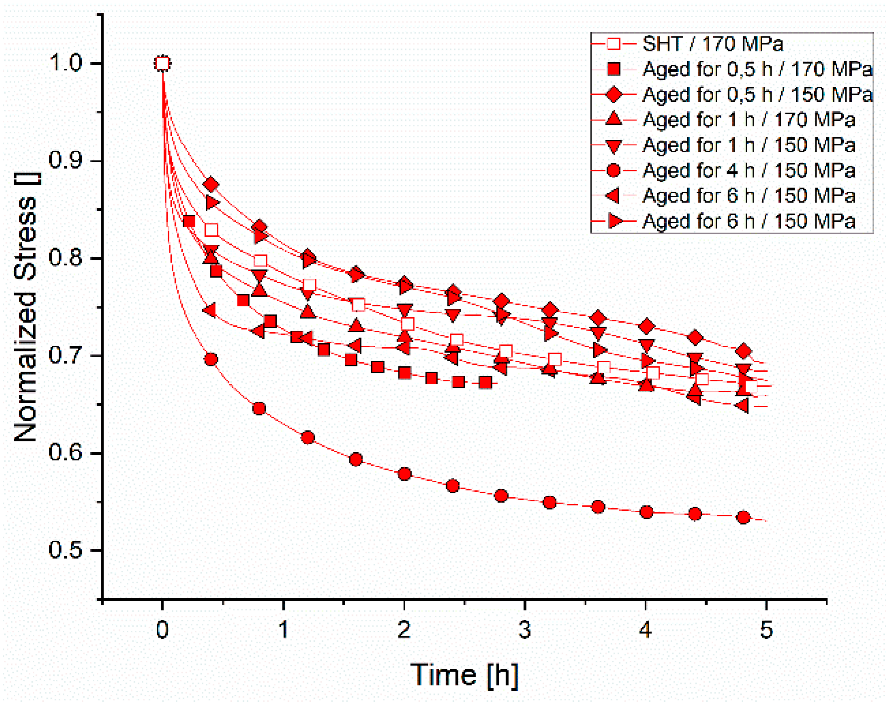
This work presents the results of several tensile stress relaxation tests conducted at different temperatures and stress levels. The material was tested in different microstructural conditions, including SHT-, under-, peak- and overaged states. The results were then used to develop a phenomenological model to predict this stress relaxation process. The model is based on the work of S. Rahimi et al. [15], which deals with the relaxation of an IN718 nickel-based superalloy. The same procedure is now applied to the AlSi7Cu0.5Mg alloy, but the parameters in this work were correlated to the test temperature, stress level, and precipitation state. Furthermore, the plastic strain rates (PSRs) were analyzed and the model was evaluated.
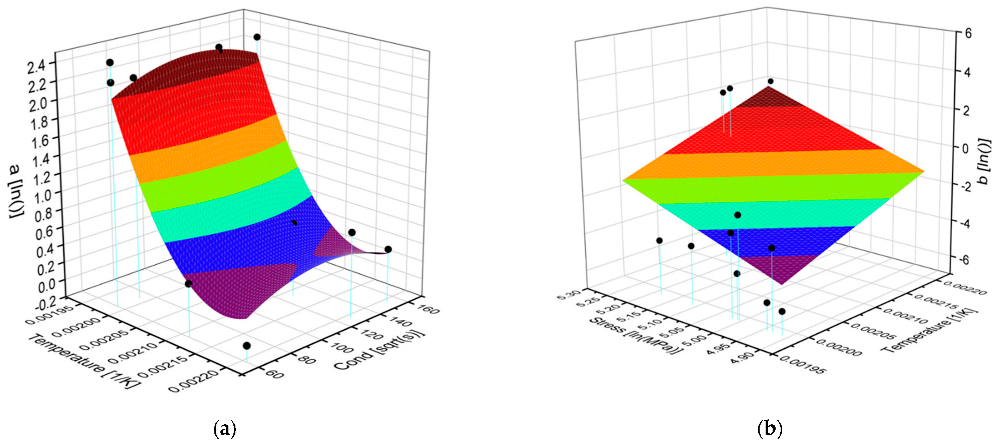
2. Materials and Methods

2.1. Material

The investigated material is an Al-Si-Cu-Mg alloy used for cylinder heads of combustion engines with the chemical composition listed in Table 1. Bars of 16 × 16 × 380 mm3 were cut out of the cylinder heads top surface after casting and solidification. The specimens with an overall length of 90 mm with M12-threaded heads on the ends were machined out of the bars. The gauge diameter and gauge length were 6 mm and 28 mm, respectively. Before testing, all the specimens were heat treated at 530 °C for 4 h, quenched with pressurized air (~5 K/s), and aged for different temperatures and times according to Table 2. The specimens tested in SHT-state and the relaxation test temperatures correspond to the ageing temperatures. Specimens in SHT-state were stored in a fridge at −10 °C before mounting them in the machine to avoid natural ageing.
Figure 1 gives an overview of the microstructure of the material in the SHT state. It displays the spheroidization of the eutectic Si after the SHT. Furthermore, α-Al12(FeMn)3(SiCuMg)2 and α-Al15(FeMn)3(SiCu)2 particles are found neighboring the eutectic Si. No β-Al5FeSi is present and the Al matrix is free of local chemical segregations and any other large particle.
A summary of the aging response of the studied material can be observed in Figure 2. The hardness values were measured at the aluminium matrix using microhardness measurements. The contour plots on the hardness evolution of the investigated alloy for each aging temperature/time visualize the effect of the precipitates on the microstructure of the alloy. The hardness is dependent on the quenching rate (logarithmic Y-axis) and the aging time (logarithmic X-axis). Low values of hardness were obtained below a quenching rate of 2 Ks−1 due to precipitation during cooling that decreases the supersaturation degree. A peak hardness was reached after annealing at 230 °C after approximately 0.5 h. Lower hardness values after longer aging times were provoked by the coarsening of the precipitates. On the other hand, the hardness after aging at temperatures between 180 °C and 200 °C reached two peaks with higher values than the ones obtained after aging at 230 °C [16].
In Figure 3, the true stress–strain curves of the material in the investigated conditions are plotted. The increase in the strength with prolonged aging time for the material, aged and tested at 180 °C and 200 °C, is clearly visible. At 230 °C, the strength increase shows a maximum at 0.5 h of aging; for longer times the strength decreases continually.

2.2. Experimental Method

The testing machine CERMAC CSR-30 is a conventional electromechanical testing machine specifically designed for high-temperature testing, equipped with a three-zone vertical electrical resistance furnace. The heating rate resulted in 3.7 ± 0.5 Kmin−1 and a temperature stabilization phase of 10 min was always conducted. The temperatures during the heating up and the experiment were measured by three thermocouples of type K, where one was placed in the middle of the gauge length and the other two were placed at each end of the specimen. The data was controlled and recorded with an Agilent 34970A multimeter and a specially designed application in the software LabVIEW. The experiments were conducted in the stroke-controlled mode. By moving the stroke with 4.5 mm/min through a rotating spindle and a motor the forces were applied. The motor was switched off manually when the desired stress of 150, 170, and 190 MPa was reached. The stress levels deviated up to ±10% from the nominal ones. By switching off the motor, the stroke was fixed and the isothermal relaxation process was measured and recorded for 5 h with a load cell and the LabVIEW application. The experimental procedure of the relaxation tests is shown schematically in Figure 4.

2.3. Phenomenological Modeling

Based on a logarithmic law (Equation (1)), the stress σ ( t ) can be calculated at any time depending on the initial stress values σ 0 , the time t, and two parameters a and b. To find values for parameters a and b, the logarithmic law got fitted with the experimental relaxation curves via a nonlinear curve fit. The gained parameters of each experiment were then plotted and set in dependence on the materials condition and the testing/relaxation condition. The R² values were found to be 1 for all curves in the aged condition, and 0.930, 0.817, and 1 for 180 °C, 200 °C, and 230 °C, respectively, in the SHT condition. The so-created data sets were then fitted with surface functions to describe the evolution of the parameters as a function of the testing and aging conditions.
σ ( t ) = σ 0 a · ln ( b · t + 1 )
The material conditions influence parameter a, which was found to be a two-dimensional parabola function (Equation (2)) of the aging temperature T A A and the aging time t A A . The second parameter b is described by Equation (3), a plane function, and takes the testing/relaxation conditions, stress σ 0 and temperature T R , into account. The R² values were calculated with 0.935 for the parabola function and 0.682 for the plane function. Both functions and the experimentally found parameters a and b are plotted in Figure 5.
ln a = z a 0 + a 1 · T 00 T A A + a 2 · t A A t 00 + a 3 · T 00 2 T A A 2
ln b = z b 0 + b 1 · T 00 T R + b 2 · ln σ 0 σ 00
The parameters z a 0 , z b 0 , a 1 a 3 , b 1 and b 2 are numerically adjusted and their values are listed in Table 3. T 00 , t 00 , and σ 00 are reference values with the values 1 K, 1 s, and 1 MPa, respectively, to keep the units coherent in the mathematical functions.

3. Results

3.1. Stress Relaxation Experiments

The results of the stress relaxation experiments are shown for 180 °C, 200 °C, and 230 °C in Figure 6, Figure 7 and Figure 8, respectively. The graphs with the empty symbols always represent the trials on the specimen in SHT condition. In general, the relaxation process starts always with a fast relaxation rate that decreases over time with a rate that depends on the temperature, and the initial stress and precipitation state. Tests conducted at 230 °C relaxed up to 50% (e.g., 4 h aged, 150 MPa) of the initial stress, followed by the tests conducted at 200 °C and 180 °C. On average, 34% of the initial stress is relaxed at 230 °C after 5 h and the steady state stress is not reached. At 200 °C and 180 °C the average relaxation after 5 h is 14% and 8%, respectively. The relaxation processes at 200 °C and 180 °C within 75 min reached steady state stress condition. The influence of the initial stress can be seen in Figure 6 in same aged conditions, the experiments with lower initial stress relaxed less than the ones with higher initial stress (e.g., 230 °C, aged for 0.5 h and for 1 h, 170 MPa vs. 150 MPa). The ageing time affected the relaxation in a non-linear manner because the changes in the microstructure occur at the same time as the relaxation. The precipitation condition evolves from an underaged state to a peak aged state and further to an overaged state, in which the strengths evolve. All specimens in SHT-condition showed at 200 °C and below a more linear and particularly in the first 2 h a slower relaxation process than the aged specimens. Two trials were conducted for the same condition (230 °C, 150 MPa, 6 h aged). These two trials show a quite different relaxation behavior over time, although the steady state stress value after 5 h lies for both in the range between 65–67% of the initial stress.

3.2. Stress Relaxation Modeling

Figure 9 shows the modeling results directly compared to the experimental relaxation curves in SHT state. The largest deviations between experiments and model are found for tests, where the material started in the SHT condition. The model underestimates the relaxation for all three temperatures. Although the maximum deviation at 5 h for 180 °C is below 4%, the deviation for the 200 °C and 230 °C test cases is above 5% and 30%, respectively. As for the relaxation tests in the SHT condition, the model performs better for the lower temperatures (180 °C and 200 °C) than for 230 °C. Whereas the deviations at 5 h for 230 °C are between +9.11% and −6.43% (Figure 10 and Figure 11), the deviation fluctuates at 180 °C and 200 °C between +2.58% and −3.40% (Figure 12 and Figure 13).
For a clear visualization, the graphs of the tests in aged conditions are separated according to the test temperature and the range of the initial stress. For these tests in aged conditions, the model shows good accordance for all temperatures with an overall average deviation at 5 h of relaxation of 3.40%.
Generally, the model succeeded in describing the rate of relaxation on linear sections (after a steep decrease in stress) with lower relaxation rates and shows low deviations after 5 h, but it could not describe the high relaxation rate at the beginning, where already the deviations occur. Deviations between the model and experiment, which continue over time, remain almost constant for the further course of the relaxation. The model seems to be able to predict that the relaxation process at 230 °C is not in equilibrium after 5 h, since the relaxation rate is not zero.
As described in the section above, the phenomenological model uses four fitting parameters, the aging temperature T A A , the aging time t A A , the initial stress σ 0 , and the relaxation temperatures T R . T A A and t A A directly influence the parameter a and control the slope of the entire relaxation curve, defining the time of the transition from the fast to the slower relaxation phase. A change in the initial stress σ 0 causes a shift of the entire relaxation curve in the vertical direction and therefore mainly causes an offset. T R directly influences the relaxation speed, in addition to T A A and t A A . Higher T R leads to faster relaxation processes.

4. Discussion

The relaxation proceeds by the plastic deformation of the material.
ε t o t = ε e l + ε p l
where ε t o t , ε e l , and ε p l are the total, the elastic, and the plastic strains, respectively. During the stress relaxation, the total strain given by Equation 4 is equal to 0. The plastic strain rate (PSR) is also zero during stress relaxation tests
ε ˙ t o t = ε ˙ e l + ε ˙ p l = 0
ε ˙ x x   are the corresponding strain rates. Using Hook’s law for the elastic part, we obtain Equation (6)
ε ˙ p l = σ ˙ E
where σ is the stress and E is the Young’s modulus. If the plastic strain rate can be correlated to the stresses using a power law, then:
ε ˙ p l = σ ˙ E = A · σ n
and taking logarithms
ln ε ˙ p l = ln ( σ ˙ E ) = ln A + n · ln σ
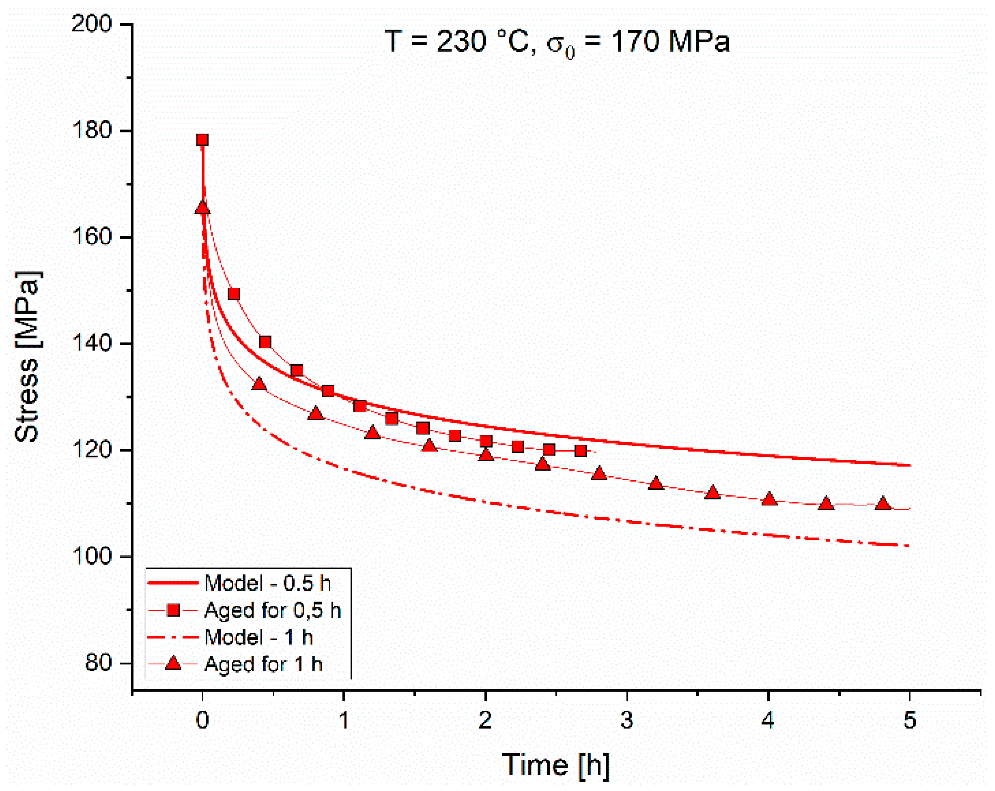
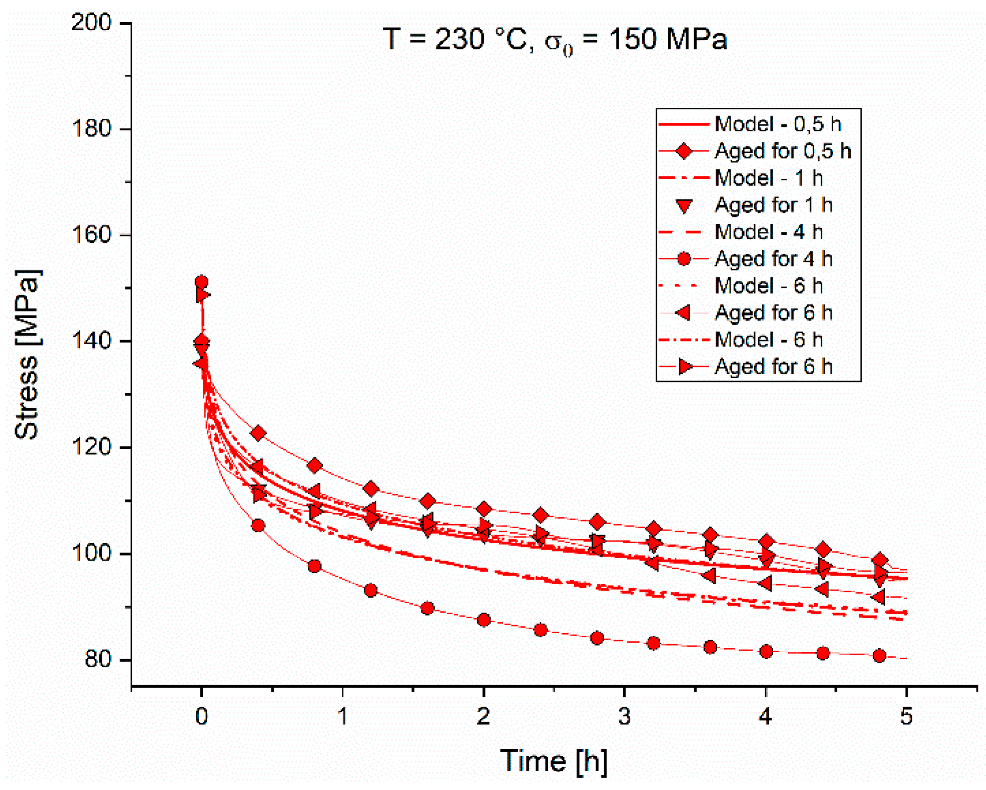
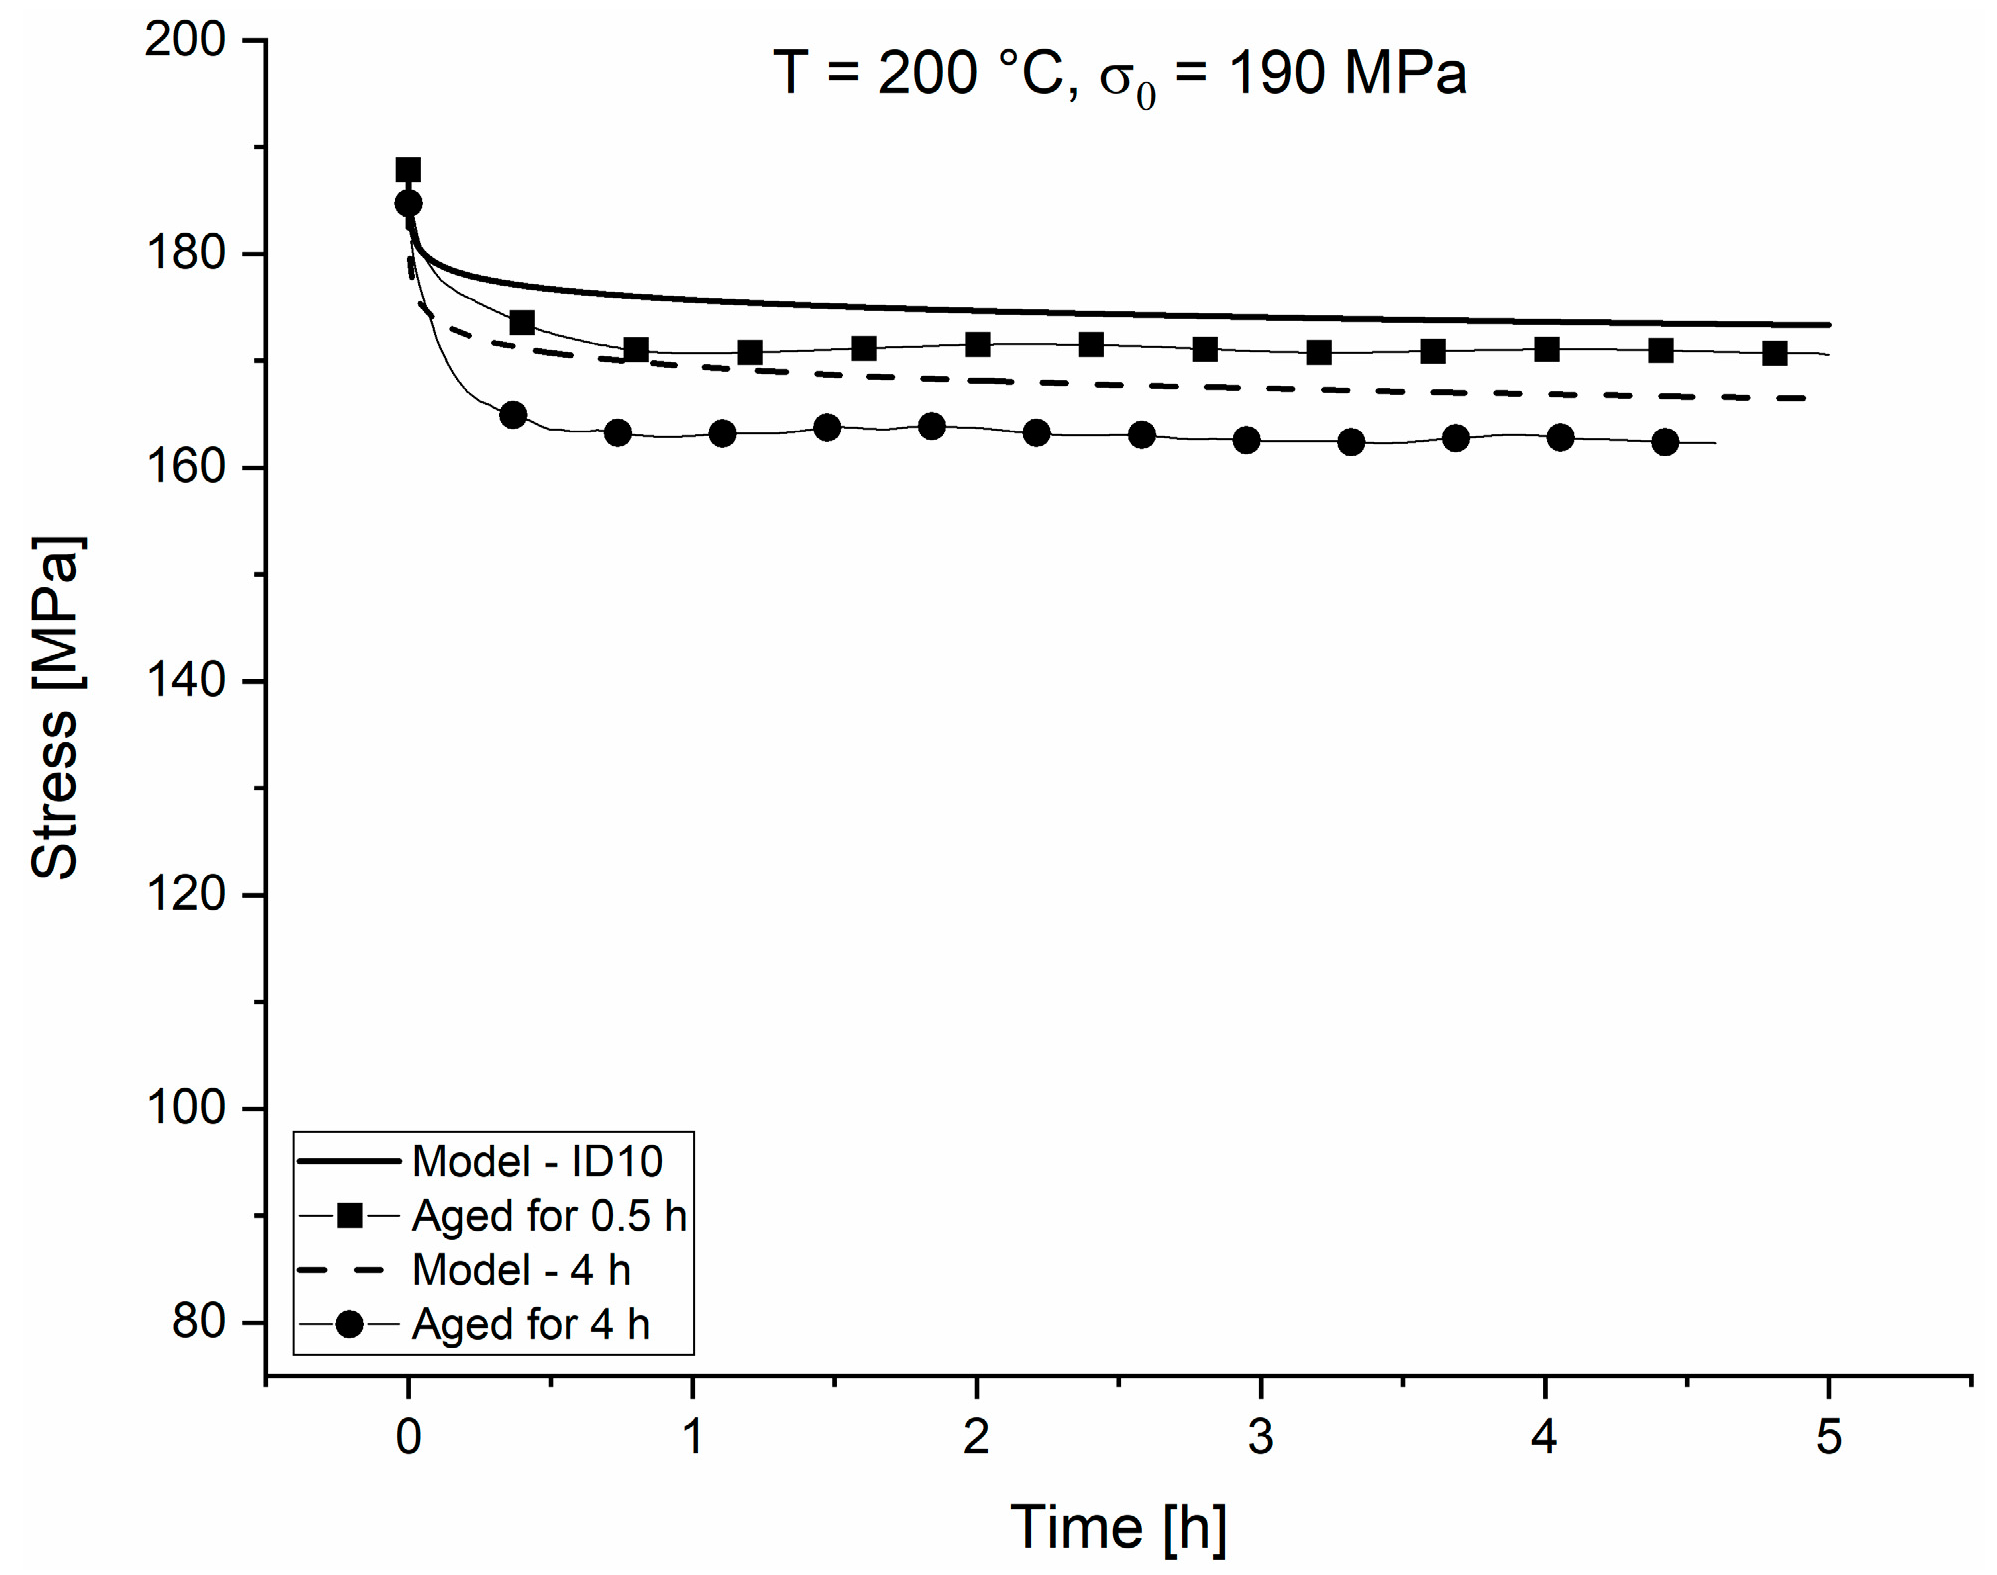
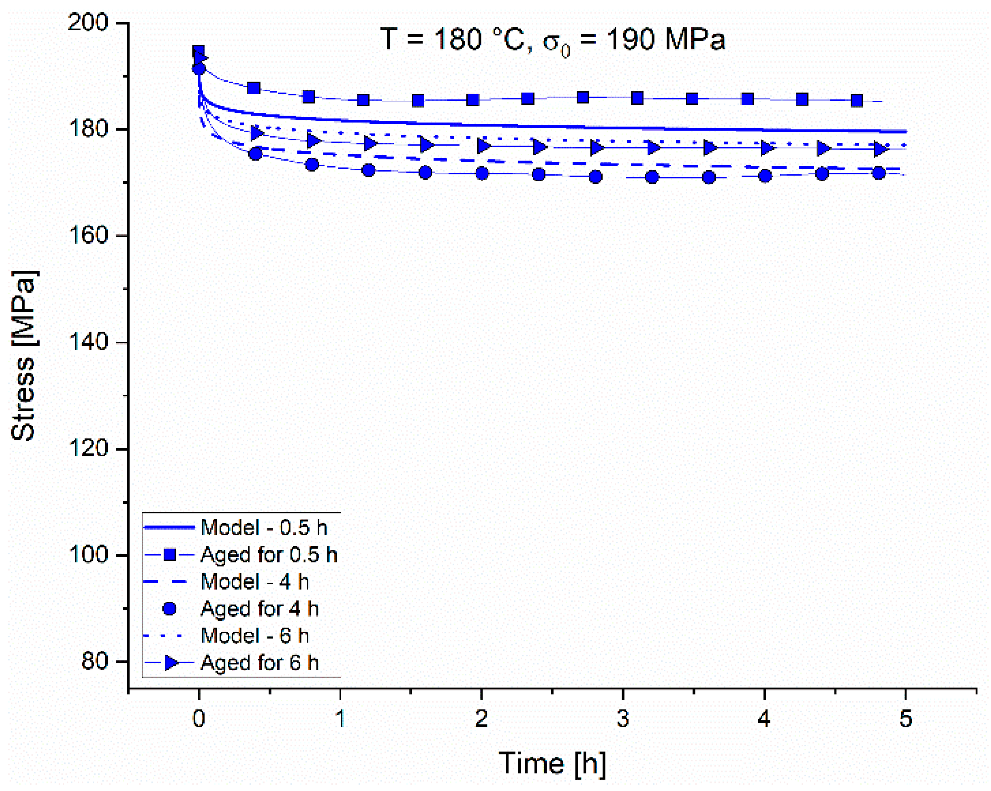
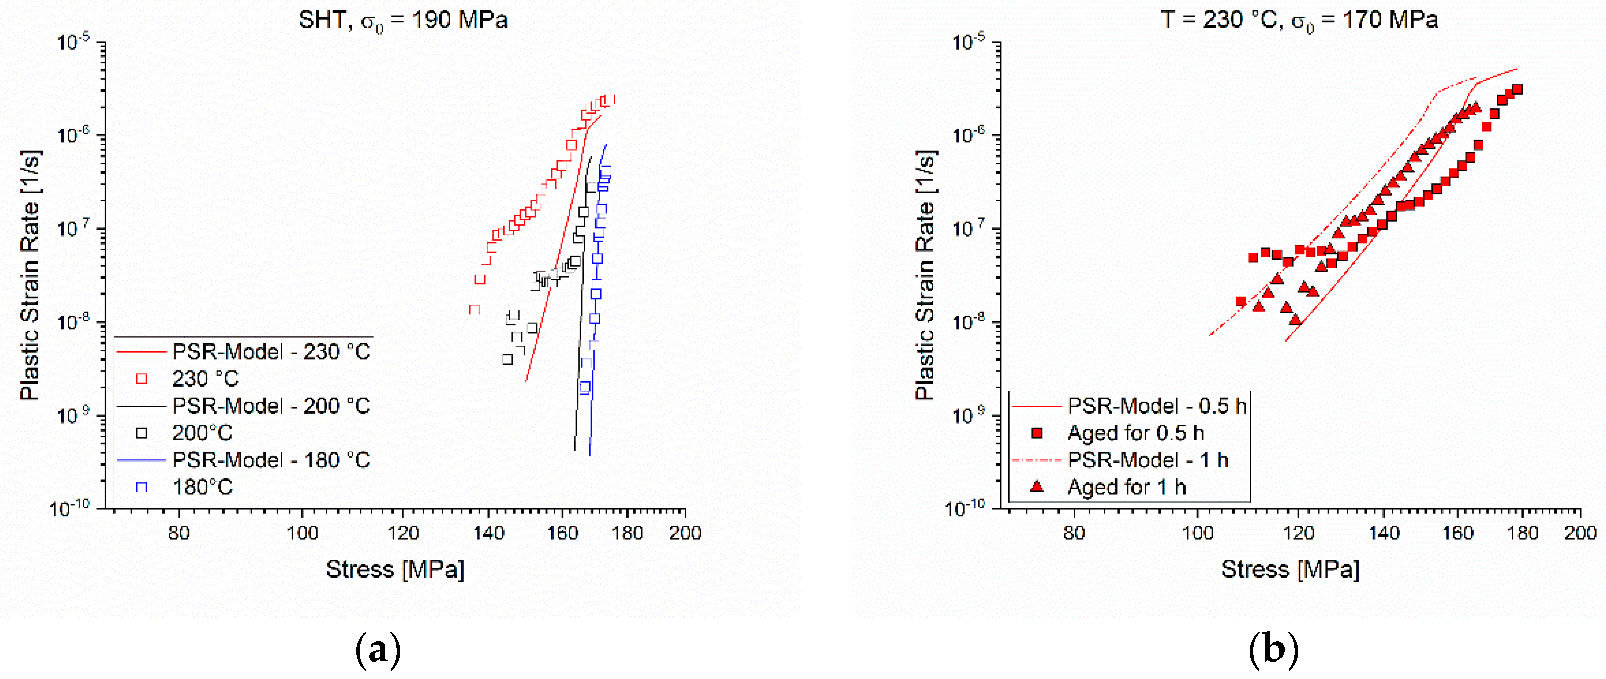
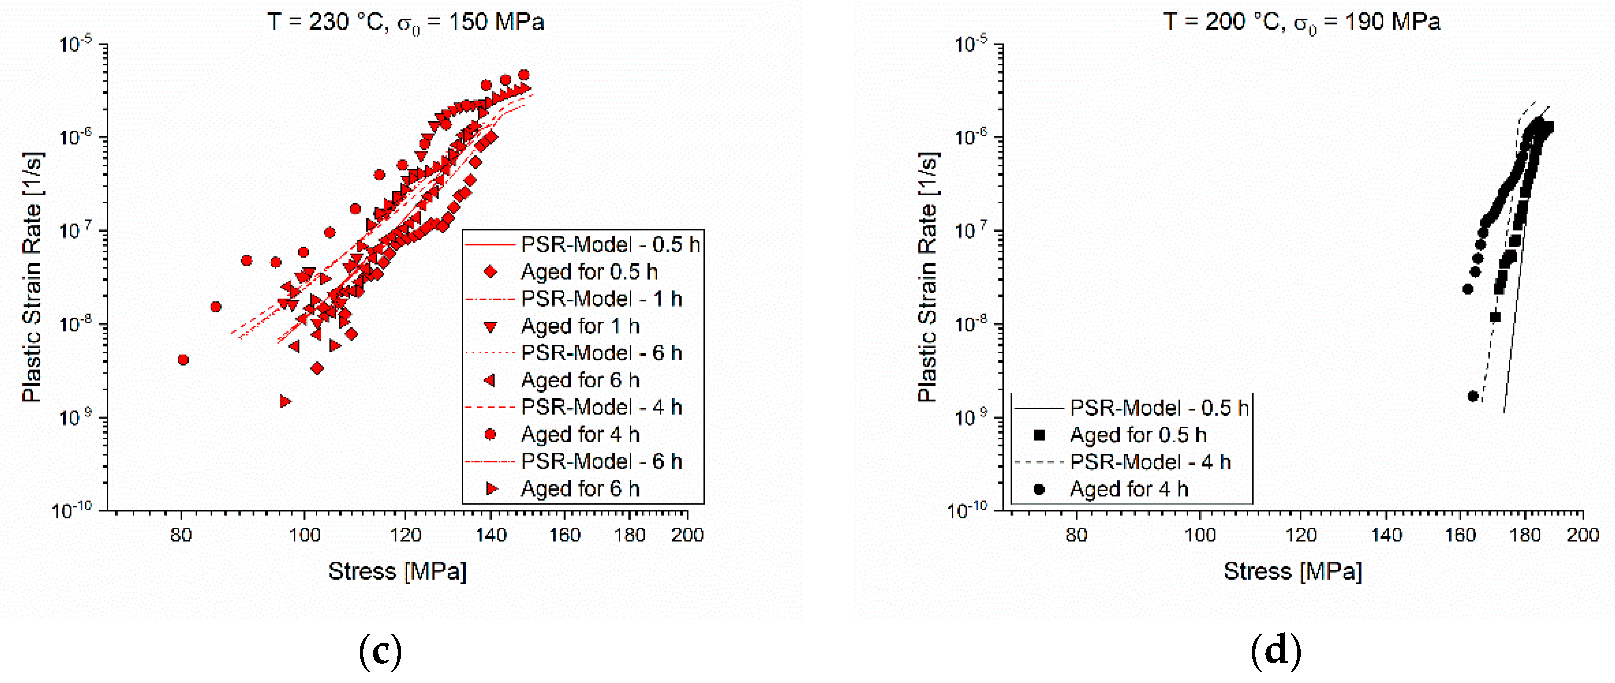
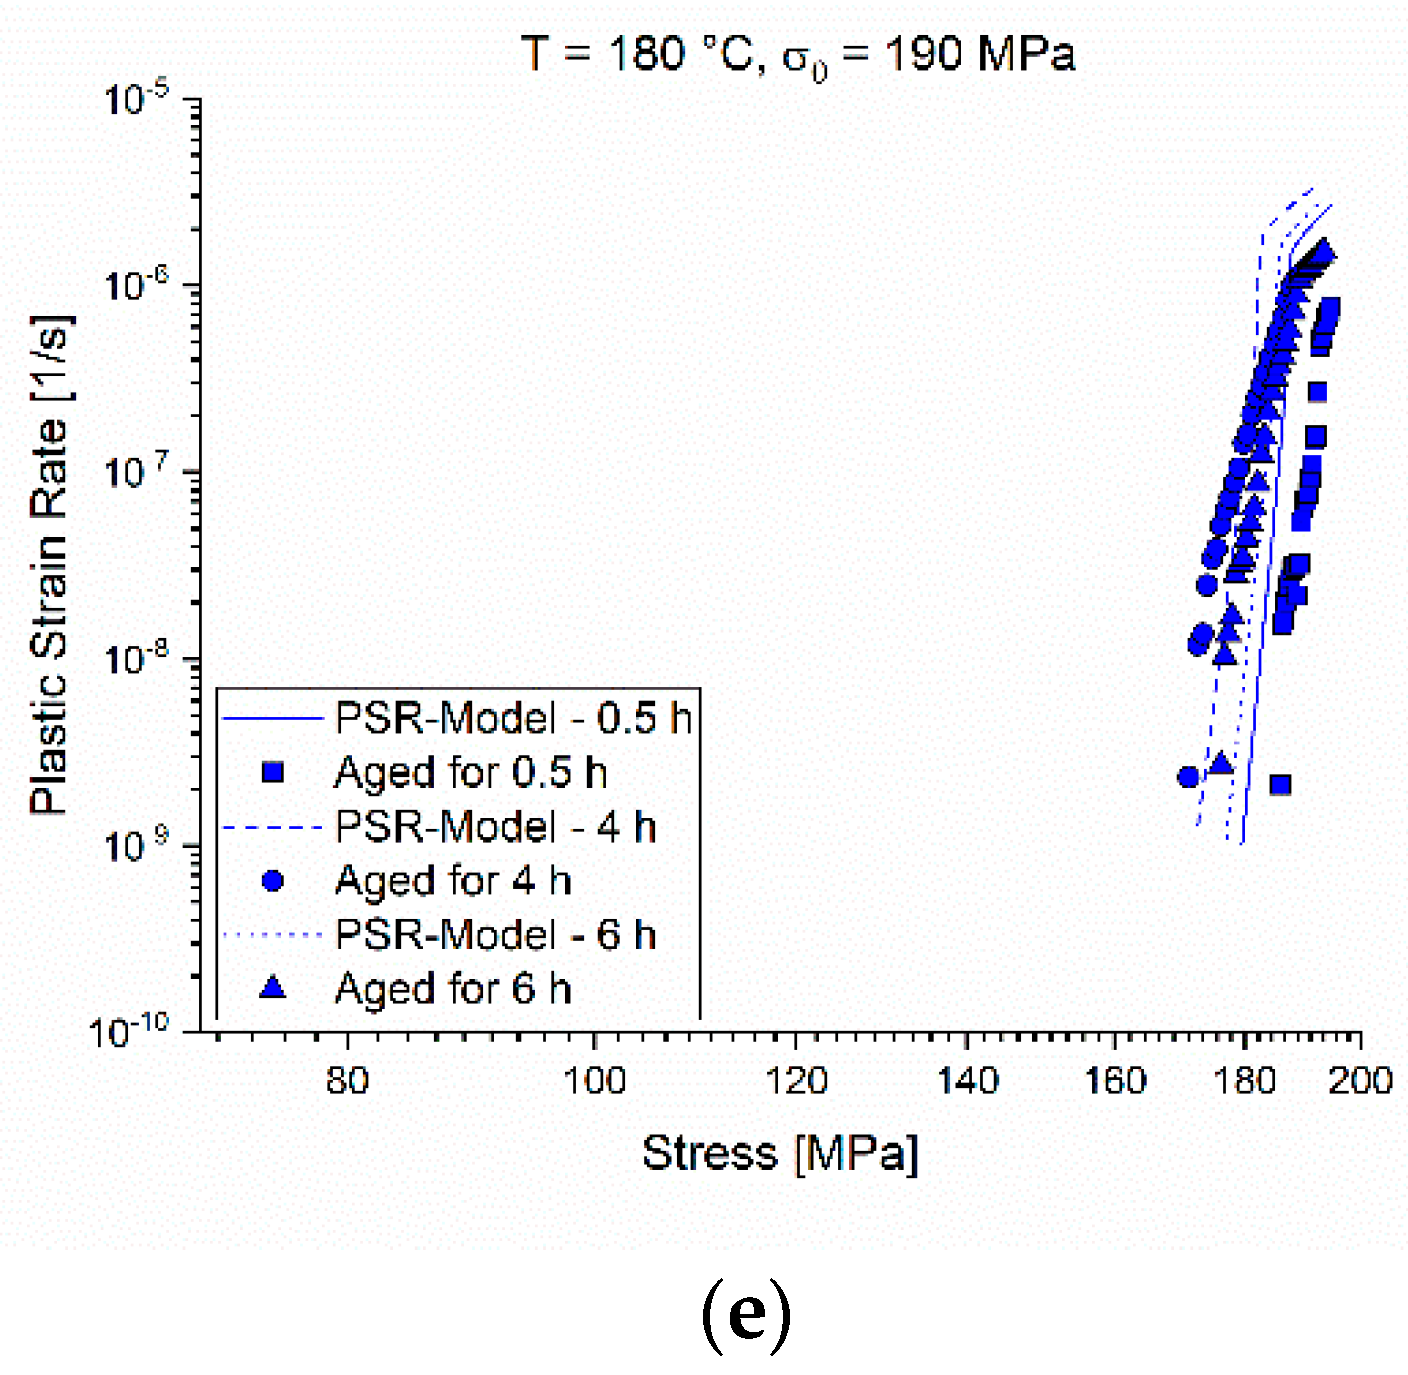
The comparisons of the experimental and modelled PSRs over time are plotted in double logarithmic graphs in Figure 14a–e. For better visualization, the tests are separated as in the chapter above. The deviations seen in the direct comparison of the experimental and modelled relaxation curves in Figure 9, Figure 10, Figure 11, Figure 12 and 
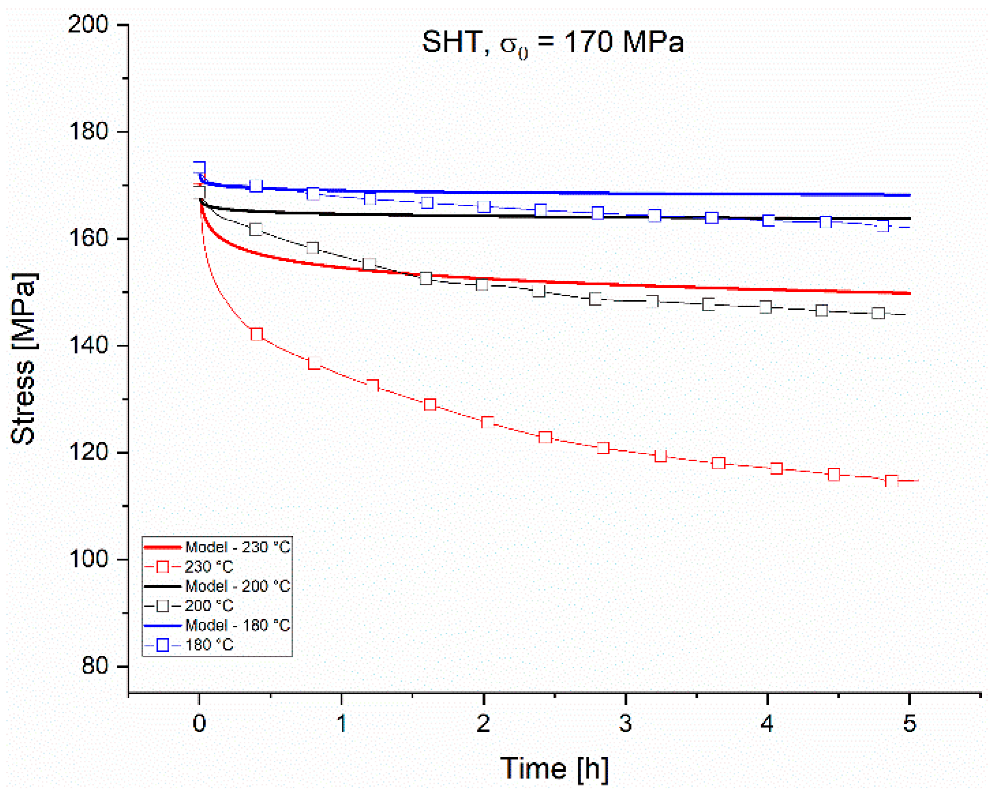
Figure 13 appear here more clearly. The model is not capable of tracking every single fluctuation of the experimental PSRs exactly, but it can predict the major changes of the PSRs.
The deviations from the model accounted for the development of the microstructure during the aging/relaxation of the specimen. Since the model takes only the starting condition of the sample in form of aging time t A A and aging temperature T A A  into account, no meaningful microstructure modifications, e.g., size and density, are incorporated in the model. On the other hand, notwithstanding the precautions taken for performing tests at a constant temperature, an isothermal temperature distribution in the specimen is not completely granted and a thermal expansion could lead to a faster relaxation.
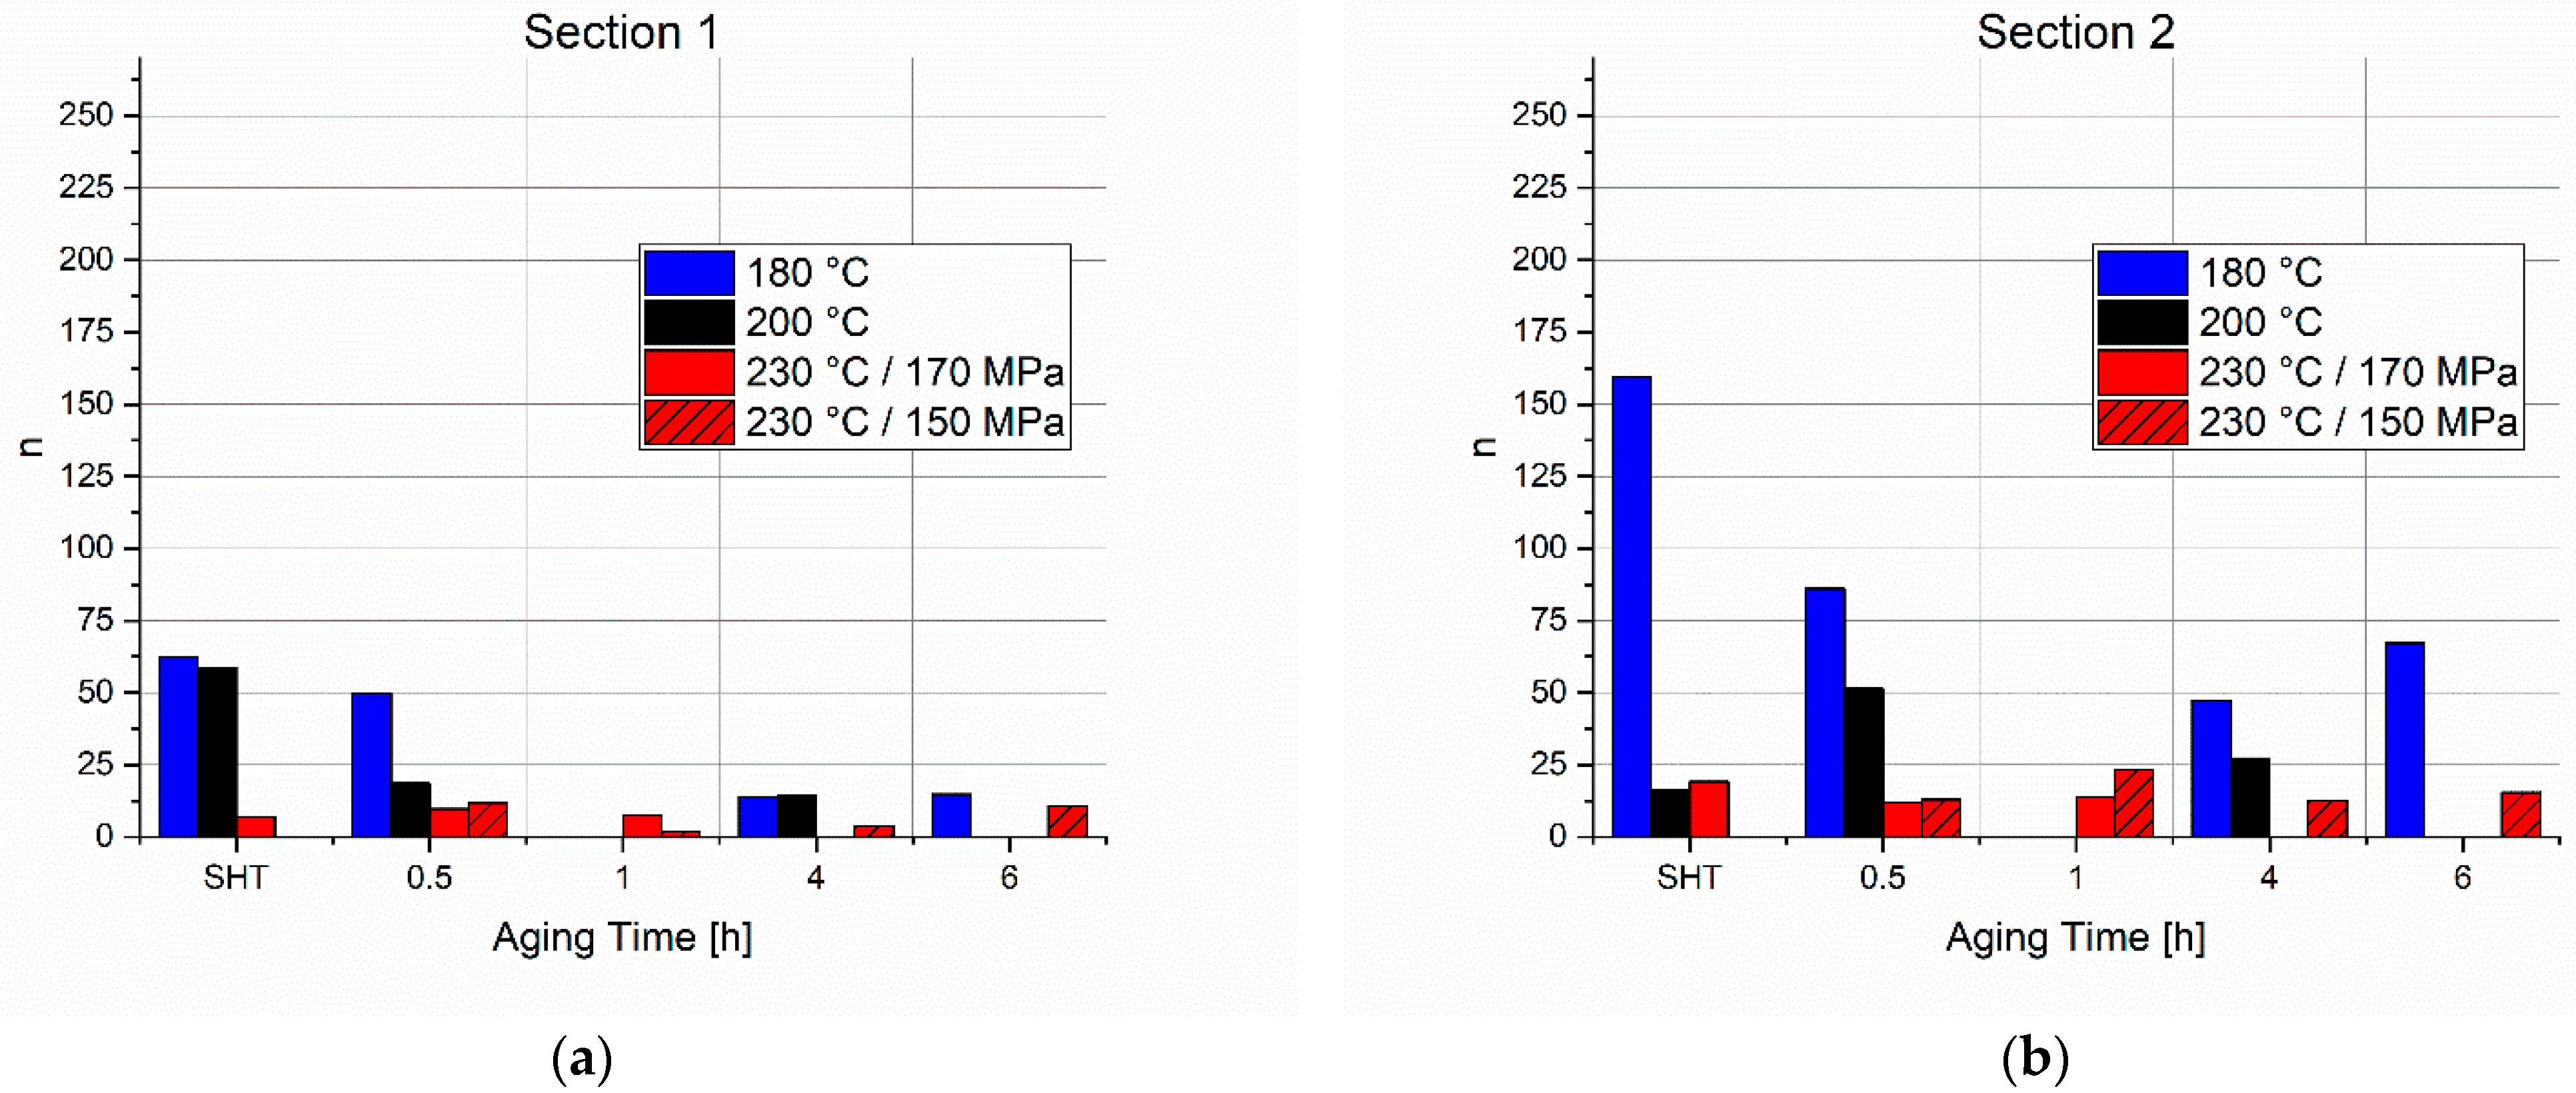
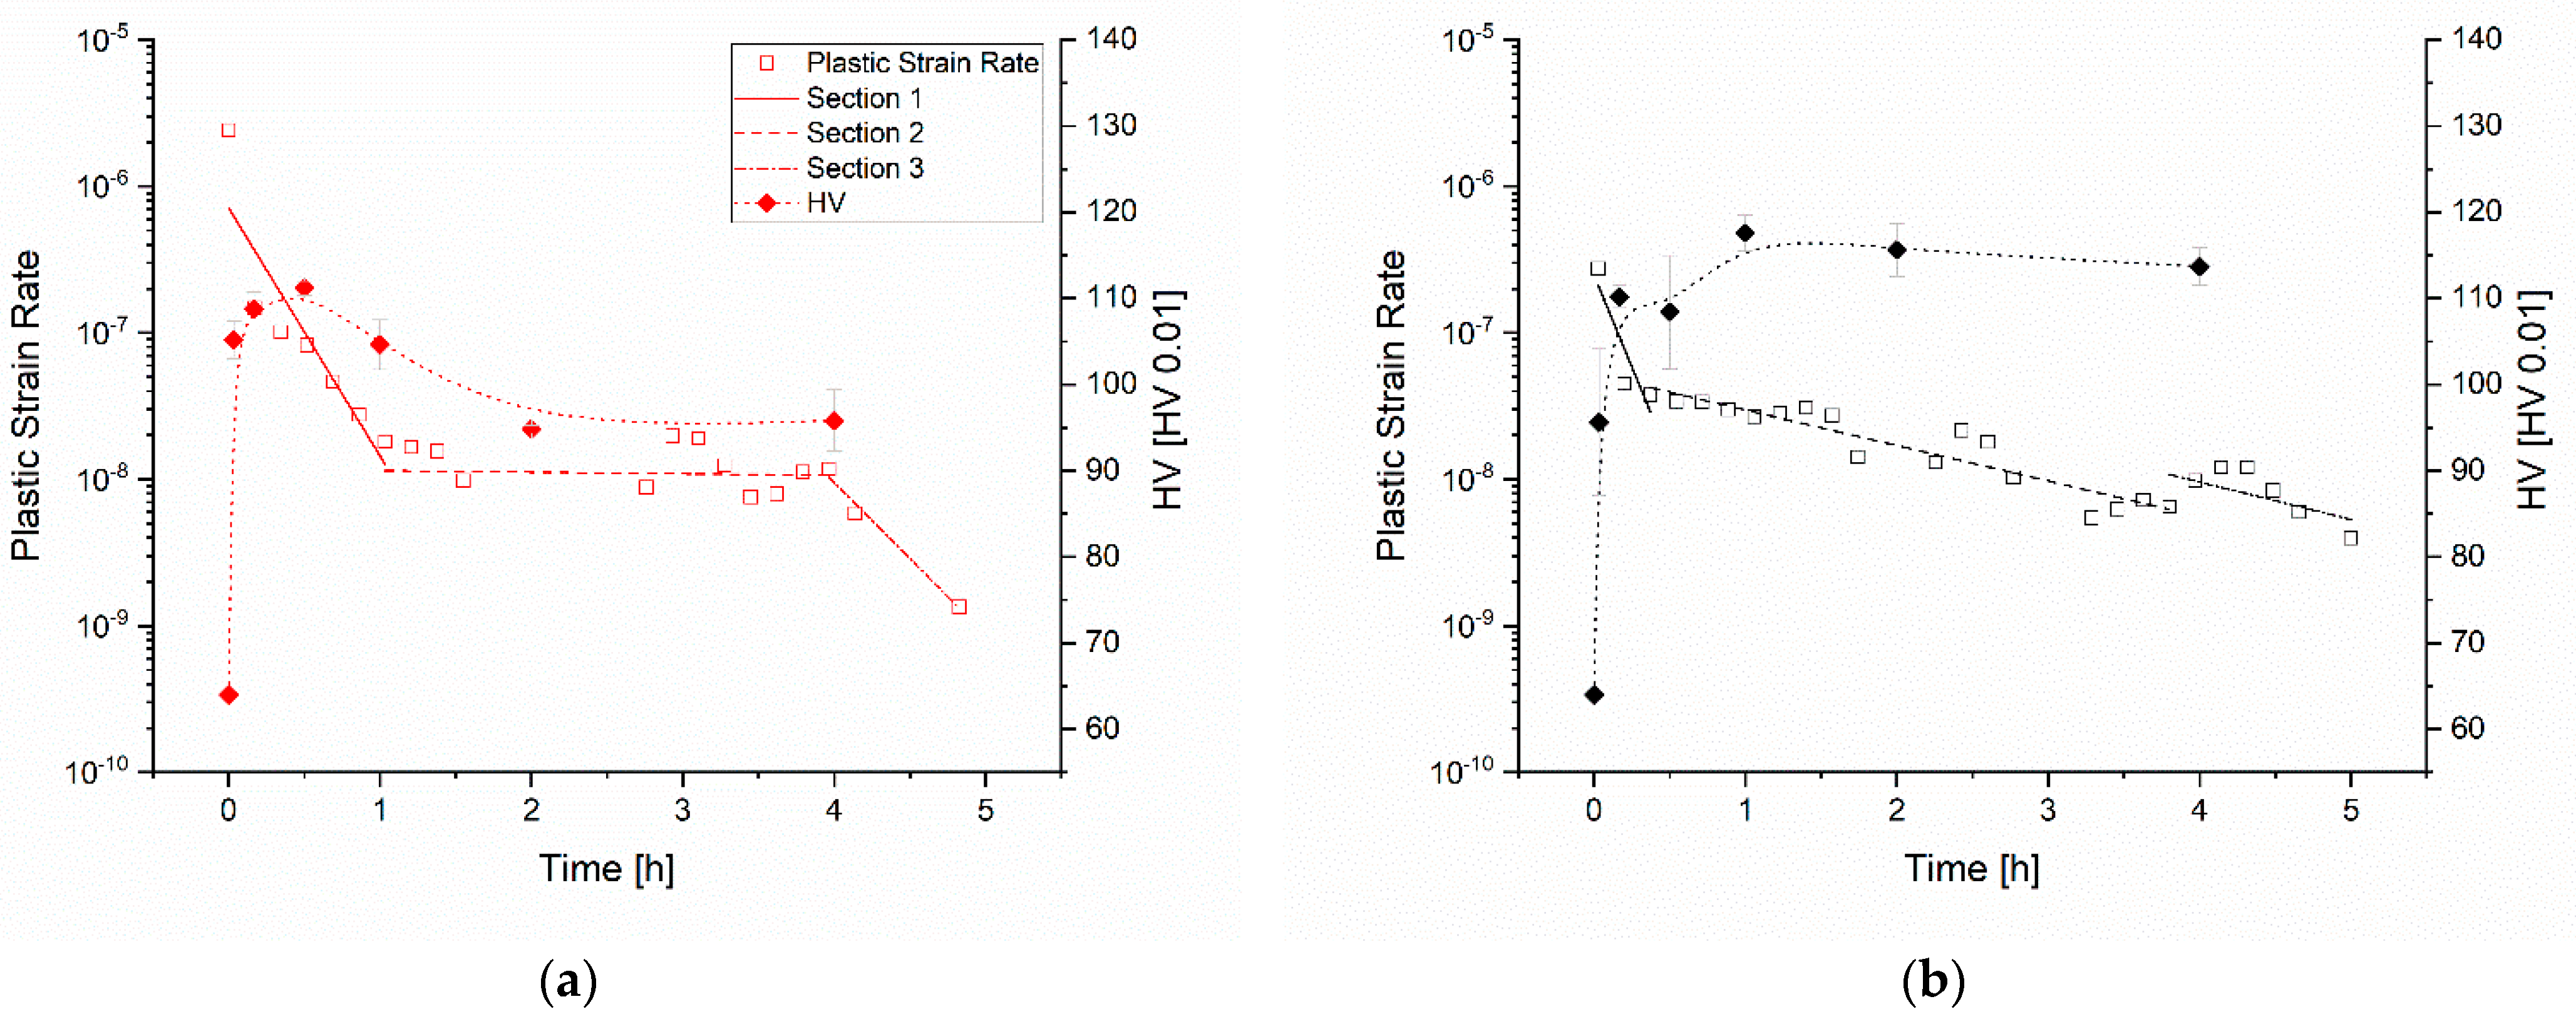
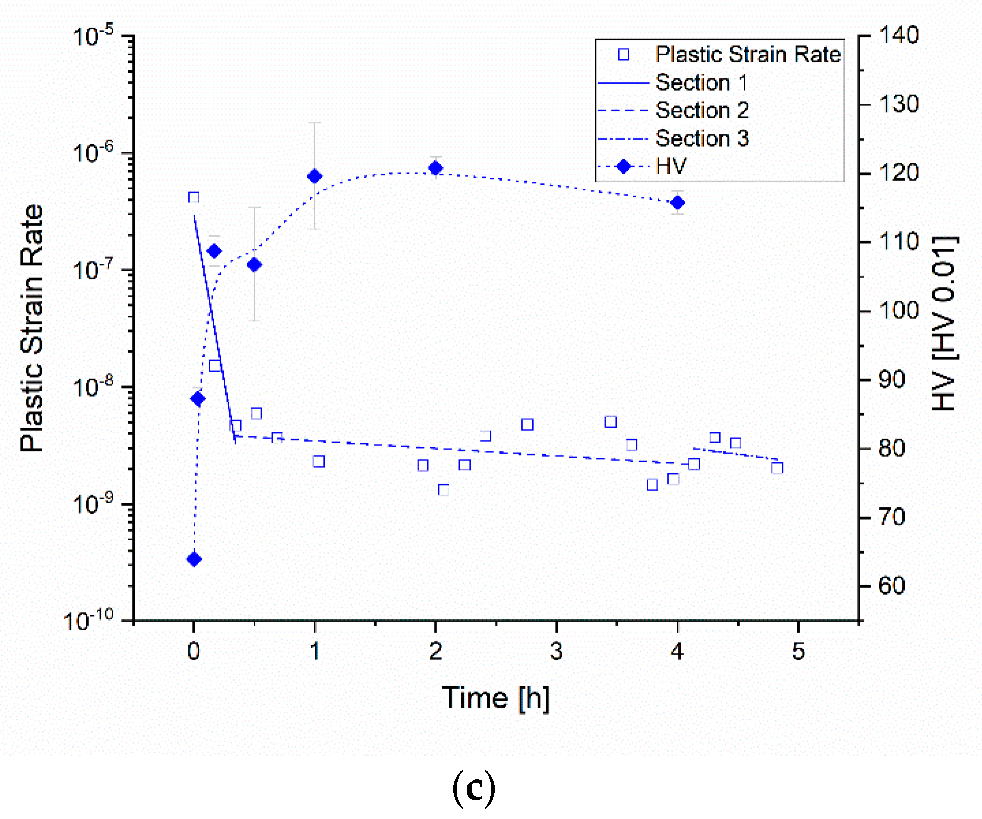
Three sections were identified with different slopes (stress exponents n), as described in Equation (7). The three sections correspond to the stress state and the three phases in the precipitation kinetics: (1) nucleation, (2) growth, and (3) coarsening. In 
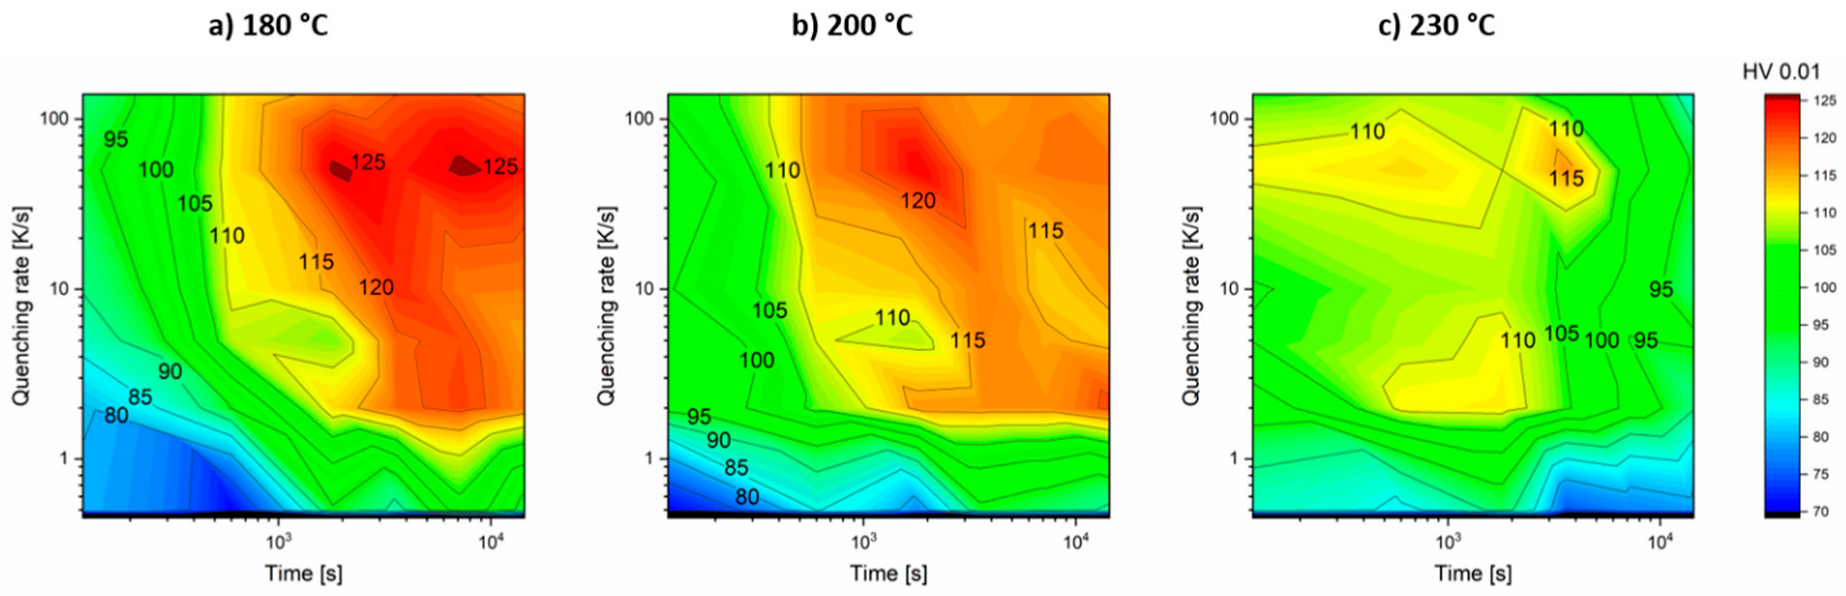
Figure 15, the PSRs of the tests in the SHT state and their linear fits are compared to the hardness evolution of the material for each temperature.
High plastic strain rates appear at the beginning of the test (Section 1) when the nucleation of precipitates starts, stresses and dislocation densities are high, and the dislocation movement is fast. The test at 230 °C starts with the highest PSR and the lowest deceleration. The tests at the other two temperatures start at PSRs a magnitude lower and decelerate much faster.
After reaching peak hardness (start of Section 2), the dislocation movement and relaxation process slowed down drastically in all the tests, indicating the presence of highly dispersed small particles interacting with a lower amount of dislocations that annihilate over time. The much faster precipitation process at 230 °C approaches the coarsening stage earlier and therefore the relaxation rate decreases not as much as for lower temperatures. The lower temperatures show no such coarsening stage within 5 h. The hardness profiles show a stable hardness of the material already after 1 h at a higher level than at 230 °C. Section 3 shows either further hardening for 180 °C and 200 °C or further coarsening accompanied by softening after the relatively stable Section 2 for 230 °C.
The stress exponents are plotted in Figure 16a–c, grouped by the different sections. In general, values of n showed that n 1 < n 2   < n 3   . This tendency represents the annihilation rate of dislocations starting with a large number density of dislocations at the beginning and decreasing over time. Overall, the tests at 180 °C have the highest values for n in all sections, followed by the values for 200 °C and 230 °C. This temperature dependence indicates much lower mobility of dislocations in the microstructure at lower temperatures. Whereas the values for n2 and n3 at 180/200 °C are high, much lower values were obtained at 230 °C. The lowest stress exponents are found in the first section, see Figure 16a, compared to the other two sections. That concludes that in the early stage of the relaxation, the dislocation density in the microstructure is high and the dislocation movement and annihilation are fast. Additionally, the low precipitate number density, especially for the tests in the SHT state accelerates the relaxation.
In Section 2 (Figure 16b), further nucleation and growth of precipitates hinder the movement of the dislocations. Furthermore, the dislocation density increases, and the stress relaxation slows down. The increase in n2 at 230 °C is much less than the increase in the tests at 200 °C and lower. According to the microhardness maps, the precipitates at higher temperatures are already in coarsening stage and the strength is lower than for 200 °C and 180 °C.
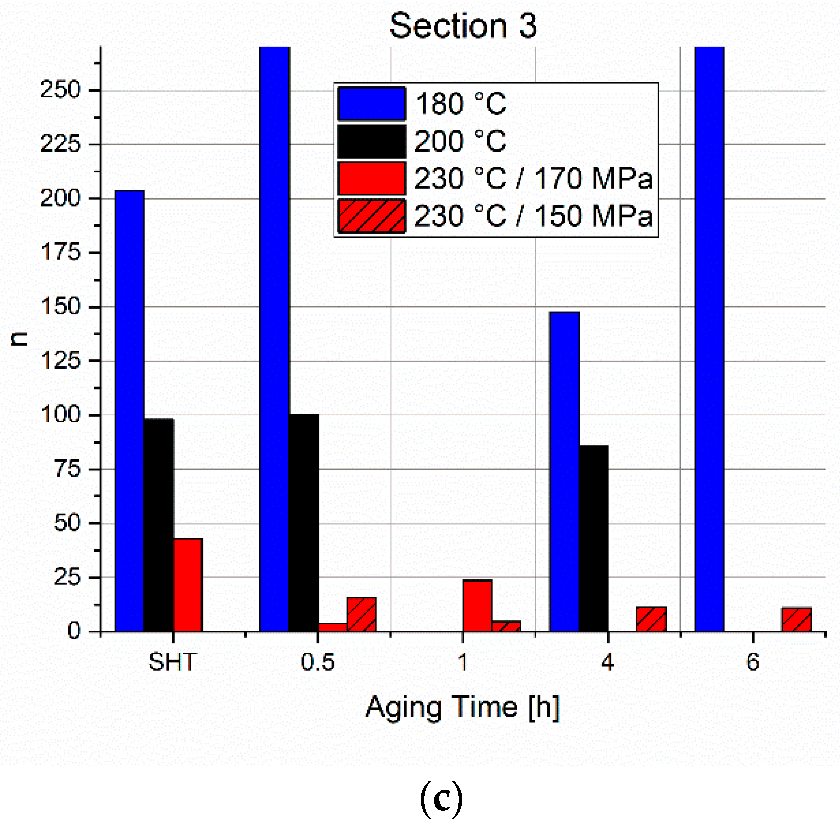
In the last section, the relaxation process comes to an end, indicated by the large values for n3 in Figure 16c for the tests at the two lower temperatures. The movement of dislocations is blocked due to Zener drag, and the low dislocation density does not suffer relevant annihilation. The still small values for n3 of the 230 °C means that the relaxation process is not finished after 5 h and that the precipitates coarsen, incrementing the stress relaxation rate.
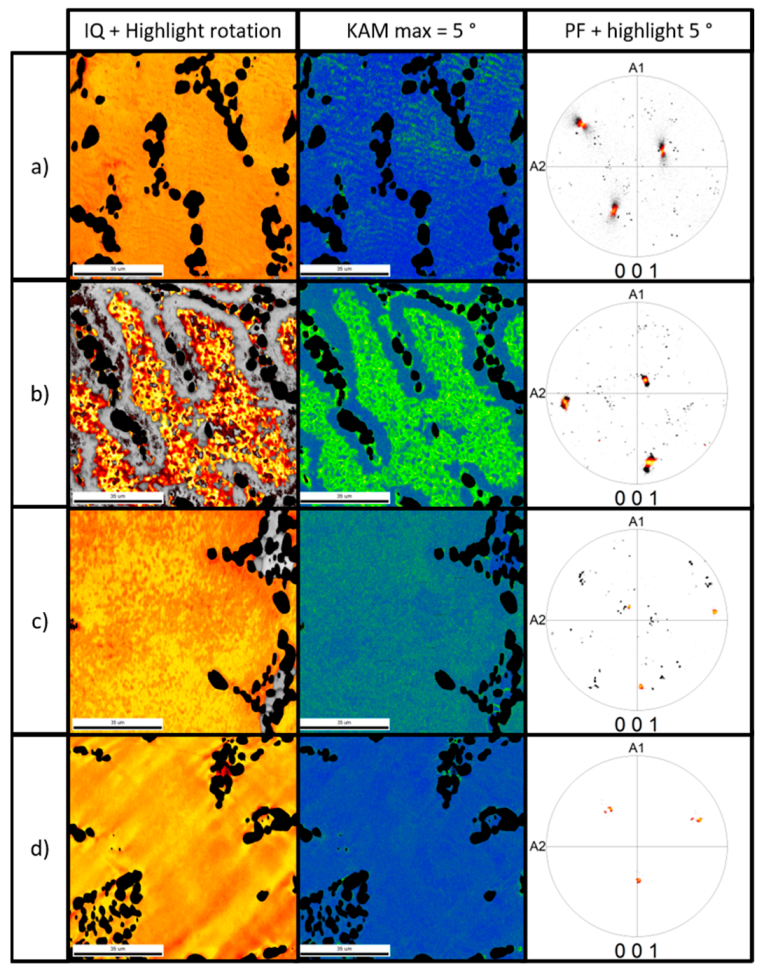
Figure 17 showing the kernel average misorientation of the material after SHT and water quenching, and after heat treated samples. The misorientation seen in the sample in the SHT state is due to the quenching-induced dislocations. The relaxation process reduces the spread of misorientation mainly dependent on the relaxation temperature. Whereas the dislocation movement needed for relaxation is hindered at 180 °C, the misorientation spread is still observed. The misorientation spread is significantly lower after relaxation at 200 °C and at 230 °C due to dislocation annihilation.

5. Summary and Conclusions

In this study, experiments on the stress relaxation of an AlSiMg alloy with Cu addition were performed. A phenomenological model based on the work of Rahimi et al. [15] was developed for the prediction of residual stress at any time and starting condition. The results of the tests and the simulation were then compared and the model was validated. Furthermore, the results of the test were linked to corresponding microhardness profiles and EBSD data to get an understanding of the processes during the competing mechanisms of precipitation and relaxation.
Relaxation is strongly dependent on the thermal history of the samples and the relaxation temperature. A microstructure that is already overaged showed a higher ability to relax, whereas samples in the SHT and shortly-aged states showed higher stress levels after 5 h. The higher mobility of dislocations in a microstructure with coarse precipitates was found in overaged conditions at 230 °C. Higher relaxation temperatures lead to lower stress levels after a certain time, which can also be explained by the increased mobility of dislocations at a higher temperature. The dislocations of the material in the SHT state lose the ability to move at 180 °C and 200 °C by increasing Zener drag and a later coarsening stage. Plastic strain rates are calculated for all tests and three sections with different stress exponents are identified, which correspond to the stages found in the precipitation kinetics.
The phenomenological model is dependent on the materials’ starting condition and the relaxation condition. A good agreement with the tests with an average deviation of 3.4% was found. The highest precision of the model was found to be for 180 °C and 200 °C. Since for each state only one experiment could be conducted, a variation of the results can be expected (e.g., 230 °C, 150 MPa, 6 h aged) and an improvement of the model’s accuracy might be necessary. The deviations in the experimental results could be related to the testing machine and inhomogeneous temperature distribution on the specimen during the test or sample heterogeneities. Nevertheless, the phenomenological model can be used for a fast assessment of the relaxation process without a large number of input parameters, but with low computational capability. Further works on a more physical model to predict the relaxation process due to microstructural changes obtained at different aging conditions, dislocation movement, and annihilation are needed.

Author Contributions

Conceptualization, M.C.P.; methodology, R.W.; validation, M.C.P. and E.G.; formal analysis, M.C.P.; investigation, R.W. and D.R.; resources, R.F.G. and B.S.; data curation, R.W.; writing—original draft preparation, R.W.; writing—review and editing, M.C.P.; visualization, R.W.; supervision, M.C.P. and E.G.; project administration, M.C.P. and R.W.; funding acquisition, M.C.P. All authors have read and agreed to the published version of the manuscript.

Funding

This work is funded by the Christian Doppler Research Association, D-1303000107 in the frame of the project entitled “Christian Doppler Laboratory for Design of high-performance alloys by thermomechanical processing”.

Data Availability Statement

All data and specimens are stored in the library of the Institute of Materials Science, Joining and Forming, Graz University of Technology, Kopernikusgasse 24/I, A-8010 Graz, Austria. An open access to the data can’t be provided due to Nemak Linz GmbH company secret policy.

Conflicts of Interest

The authors declare no conflict of interest.

References

  1. Davis, J.R. Aluminum and Aluminum Alloys; ASM International: Almere, The Netherlands, 2001. [Google Scholar] [CrossRef]
  2. Kammer, C.; Aluminium-Zentrale, D. Aluminium Taschenbuch 1 Grundlagen und Werkstoffe; Aluminium-Verlag: Essen, Germany, 2002. [Google Scholar]
  3. Polmear, I. Light Alloy: From Traditional Alloys to Nanocrystals; Elsevier: Amsterdam, The Netherlands, 2006; p. 421. [Google Scholar]
  4. Sjölander, E.; Seifeddine, S. The heat treatment of Al-Si-Cu-Mg casting alloys. J. Mater. Process. Technol. 2010, 210, 1249–1259. [Google Scholar] [CrossRef]
  5. Michelfeit, S. Dissertation: Werkstoffgesetze einer AlSi-Gusslegierung unter Hochtemperatur-beanspruchung in Abhängigkeit des Werkstoffzustandes; TU Darmstadt: Darmstadt, Germany, 2012. [Google Scholar]
  6. Matsuda, K.; Ikeno, S.; Gamada, H.; Fujii, K.; Uetani, Y.; Sato, T.; Kamio, A. High-Resolution Electron Microscopy on the Structure of Guinier-Preston Zones in an Al-1.6 Mass Pct Mg 2 Si Alloy. Metall. Mater. Trans. A 1998, 29, 1161–1167. [Google Scholar] [CrossRef]
  7. Edwards, G.A.; Stiller, K.; Dunlop, G.L.; Couper, M.J. The precipitation sequence in Al–Mg–Si alloys. Acta Mater. 1998, 46, 3893–3904. [Google Scholar] [CrossRef]
  8. Sjölander, E.; Seifeddine, S. Artificial ageing of Al–Si–Cu–Mg casting alloys. Mater. Sci. Eng. A 2011, 528, 7402–7409. [Google Scholar] [CrossRef]
  9. Xiao, D.H.; Wang, J.N.; Ding, D.Y.; Chen, S.P. Effect of Cu content on the mechanical properties of an Al–Cu–Mg–Ag alloy. J. Alloys Compd. 2002, 343, 77–81. [Google Scholar] [CrossRef]
  10. Farkoosh, A.R.; Pekguleryuz, M. Enhanced mechanical properties of an Al–Si–Cu–Mg alloy at 300 C: Effects of Mg and the Q-precipitate phase. Mater. Sci. Eng. A 2015, 621, 277–286. [Google Scholar] [CrossRef]
  11. Xu, Y.; Yang, L.; Zhan, L.; Yu, H.; Huang, M. Creep Mechanisms of an Al–Cu–Mg Alloy at the Macro-and Micro-Scale: Effect of the S′/S Precipitate. Materials 2019, 12, 2907. [Google Scholar] [CrossRef] [PubMed]
  12. Lei, C.; Li, H.; Fu, J.; Bian, T.J.; Zheng, G.W. Non-isothermal creep aging behaviors of an Al-Zn-Mg-Cu alloy. Mater. Charact. 2018, 144, 431–439. [Google Scholar] [CrossRef]
  13. Godlewski, L.A.; Su, X.; Pollock, T.M.; Allison, J.E. The effect of aging on the relaxation of residual stress in cast aluminum. Metall. Mater. Trans. A 2013, 44, 4809–4818. [Google Scholar] [CrossRef]
  14. Rao, G.R.; Gupta, O.P.; Pradhan, B. Application of stress relaxation testing in evaluation of creep strength of a tungsten-alloyed 10% Cr cast steel. Int. J. Press. Vessel. Pip. 2011, 88, 65–74. [Google Scholar] [CrossRef]
  15. Rahimi, S.; King, M.; Dumont, C. Stress relaxation behaviour in IN718 nickel based superalloy during ageing heat treatments. Mater. Sci. Eng. A 2017, 708, 563–573. [Google Scholar] [CrossRef]
  16. Ram, D. Effect of Thermal Treatment Parameters on the Age-Hardening of AlSi7Cu0.5Mg; University of Technology Graz: Graz, Austria, 2019. [Google Scholar]
Figure 1. SEM images of the Al7SiCu0.5Mg alloy in SHT state showing the different phases present: (a) secondary electron mode; (bd) back scattered electron mode.
Crystals 12 01168 g001
Figure 2. Contour plots of ISO hardness values as a function of the quenching rate and aging time for (a) 180 °C, (b) 200 °C, (c) 230 °C.
Crystals 12 01168 g002
Figure 3. True stress–strain curves of the Al alloy in the conditions investigated in this work.
Crystals 12 01168 g003
Figure 4. Scheme of the stress relaxation tests showing a first heating and temperature stabilization stage without loading, followed by deformation up to a constant strain. Over time, the stresses get relaxed.
Crystals 12 01168 g004
Figure 5. Plotted functions for the parameters (a) “a” dependent on aging temperature and aging time and (b) “b” dependent on initial stress and relaxation temperature.
Crystals 12 01168 g005
Figure 6. Normalized stress relaxation curves tested at 230 °C.
Crystals 12 01168 g006
Figure 7. Normalized stress relaxation curves tested at 200 °C.
Crystals 12 01168 g007
Figure 8. Normalized stress relaxation curves tested at 180 °C.
Crystals 12 01168 g008
Figure 9. Comparison of experimental and simulated stress relaxation curves, tested in SHT condition at 230 °C, 200 °C, and 180 °C with a test stress of 170 MPa.
Crystals 12 01168 g009
Figure 10. Comparison of experimental and simulated stress relaxation curves, tested in aged condition at 230 °C with a test stress of 170 MPa.
Crystals 12 01168 g010
Figure 11. Comparison of experimental and simulated stress relaxation curves tested in aged condition at 230 °C with test stress of 150 MPa.
Crystals 12 01168 g011
Figure 12. Comparison of experimental and simulated stress relaxation curves tested in aged condition at 200 °C with test stress of 190 MPa.
Crystals 12 01168 g012
Figure 13. Comparison of experimental and simulated stress relaxation curves tested in aged condition at 180 °C with test stress of 190 MPa.
Crystals 12 01168 g013
Figure 14. Comparison of the experimental and the simulated plastic strain rates (PSR) (a) after SHT condition and tested at 230 °C, 200 °C, 180 °C, and 190 MPa; (b) after ageing tested at 230 °C and 170 MPa; (c) at 230 °C and 150 MPa; (d) at 200 °C and 190 MPa; (e) at 180 °C and 190 MPa.
Crystals 12 01168 g014aCrystals 12 01168 g014bCrystals 12 01168 g014c
Figure 15. Definition of the 3 different sections of the PSR and comparison with hardness evolution curves, shown as an example on tests in SHT condition and tested at: (a) 230 °C; (b) 200 °C; (c) 180 °C.
Crystals 12 01168 g015aCrystals 12 01168 g015b
Figure 16. Calculated n values for (a) Section 1, (b) Section 2, and (c) Section 3.
Crystals 12 01168 g016aCrystals 12 01168 g016b
Figure 17. EBSD results: image quality, kernel average misorientation and pole figures of different material conditions: (a) SHT and quenched; (b) aged for 4 h and 5 h relaxed at 180 °C; (c) aged for 4 h and 5 h relaxed at 200 °C; (d) aged for 4 h and 5 h relaxed at 230 °C.
Crystals 12 01168 g017
Table 1. Measured chemical composition of the AlSi7Cu0.5Mg.
ElementSiFeCuMgTiAl
wt.%6.830.1070.5310.3790.120Bal.
Table 2. List of experimental conditions for the relaxation tests.
Temperature [°C]Aging Time [h]Initial Stress [MPa]
230-170
0.5170
150
1170
150
4150
6150
150
200-170
0.5190
4190
180-170
0.5190
4190
6190
Table 3. Numerically-adjusted parameters of the phenomenological model.
Parameterzaoa1a2a3
Value260.06−240.20 × 10322.61 × 10−355.30 × 10⁶
Unit-K--
Parameterzb0b1b2
Value−74.4514.27 × 1038.48
Unit-K-
ParameterT00t00σ00
Value1.001.001.00
UnitKSMPa
Publisher’s Note: MDPI stays neutral with regard to jurisdictional claims in published maps and institutional affiliations.

