
Saturation Spectroscopic Studies on Yb3+ and Er3+ Ions in Li6Y(BO3)3 Single Crystals


Abstract
:1. Introduction
2. Materials and Methods
3. Results
4. Discussion
5. Conclusions
Author Contributions
Funding
Institutional Review Board Statement
Informed Consent Statement
Data Availability Statement
Acknowledgments
Conflicts of Interest
References
- Sun, Y.; Thiel, C.W.; Cone, R.L.; Equall, R.W.; Hutcheson, R.L. Recent progress in developing new rare earth materials for hole burning and coherent transient applications. J. Lumin. 2002, 98, 281–287. [Google Scholar] [CrossRef]
- Bottger, T.; Thiel, C.W.; Sun, Y.; Cone, R.L. Optical decoherence and spectral diffusion at 1.5 μm in Er3+:Y2SiO5 versus magnetic field, temperature, and Er3+ concentration. Phys. Rev. B 2006, 73, 075101. [Google Scholar] [CrossRef]
- Bottger, T.; Sun, Y.; Thiel, C.W.; Cone, R.L. Spectroscopy and dynamics of Er3+:Y2SiO5 at 1.5 μm. Phys. Rev. B 2006, 74, 075107. [Google Scholar] [CrossRef]
- Guillot-Noel, O.; Vezin, H.; Goldner, P.; Beaudoux, F.; Vincent, J.; Lejay, J.; Lorgere, I. Direct observation of rare-earth-host interactions in Er:Y2SiO5. Phys. Rev. B 2007, 76, 180408. [Google Scholar] [CrossRef]
- Thiel, C.W.; Macfarlane, R.M.; Bottger, T.; Sun, Y.; Cone, R.L.; Babbitt, W.R. Optical decoherence and persistent spectral hole burning in Er3+:LiNbO3. J. Lumin. 2010, 130, 1603–1609. [Google Scholar] [CrossRef]
- Wang, G.; Xue, Y.; Wu, J.-H.; Gao, J.-Y. Phase dependences of optical dispersion and group velocity in an Er3+-doped yttrium aluminium garnet crystal. J. Phys. B At. Mol. Opt. Phys. 2006, 39, 4409–4417. [Google Scholar] [CrossRef]
- Bottger, T.; Sun, Y.; Pryde, G.J.; Reinemer, G.; Cone, R.L. Diode laser frequency stabilization to transient spectral holes and spectral diffusion in Er3+:Y2SiO5 at 1536 nm. J. Lumin. 2001, 9495, 565–568. [Google Scholar] [CrossRef]
- Afzelius, M.; Staudt, M.U.; de Riedmatten, H.; Simon, C.; Hastings-Simon, S.R.; Ricken, R.; Suche, H.; Sohler, W.; Gisin, N. Interference of spontaneous emission of light from two solid-state atomic ensembles. New J. Phys. 2007, 9, 413. [Google Scholar] [CrossRef]
- Xu, H.; Dai, Z.; Jiang, Z. Effect of concentration of the Er3+ ion on electromagnetically induced transparency in Er3+:YAG crystal. Phys. Lett. A 2002, 294, 19–25. [Google Scholar] [CrossRef]
- Baldit, E.; Bencheikh, K.; Monnier, P.; Levenson, J.A.; Rouget, V. Ultraslow Light Propagation in an Inhomogeneously Broadened Rare-Earth Ion-Doped Crystal. Phys. Rev. Lett. 2005, 95, 143601. [Google Scholar] [CrossRef]
- Staudt, M.U.; Hastings-Simon, S.R.; Nilsson, M.; Afzelius, M.; Scarani, V.; Ricken, R.; Suche, H.; Sohler, W.; Tittel, W.; Gisin, N. Fidelity of an Optical Memory Based on Stimulated Photon Echoes. Phys. Rev. Lett. 2007, 98, 113601. [Google Scholar] [CrossRef] [PubMed]
- Lauritzen, B.; Minar, J.; de Riedmatten, H.; Afzelius, M.; Gisin, N. Approaches for a quantum memory at telecommunication wavelengths. Phys. Rev. A 2011, 83, 012318. [Google Scholar] [CrossRef]
- Thiel, C.W.; Bottger, T.; Cone, R.L. Rare-earth-doped materials for applications in quantum information storage and signal processing. J. Lumin. 2011, 131, 353–361. [Google Scholar] [CrossRef]
- Thiel, C.W.; Sun, Y.; Macfarlane, R.M.; Bottger, T.; Cone, R.L. Rare-earth-doped LiNbO3 and KTiOPO4 (KTP) for waveguide quantum memories. J. Phys. B At. Mol. Opt. Phys. 2012, 45, 124013. [Google Scholar] [CrossRef]
- Dajczgewand, J.; Ahlefeldt, R.; Bottger, T.; Louchet- Chauvet, A.; Le Gouet, J.-L.; Chaneliere, T. Optical memory bandwidth and multiplexing capacity in the erbium telecommunication window. New J. Phys. 2015, 17, 023031. [Google Scholar] [CrossRef]
- Paschotta, R.; Nilsson, J.; Tropper, A.C.; Hanna, D.C. Ytterbium-doped fiber amplifiers. IEEE J. Quantum Electron. 1997, 33, 1049–1056. [Google Scholar] [CrossRef]
- Kränkel, C.; Fagundes-Peters, D.; Fredrich, S.T.; Johannsen, J.; Mond, M.; Huber, G.; Bernhagen, M.; Uecker, R. Continuous wave laser operation of Yb3+:YVO4. Appl. Phys. B 2004, 79, 543–546. [Google Scholar] [CrossRef]
- Shekhovtsov, A.N.; Tolmachev, A.V.; Dubovik, M.F.; Dolzhenkova, E.F.; Korshikova, T.I.; Grinyov, B.V.; Baumer, V.N.; Zelenskaya, O.V. Structure and growth of pure and Ce3+-doped Li6Gd(BO3)3 single crystals. J. Cryst. Growth 2002, 242, 167–171. [Google Scholar] [CrossRef]
- Yang, F.; Pan, S.K.; Ding, D.Z.; Chen, X.F.; Feng, H.; Ren, G.H. Crystal growth and luminescent properties of the Ce-doped Li6Lu(BO3)3. J. Cryst. Growth 2010, 312, 2411–2414. [Google Scholar] [CrossRef]
- Peter, A.; Polgar, K.; Toth, M. Synthesis and crystallization of lithium-yttrium orthoborate Li6Y(BO3)3 phase. J. Cryst. Growth 2012, 346, 69–74. [Google Scholar] [CrossRef]
- Zhao, Y.W.; Gong, X.H.; Chen, Y.J.; Huang, L.X.; Lin, Y.F.; Zhang, G.; Tan, Q.G.; Luo, Z.D.; Huang, Y.D. Spectroscopic properties of Er3+ ions in Li6Y(BO3)3 crystal. Appl. Phys. B 2007, 88, 51–55. [Google Scholar] [CrossRef]
- Sablayrolles, J.; Jubera, V.; Guillen, F.; Decourt, R.; Couzi, M.; Chaminade, J.P.; Garcia, A. Infrared and visible spectroscopic studies of the ytterbium doped borate Li6Y(BO3)3. Opt. Commun. 2007, 280, 103–109. [Google Scholar] [CrossRef]
- Zhao, Y.; Xie, Y.; Li, Z.; Gong, X.; Chen, Y.; Lin, Y.; Huang, Y. Polarized Spectral Properties of Er-Yb-Codoped Li6Y(BO3)3 Single Crystal. In Proceedings of the Symposium on Photonics and Optoelectronics (SOPO), Shanghai, China, 21–23 May 2012; pp. 1–3. [Google Scholar] [CrossRef]
- Skvortsov, A.P.; Poletaev, N.K.; Polgar, K.; Peter, A. Absorption spectra of Er3+ ions in Li6Y(BO3)3 crystals. Tech. Phys. Lett. 2013, 39, 424–426. [Google Scholar] [CrossRef]
- Kovács, L.; Arceiz Casas, S.; Corradi, G.; Tichy-Rács, É.; Kocsor, L.; Lengyel, K.; Ryba-Romanowski, W.; Strzep, A.; Scholle, A.; Greulich-Weber, S. Optical and EPR spectroscopy of Er3+ in lithium yttrium borate, Li6Y(BO3)3:Er single crystals. Opt. Mater. 2017, 72, 270–275. [Google Scholar] [CrossRef]
- Delaigue, M.; Jubera, V.; Sablayrolles, J.; Chaminade, J.-P.; Garcia, A.; Manek-Honninger, I. Mode-locked and Q-switched laser operation of the Yb-doped Li6Y(BO3)3 crystal. Appl. Phys. B 2007, 87, 693–696. [Google Scholar] [CrossRef]
- Zhao, Y.; Lin, Y.F.; Chen, Y.J.; Gong, X.H.; Luo, Z.D.; Huang, Y.D. Spectroscopic properties and diode-pumped 1594 nm laser performance of Er:Yb:Li6Y(BO3)3 crystal. Appl. Phys. B 2008, 90, 461–464. [Google Scholar] [CrossRef]
- Kis, Z.; Mandula, G.; Lengyel, K.; Hajdara, I.; Kovacs, L.; Imlau, M. Homogeneous linewidth measurements of Yb3+ ions in congruent and stoichiometric lithium niobate crystals. Opt. Mat. 2014, 37, 845–853. [Google Scholar] [CrossRef]
- Mandula, G.; Kis, Z.; Kovacs, L.; Szaller, Z.; Krampf, A. Site-selective measurement of relaxation properties at 980 nm in Er3+-doped congruent and stoichiometric lithium niobate crystals. Appl. Phys. B 2016, 122, 72. [Google Scholar] [CrossRef]
- Huang, J.; Zhang, J.M.; Lezama, A.; Mossberg, T.W. Excess dephasing in photon-echo experiments arising from excitation-induced electronic level shifts. Phys. Rev. Lett. 1989, 63, 78–81. [Google Scholar] [CrossRef]
- Yen, W.M.; Scott, W.C.; Schawlow, A.L. Phonon-Induced Relaxation in Excited Optical States of Trivalent Praseodymium in LaF3. Phys. Rev. 1964, 136, A271–A283. [Google Scholar] [CrossRef]
- Henderson, B.; Imbusch, G.F. Chapter 5: Electronic Centres in a Vibrating Crystalline Environment. In Optical Spectroscopy of Inorganic Solids; Monographs on the Physics and Chemistry of Materials 44, 1st ed.; Henderson, B., Imbusch, G.F., Eds.; Oxford University Press Inc.: New York, NY, USA, 1989; pp. 183–257. ISBN 9780199298624. [Google Scholar]
- Ellens, A.; Andres, H.; Meijerink, A.; Blasse, G. Spectral-line-broadening study of the trivalent lanthanide-ion series. I. Line broadening as a probe of the electron-phonon coupling strength. Phys. Rev. B 1997, 55, 173–179. [Google Scholar] [CrossRef]
- Lim, H.J.; Welinski, S.; Ferrier, A.; Goldner, P.; Morton, J.J.L. Coherent spin dynamics of ytterbium ions in yttrium orthosilicate. Phys. Rev. B 2018, 97, 064409. [Google Scholar] [CrossRef]
- Yuan, D.; Víllora, E.G.; Shimamura, K. Flux-growth of Ce:LiY6O5(BO3)3 single crystals during the Czochralski pulling from nearly congruent Ce:Li6Y(BO3)3 and their optical properties. J. Solid State Chem. 2021, 300, 122286. [Google Scholar] [CrossRef]


| Wavenumber, Stark Energy (cm−1) | Halfwidth (cm−1) | Reference | |||
|---|---|---|---|---|---|
| Er3+ | 4I15/2 | 1 | 0 | [25] | |
| 2 | 47 | [25] | |||
| 3 | 76 | [25] | |||
| 4 | 113 | [25] | |||
| 5 | 368 | [25] | |||
| 6 | 466 | [25] | |||
| 7 | 497 | [25] | |||
| 8 | 524 | [25] | |||
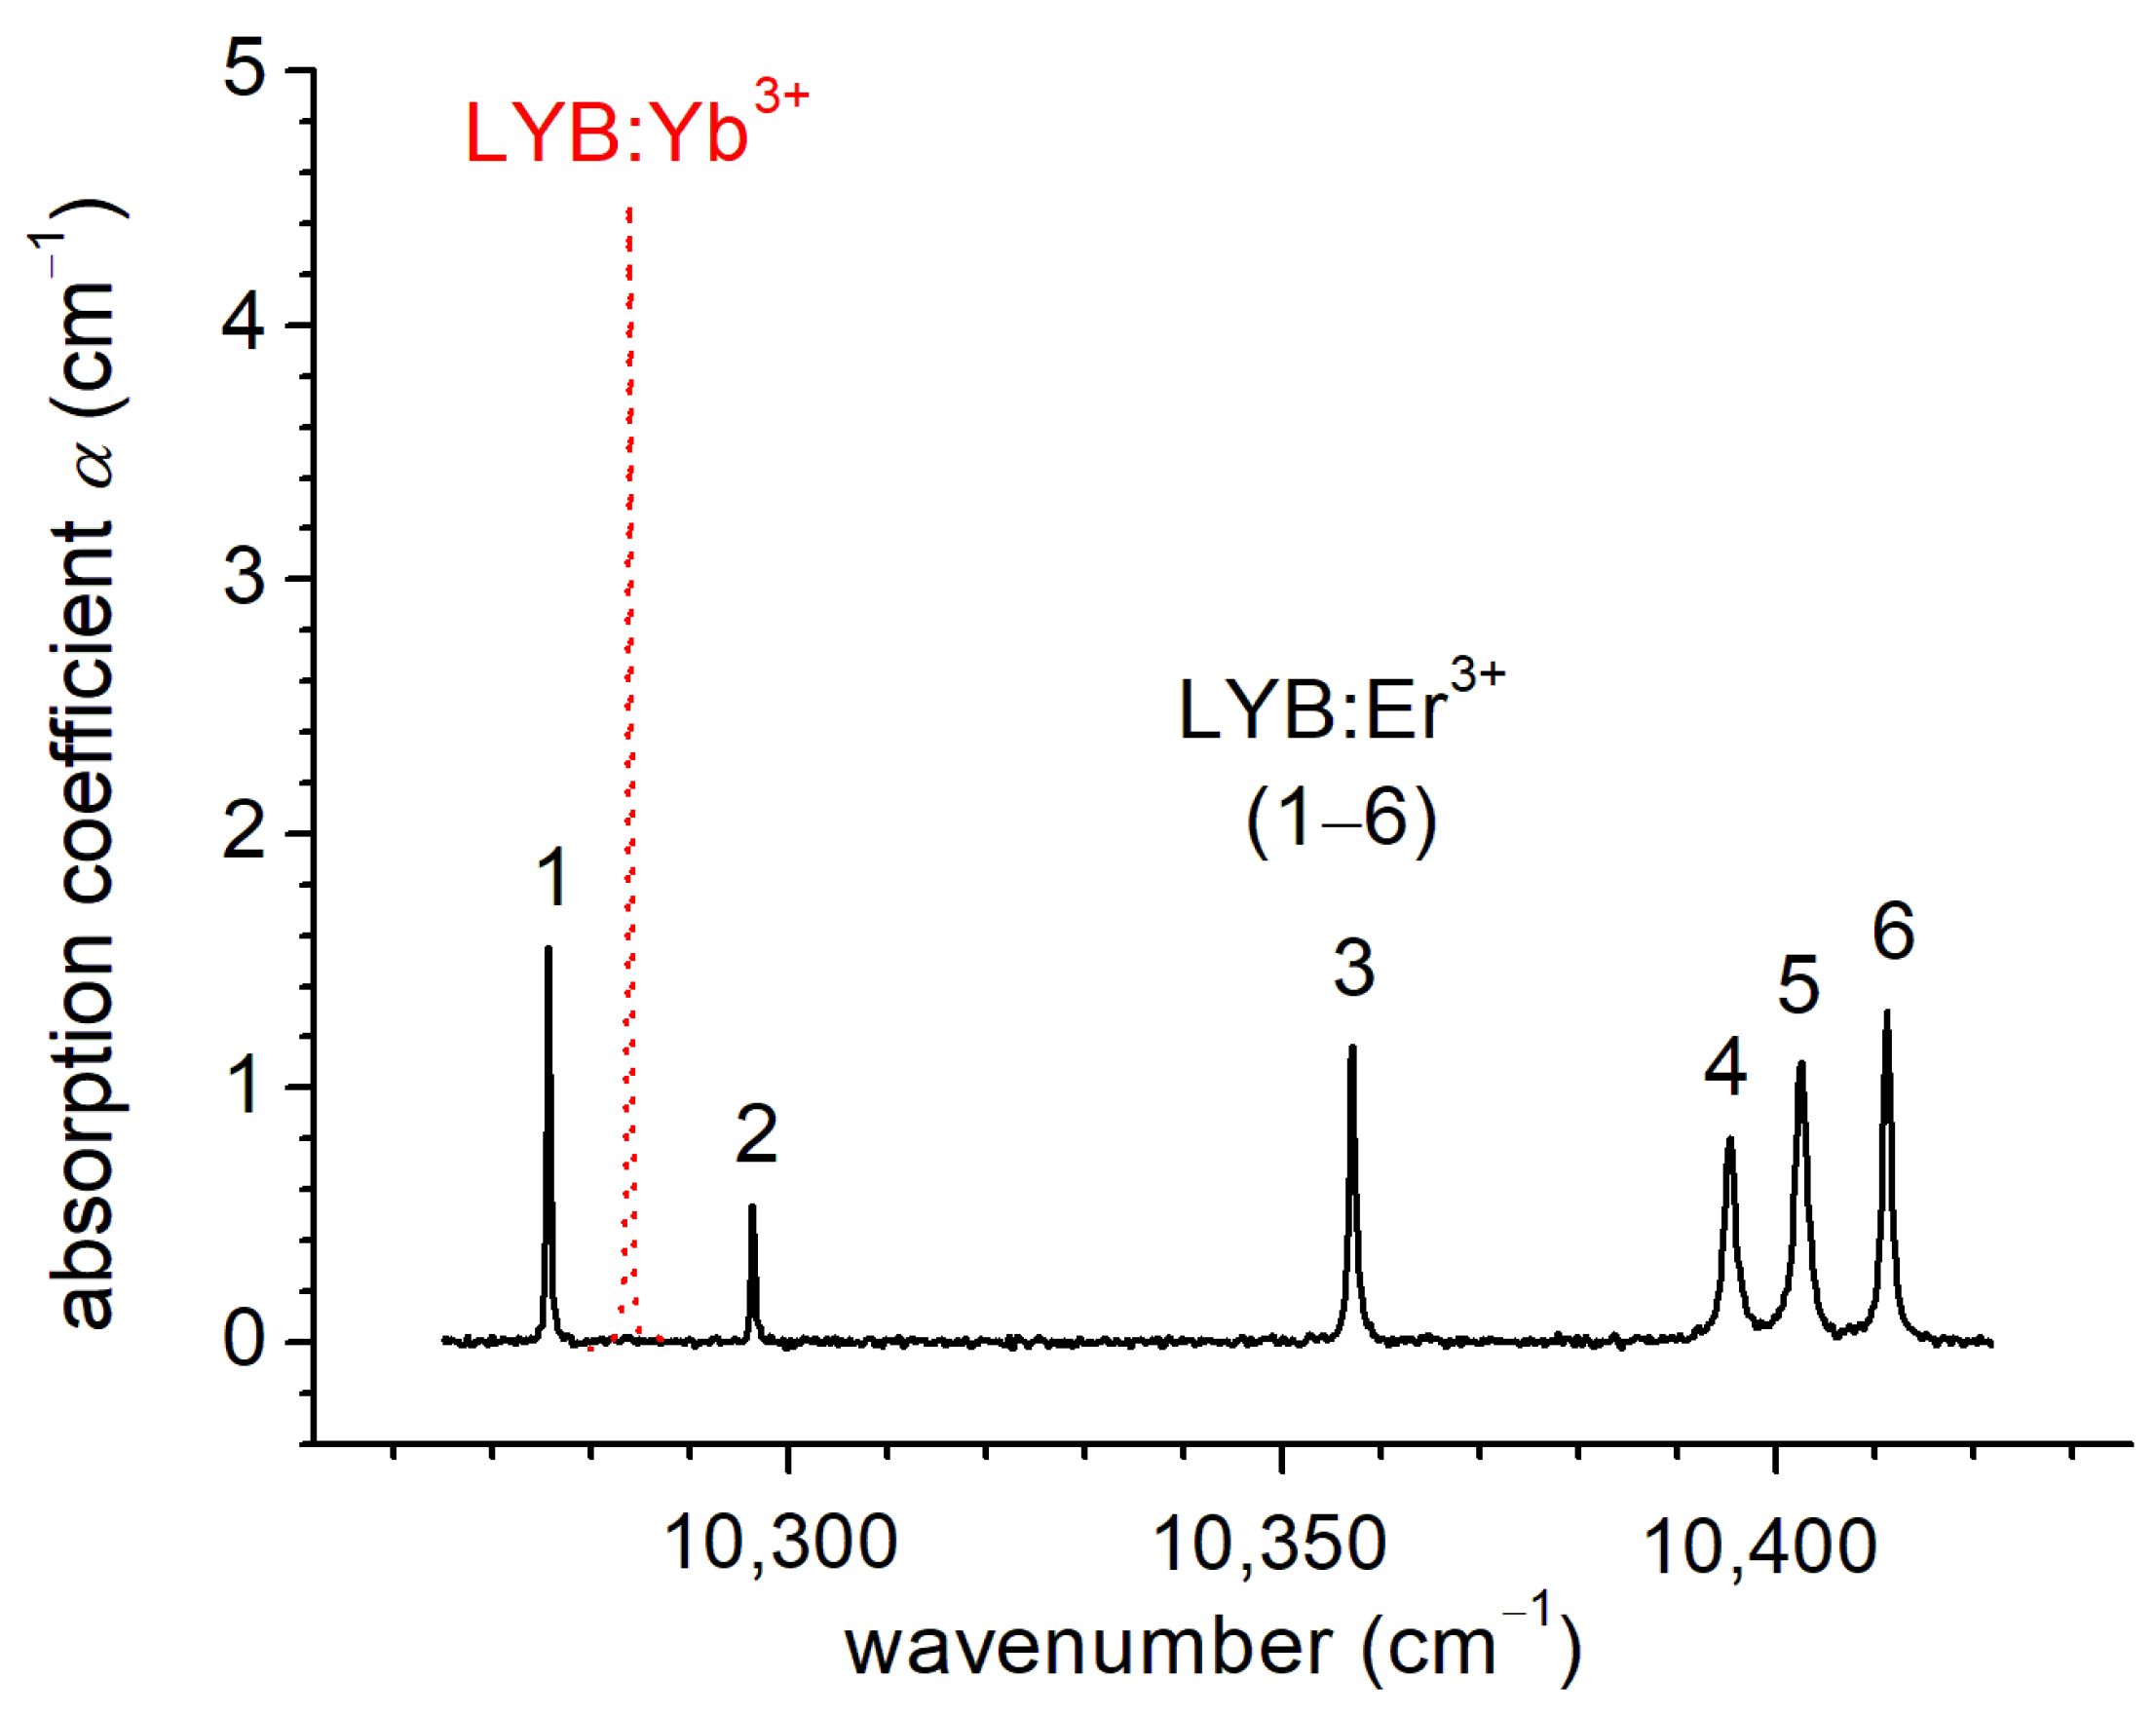
| 4I11/2 | 1 | 10,275.34 | 0.14 | present work | |
| 2 | 10,295.97 | 0.15 | present work | ||
| 3 | 10,356.69 | 0.51 | present work | ||
| 4 | 10,394.97 | 1.17 | present work | ||
| 5 | 10,402.08 | 1.13 | present work | ||
| 6 | 10,410.85 | 0.77 | present work | ||
| Yb3+ | 2F7/2 | 1 | 0 | [22] | |
| 2 | 367 | [22] | |||
| 3 | 507 | [22] | |||
| 4 | 676 | [22] | |||
| 2F5/2 | 1 | 10,283.58 | 0.18 | present work | |
| 2 | 10,475 | ≈50 | present work | ||
| 3 | 10,810 | ≈80 | present work |
| Material | Yb/Er Conc (mol%) | α (cm−1) | L (mm) | T1 (μs) | T2 (ns) | ω0 (cm−1) |
|---|---|---|---|---|---|---|
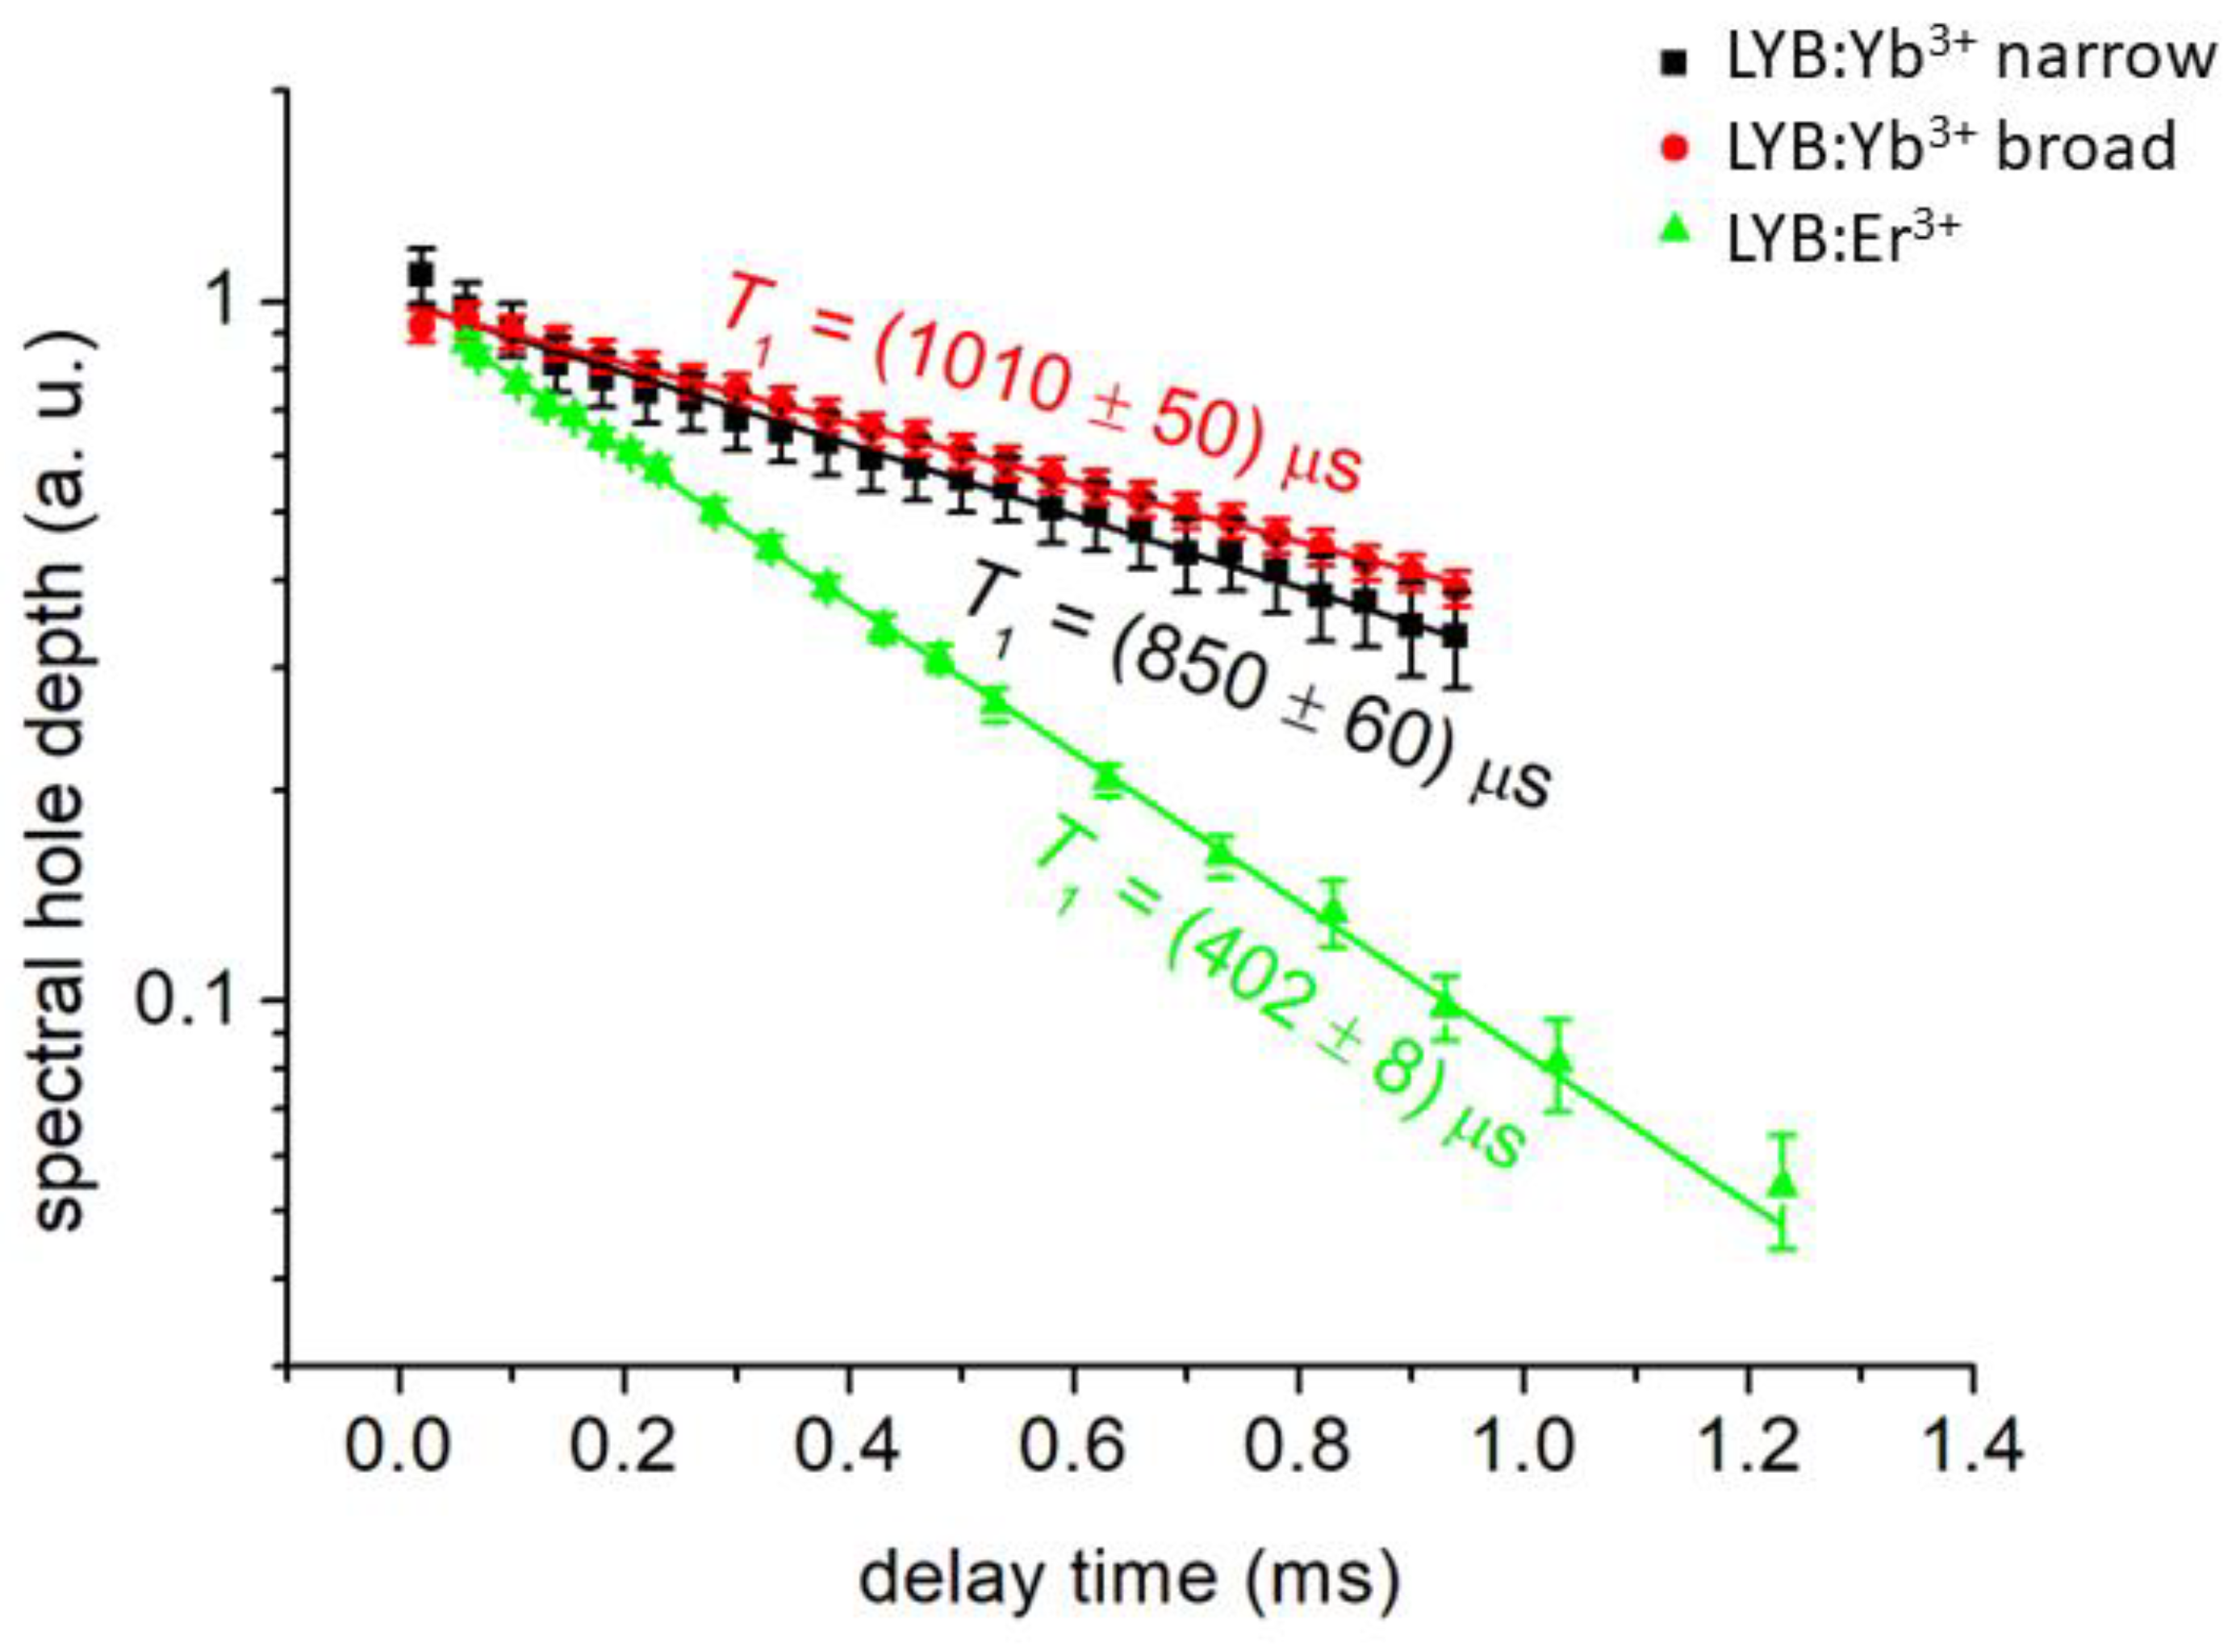
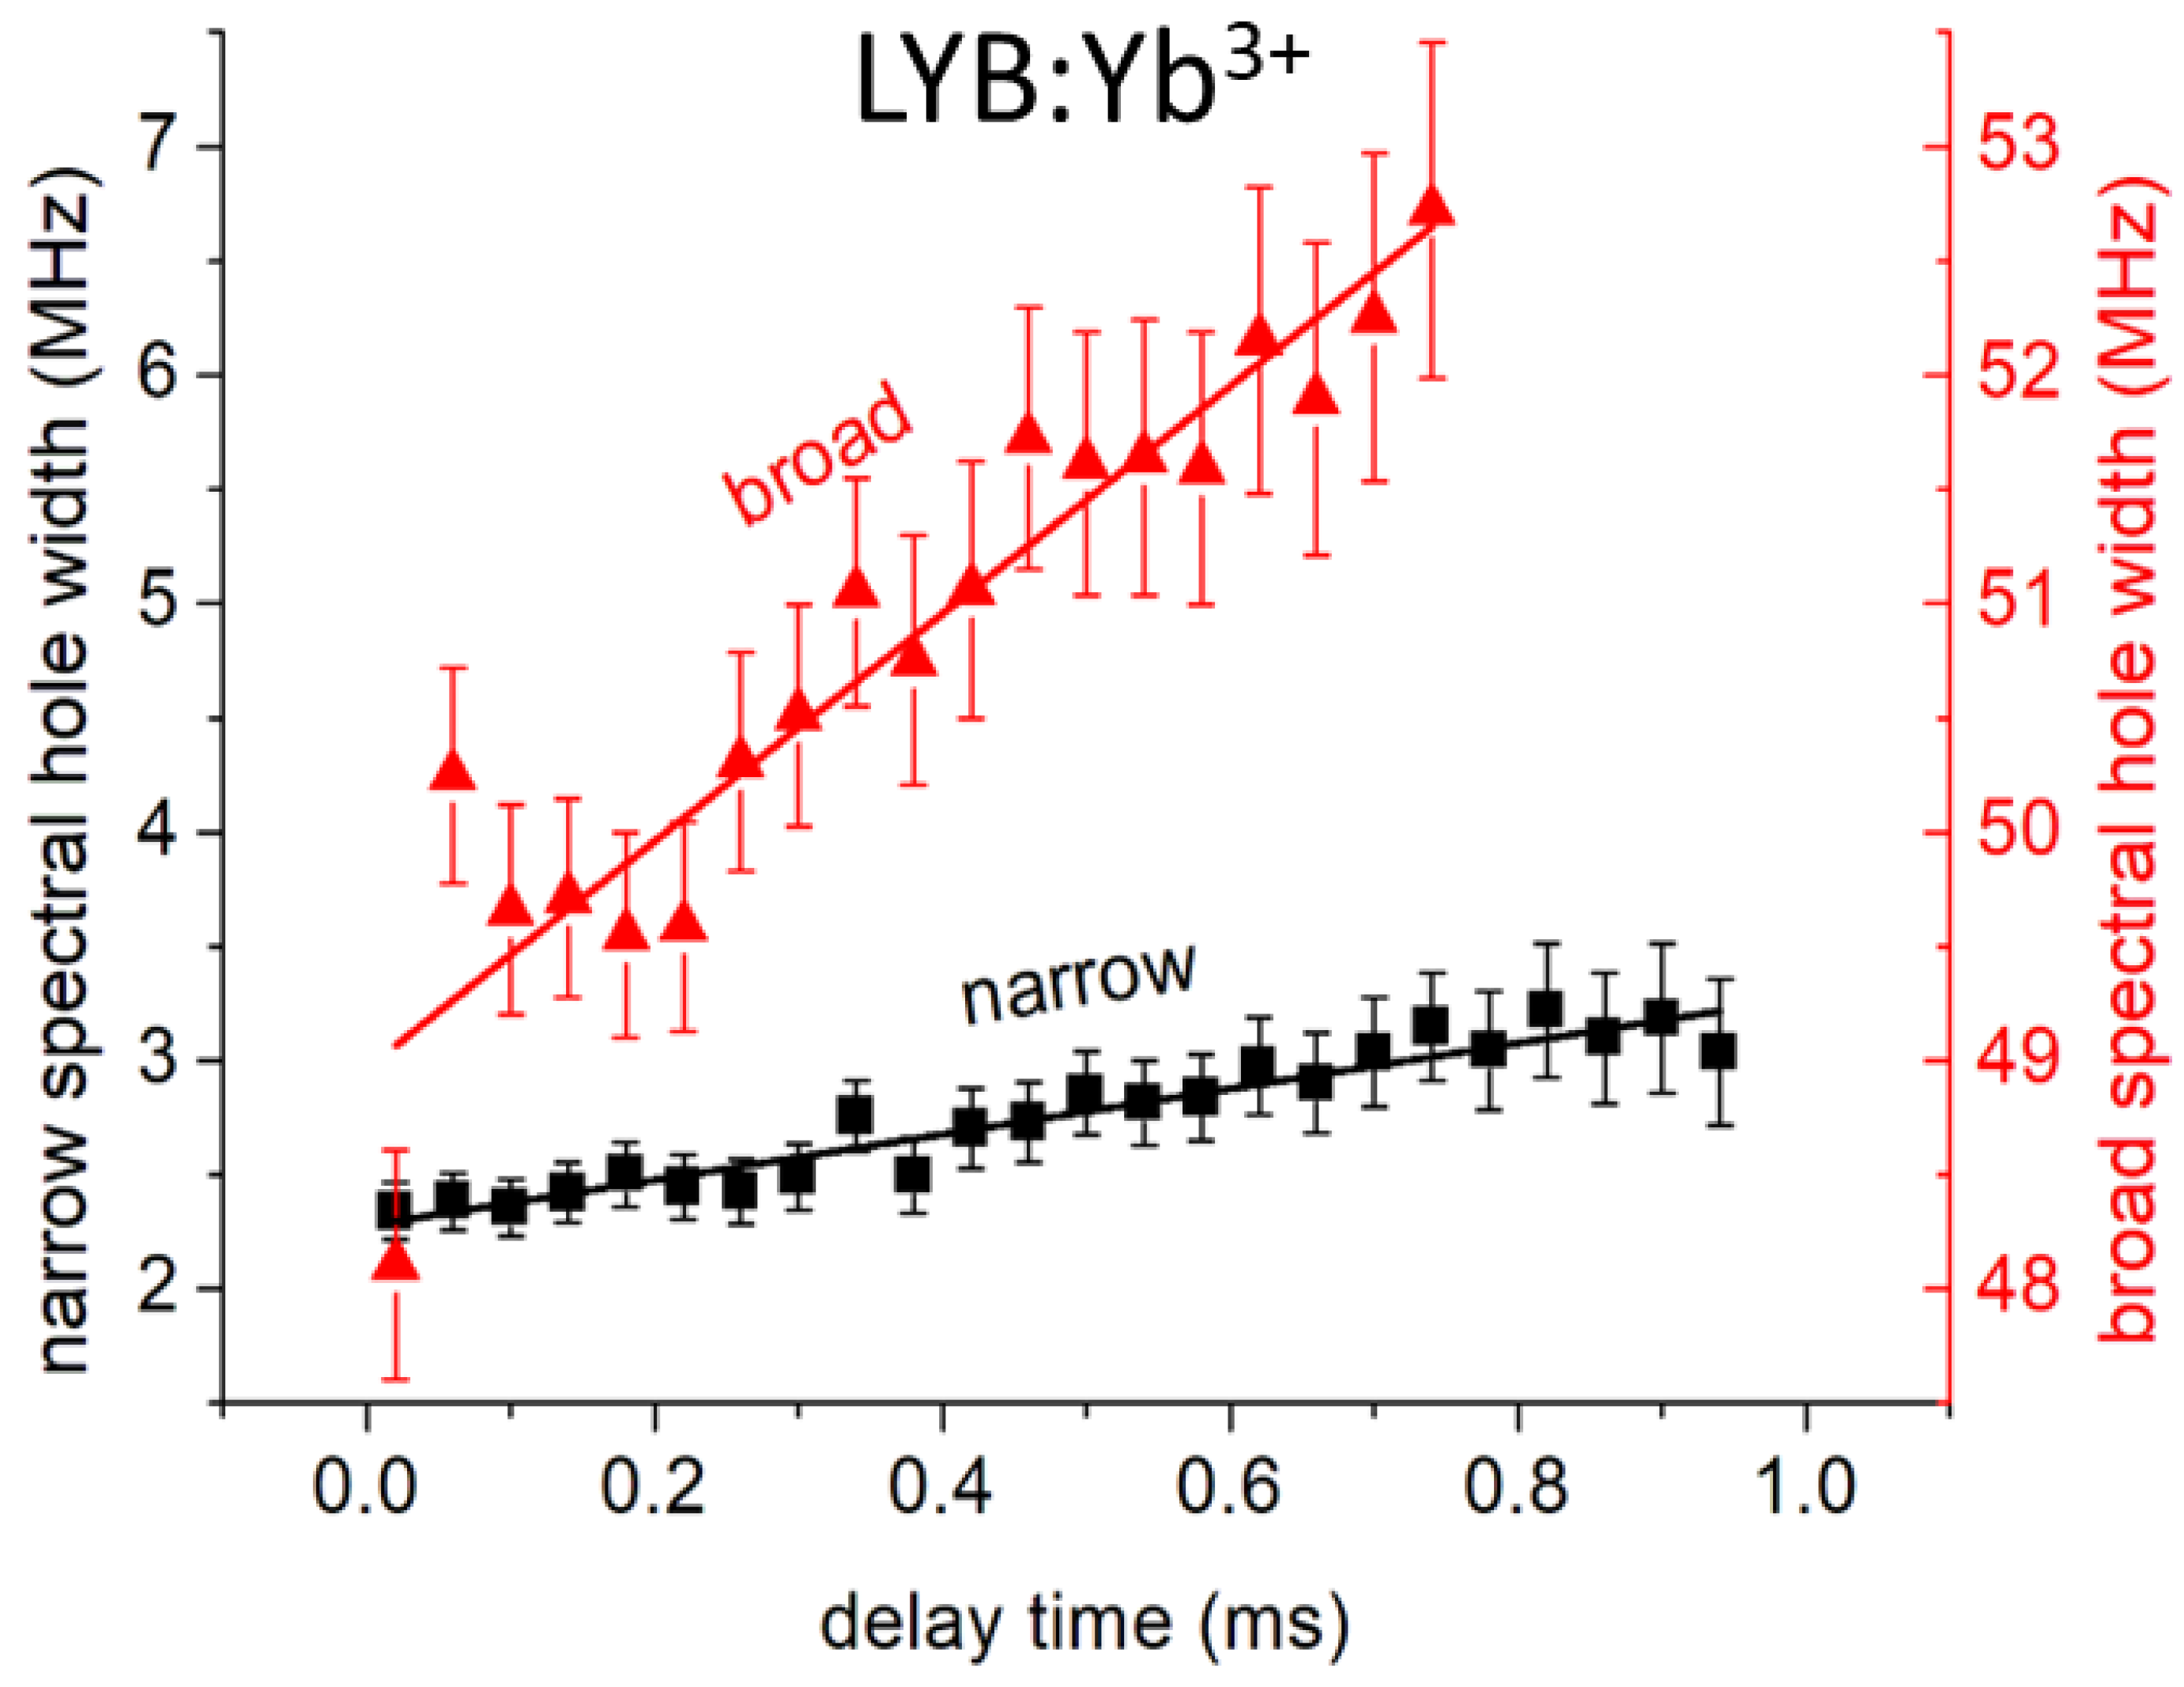
| LYB:Yb3+ narrow | 0.1 * | 9.6 | 0.60 | 850 ± 60 | 1100 ± 120 | 58 ± 6 |
| broad | 1010 ± 50 | 14.2 ± 0.3 | 145 ± 8 | |||
| sLN:Yb3+ [28] narrow | 0.09 | 26 | 0.57 | 266 ± 17 | 134 ± 7 | 143 ± 20 |
| broad | 438 ± 29 | 18.2 ± 0.5 | 54 ± 9 | |||
| cLN:Yb3+ [28] narrow | 0.18 | 11.7 | 0.48 | 386 ± 34 | 240 ± 20 | 65 ± 8 |
| broad | 420 ± 20 | 16 ± 1 | 89 ± 7 | |||
| Y2SiO5:Yb3+ [34] | 0.005 | 4920 ± 10 | 103,000 ± 10,000 | |||
| LYB:Er3+ | 0.05 * | 3.1 | 2.00 | 402 ± 8 | 11.9 ± 0.2 | 58 ± 3 |
| sLN:Er3+ [29] | 0.1 | 3.4 | 1.85 | 270 ± 140 | 6.84 ± 0.13 | 44 ± 3 |
| cLN:Er3+ [29] | 0.1 | 0.44 | 1.89 | 160 ± 80 | 5.83 ± 0.11 | 37 ± 4 |
Publisher’s Note: MDPI stays neutral with regard to jurisdictional claims in published maps and institutional affiliations. |
© 2022 by the authors. Licensee MDPI, Basel, Switzerland. This article is an open access article distributed under the terms and conditions of the Creative Commons Attribution (CC BY) license (https://creativecommons.org/licenses/by/4.0/).
Share and Cite
Mandula, G.; Kis, Z.; Lengyel, K.; Kovács, L.; Tichy-Rács, É. Saturation Spectroscopic Studies on Yb3+ and Er3+ Ions in Li6Y(BO3)3 Single Crystals. Crystals 2022, 12, 1151. https://doi.org/10.3390/cryst12081151
Mandula G, Kis Z, Lengyel K, Kovács L, Tichy-Rács É. Saturation Spectroscopic Studies on Yb3+ and Er3+ Ions in Li6Y(BO3)3 Single Crystals. Crystals. 2022; 12(8):1151. https://doi.org/10.3390/cryst12081151
Chicago/Turabian StyleMandula, Gábor, Zsolt Kis, Krisztián Lengyel, László Kovács, and Éva Tichy-Rács. 2022. "Saturation Spectroscopic Studies on Yb3+ and Er3+ Ions in Li6Y(BO3)3 Single Crystals" Crystals 12, no. 8: 1151. https://doi.org/10.3390/cryst12081151
APA StyleMandula, G., Kis, Z., Lengyel, K., Kovács, L., & Tichy-Rács, É. (2022). Saturation Spectroscopic Studies on Yb3+ and Er3+ Ions in Li6Y(BO3)3 Single Crystals. Crystals, 12(8), 1151. https://doi.org/10.3390/cryst12081151