Article

Corrosion Mechanism and the Effect of Corrosion Time on Mechanical Behavior of 5083/6005A Welded Joints in a NaCl and NaHSO3 Mixed Solution

1
Hunan Engineering Research Center of Forming Technology and Damage Resistance Evaluation for High Efficiency Light Alloy Components, Hunan University of Science and Technology, Xiangtan 411201, China
2
Zhuzhou CRRC Times Electric Co., Ltd., Zhuzhou 412001, China
3
Zhuzhou Times Metals Manufacturing Co., Ltd., Zhuzhou 412001, China
*
Authors to whom correspondence should be addressed.
Crystals 2022, 12(8), 1150; https://doi.org/10.3390/cryst12081150
Submission received: 19 June 2022 / Revised: 30 July 2022 / Accepted: 9 August 2022 / Published: 16 August 2022
(This article belongs to the Special Issue Mechanical Properties of Advanced Metallic Materials)

Abstract

:
The effect of corrosion time on the mechanical behavior of 5083/6005A welded joints in a 3.5% NaCl + 0.01 mol/L NaHSO3 solution was evaluated via scanning electron microscopy (SEM), polarization curve analysis, and X-ray photoelectron spectroscopy (XPS). The prediction model of fatigue life after corrosion was established based on the experimental results and the theory of fracture mechanics, and the formula for the effect of corrosion time on lifespan was determined. The results show that with increasing corrosion time, the corrosion of the sample becomes increasingly severe, and the elongation and fatigue life of the 5083/6005A welded joints decrease significantly. The corrosion resistance of the 5083/6005A welded joints decreases with increasing corrosion time because the corrosive medium promotes the destruction of the oxide film and thereby reduces the corrosion resistance. The corrosion products of the 5083/6005A welded joints are Al(OH)3 and AlCl3.

1. Introduction

Due to their low density, good formability, and excellent corrosion resistance, 5083 and 6005A aluminum alloys have been widely used for preparing critical components in high-speed trains, such as body structures, electrical cabinets, and lifting lugs [1], which are usually joined by melt inert-gas welding (MIG) [2,3]. In practice, these components of high-speed trains are exposed to diverse service environments, such as humidity and salt spray. The 5083/6005A aluminum alloy welded joints are prone to corrosion, causing a sharp decline in fatigue life and premature fracture of aluminum alloy welded joints [4]. Thus, it is highly desirable and necessary to assess the effect of corrosion on the mechanical behavior of the 5083/6005A welded joints.
It is generally recognized that aluminum alloys are vulnerable to chloride (Cl) corrosion, especially in the marine atmosphere polluted by industry. The deposition of industrial pollutants such as SO2 in the environment further accelerates the anodic dissolution process of metals. Therefore, many scholars have explored the effect of aluminum alloy corrosion on mechanical behavior in NaCl solutions [5,6,7], NaHSO3, and NaCl mixed solutions [8]. These studies found that Cl and SO42− have significant effects on the mechanical properties of the aluminum alloy after corrosion [9,10,11]. Mishra’s study found that the corrosion of aluminum alloy in 3.5% NaCl solution reduces the alloy’s mechanical tensile properties and fatigue life, and the impact on fatigue properties is particularly significant [10]. Aluminum alloy exposed to a solution containing Cl rapidly generates corrosion pits on its surface, and cracks are induced to propagate under the action of stress [11]. Ma et al. [12] found that, after a 7075 aluminum alloy welded joint was corroded by 3.5% NaCl solution, there were multiple crack sources in the fracture after fatigue fracture, which mainly appeared in the corrosion pits, causing a significant reduction in the fatigue life of the aluminum alloy. In addition, when NaHSO3 is added to NaCl solution, HSO3 in the solution is ionized to H+ and SO32−, and SO32− is readily oxidized to SO42−, which promotes further ionization of HSO3, leading to a decrease in solution pH [8]. In an acidic environment, the lower the pH value, the faster the corrosion rate of aluminum alloys, and the more significant the effect on the mechanical properties of aluminum alloys [13]. Ge et al. [14] estimated the effects of adding different concentrations of NaHSO3 to 3.5% NaCl solution on the mechanical properties of 2024 and 7075 aluminum alloys. They found that the tensile strength and elongation decreased with increasing HSO3 concentration, and the corrosion rates of the two aluminum alloys increased. However, the fatigue behavior of dissimilar aluminum alloy welded joints after corrosion in mixed solutions has rarely been reported, especially the fatigue behavior of 5xxx and 6xxx aluminum alloy welded joints after corrosion in NaCl and NaHSO3 mixed solution. Thus, the fatigue mechanism of 5xxx and 6xxx aluminum alloy welded joints after corrosion remains unclear.
In the present work, the effect of corrosion time on the mechanical behavior of 5083/6005A welded joints in 3.5% NaCl + 0.01 mol/L NaHSO3 solution was studied. The corrosion mechanism was revealed, and the corrosion model was established by measuring the corrosion products of the 5083/6005A welded joints. The fatigue life prediction model of the 5083/6005A welded joints after corrosion was established based on the fatigue test results after corrosion. This study aims to provide a reference for the safe application of 5083/6005A welded joints in high-speed trains.

2. Materials and Methods

2.1. Materials

The 5083/6005A welded joint specimens were provided by Zhuzhou Times Metal Manufacturing Co., Ltd. (Zhuzhou, China) The welding joint material was 6.0 mm 5083-H111 and 6005A-T6 aluminum alloy plate, and the welding wire was ER5356. Under a flow of 12 L/min of argon, a Fronius TPS4000 MIG welding machine was used to weld the plate perpendicular to the rolling direction. The chemical compositions of these materials determined by SPECTRO BLUE SOP type inductively coupled plasma optical emission spectroscopy (ICP-OES) (SPECTRO Analytical Instruments, Kleve, Germany)are listed in Table 1.

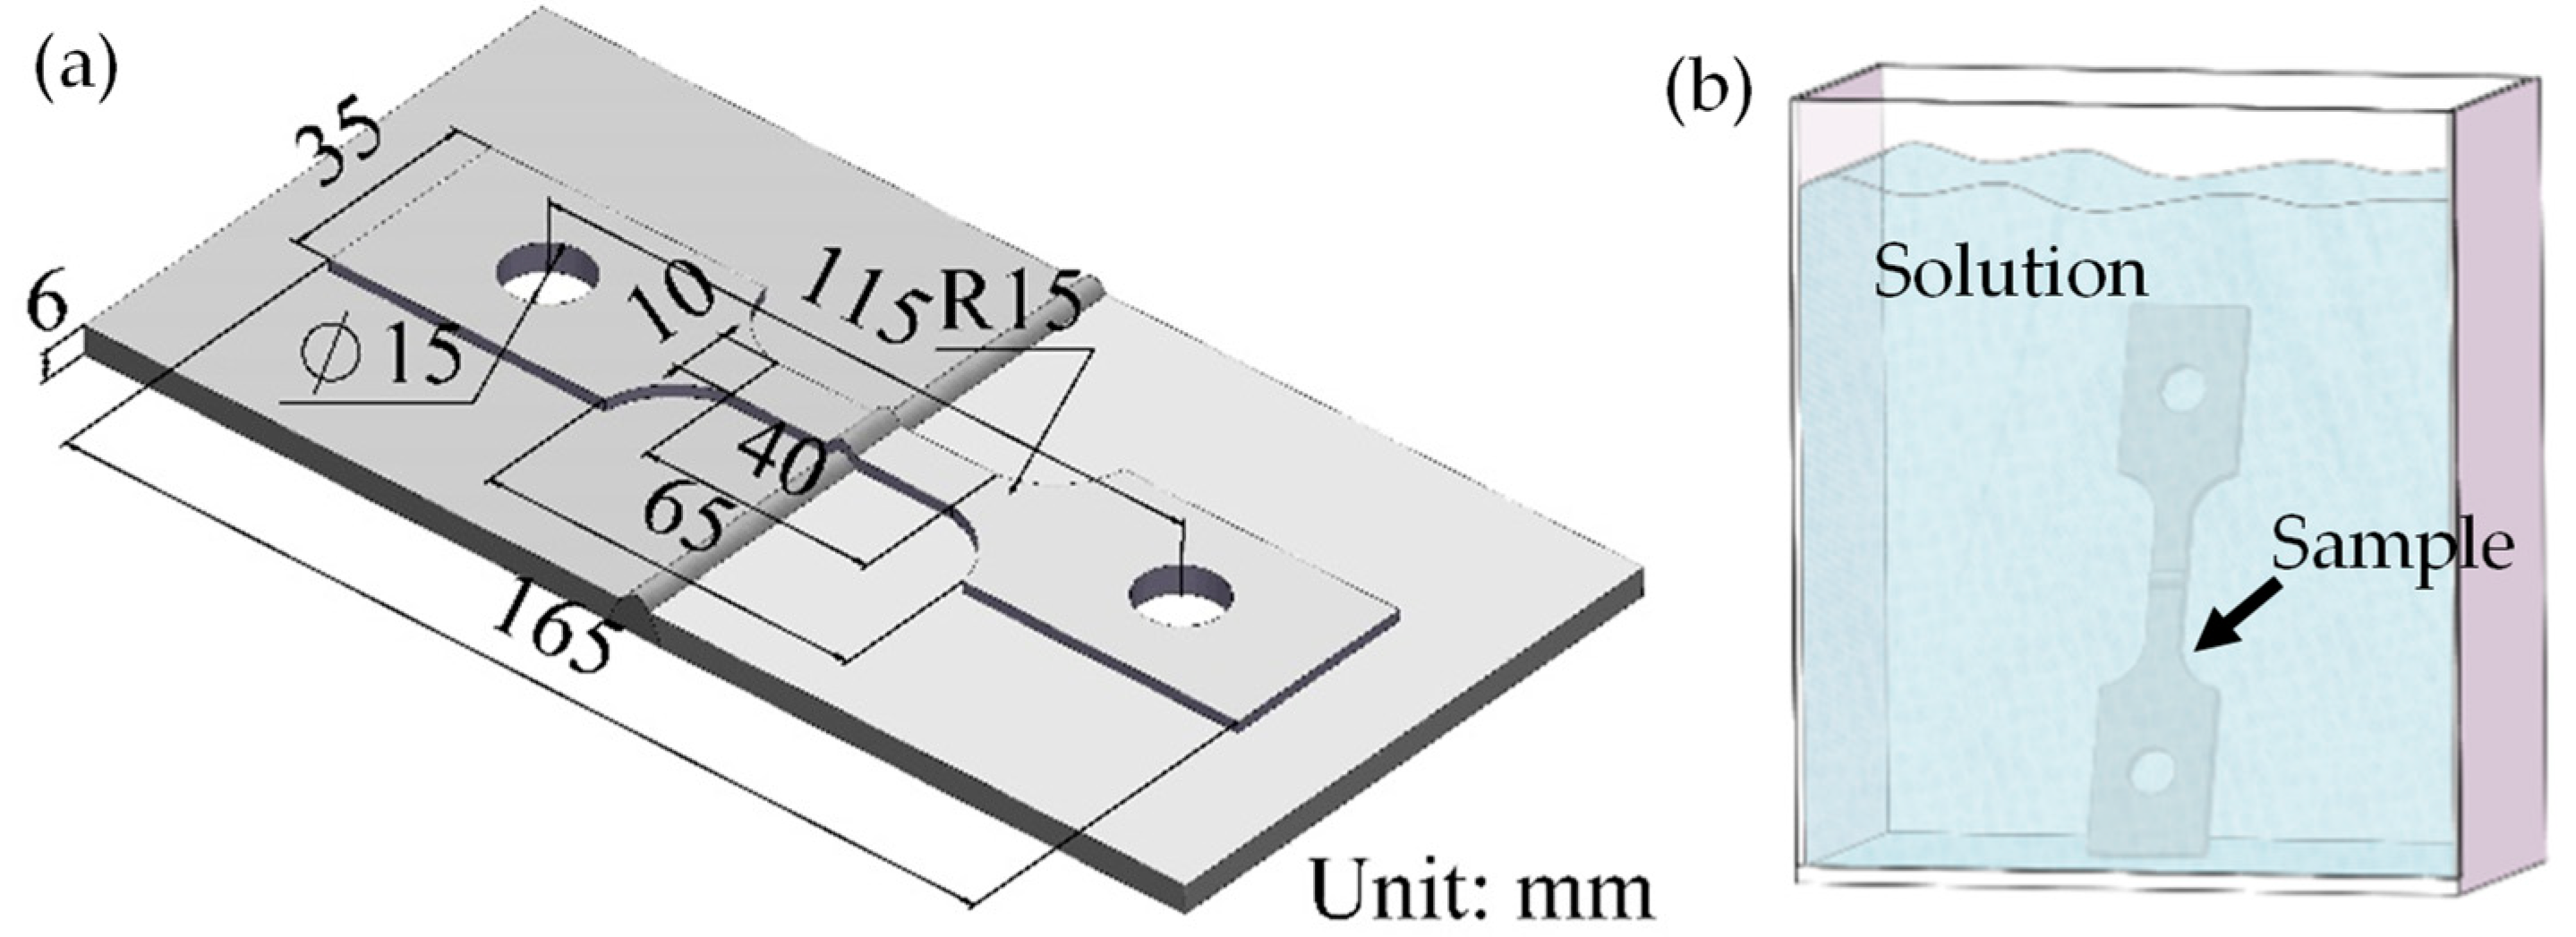
2.2. Corrosion Tests

Figure 1a shows the welding joint dimensions of the 5083/6005A specimen, and Figure 1b illustrates a schematic diagram of the corrosion testing, in which the size of the service device was 200 × 100 × 250 mm. The corrosion solution was 3.5% NaCl + 0.01 mol/L NaHSO3, and the corrosion times were 3, 7, 15, and 30 days.

2.3. Tensile and Fatigue Tests

The tensile tests and fatigue tests were conducted on an MTS-322 servo-hydraulic test machine (maximum load-carrying capacity of ±500 kN) (MTS System Corporation, Eden Prairie, MN, USA) at room temperature. Sinusoidal loading was used with a frequency (f) of 75 Hz, a stress ratio (R) of 0.1, and maximum stress (σmax) of 100 MPa in the fatigue tests. These tests were conducted according to GB/T 228.1-2010, GB/T 3075-2008, and HB 5287-96. Three replicate specimens were tested.

2.4. Electrochemical Measurement

The electrochemical performance of the 5083/6005A welded joints was investigated using a CHI760e electrochemical workstation (CH Instruments Ins., Shanghai, China)with a classic three-electrode system. The electrochemical measurements were conducted in accordance with standard GB/T 24196-2009. The working, counter, and reference electrodes were the 5083/6005A welded joints, a platinum slice, and a saturated calomel electrode (SCE), respectively. The electrolyte was the 3.5 wt.% NaCl aqueous solution, and the tested area for each working electrode was 10 mm × 10 mm. The polarization curves were recorded by scanning the potential from −1.2 V (versus SCE) to −0.3 V at 0.5 mV s−1. Three replicate specimens were tested for each electrochemical test, and a typical polarization curve is reported.

2.5. Characterization Techniques

The surface morphology and corrosion products of the 5083/6005A welded joints were observed by SEM (Hitachi, Tokyo, Japan) and XPS (ThermoFisher-VG Scientific, Waltham, MA, USA), in which the Hitachi SU3500 was used for scanning electron microscopy at an operating voltage of 25 kV, and an ESCALAB 250Xi spectrometer was used for XPS observations with Al Kα radiation as an excitation source.

3. Results and Discussion

3.1. Effect of Corrosion Time on Mechanical Properties

The mechanical properties and stress–strain curves of the 5083/6005A welded joints after being corroded by the 3.5% NaCl + 0.01 mol/L NaHSO3 solution for different times are demonstrated in Figure 2. Figure 2a shows that the yield strength (σs), tensile strength (σb), and elongation of the uncorroded 5083/6005A welded joints were 125 MPa, 204 MPa, and 11.29%, respectively. After 3, 7, 15, and 30 days of corrosion, the σs values of the 5083/6005A welded joints were 126 MPa, 125 MPa, 125 MPa, and 121 MPa, respectively; the σb values were 205 MPa, 203 MPa, 200 MPa, and 196 MPa, respectively; and the elongation values were 9.31%, 8.96%, 8.27%, and 7.96%, respectively. The results indicate that corrosion greatly affected the elongation of the 5083/6005A welded joints but had little influence on σb and σs. As the corrosion time increased, the elongation of the 5083/6005A welded joints decreased, while σb and σs decreased slightly. Compared with that of the uncorroded 5083/6005A welded joints, the elongation of the 5083/6005A welded joints after corrosion for 3, 7, 15, and 30 days decreased by 17.5%, 20.6%, 26.7%, and 29.5%, respectively. The results show that the elongation of the 5083/6005A welded joints decreased greatly once they were corroded, but the elongation reduction rate decreased with increasing corrosion time.
The fatigue properties of the 5083/6005A welded joints corroded for different times are shown in Table 2 and Figure 3: after 3, 7, 15, and 30 days of corrosion, the fatigue life decreased by 84.5%, 90.7%, 93.1%, and 95.7%, respectively. Corrosion had a significant effect on the fatigue life of the 5083/6005A welded joints, and the fatigue life decreased with increasing corrosion time.
In the fatigue process, stress concentration occurs at the corrosion pits due to alternating stress, resulting in crack nucleation at the corrosion pits [15]. As is shown in Figure 4a, there were many corrosion pits on the surface of the 5083/6005A welded joint after 30 days of corrosion, among which some of them formed clusters with Al(Fe,Mn)Si inclusions contained (Figure 4b,c). Thus, the fatigue life of the 5083/6005A welded joints decreased sharply after corrosion.
Figure 5 shows SEM images of fatigue fractures and fracture locations of the 5083/6005A welded joints after corrosion for different times: the fatigue fracture position of the 5083/6005A welded joints after corrosion was mostly on the 6005A side, because the corrosion resistance of aluminum alloy 5xxx is better than that of 6xxx aluminum alloy [8]. Therefore, after the same corrosion time, there were more corrosion pits on one side of 6005A. Previous research indicated that when pits become larger and deeper or form clusters, a higher stress concentration is caused in the fatigue process, resulting in accelerated fatigue initiation and crack propagation and reduced fatigue life [15]. Moreover, the crack propagation region was found to decrease with increasing corrosion time, which may be driven by the decrease in the ductility of the samples (Figure 2). Besides this, the number of corrosion pits at the crack source also gradually increased.
Figure 6 and Figure 7 show two typical SEM fractographies of the 5083/6005A welded joints. The crack source is marked with a yellow dotted line, the crack growth area is marked with a white dotted line, and the directions of crack growth are indicated by white arrows. Figure 6a illustrates that the 5083/6005A welded joint fracture cracks occurred at the corrosion pit after three days of corrosion, and then extended radially. In Figure 6a, fatigue striations can be observed in the crack propagation region over a distance of about 0.77 μm. The upper side of the fracture was the final fracture region in which many dimples were distributed, as illustrated in Figure 6d.
Figure 7a shows that the fracture surface of the 5083/6005A welded joints corroded for 30 days was irregular and there were three crack sources, with cracks extending radially at each crack source; because the three crack sources were in different planes, when they extended to the same position, they merged into a main crack and continued to extend, leading to the formation of a stepped plane. In Figure 7a, fatigue striations can be seen in the three crack source propagation regions, at spacing of 0.78 μm, 0.91 μm, and 0.83 μm, respectively. The upper end of the fracture was the final fracture region, which was composed of many small dimples, as illustrated in Figure 7b. Figure 7d–f shows rock-candy-type fracture features easily observed at the fracture surface close to crack initiation sites. This indicates that intergranular fracture dominated the early stage of the crack propagation process.

3.2. Effect of Corrosion Time on Corrosion Resistance

Figure 8 shows the polarization curves of the 5083/6005A welded joints in the 3.5% NaCl solution after different corrosion times. The results of the corrosion current density (Jcorr) calculated by Tafel extrapolation are presented in Table 3. The corrosion potential can reflect the corrosion tendency from a thermodynamic perspective, and the corrosion current density can be used to assess the corrosion rate from the reaction kinetics. Figure 8a and Table 3 indicate that with increasing corrosion time, the corrosion potential (Ecorr) of the 5083 aluminum alloy matrix of the 5083/6005A welded joints decreased continuously, while Jcorr increased gradually at the beginning of corrosion and reached its peak value between 15 and 30 days of corrosion, then it decreased continuously. The fast dissolution of the matrix at the early stage of corrosion is probably due to the galvanic cell reaction between the 5083 aluminum alloy matrix and the second phase. Meanwhile, after a certain corrosion time (15 to 30 days), most of the second phase on the surface of the 5083/6005A welded joints had dissolved, resulting in a trend of Jcorr reduction as evinced by the polarization curve. Compared with that of the uncorroded 5083 aluminum alloy matrix, the Ecorr of the 5083 aluminum alloy matrix was decreased by 15.3% after 30 days of corrosion. These results show that with increasing corrosion time, the tendency to corrosion of the 5083 aluminum alloy matrix increased, but the rate of corrosion decreased.
As can be seen from Figure 8b and Table 3, the Ecorr value of the 5083/6005A welded joint 6005A aluminum alloy matrix decreased with increasing corrosion time, while the Jcorr value did not change significantly. The Ecorr and Jcorr values of 6005A aluminum alloy were lower than those of the 5083 aluminum alloy matrix.

3.3. Analysis of Corrosion Products

The XPS analysis results of the 5083 matrix and 6005A matrix of the 5083/6005A welded joints after 7 days of corrosion are demonstrated in Figure 9. The XPS survey spectrum shown in Figure 9a proves the existence of Mg, Na, O, N, C, Cl, and Al on the 5083/6005A welded joints, among which the C and N elements are mainly due to dissolved carbon dioxide and nitrogen dioxide from the air in the solution, while the Mg, Fe, Al, and Cl elements are due to the corrosion products formed by the second phase and the matrix of the aluminum alloy after corrosion. The presence of elemental S was not detected in the XPS spectrum due to the low content of NaHSO3 in the solution, which resulted in almost no corrosion products containing S on the surface of the 5083/6005A welded joints after corrosion.
The spectrum of Al2p in Figure 10b,c is composed of three peaks with respective binding energies of 75.7 eV, 74.5 eV, and 73.9 eV [16,17] (the corresponding substances are AlCl3, Al2O3, and Al(OH)3). Since Al2O3, the main component of the oxide film, is not a corrosion product formed in the corrosion process, the corrosion products of the 5083/6005A welded joints are Al(OH)3 and AlCl3 [18].

3.4. Corrosion Mechanism and Model

Sakairi et al. [19] found that in the stage of oxide film formation, the oxide film consists of a gel-like structured hydrated oxide, which contains a large amount of bound water. After dehydration, an oxide film with better structure and stronger protection is formed. The oxide film of an aluminum alloy contains various chemical bonds, including HO-Al-OH, O-Al-O, and so on. However, the morphology and thickness of the oxide film in these places are greatly changed due to the presence of intermetallic compounds, forming a defective oxide film [20].
Hoar suggested that chloride ion adsorption on the alloy surface can migrate to the oxide film in a certain way, and then arrive through the oxide film and metal interface. This leads to blunt damage and promotes the dissolution of the active interface of the metal matrix, thus causing local corrosion, and aggressive ion adsorption results in a decrease in the oxide film’s surface tension [21,22].
The corrosion mechanism of 6xxx and 5xxx aluminum alloys is related to the iron-rich phase and Mg–Si intermetallic compounds [23]. According to the energy spectrum analysis in Figure 4, the second phase is mainly composed of Al, Mn, Fe, and Si elements. Therefore, the second phase may be Al(Fe,Mn)Si. During the corrosion process, the iron-rich phase acts as the cathode phase, and the aluminum matrix acts as the soluble anode [23].
Therefore, in 3.5% NaCl + 0.01 mol/L NaHSO3 solution, corrosive ions readily migrate to the oxide film, leading to the gradual dissolution of the 5083/6005A aluminum alloy welds. The aluminum matrix reacts as the anode (1) and the second-phase particles react as the cathode (2), gradually reacting (3) and finally forming Al(OH)3.
A l 3 e A l 3 +
O 2 + 2 H 2 O + 4 e 4 O H
A l 3 + + 3 O H A l ( O H ) 3
The solution contains HSO3, which is electrolyzed into SO32− and H+ in water (4). As SO32− is easily oxidized to SO42− in air, a reaction occurs (5).
H S O 3 H + + S O 3 2
2 S O 3 2 + O 2 2 S O 4 2
In the solution containing Cl and SO42−, these ions compete with OH to adsorb on the surface of the oxide film. OH in the oxide film is gradually replaced, and with increasing corrosion time, the oxide film gradually becomes sparse and breaks [24].
The XPS analysis results imply that the corrosion products of the 5083/6005A welded joints in the 3.5% NaCl + 0.01 mol/L NaHSO3 solution are Al(OH)3 and AlCl3. Therefore, the reaction (6) occurs when the concentration of Al(OH)3 is high in the corrosion pit.
A l ( O H ) 3 + 3 C l A l C l 3 + 3 O H
Based on the above analysis, the corrosion model of the 5083/6005A welded joints in the 3.5% NaCl + 0.01 mol/L NaHSO3 solution was established as shown in Figure 10. At the initial stage of corrosion, Cl and SO42− are adsorbed on the oxide film, and the defective oxide film formed near the Al(Fe,Mn)Si phase is rapidly destroyed under the action of Cl and SO42−, resulting in the corrosion of the aluminum alloy matrix of the 5083/6005A welded joints near the Al(Fe,Mn)Si phase. OH in the oxide film not near the Al(Fe,Mn)Si phase is gradually replaced by Cl and SO42−, as shown in Figure 10a,b. With the progress of corrosion, the aluminum alloy matrix near the 5083/6005A welding joint with its Al(Fe,Mn)Si phase is corroded more severely, accompanied by the generation of many corrosion products. However, the surface of the corrosion pit is only covered with a small amount of corrosion products, because NaCl is the main component in the 3.5% NaCl + 0.01 mol/L NaHSO3 solution, and the main corrosion product is AlCl3. AlCl3 is easily soluble in water, and Al2(SO4)3 will cover the surface of the aluminum alloy. No elemental S could be detected in the XPS spectra, suggesting that the content of Al2(SO4)3 is very small. Therefore, few corrosion products are present in the pit, as shown in Figure 10c. At the later stage of corrosion, the aluminum alloy matrix around the Al(Fe,Mn)Si phase is completely corroded, and then the Al(Fe,Mn)Si phase spalls, causing the formation of corrosion pits, as shown in Figure 10d.

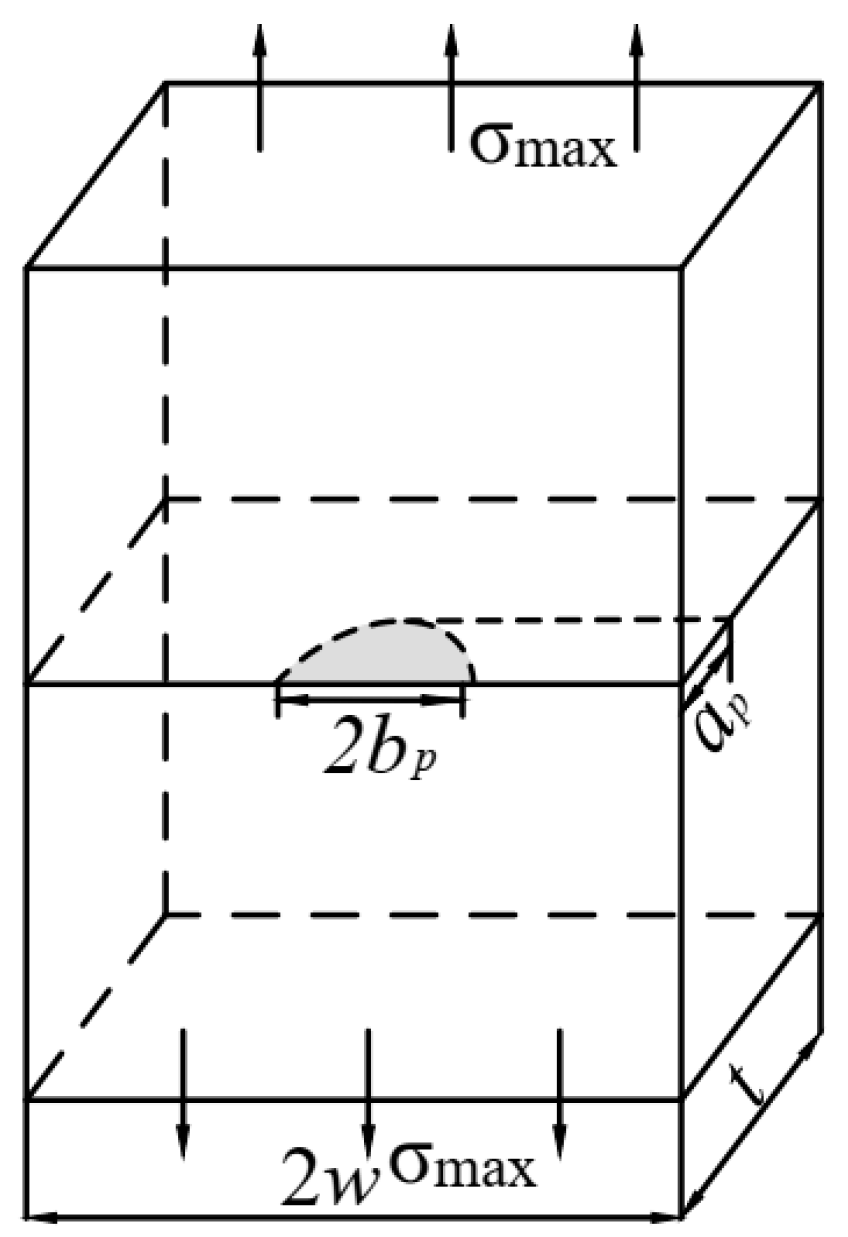
3.5. Prediction Model of Fatigue Life after Corrosion

A surface corrosion pit on a 5083/6005A welded joint is equivalent to an initial crack on a semi-elliptical surface, so the fatigue life was predicted based on the methods of fracture mechanics. A Cartesian coordinate system was established at the center of the corrosion pit as the origin O, with the width (w) direction as the x-axis and the thickness direction (t) as the y-axis. A schematic representation of the equivalent semi-elliptic crack is shown in Figure 11. The intersection points of the corrosion pit and the positive axes of the two axes are A (0, ai) and B (bi, 0), respectively, as shown in Figure 12a–f. In the model with multiple corrosion pits, it is necessary to superimpose the long and short axes of multiple equivalent semi-ellipses into the long and short axes of an equivalent semi-ellipse crack, the long and short axes of which are ap and bp, respectively.
Many scholars have previously established fatigue life prediction models by combining the crack growth rate formula with the initial crack length and the critical crack length when fracture occurs [25,26]. The rate of crack growth da/dN is commonly used to indicate the crack growth performance of metal materials. Herein, the fatigue life prediction of the 5083/6005A was made based on Paris law [27] as given by:
d a d N = C ( Δ K ) n
where a denotes the crack depth, N is the fatigue life, C and n are the material parameters, and ΔK is the applied stress intensity factor range.
The crack can only extend when it is opened, so the crack opening function fop is introduced as follows [28]:
f o p = σ o p σ max = K o p K max = A 0 + A 1 R + A 2 R 2 + A 3 R 3 R 0 A 0 + A 1 R   R < 0 A 0 = ( 0.825 0.34 α + 0.05 α 2 ) [ cos ( π σ max 2 σ 0 ) ] 1 α A 1 = ( 0.415 0.071 α ) σ max σ 0 A 2 = 1 A 0 A 1 A 3 A 3 = 2 A 0 + A 1 1
where KOP is the K value when mating surfaces of the crack make contact; α is the plane stress constraint factor, such that α = 1 denotes plane stress conditions; and σ0 is the flow stress, such that σ 0 = 1.15 ( σ s + σ b ) / 2 .
When K < KOP, crack growth is suppressed, since the crack is closed. In this case, the fatigue crack propagation behavior is found to depend on the effective stress intensity factor range (ΔKeff) rather than the nominally applied value [29,30].
Δ K e f f = K max K O P
The stress intensity factor Kmax of a Type-I equivalent crack can be expressed as follows:
K max = σ max π a E ( k ) F I ( a p b p , a p t , b p w , θ )
where σmax is the maximum stress, and E(k) is the complete elliptic integral of the second kind. FI represents the correction function for the crack, and the expression of FI [31] is:
F I = [ M 1 + M 2 ( a p t ) 2 + M 3 ( a p t ) 4 ] g 1 f θ f w
When ap/bp ≤ 1, the specific expressions of each coefficient in the formula are given as follows:
M 1 = 1.13 0.09 ( a p b p ) M 2 = 0.54 + 0.89 0.2 + ( a p b p ) M 3 = 0.5 1.0 0.65 + ( a p b p ) + 14 ( 1 a p b p ) 24 g 1 = 1 + [ 0.1 + 0.35 ( a p t ) 2 ] ( 1 sin θ ) 2 f θ = [ ( a p b p ) 2 cos 2 θ + sin 2 θ ] 1 4 f w = [ sec ( π b p 2 w a p t ) ] 1 2 , a p b p 1
When ap/bp > 1, the specific expressions of each coefficient in the formula are as follows:
M 1 = b p a p ( 1 + 0.04 b p a p ) M 2 = 0.2 ( b p a p ) 4 M 3 = 0.11 ( b p a p ) 4 g 1 = 1 + [ 0.1 + 0.35 ( b p a p ) ( a p t ) 2 ] ( 1 sin θ ) 2 f θ = [ ( b p a p ) 2 sin 2 θ + cos 2 θ ] 1 4 f w = [ sec ( π b p 2 w a p t ) ] 1 2 , a p b p > 1
where θ denotes the angular location.
The complete elliptic integral of the second kind is expressed as follows:
E ( k ) = [ 1 + 1.464 ( a p b p ) 1.65 ] 1 2 a p b p 1 E ( k ) = [ 1 + 1.464 ( b p a p ) 1.65 ] 1 2 a p b p > 1
Under the action of external force, the stress intensity factor K at the tip of a Type-I crack increases with crack propagation, and when K reaches the critical value KIC, the sample fractures. When fracturing occurs, the critical crack length is as follows:
a c = 1 π ( K I C E ( k ) F I σ max ) 2
After the transformation of Formula (7), it is integrated from the initial crack depth ap to the critical crack depth at fracture ac, which is shown below.
N = a p a c d a C ( Δ K e f f ) n
The material crack growth performance parameters are n = 7.664 and C = 4 × 10⁻¹³ mm/cycle [32]. The fatigue load parameters are R = 0.1 and σmax = 100 MPa. The fracture toughness KIC of the 6005A side of the 5083/6005A welded joints is 51 Mpa·m1/2 [33]. The geometric shape parameters of the sample, σ0 values, geometric parameters of corrosion pits, experimental results of fatigue life, and predicted results are listed in Table 4 (it should be pointed out that the values of t and w for the samples after corrosion for 15 days were exchanged since the crack propagated along the transverse, rather than thickness, direction of the plate).
Based on Formula (17), the effect of corrosion time on the fatigue life of the 5083/6005A welded joints can be obtained by fitting the experimental results (Figure 13).
N f = 1.7 × 10 6 t 0.418

4. Conclusions

1. With increasing corrosion time, the elongation and fatigue life of the 5083/6005A welded joints continued to decrease, and the corrosion phenomenon became more severe.
2. After 3, 7, 15, and 30 days of corrosion in the solution, the elongation of the 5083/6005A welded joint specimens was decreased by 17.5%, 20.6%, 26.7%, and 29.5%, respectively, and the fatigue life was decreased by 84.5%, 90.7%, 93.1%, and 95.7%, respectively.
3. After 30 days of corrosion, the tendency to corrosion of the 5083/6005A welded joint specimens increased, while the rate of corrosion decreased.
4. The corrosion products of the 5083/6005A welded joints in the 3.5% NaCl + 0.01 mol/LNaHSO3 solution were Al(OH)3 and AlCl3.
5. The formula describing the effect of corrosion time on the fatigue life of the 5083/6005A welded joints is Nf = 1.7 × 10⁶ t−0.418.

Author Contributions

Conceptualization, H.W. and Y.C.; methodology, H.W., H.L. and Y.C.; software, H.W. and H.L.; formal analysis, H.W. and Y.C.; investigation, X.Z. and X.W.; resources, H.G., and L.H.; data curation, H.W. and Y.C.; writing—original draft, H.W. and Y.C.; supervision, H.W., Y.C., X.Z., X.W., H.G., H.L. and L.H. All authors have read and agreed to the published version of the manuscript.

Funding

This research was funded by the National Natural Science Foundation of China (Grant nos. 52075166 and U21A20130), the Natural Science Foundation of Hunan Province (2020JJ5171), the High-level Talent Gathering-Innovative Talent Project of 2021 Hunan (2021RC5010), and China Postdoctoral Science Foundation (2022M712642).

Institutional Review Board Statement

Not applicable.

Informed Consent Statement

Not applicable.

Data Availability Statement

The data presented in this study are available on request from the corresponding author.

Conflicts of Interest

The authors declare no conflict of interest. The funders had no role in the design of the study; in the collection, analyses, or interpretation of data; in the writing of the manuscript; or in the decision to publish the results.

References

  1. Fan, L.; Ma, J.J.; Zou, C.X.; Gao, J.; Wang, H.S.; Sun, J.; Guan, Q.M.; Wang, J.; Tang, B.; Li, J.S.; et al. Revealing foundations of the intergranular corrosion of 5xxx and 6xxx Al alloys. Mater. Lett. 2020, 271, 127767. [Google Scholar] [CrossRef]
  2. Chen, Y.Q.; Xu, J.B.; Pan, S.P.; Li, N.B.; Ou, C.G.; Liu, W.H.; Song, Y.F.; Tan, X.R.; Liu, Y. Effect of T6I6 treatment on dynamic mechanical behavior of Al-Si-Mg-Cu cast alloy and impact resistance of its cast motor shell. J. Cent. South Univ. 2022, 29, 924–936. [Google Scholar] [CrossRef]
  3. Arifurrahman, F.; Budiman, B.A.; Aziz, M. On the lightweight structural design for electric road and railway vehicles using fiber reinforced polymer composites-a review. Int. J. Sustain. Transp. 2018, 1, 21–29. [Google Scholar] [CrossRef]
  4. Lu, W.; Ma, C.P.; Gou, G.Q.; Fu, Z.H.; Sun, W.G.; Che, X.L.; Chen, H.; Gao, W. Corrosion fatigue crack propagation behavior of A7N01P-T4 aluminum alloy welded joints from high-speed train underframe after 1.8 million km operation. Mater. Corros. 2021, 72, 879–887. [Google Scholar] [CrossRef]
  5. Chanyathunyaroj, K.; Phetchcrai, S.; Laungsopapun, G.; Rengsomboon, A. Fatigue characteristics of 6061 aluminum alloy subject to 3.5% NaCl environment. Int. J. Fatigue 2020, 133, 105420. [Google Scholar] [CrossRef]
  6. Wang, L.W.; Liang, J.M.; Li, H.; Cheng, L.J.; Cui, Z.Y. Quantitative study of the corrosion evolution and stress corrosion cracking of high strength aluminum alloys in solution and thin electrolyte layer containing Cl. Corros. Sci. 2021, 178, 109076. [Google Scholar] [CrossRef]
  7. Shen, L.; Chen, H.; Che, X.L.; Xu, L.D. Corrosion—Fatigue crack propagation of aluminum alloys for high-speed trains. Int. J. Mod. Phys. B 2017, 31, 1744009. [Google Scholar] [CrossRef]
  8. Zhang, Z.; Xu, Z.L.; Sun, J.; Zhu, M.T.; Yao, Q.; Zhang, D.J.; Zhang, B.W.; Xiao, K.; Wu, J.S. Corrosion behaviors of AA5083 and AA6061 in artificial seawater, effects of Cl, HSO3 and temperature. Int. J. Electrochem. Sci. 2020, 15, 1218–1229. [Google Scholar] [CrossRef]
  9. Zhao, Q.Y.; Guo, C.; Niu, K.K.; Zhao, J.B.; Huang, Y.H.; Li, X.G. Long-term corrosion behavior of the 7A85 aluminum alloy in an industrial-marine atmospheric environment. J. Mater. Res. Technol. 2021, 12, 1350–1359. [Google Scholar] [CrossRef]
  10. Mishra, R.K. Study the effect of pre-corrosion on mechanical properties and fatigue life of aluminum alloy 8011. Mater. Today Proc. 2020, 25, 602–609. [Google Scholar] [CrossRef]
  11. Ghosh, R.; Venugopal, A.; Rao, G.S.; Narayanan, P.R.; Pant, B.; Cherian, R. Effect of temper condition on the corrosion and fatigue performance of AA2219 aluminum alloy. J. Mater. Eng. Perform. 2018, 27, 423–433. [Google Scholar] [CrossRef]
  12. Ma, Q.N.; Shao, F.; Bai, L.Y.; Xu, Q.; Xie, X.K.; Shen, M. Corrosion fatigue fracture characteristics of FSW 7075 aluminum alloy joints. Materials 2020, 13, 4196. [Google Scholar] [CrossRef] [PubMed]
  13. Seetharaman, R.; Ravisankar, V.; Balasubramanian, V. Corrosion performance of friction stir welded AA2024 aluminium alloy under salt fog conditions. Trans. Nonferrous Met. Soc. China 2015, 25, 1427–1438. [Google Scholar] [CrossRef]
  14. Ge, F.; Zhang, L.; Tian, H.Y.; Yu, M.D.; Liang, J.M.; Wang, X. Stress corrosion cracking behavior of 2024 and 7075 high-strength aluminum alloys in a simulated marine atmosphere contaminated with SO2. J. Mater. Eng. Perform. 2020, 29, 410–422. [Google Scholar] [CrossRef]
  15. Weber, M.; Eason, P.D.; Özdeş, H.; Tiryakioğlu, M. The effect of surface corrosion damage on the fatigue life of 6061-T6 aluminum alloy extrusions. Mater. Sci. Eng. A 2017, 690, 427–432. [Google Scholar] [CrossRef]
  16. Wang, B.; Zhang, L.W.; Su, Y.; Mou, X.L.; Xiao, Y.; Liu, J. Investigation on the corrosion behavior of aluminum alloys 3A21 and 7A09 in chloride aqueous solution. Mater. Des. 2013, 50, 15–21. [Google Scholar] [CrossRef]
  17. Yang, X.K.; Zhang, L.W.; Zhang, S.Y.; Liu, M.; Zhou, K.; Mu, X.L. Properties degradation and atmospheric corrosion mechanism of 6061 aluminum alloy in industrial and marine atmosphere environments. Mater. Corros. 2017, 68, 529–535. [Google Scholar] [CrossRef]
  18. Li, Z.; Zhang, Z.; Chen, X.G. Microstructure, elevated-temperature mechanical properties and creep resistance of dispersoid-strengthened Al-Mn-Mg 3xxx alloys with varying Mg and Si contents. Mater. Sci. Eng. A 2017, 708, 383–394. [Google Scholar] [CrossRef]
  19. Sakairi, M.; Otani, K.; Kaneko, A.; Seki, Y.; Nagasawa, D. Analysis of chemical compositions and morphology of surface films formed on 3003 aluminum alloy by immersion in different cation containing model tap waters. Surf. Interface Anal. 2013, 45, 1517–1521. [Google Scholar] [CrossRef]
  20. Dong, C.; Kui, X.; Lin, X.; Sheng, H. Characterization of 7A04 aluminum alloy corrosion under atmosphere with chloride ions using electrochemical techniques. Rare Met. Mater. Eng. 2011, 40, 275–279. [Google Scholar]
  21. Hoar, T.P.; Mears, D.C.; Rothwell, G.P. The relationships between anodic passivity, brightening and pitting. Corros. Sci. 1965, 5, 279–289. [Google Scholar] [CrossRef]
  22. Hoar, T.P. The production and breakdown of the passivity of metals. Corros. Sci. 1967, 7, 341–355. [Google Scholar] [CrossRef]
  23. Kumar, K.K.; Kumar, A.; Satyanarayana, M. Effect of friction stir welding parameters on the material flow, mechanical properties and corrosion behavior of dissimilar AA5083–AA6061 joints. Proc. Inst. Mech. Eng. Part C 2022, 236, 2901–2917. [Google Scholar] [CrossRef]
  24. Chen, Y.Q.; Zhang, H.; Pan, S.P.; Song, Y.F.; Liu, W.H. Effects of service environment and pre-deformation on the fatigue behaviour of 2524 aluminium alloy. Arch. Civ. Mech. Eng. 2020, 20, 5. [Google Scholar] [CrossRef]
  25. Nan, Z.Y.; Ishihara, S.; Goshima, T. Corrosion fatigue behavior of extruded magnesium alloy AZ31 in sodium chloride solution. Int. J. Fatigue 2008, 30, 1181–1188. [Google Scholar] [CrossRef]
  26. Mohabeddine, A.; Correia, J.A.F.O.; Montenegro, P.A.; Castro, J.M. Fatigue crack growth modelling for cracked small-scale structural details repaired with CFRP. Thin Wall Struct. 2021, 161, 107525. [Google Scholar] [CrossRef]
  27. Chen, Y.Q.; Zhang, H.; Song, W.W.; Pan, S.P.; Liu, W.H.; Zhu, B.W.; Song, Y.F.; Zhou, W. Acceleration effect of a graphite dust environment on the fatigue crack propagation rates of Al alloy. Int. J. Fatigue 2019, 126, 20–29. [Google Scholar] [CrossRef]
  28. Newman, J.C. A crack opening stress equation for fatigue crack growth. Int. J. Fatigue 1984, 24, R131–R135. [Google Scholar] [CrossRef]
  29. Chen, Y.Q.; Tang, Z.H.; Pan, S.P.; Liu, W.H.; Song, Y.F.; Zhu, B.W.; Liu, Y.; Wen, Z.L. The fatigue crack behavior of 7N01-T6 aluminum alloy in different particle environments. Arch. Civ. Mech. Eng. 2020, 20, 129. [Google Scholar] [CrossRef]
  30. Chen, Y.Q.; Tang, Z.H.; Pan, S.P.; Liu, W.H.; Song, Y.F.; Liu, Y.; Zhu, B.W. The fatigue crack growth behaviour of 2524-T3 aluminium alloy in an Al2O3 particle environment. Fatigue Fract. Eng. Mater. Struct. 2020, 43, 2376–2389. [Google Scholar] [CrossRef]
  31. Newman, J.C.; Raju, I.S. Stress-intensity factor equations for cracks in three-dimensional. In Proceedings of the Fourteenth National Symposium on Fracture Mechanics, Los Angeles, CA, USA, 30 June 1981. [Google Scholar]
  32. Rubio-González, C.; Ocaña, J.L.; Gomez-Rosas, G. Effect of laser shock processing on fatigue crack growth and fracture toughness of 6061-T6 aluminum alloy. Mater. Sci. Eng. A 2004, 386, 291–295. [Google Scholar] [CrossRef]
  33. Mrowka-Nowotnik, G. Influence of precipitation strengthening process on tensile and fracture behaviour of the 6005 and 6082 alloys. Adv. Manuf. Sci. Technol. 2008, 32, 31–50. [Google Scholar]
Figure 1. (a) Typical 5083/6005A welded joint; (b) Schematic representation a of the corrosion test.
Crystals 12 01150 g001
Figure 2. Mechanical properties and stress–strain curves of the 5083/6005a welded joints after corrosion in the 3.5% NaCl + 0.01 mol /L NaHSO3 solution for different times: (a) stress–strain curve; (b) mechanical properties.
Crystals 12 01150 g002
Figure 3. The effect of corrosion time on the fatigue life, obtained by fitting the results in Table 2.
Crystals 12 01150 g003
Figure 4. (a) SEM of a 5083/6005A welded joint corroded for 30 days; (b) EDS1 results; (c) EDS2 results.
Crystals 12 01150 g004
Figure 5. SEM images of fatigue fractures of the 5083/6005A welded joints after corrosion in the 3.5% NaCl + 0.01 mol/L NaHSO3 solution: (a) uncorroded; (b) 3 days; (c) 7 days; (d) 15 days; (e) 30 days.
Crystals 12 01150 g005
Figure 6. SEM images of fatigue fracture of the 5083/6005A welded joints corroded for three days: (a) overall fracture diagram; (b) schematic diagram of fracture location; (c) dimples; (d) crack source.
Crystals 12 01150 g006
Figure 7. SEM images of fatigue fracture of the 5083/6005A welded joints corroded for 30 days: (a) overall fracture diagram; (b) dimples; (c) fracture location diagram; (d) crack source 1; (e) crack source 2; (f) crack source 3.
Crystals 12 01150 g007
Figure 8. Polarization curves of the 5083/6005a welded joints after corrosion by the 3.5% + 0.01 mol/L NaHSO3 solution: (a) 5083 aluminum alloy matrix; (b) 6005A aluminum alloy matrix.
Crystals 12 01150 g008
Figure 9. XPS spectra of the 5083/6005A welded joints corroded in the 3.5% NaCl + 0.01 mol/L NaHSO3 solution for 7 days: (a) 5083 and 6005A survey spectra; (b) 5083 Al2p spectrum; (c) 6005A Al2p spectrum.
Crystals 12 01150 g009
Figure 10. Corrosion model of the 5083/6005A welded joints in a corrosion solution: (a) initial stage; (b) pitting stage; (c) corrosion pit expansion stage; (d) second phase shedding stage.
Crystals 12 01150 g010
Figure 11. Schematic representation of the equivalent semi-elliptic crack.
Crystals 12 01150 g011
Figure 12. Equivalent model of a corrosion pit: (a) 3 days; (b) 7 days; (c) 15 days; (d), (e) and (f) 30 days.
Crystals 12 01150 g012
Figure 13. The effect of corrosion time on the fatigue life of the 5083/6005A welded joints.
Crystals 12 01150 g013
Table 1. Chemical compositions of the 5083 and 6005A aluminum alloys and the ER5356 filler metal (wt. %).
MaterialSiFeCuMnMgZnCrTiAl
50830.090.200.010.754.980.020.090.05Balance
6005A0.500.190.010.260.710.020.160.06Balance
ER53560.120.120.080.154.900.120.110.12Balance
Table 2. Fatigue life of 5083/6005A welded joints.
SpecimenUncorroded3 Days7 Days15 Days30 Days
Nf/ cycles107 1,159,257 884,098805,323449,833
6,804,918907,457672,835353,091267,661
Table 3. Test results of polarization curves in different environments for the 5083/6005A welded joints.
Experimental Conditions50836005A
Ecorr (vs. SCE)/ (V)Jcorr/ (μA·cm−2)Ecorr (vs. SCE)/ (V)Jcorr/ (μA·cm−2)
Uncorroded−0.5942.0−0.6171.95
After being corroded for 3 days−0.6264.11−0.6472.89
After being corroded for 7 days−0.6504−0.6632.50
After being corroded for 15 days−0.6685.01−0.6932.18
After being corroded for 30 days−0.6850.812−0.7311.38
Table 4. Parameters of the fatigue life prediction model for the 5083/6005A welded joints.
Sampleap/μmbp/μmt/mmw/mmθσ0/MPaExperimental Fatigue Life (Average)/CyclePredicted Fatigue Life/Cycles
3 days19891650.125π190.31,033,3571,075,621
7 days673541650.125π188.6778,467852,645
15 days7215471030.1875π187.0579,207604,837
30 days1076934650.125π182.8338,747309,234
Publisher’s Note: MDPI stays neutral with regard to jurisdictional claims in published maps and institutional affiliations.

