Abstract
A series of yttria-stabilized zirconia single-crystals doped with 0.000–0.250 mol% Tb4O7 was prepared by the optical floating-zone method. As shown by XRD and Raman spectroscopy, all of the crystals had a cubic-phase structure. These were initially orange–yellow in color, which is indicative of the presence of Tb4+ ions, but they then became colorless after being annealed in a H2/Ar atmosphere as a result of the reduction of Tb4+ to Tb3+. The absorption spectra of the unannealed samples show both the 4f 8→4f 75d1 transition of Tb3+ ions and the Tb4+ charge-transfer band. In addition, the transmittance of the crystals was increased by annealing. Under irradiation with 300 nm of light, all of the single-crystal samples showed seven emission peaks in the visible region, corresponding to the decay from the 5D3,4 excited state of Tb3+ to the 7FJ (J = 6–0) states. The most intense emission was at 544 nm, which corresponds to the typical strong green emission from the 5D4→7F5 transition in Tb3+ ions.
1. Introduction
In recent years, the preparation and properties of optical materials containing rare earth ions have attracted wide-spread attention [,]. As a result of their partially filled 4f electronic configurations, rare earth ions have unique luminescence properties, including sharp emission peaks, long lifetimes, high quantum yields, and flexible tunability [], and various optical materials, such as phosphors [,,], glass ceramics [,,], and optical crystals [,,,], are based on their excellent optical properties []. Among the rare earths, terbium (Tb) is an important element for green light-emitting devices, although its chemistry is complicated by its redox properties, which are manifested as Tb3+ ions in the reduced state and Tb4+ ions in the oxidized state. Tb3+ has a 4f 8 electronic configuration, whereas Tb4+ is 4f 7. Furthermore, an electron in Tb3+ can be excited to the 5d-energy level (4f 8→4f 75d1) and this can then undergo non-radiative relaxation from to the 5D3,4 excited state and finally transition to the 7FJ (J = 6–0) states with strong green emission near 545 nm []. The energy-level difference between the 5D4 state and the Tb3+ ground state is about 15,000 cm−1, which makes multi-phonon relaxation negligible. Therefore, emissions from the 5D4 state usually have high quantum efficiency and good thermal stability [], and the luminescence of Tb3+ ions in phosphors and lasers has been shown to have applications in medical imaging [,,,].
Terbium oxide in the form Tb4O7 contains both Tb3+ and Tb4+ ions. The standard redox potential (relative to the hydrogen electrode) of Tb3+/Tb4+ is + 3.1 V [,], which is far greater than that of the most easily reduced rare earth ions, such as Eu2+/Eu3+ (−0.35 V) []. Therefore, Tb4+ is relatively stable and optical materials doped with Tb4+ appear yellow as a result of Tb4+ absorption []. Although Tb3+ and Tb4+ can coexist in the oxide, Tb4+ ions do not emit visible light after excitation; thus, its presence should not affect the green emission of Tb3+. However, investigating the optics and other physical and chemical properties of systems containing a combination of Tb3+ and Tb4+ should increase our understanding of their luminescence properties and help develop new applications of such rare earth-doped luminescence materials [].
The absorption and emission intensity, light efficiency, luminescence lifetime, and quenching process of rare earth ion-based luminescent materials are strongly influenced by the host material []. Zirconia (ZrO2) is a wide-bandgap semiconductor with a high melting point, high dielectric constant, good corrosion resistance, and low phonon energy [], which is conducive to the observation of the luminescence of rare earth ions []. Besides its low phonon energy, a high refractive index and photochemical stability make ZrO2 an ideal optical host material []. However, it is difficult to produce large high-quality zirconia crystals because of large volume changes, which accompany transitions between its three-phase structures (monoclinic (m-ZrO2) below 1443 K, tetragonal (t-ZrO2) between 1443 K and 2643 K, and cubic (c-ZrO2) above 2643 K). This commonly leads to the cracking of the crystals that are cooling from melts, which is not conducive to industrial production []. However, the high-temperature c-ZrO2 form, which is most suitable for many types of technological applications, can be stabilized at room temperature by the addition of an appropriate amount of an oxide stabilizer, such as Y2O3 [,], and several studies have shown that the addition of 8.0 mol% Y2O3 to ZrO2 (abbreviated to 8YSZ) effectively stabilizes the cubic-phase structure [,,]. As a result, crystals with good optical transparency, a high refractive index, and stable photo-thermo-chemical properties can be produced [,,]. Previous studies of Tb-doped zirconia have concentrated mainly on phosphors and nanomaterials [], although Soares et al. successfully produced YSZ: Tb3+ fibers with a tetragonal crystal structure by the laser floating-zone method []. However, the luminescence properties of Tb-doped YSZ single-crystals in the cubic phase have not been reported previously.
In this paper, crystals were grown by the optical floating-zone method (OFZ) based on ZrO2 stabilized with 8 mol% Y2O3, which was partially replaced with various amounts of Tb4O7. Its structure was characterized by X-ray diffractometry (XRD) and Raman spectroscopy, whilst the Tb oxidation states were determined by X-ray photoelectron spectroscopy (XPS). Optical properties were investigated using a combination of ultraviolet-visible (UV-Vis) absorption and transmission, photoluminescence excitation (PLE), photoluminescence emission (PL), and fluorescence-lifetime determination. These results could be explained by the physical mechanisms of luminescence and it lays the foundation for the wider application of green-laser and medical-imaging areas.
2. Experimental
2.1. Preparation of Crystals
ZrO2, Y2O3, and Tb4O7 powders (Aladdin, Shanghai, China) with 99.99% purity were weighed with a precision balance scale in the stoichiometric ratio of (ZrO2)92(Y2O3)8−x(Tb4O7)x (x = 0.000, 0.050, 0.075, 0.100, 0.150, 0.200, and 0.250). The molar concentrations of the oxides used for the preparation of each sample are shown in Table 1. The weighed powders were suspended in ethanol and stirred on a magnetic stirrer for 24 h before drying in a constant-temperature oven at 85 °C for 24 h. The dried sample was added to cylindrical rubber molds, vacuum sealed, and set in a 50 MPa isostatic press for 20 min. The molds were then removed and the mixed powder bars were sintered at 1500 °C for 10 h to produce polycrystalline ceramic samples. These samples were used as the feed-and-seed rods for the crystal production in an optical suspension-zone furnace (FZ-T-12000-X-VII-VPO-GU-PC, Crystal Systems Co., Yamanashi, Japan). The optical floating zone could heat materials with high melting points and produce crystal samples with a high degree of purity. After production, some crystal samples were annealed at 1500 °C in a reducing atmosphere (7% H2 + 93% Ar). After preparation, single-crystal rods were sliced and polished to produce disks with a thickness of 1 mm for optical measurements and fractions were ground into powders for structure determination. Figure 1 shows a photo of the (ZrO2)92(Y2O3)8−x(Tb4O7)x (x = 0.200) crystals before and after annealing in 7% H2 + 93% Ar. The original single-crystal sample was orange–yellow, with good uniformity and high transparency, but after annealing, it became colorless.

Table 1.
Composition of (ZrO2)92(Y2O3)8−x(Tb4O7)x.
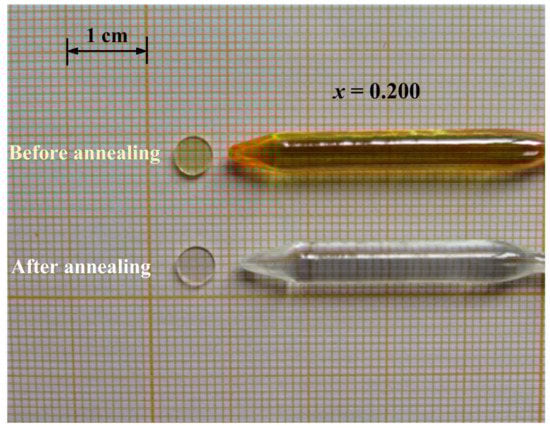
Figure 1.
Photo showing the (ZrO2)92(Y2O3)7.800(Tb4O7)0.200 crystal rods and disks before and after annealing at 1500 °C in a H2/Ar atmosphere.
2.2. Phase and Structure Characterization
The phase and structure characterization of the samples was performed by X-ray diffractometry (XRD) using a DX-2700 X-ray powder diffractometer (Dandong Hao Yuan Company, Dandong City, Liaoning Province) with Cu K alpha (λ = 0.15406 nm) as the radiation source and Raman spectroscopy with a Finder One laser micro-Raman spectrometer, in which excitation was at 532 nm. X-ray photoelectron spectroscopy (ESCALAB 250XI+, Thermo Fisher Scientific Company, Shanghai, China) with a monochromatic Al-target X-ray source was used to characterize the elemental composition and oxidation states of the samples. The absorption and transmission spectra of the crystal samples were measured in the range of 200–800 nm using a UV-Vis spectrophotometer (UV-2700, Shimadzu, Kyoto, Japan) and both excitation and emission spectra were measured at room temperature with a ZLF-325 photoluminescence spectrometer (Zolix Instruments Co., Ltd., Beijing, China). The fluorescence-lifetime spectroscopy measurements were performed with an Edinburgh FLS1000 transient fluorescence spectrometer.
3. Results and Discussion
3.1. Crystal-Phase Structure Analysis
The XRD patterns from the powders of the (ZrO2)92(Y2O3)8−x(Tb4O7)x crystal samples before annealing all consist of six diffraction peaks at ~30.12°, 34.94°, 50.18°, 59.64°, 60.56°, and 73.68° 2θ, which correspond to the (111), (200), (220), (311), (222), and (400) planes, respectively, of the c-ZrO2 structure (PDF 04-006-5589). There was no evidence of diffraction peaks from the ZrO2 monoclinic and tetragonal phases, and the phase structure was independent of the Tb4O7-doping concentration (in the range of x = 0.000–0.250). The annealed crystal samples show similar results (e.g., Figure 2b). As shown in Table 2, the unit cell parameters and volume were essentially constant in the unannealed crystals, but they increased in the annealed crystals. In 8YSZ, a considerable number of anion vacancies were introduced into the ZrO2 structure to maintain the charge balance and computer simulations have shown that such vacancies tend to avoid direct association with Y3+ ions []. Consequently, there is a tendency for Zr4+ to adopt a seven-coordinate configuration, whilst Y3+ is coordinated to eight oxygen atoms. Considering that the radii of Tb4+ and Zr4+ are similar (0.76 and 0.78 Å, respectively, for the seven-coordination configuration), as are Tb3+ and Y3+ (1.04 and 1.019 Å, respectively, for the eight-coordination configuration) [], we expect that Tb4+ will substitute for Zr4+ and Tb3+ for Y3+ in the unannealed crystals. Such substitutions would have little or no effect on the cell dimensions, as observed by XRD. A reduction of Tb4+ to Tb3+ because of the annealing results in an increase in the fraction of trivalent ions in the crystals and this must be accompanied by a decrease in the total anion charge. This could be achieved by a loss of oxygen from the structure or protonation of an appropriate number of structural oxygen atoms. However, the c-ZrO2 structure accommodates a considerable range of Y3+ ions; thus, there should be no problem in accommodating the reduced Tb. Nevertheless, the larger size of Tb3+ compared to Tb4+ results in a lattice expansion, as shown in Table 2.
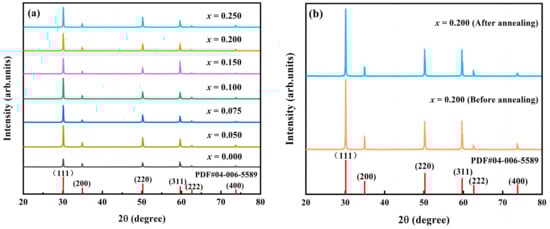
Figure 2.
(a) XRD patterns of (ZrO2)92(Y2O3)8−x(Tb4O7)x (x = 0.000–0.250) crystal powders before annealing. (b) XRD pattern of (ZrO2)92(Y2O3)7.800(Tb4O7)0.200 crystal powders before and after annealing at 1500 °C in a H2/Ar atmosphere.
Table 2.
The lattice parameter of (ZrO2)92(Y2O3)8−x(Tb4O7)x crystals.
Raman spectroscopy is a sensitive method for distinguishing the phase structure of zirconia crystals because m-ZrO2 has 18 Raman vibration modes (9Ag + 9Bg) [,] and t-ZrO2 has 6 strong Raman vibration modes (A1g + 2B1g + 3Eg) [], whereas c-ZrO2 has only 1 (F2g) []. The results in Figure S1 (see Supplementary Materials) show that the Raman spectra of all the (ZrO2)92(Y2O3)8−x(Tb4O7)x (x = 0.050–0.250) crystal disks before annealing have a single strong vibration at 620 cm−1 under excitation with a laser light of 532 nm. Furthermore, the spectra recorded before and after annealing (Figure 3) were similar and, thus, all are consistent with the c-ZrO2 structure.
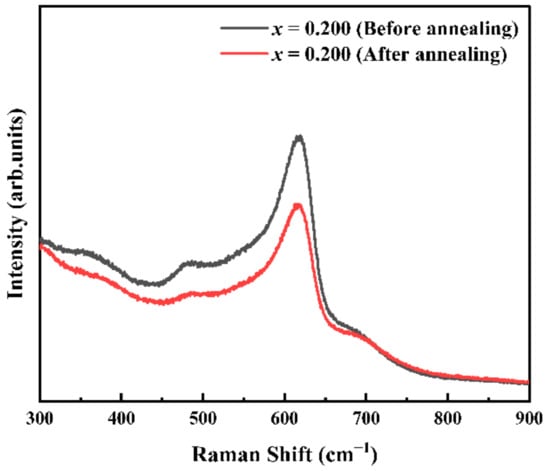
Figure 3.
Raman spectra of (ZrO2)92(Y2O3)7.800(Tb4O7)0.200 crystals before and after annealing at 1500 °C in a H2/Ar atmosphere.
3.2. X-ray Photoelectron Spectroscopy (XPS)
X-ray photoelectron spectroscopy (XPS) was used to investigate the oxidation states of the elements in the (ZrO2)92(Y2O3)7.800(Tb4O7)0.200 single-crystals before and after annealing. The survey spectrum (Figure 4) showed clear signals from the matrix elements Zr, Y, and O, and a weak signal from Tb. The expansion of the Tb 3d energy-level spectra of the crystalline samples before and after annealing are shown in Figure 5. The Tb 3d core-level spectrum contained peaks from the Tb 3d3/2 and Tb 3d5/2 spin-orbit states. In the unannealed sample, the peaks of Tb 3d3/2 and Tb 3d5/2 were at about 1277.1 and 1241.8.4 eV, respectively, and shifted to about 1276.8 and 1240.9 eV in the annealed sample. These are similar to the values of about 1277 and 1241 eV reported by Zhang et al. for the Tb3+ 3d3/2 and Tb3+ 3d5/2 peaks, respectively []. However, the low Tb content in the present work resulted in insufficient signal-to-noise values to allow for a conclusive assignment to the environments for Tb3+ and Tb4+. The XPS spectrum of the O 1s core-energy level (Figure 6) showed two peaks at 531.8 and 530.2 eV, corresponding to O2− in the unannealed sample []. The positions of these peaks were similar to that in the annealed sample (531.6 and 529.9 eV) and there was also a small change in their relative intensities. We suggest that this is the result of a decrease in O2− ions bound to two metal ions in the 4+ oxidation state (Zr4+ + some Tb4+) and an increase in those bound to one 4+ and one 3+ ion as a result of the reduction of Tb4+ to Tb3+. The XPS spectra of the matrix elements Zr and Y for the before-and-after annealing samples showed that Zr and Y were essentially unaffected by annealing [,] (see Supplementary Materials).
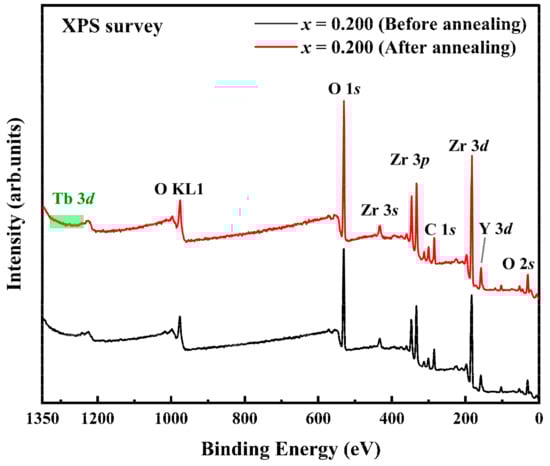
Figure 4.
XPS survey spectrum of (ZrO2)92(Y2O3)7.800(Tb4O7)0.200 single-crystals before and after annealing in a H2/Ar atmosphere.
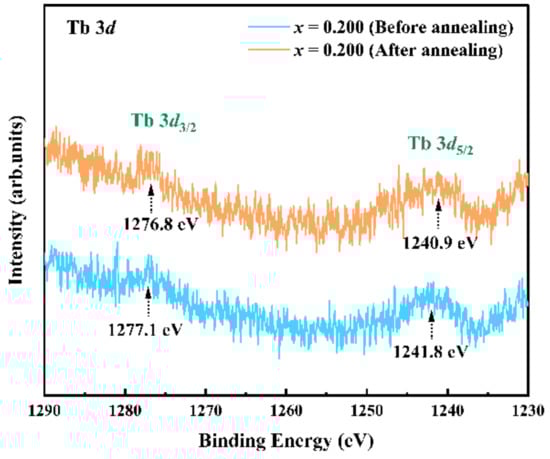
Figure 5.
XPS Tb 3d core-energy-level spectrum.
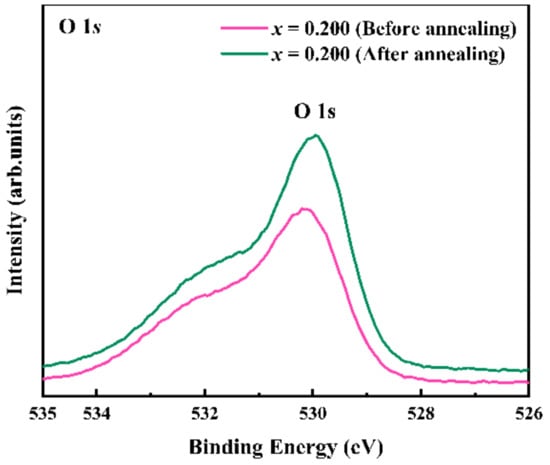
Figure 6.
XPS O 1s core-energy-level spectrum.
3.3. Absorption and Transmission Spectrum
The absorption spectra of the (ZrO2)92(Y2O3)8−x(Tb4O7)x (x = 0.000–0.250) crystal disks in the range of 220–800 nm are shown in Figure 7. In the absence of Tb, there was a single intense absorption at 243 nm, corresponding to the direct absorption in the wide-bandgap semiconductor ZrO2 [,]. This transition was also present in the Tb4O7-doped samples, which show a total of three absorption peaks at 245, 300, and 370 nm. The peak at 300 nm corresponds to the 4f 8→4f 75d1 transition in Tb3+ ions and the broad peak at 370 nm may originate from Tb4+ []. As the Tb doping concentration increased, the Tb3+ absorption peak underwent a red shift similar to that reported for Tb-doped Bi2MoO6 []; thus, this demonstrates that the presence of Tb affects the light absorption in the ZrO2 host.
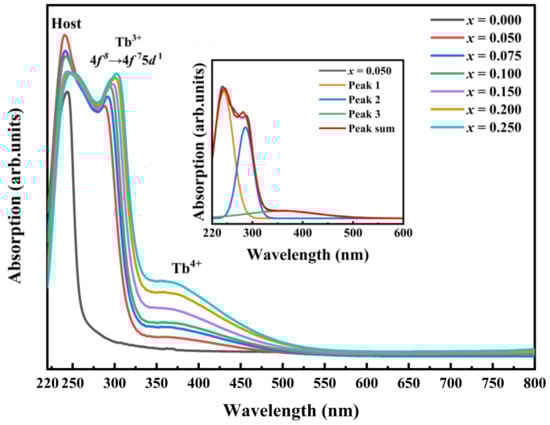
Figure 7.
The absorption spectrum of (ZrO2)92(Y2O3)8−x(Tb4O7)x (x = 0.000–0.250) crystal discs before annealing (the inset is the result of Gaussian peak fitting of the absorption spectrum of the (ZrO2)92(Y2O3)7.950(Tb4O7)0.050 crystal).
Transmission spectra of the (ZrO2)92(Y2O3)7.800(Tb4O7)0.200 crystal disks were also measured before and after annealing, and were shown in Figure 8. The annealed crystals showed only two transmission peaks at 246 nm and 302 nm, and thus supports the assignment of the peak at 370 nm in the unannealed sample to Tb4+ ions. The large width of this peak (from 330 to 550 nm), which is much larger than that of the Tb3+ 4f 8→4f 75d1 transition (280–335 nm), suggests that it may correspond to a charge-transfer transition in the Tb4+ ions []. The transmittance of the annealed crystals in the range of 550–800 nm was about 86%, whereas it was about 78% in the unannealed sample; thus, this shows that the transmittance of the crystals increased after annealing.
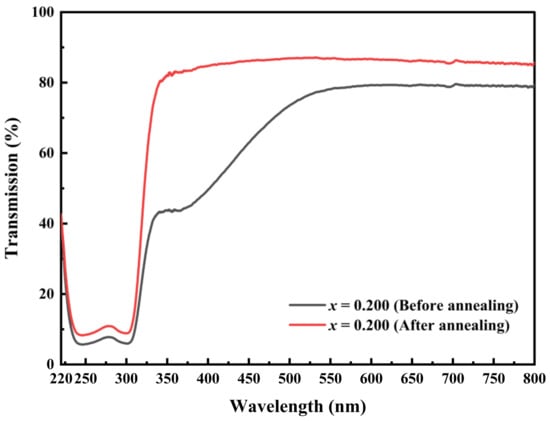
Figure 8.
Transmission spectra of (ZrO2)92(Y2O3)7.800(Tb4O7)0.200 crystals before and after annealing at 1500 °C in a H2/Ar atmosphere.
3.4. Photoluminescence Excitation (PLE) Spectra
The PLE spectra of the (ZrO2)92(Y2O3)8−x(Tb4O7)x (x = 0.050–0.250) crystals monitored at 544 nm are shown in Figure 9. There were three excitation peaks in the range of 200–500 nm at 300, 377, and 484 nm. The excitation peak centered at 300 nm (230–360 nm) is broad and corresponds to the spin-allowed 4f 8→4f 75d1 transition of Tb3+ ions []. In contrast, the weak excitation peaks at 377 nm and 484 nm are sharp, which correspond to the forbidden electric-dipole transitions 7F6→5D3 and 7F6→5D4 in the Tb3+ 4f configuration [,].
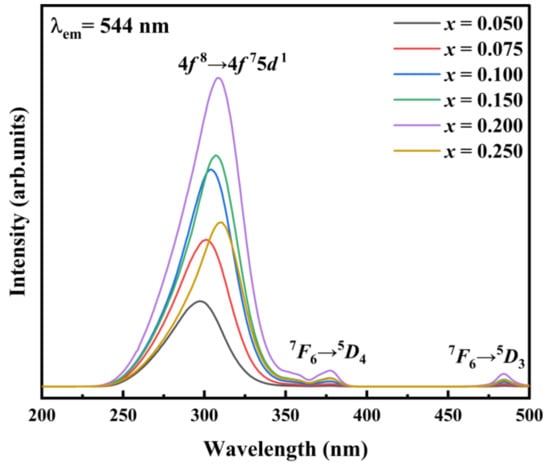
Figure 9.
Excitation spectra of (ZrO2)92(Y2O3)8−x(Tb4O7)x (x = 0.050–0.250) crystals before annealing and monitored at 544 nm.
The PLE spectra of the (ZrO2)92(Y2O3)7.800(Tb4O7)0.200 crystals shown in Figure 10 remained unchanged during the annealing and demonstrated that there was no Tb4+-excitation band. The excitation peak at 300 nm was red-shifted with the increasing Tb4O7 concentration, which probably reflects the changes in the energy of the lowest 5d-level of Tb3+ in the YSZ host. This has been shown to differ between different host materials and may be influenced by two independent factors: (1) the nephelauxetic effect, which corresponds to a shortening of the metal-ligand distance as a result of a decrease in the coordination number and results in a shift in the center of the mass of the 5d electrons from the free-ion energy level; and (2) a crystal field effect, which causes the 5d manifold to split into various sub-levels []. Considering that both the XRD and Raman results show that the phase structure of the crystals does not change, we presume that the red-shift phenomenon in these samples was caused by the nephelauxetic effect []. In Figure 9, the intensity of the excitation spectrum of the (ZrO2)92(Y2O3)8−x(Tb4O7)x crystal sample first increases with the concentration of Tb4O7, reaches a maximum at x = 0.200, and then decreases, which may be the result of the cross-relaxation between two adjacent Tb3+ ions [].
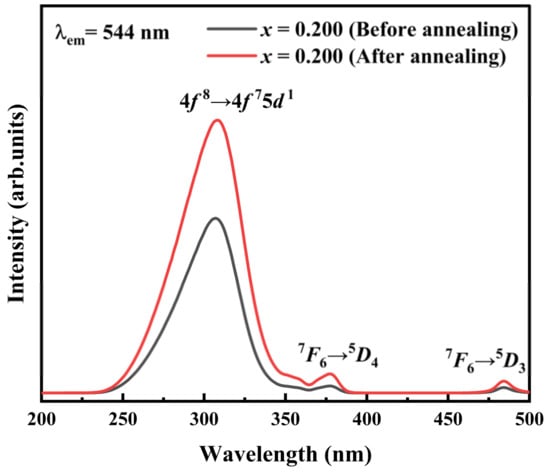
Figure 10.
Excitation spectra of (ZrO2)92(Y2O3)7.800(Tb4O7)0.200 crystals before and after annealing at 1500 °C in a H2/Ar atmosphere monitored at 544 nm.
3.5. Photoluminescence Emission (PL) Spectra
The PL spectra of the unannealed (ZrO2)92(Y2O3)8−x(Tb4O7)x crystal disks following irradiation at 300 nm at room temperature are shown in Figure 11. A bright green emission was observed and consisted of a total of seven peaks, all of which originate from 4f→4f transitions in Tb3+ ions. The weak peaks at 385, 422, and 441 nm, which are shown in the expanded form in Figure 12, are blue and correspond to the Tb3+ 5D3→7FJ (J = 6,5,4) transitions, whereas the peaks at 489, 544, 585, 621, and 677 nm are green and correspond to the Tb3+ 5D4→7FJ (J = 6,5,4,3,1) transitions. The strongest emission peak at 544 nm arose from the 5D4→7F5 transition and is the typical strong-green emission from Tb3+ ions. No additional emission peaks that could originate from Tb4+ were observed in the unannealed samples (e.g., Figure 12), indicating that Tb4+ did not emit in the visible-light region, but the intensity of the spectrum of the annealed sample was appreciably higher because of the higher concentration of Tb3+. With the increasing Tb4O7 concentration, the intensity of the blue emission (5D3→7F6) first increased and then decreased, with the highest intensity at x = 0.100 (Figure 12), whereas the green emission (5D4→7F5) first increased to reach a maximum intensity at x = 0.200 and then decreased with higher x (Figure 11). These different trends are the result of the cross-relaxation (CR) between neighboring Tb3+ ions. Considering that the excited states of two Tb3+ ions resonate with the ground state, the CR process can be expressed as:
Tb3+ (5D3) + Tb3+ (7F0) = Tb3+ (5D4) + Tb3+ (7F6).
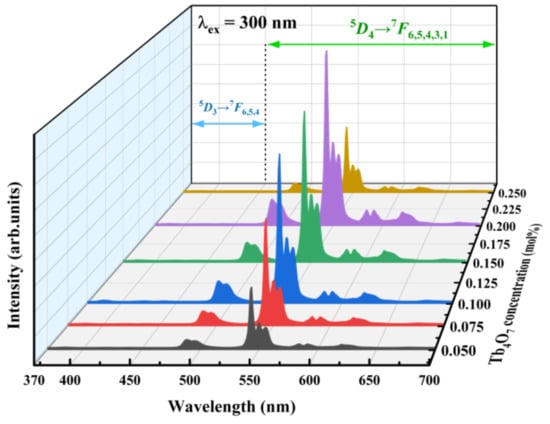
Figure 11.
Emission spectra of (ZrO2)92(Y2O3)8−x(Tb4O7)x (x = 0.050–0.250) crystals before annealing.
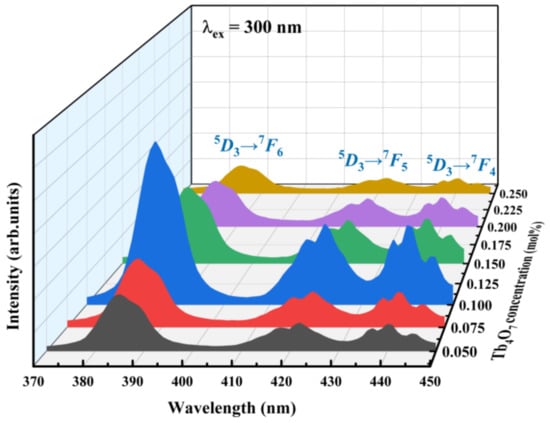
Figure 12.
Expansion of the emission spectra in the range 370–450 nm of (ZrO2)92(Y2O3)8−x(Tb4O7)x (x = 0.050–0.250) crystals before annealing.
The energy difference between the 5D3 and 5D4 states is about 5600 cm−1, whilst that between the 7F0 and 7F6 states is about 5800 cm−1, with the result that there is little difference in the total energy on each side of the above equation. Therefore, when the concentration of Tb3+ is high, energy can be transferred from the 5D3 state of one Tb3+ ion to the 5D4 state of a neighboring Tb3+ ion, and this results in a quenching of the emission from Tb3+ ions at the 5D3 high-energy level and an increased emission from the lower 5D4-energy level.
The emission spectra of the (ZrO2)92(Y2O3)7.800(Tb4O7)0.200 crystals before and after annealing in H2 (Figure 13) confirm that all of the emissions in the visible region arise from Tb3+ 4f→4f transitions and indicate that their positions are unaffected by the presence of Tb4+. Thus, the Tb3+ emission is independent of Tb4+ in Tb3+ and Tb4+ co-doped systems. However, the emission intensity of the annealed crystals was stronger than that of the unannealed crystals probably because of the higher Tb3+ concentration as a result of the Tb4+ reduction. The various excitation and emission transitions for Tb3+ ions are summarized in Figure 14.
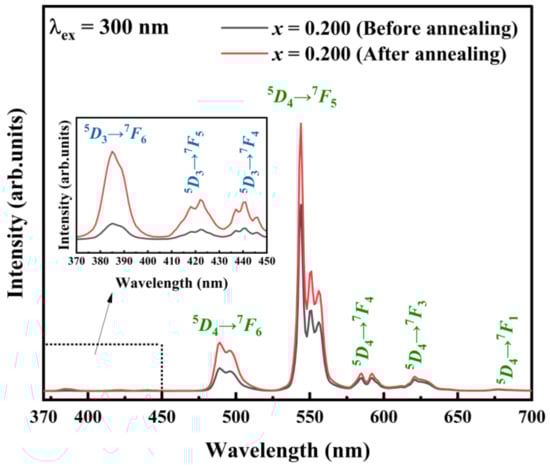
Figure 13.
Emission spectrum of (ZrO2)92(Y2O3)7.800(Tb4O7)0.200 crystals before and after annealing at 1500 °C in a H2/Ar atmosphere.
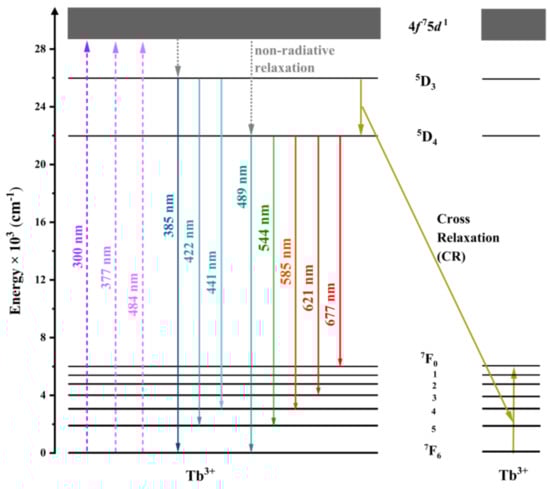
Figure 14.
Energy-level-transition diagram of Tb3+ ions in the yttria-stabilized zirconia single-crystal.
3.6. Fluorescence Decay
The fluorescence-decay lifetime is an important parameter for understanding energy-transfer mechanisms and the curve for the fluorescence decay of the (ZrO2)92(Y2O3)7.800(Tb4O7)0.200 crystals before annealing is shown in Figure 15 for the 544 nm (5D4→7F5, green) peak produced by the excitation at 300 nm.
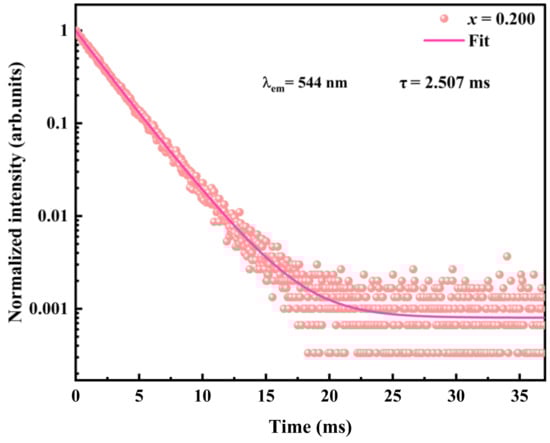
Figure 15.
Fluorescence-decay curve for the Tb3+ 5D4→7F5 transition in the (ZrO2)92(Y2O3)7.800(Tb4O7)0.200 single-crystals before annealing.
The decay curve fits to a double exponential function, i.e.,
where I(t) is the PL intensity, and represent the fast and slow components of the luminescence lifetime, respectively, and and are fitting parameters. Additionally, the average decay time of the sample is defined as:
The values for these parameters obtained by computer fitting are = 0.49369, = 0.50033, = 2.079 ms, and =2.817 ms. From these results, τ is calculated to be 2.507 ms, which is longer than the values reported for that of BSGdCaTb glass (2.31 ms) [] or Tb3+-doped germanium borosilicate (GBS) magneto-optical glass (2.317 ms) []. Furthermore, the double exponential function indicates that the Tb3+ ions may be located in two different environments in the yttria-stabilized zirconia crystal.
4. Conclusions
Yttria-stabilized zirconia crystals doped with terbium oxide (Tb4O7) were prepared by the optical floating-zone method and shown to be in the cubic form without cracks or inclusions. The crystals initially contained Tb in both the Tb3+ and Tb4+ forms but the Tb4+ was reduced to Tb3+ by annealing crystals at 1500 °C in an Ar/H2 atmosphere, although the Tb4+ ions were reduced to Tb3+ through annealing. The XPS results showed that Zr, Y, and O were essentially unaffected because the change in the relative intensities of the peaks in the O spectra were small. The absorption spectra of the crystals showed three peaks at 240, 300, and 370 nm, corresponding to the Tb3+ 4f 8→4f 75d1 transition and the Tb4+ charge-transfer band. This spectrum also showed a red shift with increasing Tb, indicating that Tb-doping affects the light absorption properties of the YSZ host. The transmission spectra showed that the crystals had higher transmittance after annealing, although both the excitation and emission spectra correspond to transitions within the 4f and 5d configurations of Tb3+ (4f 8→4f 75d1 and 4f→4f configurations). No excitation or emission peaks were observed from Tb4+ and its presence did not influence the positions or shapes of the Tb3+ peaks. The PL spectra also showed emissions from the Tb3+ 5D3 and 5D4 states, which exhibited different relationships with the level of Tb-doping as a result of the cross-relaxation between neighboring Tb3+ ions. The strongest emission peak from the crystals was located at 544 nm and corresponds to the Tb3+ 5D4→7F5 transition, which is the typical strong green-light emission of Tb3+ ions. The intensity of this emission increased initially with an increasing Tb4O7 concentration, reached a maximum at x = 0.200, and then decreased at a higher doping level. Overall, these results suggest that (ZrO2)92(Y2O3)8−x(Tb4O7)x single-crystals may have potential applications as green lasers and for use in medical imaging.
Supplementary Materials
The following supporting information can be downloaded at: https://www.mdpi.com/article/10.3390/cryst12081081/s1, Figure S1: Raman spectra of (ZrO2)92(Y2O3)8−x(Tb4O7)x (x = 0.050–0.250) crystals before annealing; Figure S2: XPS Zr 3d core-energy-level spectrum of (ZrO2)92(Y2O3)7.800(Tb4O7)0.200 single-crystals before and after annealing at 1500 °C in a H2/Ar atmosphere; Figure S3: XPS Y 3d core-energy-level spectrum of (ZrO2)92(Y2O3)7.800(Tb4O7)0.200 single-crystals before and after annealing at 1500 °C in a H2/Ar atmosphere.
Author Contributions
Conceptualization, Y.W. and S.X.; methodology, Y.W. and Z.Z.; software, Y.W., S.T. and Z.C.; validation, Y.W., S.X. and W.D.; formal analysis, Y.W., Z.C. and P.Z.; investigation, Y.W., N.Z. and P.Z.; resources, W.D.; data curation, Y.W., Z.Z. and S.T.; writing—original draft preparation, Y.W.; writing—review and editing, Y.W., B.A.G. and W.D.; visualization, B.A.G., W.D. and S.X.; supervision, S.X. and W.D.; project administration, W.D.; funding acquisition, W.D. All authors have read and agreed to the published version of the manuscript.
Funding
This work was financially supported by the Key Research and Development Plan Project of Guangxi, China, under grant number Guike AB18281007, and by the National Natural Science Foundations of China under grant numbers 11975004 and 12175047.
Data Availability Statement
Not applicable.
Conflicts of Interest
The authors declare no conflict of interest.
References
- Zhang, M.; Zhai, X.; Sun, M.; Ma, T.; Huang, Y.; Huang, B.; Du, Y.; Yan, C. When rare earth meets carbon nanodots: Mechanisms, applications and outlook. Chem. Soc. Rev. 2020, 49, 9220–9248. [Google Scholar] [CrossRef] [PubMed]
- Zhang, C.; Lin, J. Defect-related luminescent materials: Synthesis, emission properties and applications. Chem. Soc. Rev. 2012, 41, 7938–7961. [Google Scholar] [CrossRef] [PubMed]
- Chen, P.; Han, W.; Zhao, M.; Su, J.; Li, Z.; Li, D.; Pi, L.; Zhou, X.; Zhai, T. Recent Advances in 2D Rare Earth Materials. Adv. Funct. Mater. 2020, 31, 1616–3028. [Google Scholar] [CrossRef]
- Brüninghoff, R.; Engelsen, D.; Fern, G.R.; Ireland, T.G.; Dhillon, R.; Silver, J. Nanosized (Y1−xGdx)2O2S: Tb3+ particles: Synthesis, photoluminescence, cathodoluminescence studies and a model for energy transfer in establishing the roles of Tb3+ and Gd3+. RSC Adv. 2016, 6, 42561–42571. [Google Scholar] [CrossRef] [Green Version]
- Guan, H.; Sheng, Y.; Xu, C.; Dai, Y.; Xie, X.; Zou, H. Energy transfer and tunable multicolor emission and paramagnetic properties of GdF3: Dy3+, Tb3+, Eu3+ phosphors. Phys. Chem. Chem. Phys. 2016, 18, 19807–19819. [Google Scholar] [CrossRef]
- Jung, J.-Y. Luminescent Color-Adjustable Europium and Terbium Co-Doped Strontium Molybdate Phosphors Synthesized at Room Temperature Applied to Flexible Composite for LED Filter. Crystals 2022, 12, 552. [Google Scholar] [CrossRef]
- Santos, S.N.C.; Paula, K.T.; Almeida, J.M.P.; Hernandes, A.C.; Mendonça, C.R. Effect of Tb3+/Yb3+ in the nonlinear refractive spectrum of CaLiBO glasses. J. Non-Cryst. Solids 2019, 524, 00223093. [Google Scholar] [CrossRef]
- Quang, V.X.; Van Do, P.; Ca, N.X.; Thanh, L.D.; Tuyen, V.P.; Tan, P.M.; Hoa, V.X.; Hien, N.T. Role of modifier ion radius in luminescence enhancement from 5D4 level of Tb3+ ion doped alkali-alumino-telluroborate glasses. J. Lumin. 2020, 221, 00222313. [Google Scholar] [CrossRef]
- Han, S.; Tao, Y.; Du, Y.; Yan, S.; Chen, Y.; Chen, D. Luminescence Behavior of GdVO4: Tb Nanocrystals in Silica Glass-Ceramics. Crystals 2020, 10, 396. [Google Scholar] [CrossRef]
- Wu, M.-y.; Qu, P.-f.; Wang, S.-y.; Guo, Z.; Cai, D.-f.; Li, B.-b. Investigation of multi-segmented Nd:YAG/NdYVO4 crystals and their laser performance end-pumped by a fiber coupled diode laser. Optik 2019, 179, 367–372. [Google Scholar] [CrossRef]
- Sriwongsa, K.; Limkitjaroenporn, P.; Hongtong, W.; Chaiphaksa, W.; Kaewkhao, J.; Kim, H.J. Non-Proportionality Electron Response and Energy Resolution of LaBr3:Ce and LuYAP:Ce Scintillating Crystals. J. Korean Phys. Soc. 2019, 75, 672–677. [Google Scholar] [CrossRef]
- Kawaguchi, N.; Kimura, H.; Akatsuka, M.; Okada, G.; Kawano, N.; Fukuda, K.; Yanagida, T. Scintillation Characteristics of Pr:CaF2 Crystals for Charged-particle Detection. Sens. Mater. 2018, 30, 0914–4935. [Google Scholar] [CrossRef]
- Yang, Y.; Xu, S.; Li, S.; Wu, W.; Pan, Y.; Wang, D.; Hong, X.; Cheng, Z.; Deng, W. Luminescence Properties of Ho2O3-Doped Y2O3 Stabilized ZrO2 Single Crystals. Crystals 2022, 12, 415. [Google Scholar] [CrossRef]
- Yan, X.; Fern, G.R.; Withnall, R.; Silver, J. Effects of the host lattice and doping concentration on the colour of Tb3+ cation emission in Y2O2S: Tb3+ and Gd2O2S: Tb3+ nanometer sized phosphor particles. Nanoscale 2013, 5, 8640–8646. [Google Scholar] [CrossRef]
- Wu, D.; Xiao, W.; Zhang, L.; Zhang, X.; Hao, Z.; Pan, G.-H.; Luo, Y.; Zhang, J. Simultaneously tuning the emission color and improving thermal stability via energy transfer in apatite-type phosphors. J. Mater. Chem. C 2017, 5, 11910–11919. [Google Scholar] [CrossRef]
- Xu, J.; Xu, X.-D.; Hou, W.-T.; Shi, Z.-L.; Zhao, H.-Y.; Xue, Y.-Y.; Shi, J.-J.; Liu, B.; Li, N. Research Progress of Rare-earth Doped Laser Crystals in Visible Region. J. Inorg. Mater. 2019, 34, 573–589. [Google Scholar]
- Lovisa, L.X.; Gomes, E.O.; Gracia, L.; Santiago, A.A.G.; Li, M.S.; Andrés, J.; Longo, E.; Bomio, M.R.D.; Motta, F.V. Integrated experimental and theoretical study on the phase transition and photoluminescent properties of ZrO2: x Tb3+ (x = 1, 2, 4 and 8 mol %). Mater. Res. Bull. 2022, 145, 00255408. [Google Scholar] [CrossRef]
- Metz, P.W.; Marzahl, D.-T.; Majid, A.; Kränkel, C.; Huber, G. Efficient continuous wave laser operation of Tb3+-doped fluoride crystals in the green and yellow spectral regions. Laser Photonics Rev. 2016, 10, 335–344. [Google Scholar] [CrossRef]
- Kaszewski, J.; Witkowski, B.S.; Wachnicki, Ł.; Przybylińska, H.; Kozankiewicz, B.; Mijowska, E.; Godlewski, M. Reduction of Tb4+ ions in luminescent Y2O3: Tb nanorods prepared by microwave hydrothermal method. J. Rare Earths. 2016, 34, 774–781. [Google Scholar] [CrossRef]
- Gompa, T.P.; Ramanathan, A.; Rice, N.T.; La Pierre, H.S. The chemical and physical properties of tetravalent lanthanides: Pr, Nd, Tb, and Dy. Dalton Trans. 2020, 49, 15945–15987. [Google Scholar] [CrossRef]
- López-Pacheco, G.; Padilla-Rosales, I.; López, R.; González, F. Revisiting the Charge Transfer State in Tetravalent Lanthanide Doped Oxides: Up to Date Phenomenological Description. ECS J. Solid State Sci. Technol. 2021, 10, 2162–8777. [Google Scholar] [CrossRef]
- Shyichuk, A.; Meinrath, G.; Lis, S. Pairs of Ln(III) dopant ions in crystalline solid luminophores: An ab initio computational study. J. Rare Earths 2016, 34, 820–827. [Google Scholar] [CrossRef]
- Kaszewski, J.; Borgstrom, E.; Witkowski, B.S.; Wachnicki, Ł.; Kiełbik, P.; Slonska, A.; Domino, M.A.; Narkiewicz, U.; Gajewski, Z.; Hochepied, J.-F.; et al. Terbium content affects the luminescence properties of ZrO2: Tb nanoparticles for mammary cancer imaging in mice. Opt. Mater. 2017, 74, 16–26. [Google Scholar] [CrossRef]
- Lovisa, L.X.; Araújo, V.D.; Tranquilin, R.L.; Longo, E.; Li, M.S.; Paskocimas, C.A.; Bomio, M.R.D.; Motta, F.V. White photoluminescence emission from ZrO2 co-doped with Eu3+, Tb3+ and Tm3+. J. Alloys Compd. 2016, 674, 245–251. [Google Scholar] [CrossRef]
- Meetei, S.D.; Singh, S.D.; Sudarsan, V. Polyol synthesis and characterizations of cubic ZrO2: Eu3+ nanocrystals. J. Alloys Compd. 2012, 514, 174–178. [Google Scholar] [CrossRef]
- Huang, H.-J.; Wang, M.-C. The phase formation and stability of tetragonal ZrO2 prepared in a silica bath. Ceram. Int. 2013, 39, 1729–1739. [Google Scholar] [CrossRef]
- Reddy, C.V.; Reddy, I.N.; Shim, J.; Kim, D.; Yoo, K. Synthesis and structural, optical, photocatalytic, and electrochemical properties of undoped and yttrium-doped tetragonal ZrO2 nanoparticles. Ceram. Int. 2018, 44, 12329–12339. [Google Scholar] [CrossRef]
- Vasanthavel, S.; Kannan, S. Structural investigations on the tetragonal to cubic phase transformations in zirconia induced by progressive yttrium additions. J. Phys. Chem. Solids 2018, 112, 100–105. [Google Scholar] [CrossRef]
- Xu, S.; Tan, X.; Liu, F.; Zhang, L.; Huang, Y.; Goodman, B.A.; Deng, W. Growth and optical properties of thulia-doped cubic yttria stabilized zirconia single crystals. Ceram. Int. 2019, 45, 15974–15979. [Google Scholar] [CrossRef]
- Wang, X.; Tan, X.; Xu, S.; Liu, F.; Goodman, B.A.; Deng, W. Preparation and up-conversion luminescence of Er-doped yttria stabilized zirconia single crystals. J. Lumin. 2020, 219, 00222313. [Google Scholar] [CrossRef]
- Wang, D.; Wu, W.; Tan, X.; Goodman, B.A.; Xu, S.; Deng, W. Upconversion Visible Light Emission in Yb/Pr Co-Doped Yttria-Stabilized Zirconia (YSZ) Single Crystals. Crystals 2021, 11, 1328. [Google Scholar] [CrossRef]
- Li, S.; Xu, S.; Wang, X.; Wang, D.; Goodman, B.A.; Hong, X.; Deng, W. Optical properties of gadolinia-doped cubic yttria stabilized zirconia single crystals. Ceram. Int. 2021, 47, 3346–3353. [Google Scholar] [CrossRef]
- Hong, X.; Xu, S.; Wang, X.; Wang, D.; Li, S.; Goodman, B.A.; Deng, W. Growth, structure and optical spectroscopic properties of dysprosia-doped cubic yttria stabilized zirconia (YSZ) single crystals. J. Lumin. 2021, 231, 00222313. [Google Scholar] [CrossRef]
- Vidya, Y.S.; Gurushantha, K.; Nagabhushana, H.; Sharma, S.C.; Anantharaju, K.S.; Shivakumara, C.; Suresh, D.; Nagaswarupa, H.P.; Prashantha, S.C.; Anilkumar, M.R. Phase transformation of ZrO2: Tb3+ nanophosphor: Color tunable photoluminescence and photocatalytic activities. J. Alloys Compd. 2015, 622, 86–96. [Google Scholar] [CrossRef]
- Soares, M.R.N.; Nico, C.; Rodrigues, J.; Peres, M.; Soares, M.J.; Fernandes, A.J.S.; Costa, F.M.; Monteiro, T. Bright room-temperature green luminescence from YSZ: Tb3+. Mater. Lett. 2011, 65, 1979–1981. [Google Scholar] [CrossRef]
- Devanathan, R.; Weber, W.; Singhal, S.; Gale, J. Computer simulation of defects and oxygen transport in yttria-stabilized zirconia. Solid State Ion. 2006, 177, 1251–1258. [Google Scholar] [CrossRef] [Green Version]
- Shannon, R.D. Revised effective ionic radii and systematic studies of interatomic distances in halides and chalcogenides. Acta Crystallogr. Sect. A 1976, 32, 751–767. [Google Scholar] [CrossRef]
- Phillippi, C.M.; Mazdiyasni, K.S. Infrared and Raman Spectra of Zirconia Polymorphs. J. Am. Ceram. Soc. 1971, 54, 254–258. [Google Scholar] [CrossRef]
- Tan, X.; Xu, S.; Zhang, L.; Liu, F.; Goodman, B.A.; Deng, W. Preparation and optical properties of Ho3+-doped YSZ single crystals. Appl. Phys. A 2018, 124, 1–7. [Google Scholar] [CrossRef]
- Zhang, S.; Li, Y.; Lv, Y.; Fan, L.; Hu, Y.; He, M. A full-color emitting phosphor Ca9Ce(PO4)7: Mn2+, Tb3+: Efficient energy transfer, stable thermal stability and high quantum efficiency. Chem. Eng. J. 2017, 322, 314–327. [Google Scholar] [CrossRef]
- Ullah, B.; Lei, W.; Cao, Q.-S.; Zou, Z.-Y.; Lan, X.-K.; Wang, X.-H.; Lu, W.-Z.; Chen, X.M. Structure and Microwave Dielectric Behavior of A-Site-Doped Sr(1−1.5x)CexTiO3 Ceramics System. J. Am. Ceram. Soc. 2016, 99, 3286–3292. [Google Scholar] [CrossRef]
- Velu, S.; Suzuki, K.; Gopinath, C.S.; Yoshida, H.; Hattori, T. XPS, XANES and EXAFS investigations of CuO/ZnO/Al2O3/ZrO2 mixed oxide catalysts. Phys. Chem. Chem. Phys. 2002, 4, 1990–1999. [Google Scholar] [CrossRef]
- Pan, G.-H.; Zhang, L.; Wu, H.; Qu, X.; Wu, H.; Hao, Z.; Zhang, L.; Zhang, X.; Zhang, J. On the luminescence of Ti4+ and Eu3+ in monoclinic ZrO2: High performance optical thermometry derived from energy transfer. J. Mater. Chem. C 2020, 8, 4518–4533. [Google Scholar] [CrossRef]
- Li, H.; Li, W.; Gu, S.; Wang, F.; Zhou, H. In-built Tb4+/Tb3+ redox centers in terbium-doped bismuth molybdate nanograss for enhanced photocatalytic activity. Catal. Sci. Technol. 2016, 6, 3510–3519. [Google Scholar] [CrossRef]
- Dorenbos, P. Systematic behaviour in trivalent lanthanide charge transfer energies. J. Phys.-Condens Matter 2003, 15, 8417–8434. [Google Scholar] [CrossRef]
- Zhang, P.; Su, Y.; Teng, F.; He, Y.; Zhao, C.; Zhang, G.; Xie, E. Luminescent enhancement in ZrO2: Tb3+, Gd3+ nanoparticles by active-shell modification. CrystEngComm 2014, 16, 1378–1383. [Google Scholar] [CrossRef]
- Jarucha, N.; Wantana, N.; Kaewkhao, J.; Sareein, T. Studying the properties of Gd2O3–WO3–CaO–SiO2–B2O3 glasses doped with Tb3+. Semicond. Phys. Quantum Electron. Optoelectron. 2020, 23, 276–281. [Google Scholar] [CrossRef]
- Sztolberg, D.; Brzostowski, B.; Dereń, P.J. Spectroscopic properties of LaAlO3 single-crystal doped with Tb3+ ions. Opt. Mater. 2018, 78, 292–294. [Google Scholar] [CrossRef]
- Wang, X.; Wang, Y. Synthesis, Structure, and Photoluminescence Properties of Ce3+-Doped Ca2YZr2Al3O12: A Novel Garnet Phosphor for White LEDs. J. Phys. Chem. C 2015, 119, 16208–16214. [Google Scholar] [CrossRef]
- Zheng, T.; Luo, L.; Du, P.; Lis, S.; Rodríguez-Mendoza, U.R.; Lavín, V.; Martín, I.R.; Runowski, M. Pressure-triggered enormous redshift and enhanced emission in Ca2Gd8Si6O26: Ce3+ phosphors: Ultrasensitive, thermally-stable and ultrafast response pressure monitoring. Chem. Eng. J. 2022, 443, 13858947. [Google Scholar] [CrossRef]
- Boruc, Z.; Fetlinski, B.; Kaczkan, M.; Turczynski, S.; Pawlak, D.; Malinowski, M. Temperature and concentration quenching of Tb3+ emissions in Y4Al2O9 crystals. J. Alloys Compd. 2012, 532, 92–97. [Google Scholar] [CrossRef]
- Kesavulu, C.R.; Kim, H.J.; Lee, S.W.; Kaewkhao, J.; Kaewnuam, E.; Wantana, N. Luminescence properties and energy transfer from Gd3+ to Tb3+ ions in gadolinium calcium silicoborate glasses for green laser application. J. Alloys Compd. 2017, 704, 557–564. [Google Scholar] [CrossRef]
- Mo, Z.X.; Guo, H.W.; Liu, P.; Shen, Y.D.; Gao, D.N. Luminescence properties of magneto-optical glasses containing Tb3+ ions. J. Alloys Compd. 2016, 658, 967–972. [Google Scholar] [CrossRef]
Publisher’s Note: MDPI stays neutral with regard to jurisdictional claims in published maps and institutional affiliations. |
© 2022 by the authors. Licensee MDPI, Basel, Switzerland. This article is an open access article distributed under the terms and conditions of the Creative Commons Attribution (CC BY) license (https://creativecommons.org/licenses/by/4.0/).