Article

Prediction of Residual Stress Distribution in NM450TP Wear-Resistant Steel Welded Joints

1
College of Materials Science and Engineering, Chongqing University, Chongqing 400044, China
2
Technical Center, Handan Iron & Steel Group Co., Ltd., Handan 056015, China
3
College of Metallurgy and Energy, North China University of Science and Technology, Tangshan 063210, China
*
Author to whom correspondence should be addressed.
Crystals 2022, 12(8), 1093; https://doi.org/10.3390/cryst12081093
Submission received: 30 June 2022 / Revised: 1 August 2022 / Accepted: 2 August 2022 / Published: 4 August 2022
(This article belongs to the Special Issue Investigation on the Formation and Properties of Steels)

Abstract

:
This study developed a thermo-metallurgical-mechanical simulation method to calculate the temperature field and residual stress distribution in the NM450TP wear-resistant steel welded joints. During the simulation, the solid-state phase transformation and softening effect of NM450TP wear-resistant steel was considered. The simulation results were compared with the experimental results, which verified the feasibility of this method. The influences of solid-state phase transformation and softening effect on the welding residual stress distribution were discussed. The numerical simulation results showed that the solid-state phase transformation had a more significant effect on the magnitude and distribution of the longitudinal residual stress than that of the transverse residual stress. The softening effect had a significant influence on the peak value of the longitudinal residual stress and had little influence on the transverse residual stress. Comparing the numerical simulation results with the experimental results, it could be seen that the calculation results of the welding residual stress were in the best agreement with the experimental measurement results when the solid-state transformation and softening effects were considered at the same time.

1. Introduction

The rapid development of the manufacturing and construction industries result in increasing requirements for the mechanical properties of steels [1,2]. Due to their high strength, hardness, and wear resistance, the low-alloy ultra-high-strength steels, such as NM450TP wear-resistant steel, have received more and more attention. The low-alloy ultra-high-strength steels usually have a martensitic structure, which have high yield strength and hardness, and low plastic toughness [3]. Compared with traditional steels, the welding of low-alloy ultra-high-strength steels is much more difficult, and many welding problems have yet to be solved [4,5,6,7].
Among them, the welding residual stress problem is the most challenging, and has a great influence on structure safety. The peak residual stress in the welded joint is related to the yield strength of material [8]. The higher the yield strength of the material, the greater the peak residual stress in the welded joint [9]. Low-alloy ultra-high-strength steels are often used to manufacture thin-plate or thin-walled structures. Due to the low structural stiffness and the high yield strength [10], the welding residual stress and deformation problems of low-alloy ultra-high-strength steels are more prominent than those of conventional low-carbon steels [11,12]. The transient stress generated during welding is the driving force for hot and cold cracking. Tensile residual stress may lead to brittle fracture, fatigue failure, and stress corrosion of the structure in the service process. Large compressive residual stresses also increase the risk of structural instability. Studies have shown [13] that under dynamic load service conditions, when residual stress and load stress are superimposed, the embrittlement and softening zones in the welded joint are more likely to become the initiation point of fatigue cracks, leading to instantaneous fracture. Therefore, in-depth research on the welding residual stress of low-alloy ultra-high strength steel is an urgent need.
Recent advances in computational welding mechanics have shown that numerical simulation methods are the most promising method to study welding residual stresses. The low-alloy high-strength steels have a martensitic structure. The material in the heat-affected zone undergoes a martensite–austenite transformation and softens due to the heating of the welding thermal cycle, which may greatly influence the calculation accuracy of welding residual stress. Related studies have been conducted by other researchers. Deng et al. [14] studied the effect of solid-state phase transformation on the residual stress calculation of P92 steel welded joints. The results showed that solid-state phase transformation had a significant impact on the residual stress magnitude and distribution trend in the welded joint. Fang et al. [15] studied the effect of solid-state phase phase transformation on stress evolution in martensitic steel during laser cladding. The results showed that the finite element calculation results were more consistent with the experimental values when the solid-state phase transformation was considered. Rna et al. [16] studied the residual stress in the welded joint of a steel with a yield strength of 1180 MPa. The results showed that the softening of the base metal adjacent to the heat-affected zone had a significant effect on residual stress distribution in the joint. Li et al. [17] studied the microstructure and properties of dissimilar steel welded joints. The results showed that the wear resistance and overall strength of the welded joints decreased significantly near the softening zone. The higher the yield strength of the steel, the more severe the softening effect in the joint. Although previous studies have demonstrated that solid-state phase transformation and the softening effect have important effects on residual stress calculation, existing studies have not considered both effects when investigating the welding residual stress in low-alloy ultra-high-strength steels.
In this study, a thermo-metallurgical-mechanical simulation method was developed to calculate the temperature field and residual stress distribution in NM450TP wear-resistant steel welded joints. During the simulation, both solid-state phase transformation and the softening effect were considered. Based on the numerical simulation and experimental results, the influence mechanism of solid-state phase transformation and softening effect on the welding residual stress was discussed. The research results obtained in this study will provide the experimental basis and theoretical support for an in-depth understanding of the welding residual stress distribution characteristics of low-alloy ultra-high-strength steels.

2. Materials and Methods

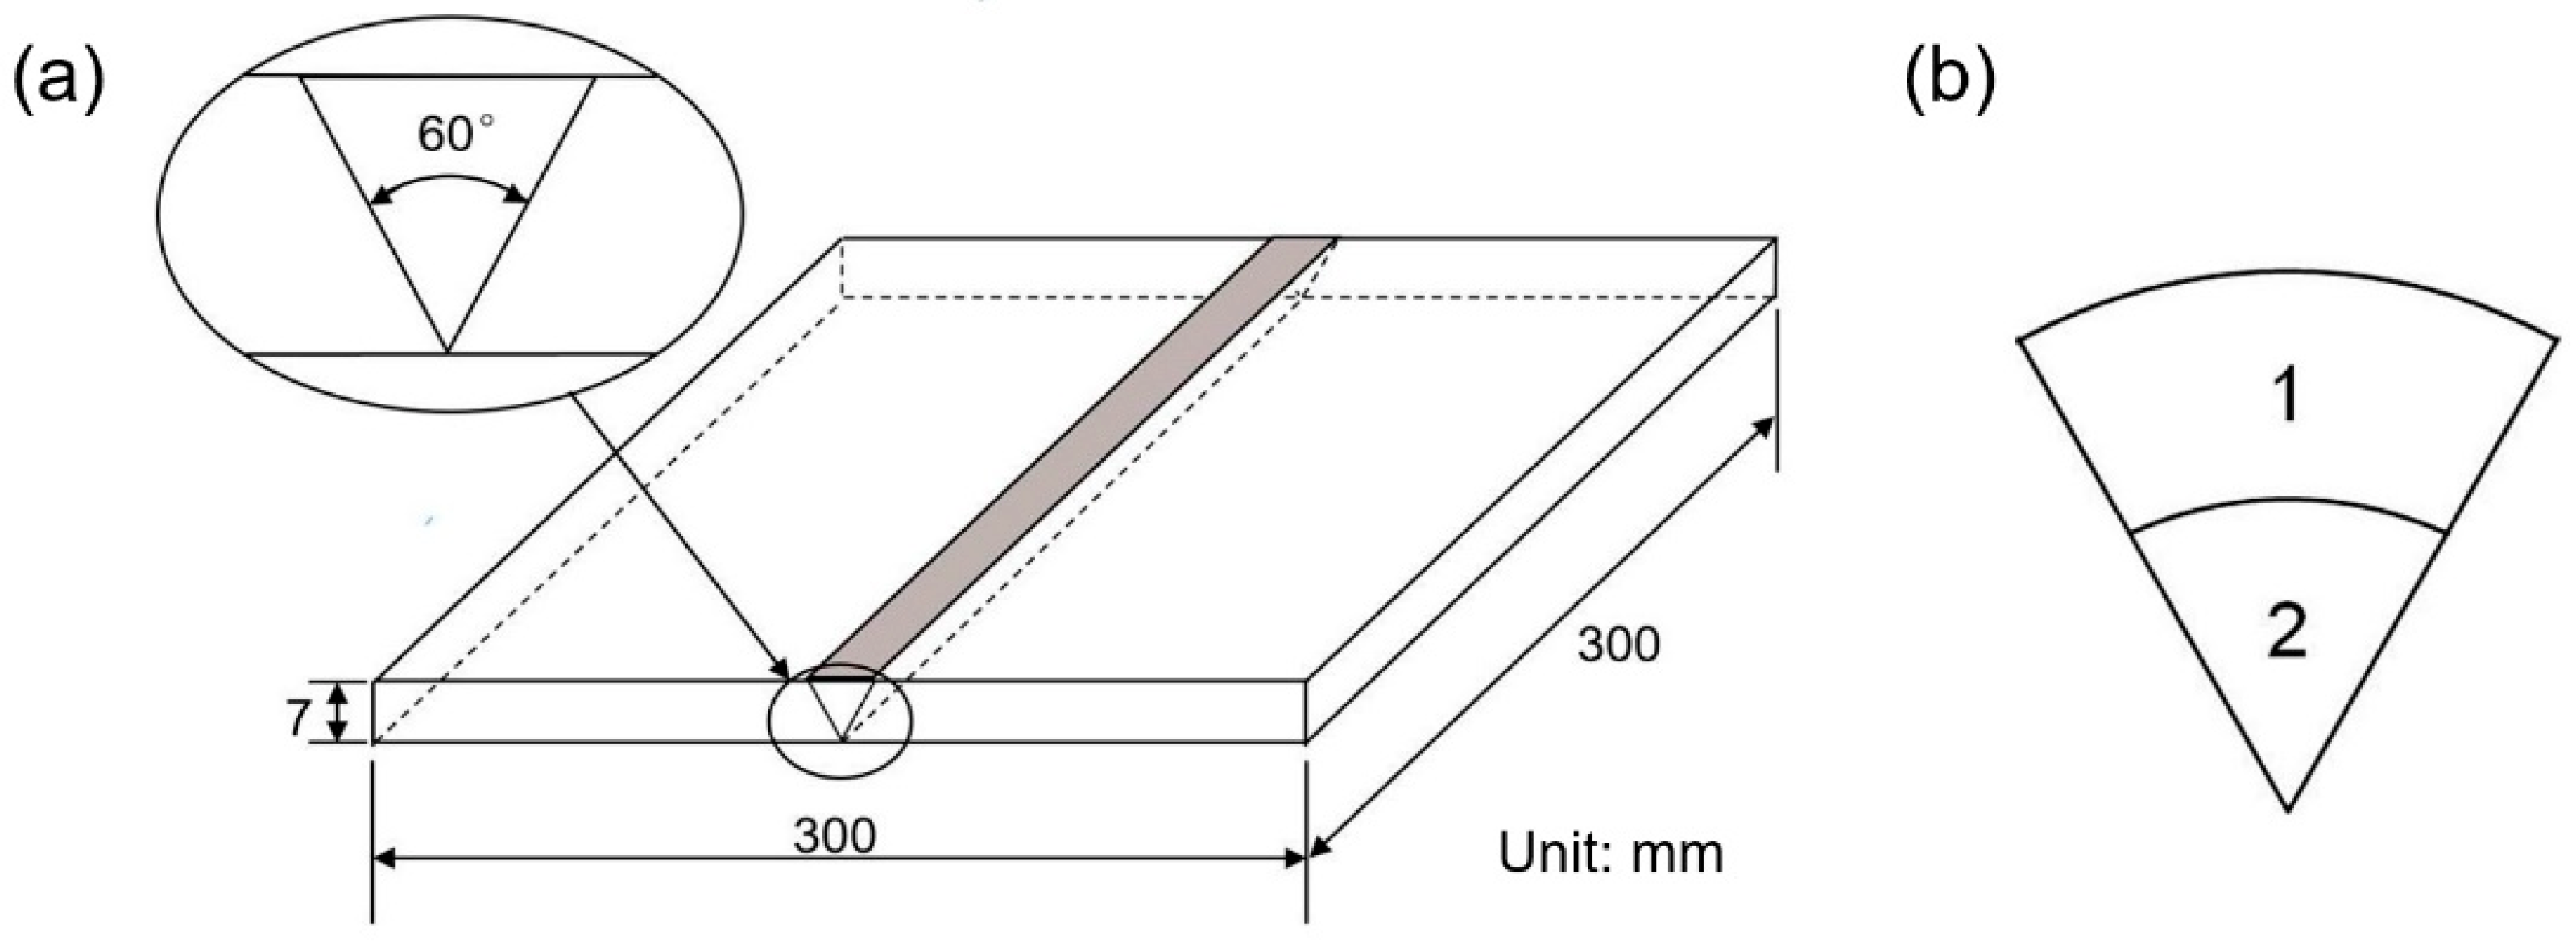
The base metal used in the experiment was NM450TP wear-resistant steel in quenched state. The welding filler material was ER100S-G wire with a diameter of 1.2 mm. The Gas Metal Arc Welding (GMAW) method was used to fabricate the butt-welded joint. The welding machine (NB-350IGBT) is shown in Figure 1. The main chemical compositions of the base metal and welding wire are shown in Table 1 and Table 2, respectively. Figure 2 shows the geometric dimensions of the welded joint and the pass arrangement. The size of the specimen was 300 mm × 300 mm × 7 mm. The groove form was unilateral V-shaped and the groove angle was 60°.
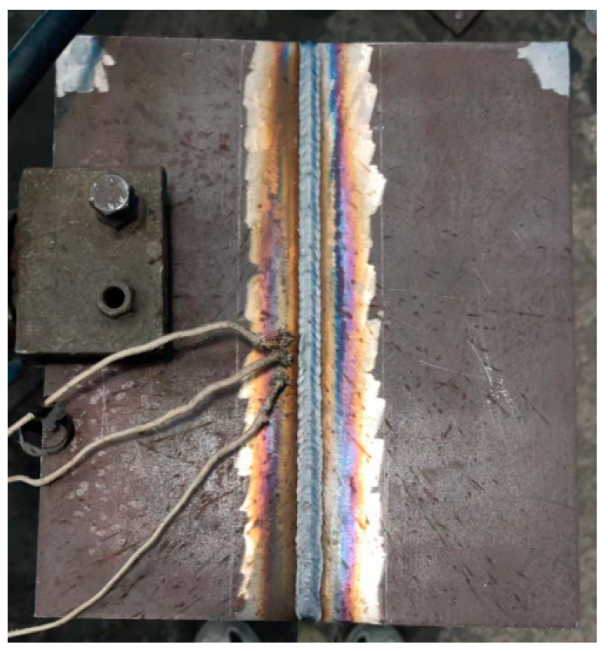
Before welding, the surface of the base metal was ground to remove the rust and oil from the surface. The NM450TP wear-resistant steel plates were welded by the mixed gas shielded welding method. The welding shielding gas was (80% Ar + 20% CO2), and the gas flow was 10 L/min. Table 3 shows the optimal welding process parameters. During the welding process, three K-type thermocouples were used to measure the welding thermal cycle during the second welding pass. The measurement point was located on the upper surface of the specimen. The distances between the measurement points and the weld groove were 3 mm, 5 mm, and 8 mm, respectively, as shown in Figure 3. The NM450TP wear-resistant steel plates were welded without any external restraints.
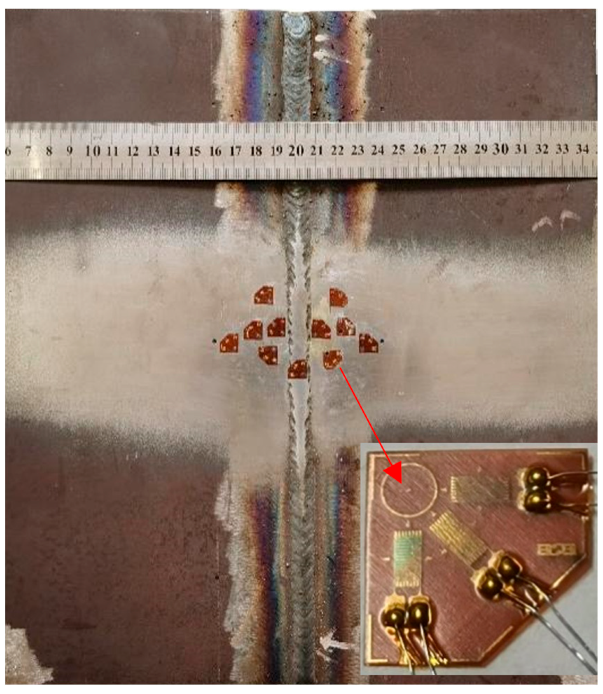
After the welding, the residual stresses were measured using the hole-drilling (HD) method. Figure 4 shows the positions of the residual stress measurements. The type of strain gage was BE120-2CA-K. The parameters of the strain gage were resistance of 120.2 ± 0.3 and gage factor of 2.23 ± 1%. As shown in Figure 3, there were three wire grids facing three directions. The angle of those three wire grids with the welding bead were 0°, 45° and 90°, respectively. Adopting elastic mechanics, the longitudinal stress and transverse stress could be calculated using the measured value of three strain gages [18,19].
After the residual stress measurement, the specimen was cut from the center of the welded joint and the micro-hardness of the joint was measured. The measurement points were distributed along a line L1 as shown in Figure 5.

3. Finite Element Analysis

In the numerical simulation of welding residual stress, possible phase transformations in the base metal were considered. During the heating process, when the temperature was lower than the austenite transformation start temperature (Ac1), the quenched martensite in the base metal transformed into the softening phase. When the heating temperature was above the Ac1 temperature, the softening phase began to transform into the austenite phase. When the temperature reached the austenite transformation end temperature (Ac3), the austenitization was completed. During the cooling process, the supercooled austenite in the heat-affected zone transformed into normalized martensite. In this study, the same material parameters were used for the quenched and normalized martensite phases due to their small difference in hardness values.
In this paper, the welding filler material was ER100S-G (austenitic stainless steel). Its thermophysical properties and mechanical properties parameters were from reference [20]. For austenitic stainless steel, the influence of work hardening and annealing softening effects on residual stress needed to be considered. In this study, the isotropic hardening model [21] was used to consider work hardening, and the step annealing model [22] was used to consider the annealing softening effect. Previous work [22] indicated that when the annealing temperature was 1000 °C, the calculated residual stresses at fusion zone and its vicinity agreed well with the experimental results. Thus, in this study, the annealing temperature of austenitic stainless steel was set to 1000 °C.

3.1. Finite Element Model

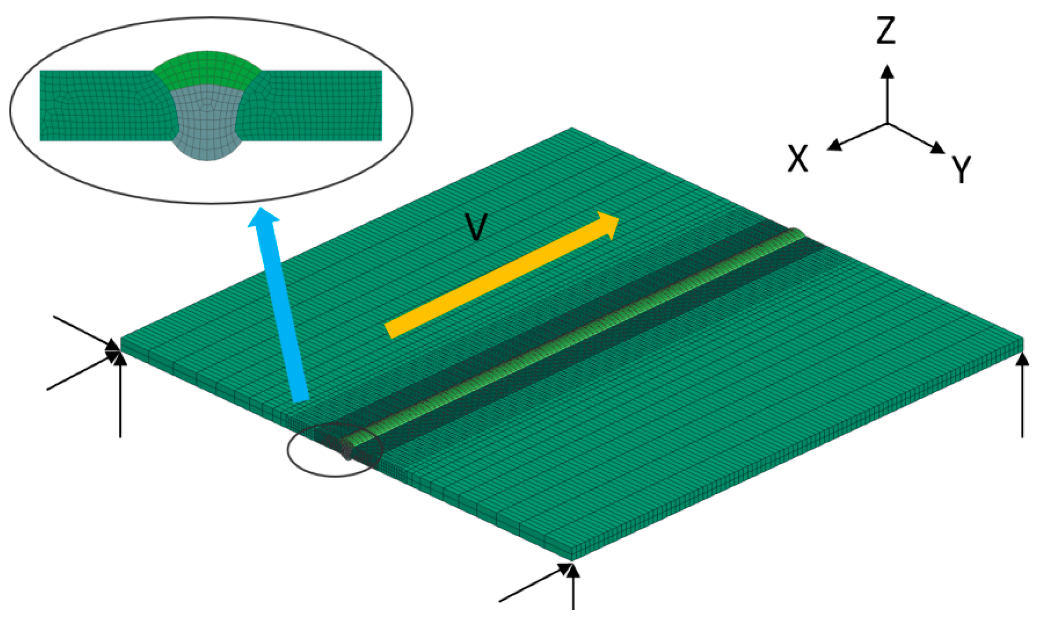
In this paper, a “thermal-metallurgical-mechanical” coupling computational approach was developed based on the software SYSWELD. In the numerical simulation, a finite element model, whose dimensions were consistent with the actual welded joint, was established, as shown in Figure 6. To balance the calculation efficiency and calculation accuracy, fine meshes were used in the weld and its vicinity, and sparse meshes were used in the area far from the weld. All elements were 8-node hexahedral elements, and the number of degrees of freedom for the finite elements in this paper was 24. The numbers of the elements and nodes were 60,000 and 69,794, respectively.

3.2. Temperature Field Calculation

When calculating the temperature field, the heat transfer equation shown in Formula (1) was used to describe the heat transfer process. The heat generated by the welding arc was defined as interior heat source.
ρ c T t = λ 2 T 2 x + λ 2 T 2 y + λ 2 T 2 z + q v
where ρ, c, T, t, λ and qv are density (g·mm−3), specific heat (J·g−1·°C−1), temperature (°C), time (s), heat transfer coefficient (W·mm−1·°C−1) and internal heat generation rate (W·mm−3), respectively.
In the temperature field calculation, the double ellipsoid heat source model proposed by Goldak [23] was used. The heat conduction process inside the welded joint was described by the nonlinear heat transfer equation [24] shown in Formulas (2) and (3).
q m x , y , z = 6 3 f f Q π π a f b c exp 3 x 2 a f 2 + y 2 b 2 + z 2 c 2
q r x , y , z = 6 3 f r Q π π a r b c exp 3 x 2 a r 2 + y 2 b 2 + z 2 c 2
where qm, qr, ff, fr are front heat flux of ellipsoidal source, rear heat flux of ellipsoidal source, front fractions, and rear fractions, respectively; af, ar, b, and c are the parameters of the double ellipsoid heat source, which are 5, 10, 8, and 5, respectively.
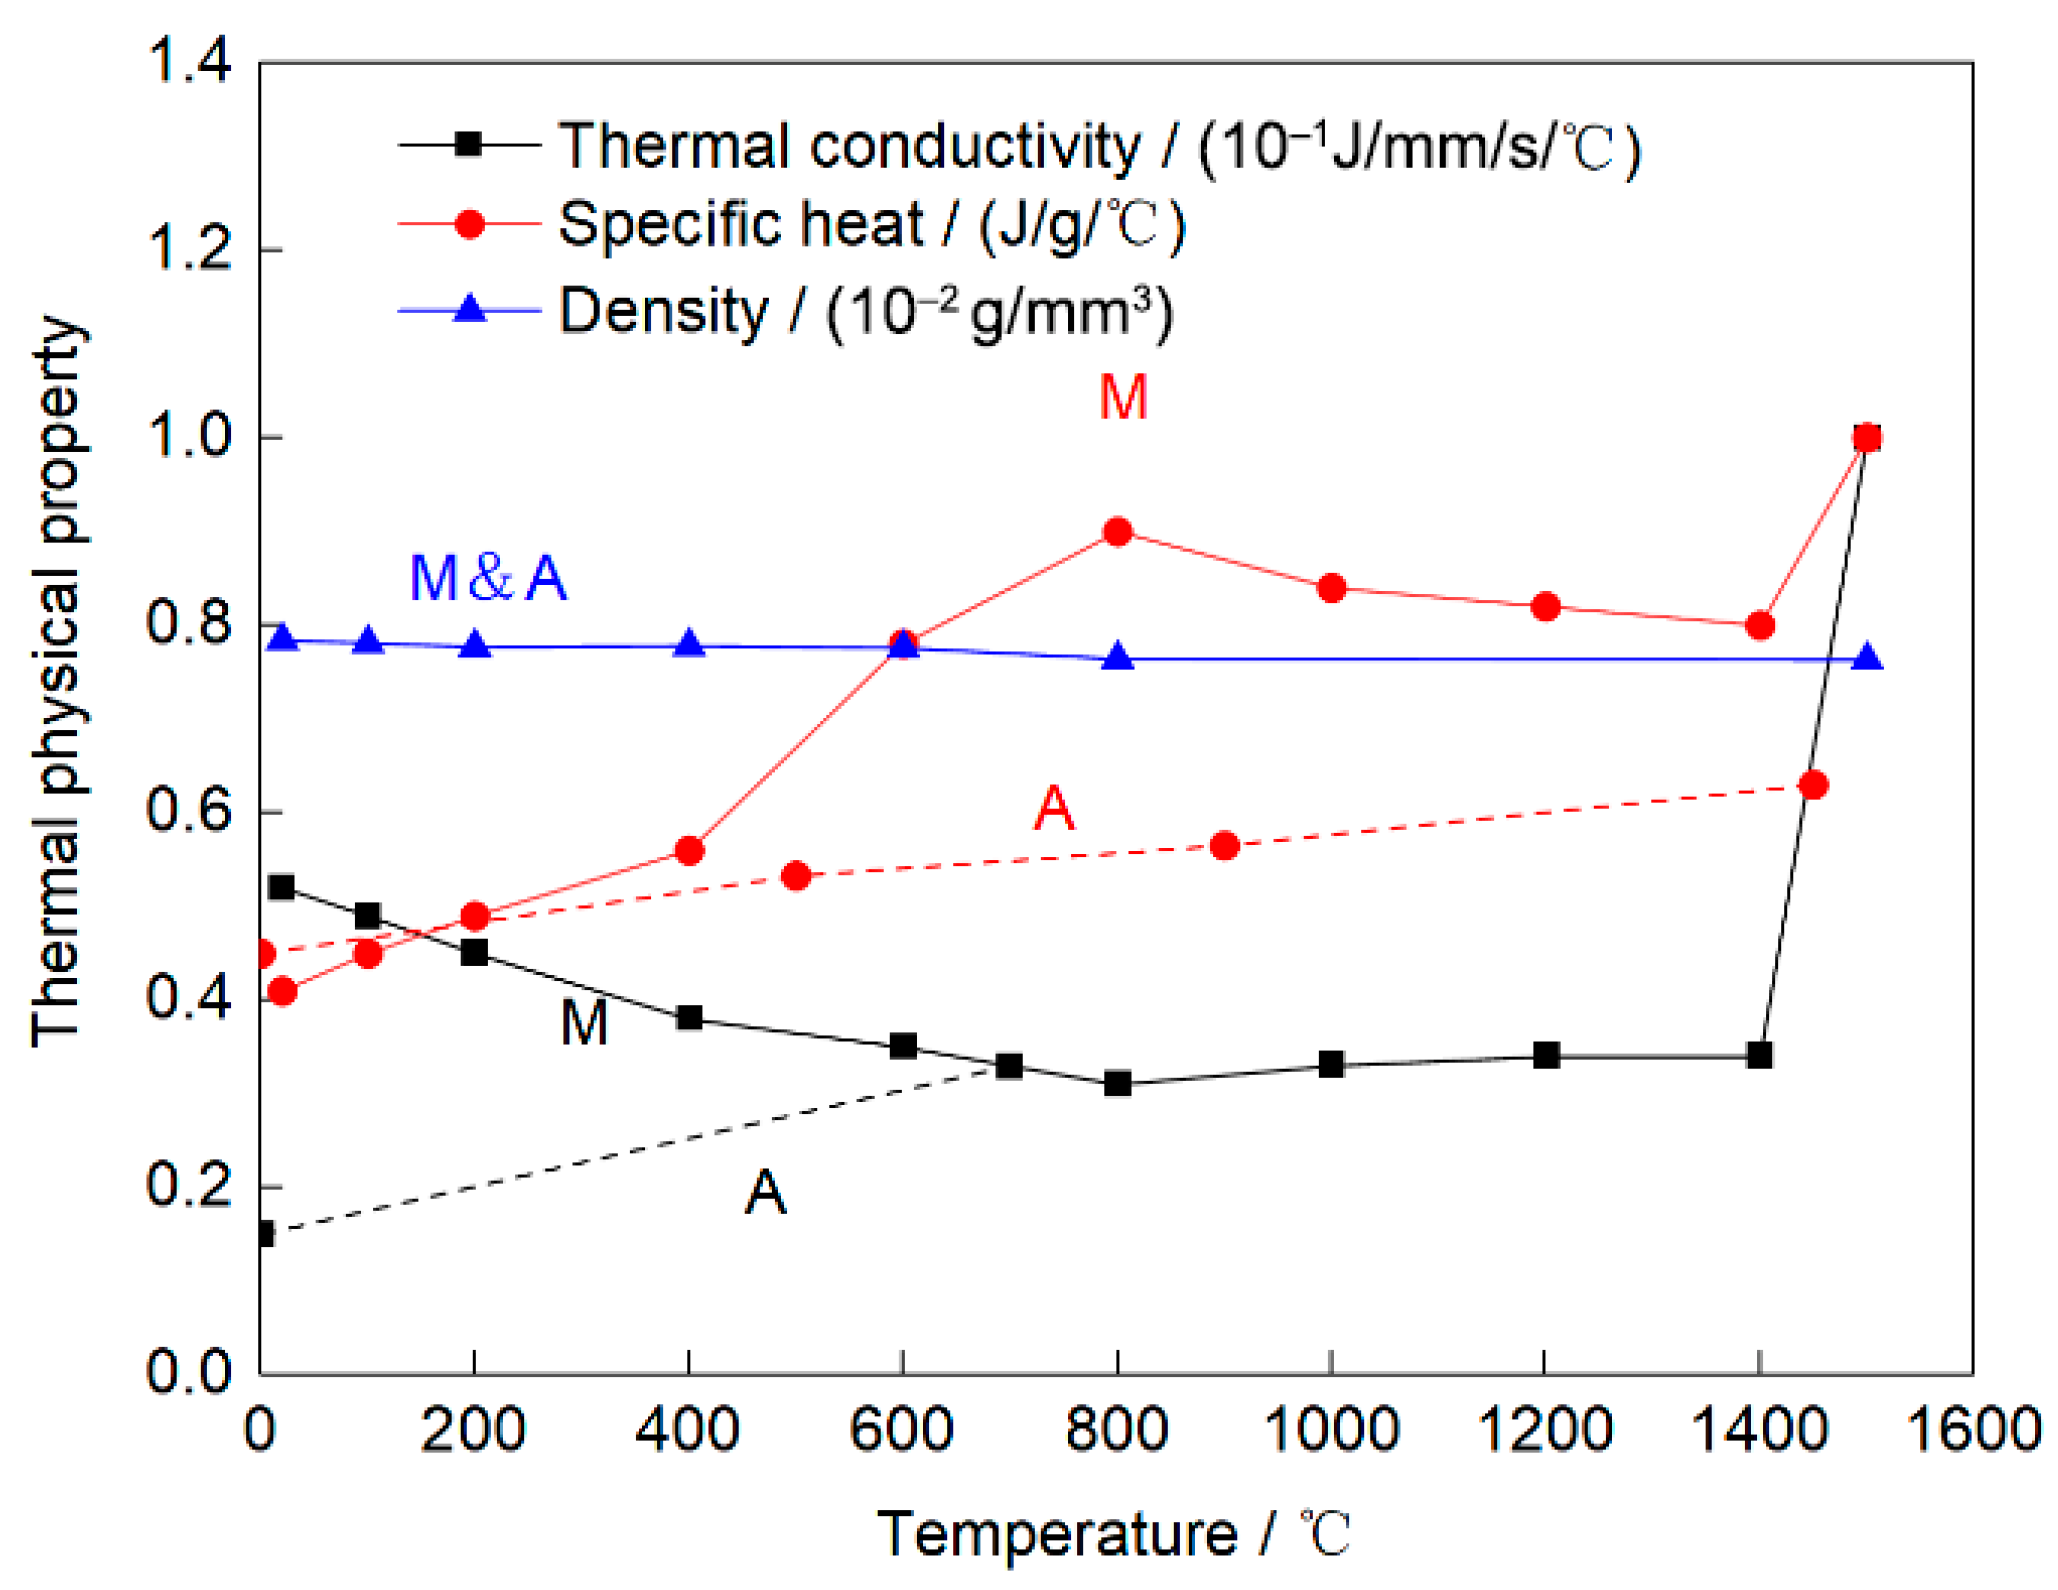
The Newton cooling equation [25] was used to describe the convective heat exchange between the joint and the environment. The Stefan–Boltzmann law was used to describe the radiation heat dissipation of the joint. The initial temperature of the joint and the ambient temperature was set to be 30 °C. The welding parameters used in the simulation were exactly the same as those used in the experiment. Figure 7 shows the thermophysical properties of the martensite phase and austenite phase. These parameters were calculated by the JMatPro software according to the chemical composition of NM450TP wear-resistant steel. Among them, the thermophysical properties of the softening phase was the same as those of martensite [26,27].

3.3. Phase Composition Calculation

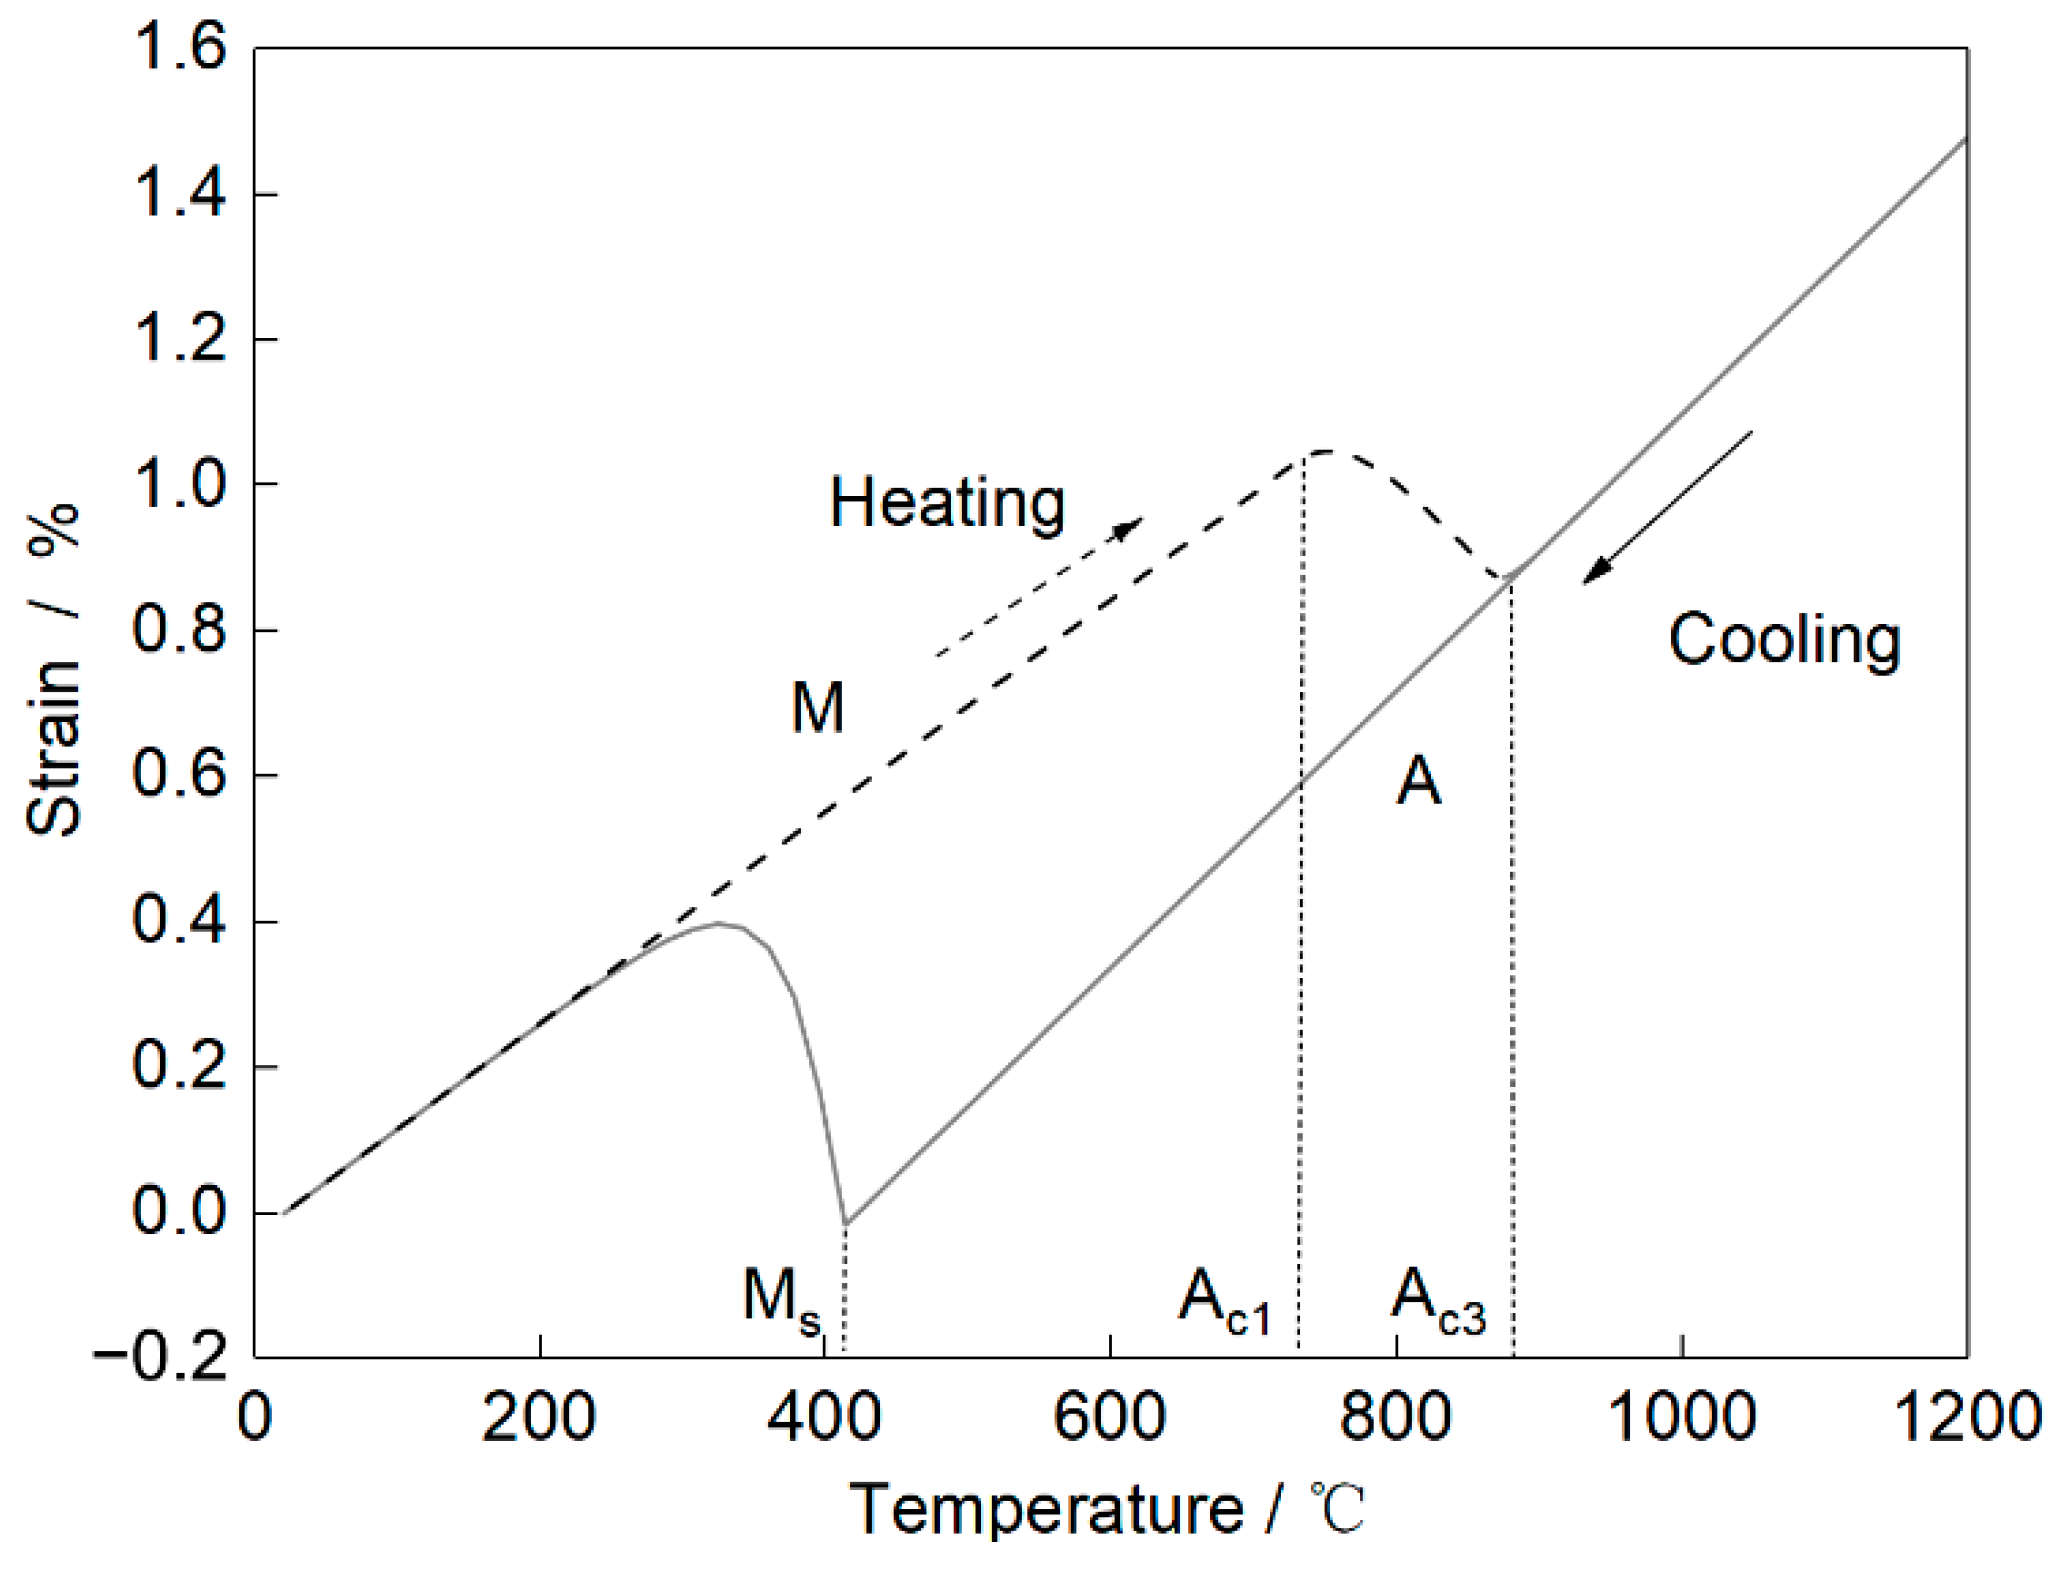
During the heating and cooling process, the NM450TP wear-resistant steel underwent austenitic–martensitic transformation. Figure 8 shows the thermal expansion test results of the NM450TP wear-resistant steel. It can be seen from the figure that the Ac1 temperature, Ac3 temperature, and martensitic transformation start temperature (Ms) were 720 °C, 850 °C, and 525 °C, respectively. The thermal expansion coefficients of martensite and austenite could be determined from the temperature–strain curves in Figure 8. In the numerical simulation, it was assumed that the thermal expansion coefficient of the softening phase was the same as that of the martensite. The Johnson–Mehl–Avrami relation [28] and the Koisten–Marburger relation [29] were used to describe the austenite transformation process and the martensitic transformation process, respectively.

3.4. Softening Model

Since the NM450TP wear-resistant steel was quenched martensite, during welding, the base metal adjacent to the heat-affected zone would soften. The yield strength and hardness of the material decreased. The softening effect influenced the residual stress distribution in the joint, which should be considered in the numerical simulation.
In this study, a model including softening coefficient and maximum softening degree was established to consider the softening phenomenon of NM450TP wear-resistant steel during the welding process. According to the calculation results of the peak temperature distribution and the measurement results of the hardness distribution, the corresponding relationship between the peak temperature and the softening coefficient was determined. Since the base metal was quenched martensite, the position corresponding to Ac1 had the highest softening degree. The lower the peak temperature, the smaller the softening degree. From the hardness measurement and the temperature field results, the hardness was hardly affected when the peak temperature was below 230 °C. Thus, the softening temperature range was determined as 230 °C to 720 °C (Ac1). To quantitatively evaluate the softening coefficient, the softening coefficient was set to be 0 when the peak temperature was 230 °C and was set to be 1 when the peak temperature was 720 °C. The relationship between the peak temperature and the softening coefficient ft was defined as follows:
f t = T t T L T H T L × 100 %
where TH is 720 °C, TL is 230 °C, Tt is the peak temperature at any position in the softening zone, TLTtTH.
The maximum softening degree D was determined according to the difference between the lowest hardness in the softening zone and the average hardness of the base metal and was defined as follows:
D = H V B M H V m i n H V B M × 100 %
where HVBM is the average hardness of the base metal, and HVmin is the minimum hardness in the softening zone.
Since the yield strength of the softening zone was not measured in this study, the maximum softening degree of hardness was equivalent to the maximum softening degree of yield strength. According to the hardness test results, when the peak temperature was 720 °C, the hardness value and the corresponding yield strength at this position were the lowest. The yield strength σf of the base metal after cooling to room temperature at this position could be calculated from Formula (3).
σ f = σ s × 1 D
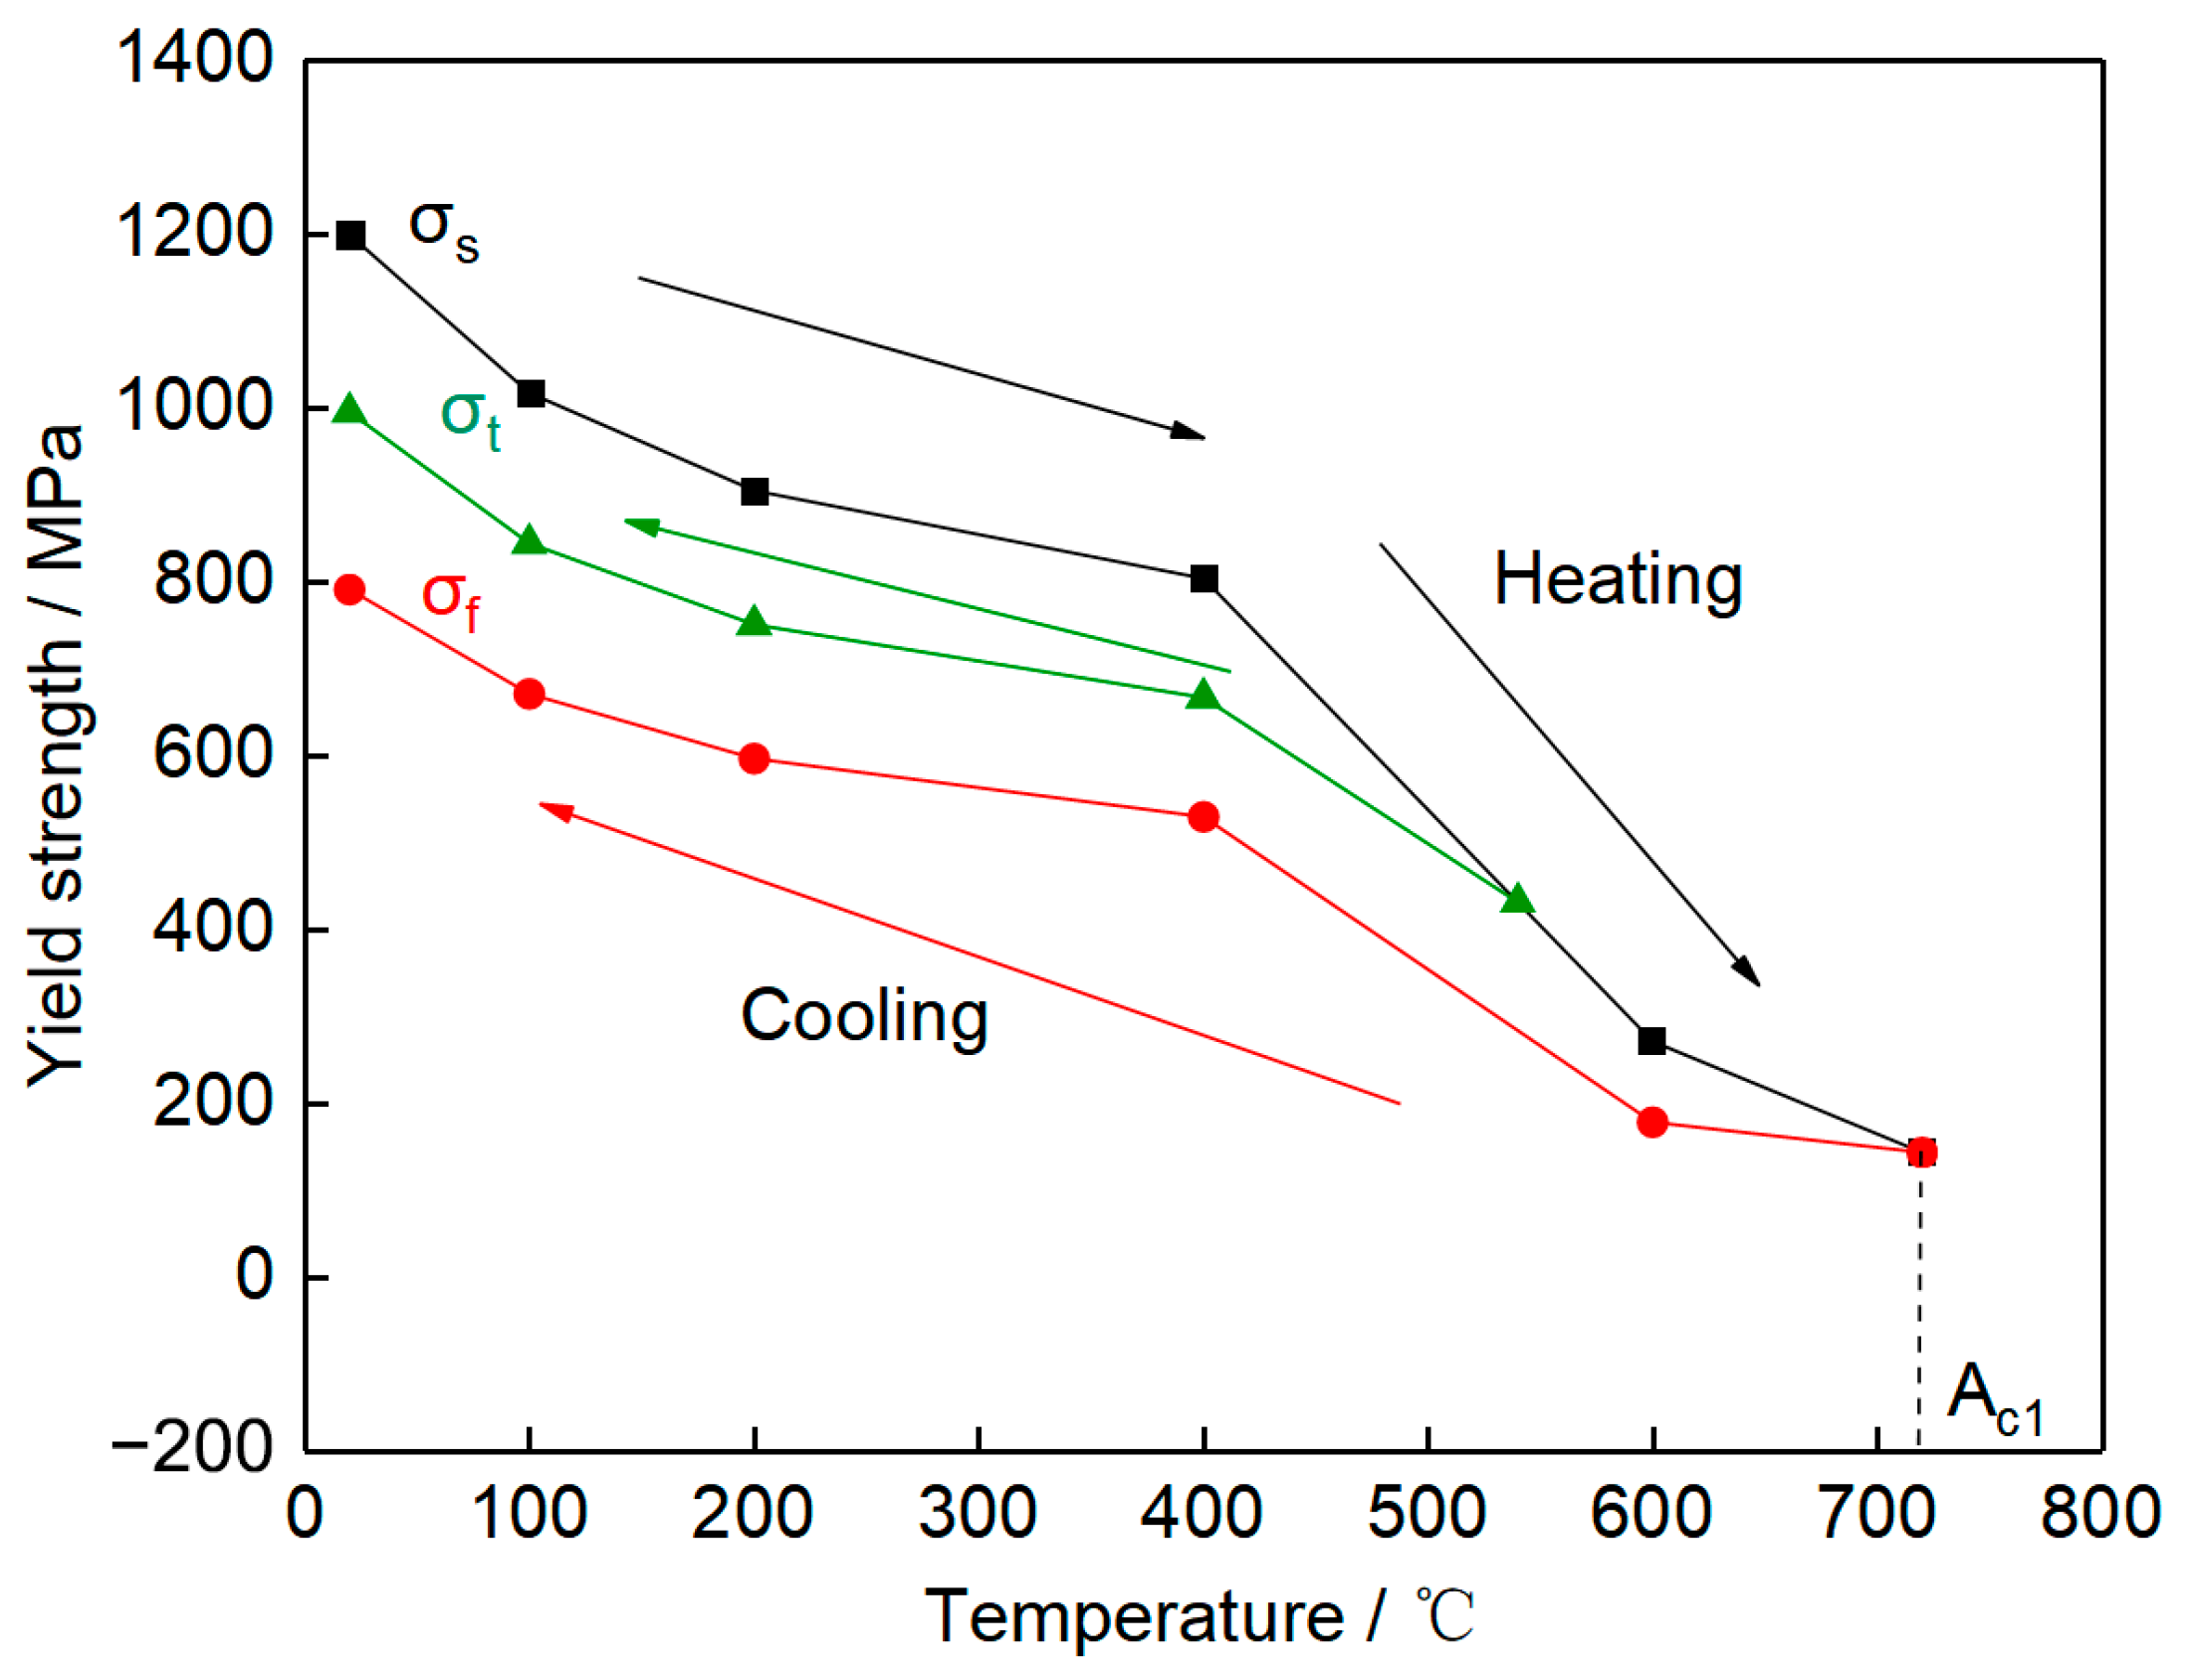
When the peak temperature Tt experienced by the base metal was between TH and TL, the yield strength σt of each temperature below Tt during the cooling process was calculated by the softening coefficient ft. Figure 9 shows the schematic diagram of the softening model established in this study.
σ t = σ f × f t + σ s × 1 f t

3.5. Stress Calculation

The total strain of the material consisted of elastic strain, plastic strain, thermal strain, phase transformation strain, and creep strain. However, considering the short high-temperature residence time during the welding process, the creep strain was not obvious. Thus, the creep strain could be ignored. The elastic and plastic strains were calculated using Hooke’s law and the Von Mises yield criterion, respectively. Thermal strain was reflected by the thermal expansion coefficient. The phase transformation strain was described using the Leblond model [30]. The softening effect was considered using the model proposed in this study.
Due to the high strength of NM450TP wear-resistant steel, the effect of work hardening was not obvious. Thus, it was defined as an ideal elastic–plastic model [31,32] in the material model, and the effect of work hardening was not considered. The mechanical properties of NM450TP wear-resistant steel are shown in Figure 10. In Figure 10, the yield strengths at room temperature, 200 °C, 400 °C, 600 °C, and 800 °C were obtained by the tensile tests, and other material performance parameters were calculated by the JMatPro software through material composition. The initial state of NM450TP wear-resistant steel was the quenched martensite, and its yield strength decreased continuously during the welding heating process. Austenitization occurred in the interval from the Ac1 temperature to the Ac3 temperature. When the temperature was higher than Ac3, the martensite was completely transformed into the austenite phase, so the yield strength of the material was very low. During the cooling process, the austenite temperature decreased continuously, and the supercooled austenite phase formed when the temperature was lower, leading to the continuous increase of the yield strength. When the temperature was lower than Ms, the normalized martensite phase was formed due to the martensitic transformation, and the yield strength increased rapidly until it reached the yield strength of the initial phase.
No external constraints were used in the experiment, so only three nodes and six degrees of freedom were used in the finite element model to prevent rigid body displacement. Figure 6 shows the mechanical boundary conditions.

3.6. Calculation Case

The main purpose of this study was to clarify the influence of solid-state phase transformation and softening effects on the welding residual stress of NM450TP wear-resistant steel joints, so a total of three calculation cases were designed, as shown in Table 4. The first case did not consider the solid-state phase transition and softening effect, the second case only considered the solid-state phase transition, and the third case considered both the solid-state phase transition and the softening effect.

4. Results and Discussion

4.1. Microhardness Distribution

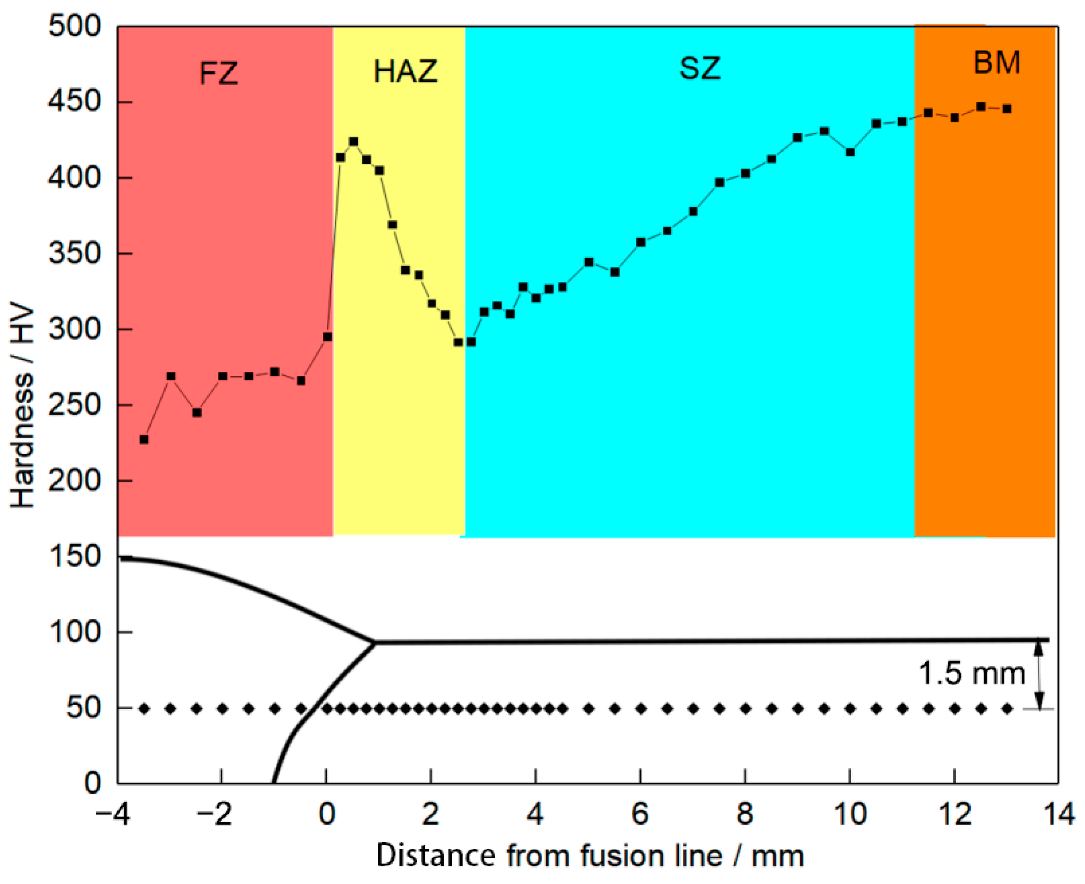
Figure 11 shows the microhardness distribution of the welded joint along L1. As can be seen from this figure, there was a wider softening zone (SZ) on the base metal side adjacent to the heat-affected zone. Since the base metal was quenched martensite, temper softening occurred in this area under heating of welding thermal cycling. The softening phenomenon near the heat-affected zone was severe, and its hardness value was 283 HV. The degree of softening decreased with increasing distance from the heat-affected zone. The maximum softening degree D calculated by the Formula (2) was about 40%.
In the weld area, because the weld metal was austenitic stainless steel as-cast structure, its microhardness was low (225 HV). In the area where the peak temperature of the heat-affected zone was above Ac3, the base metal was completely austenitized during the heating process, and the normalized martensite structure with higher hardness was formed during the cooling process. The microhardness was above 400 HV, and the maximum hardness of the coarse-grained region was 426 HV. In the partial phase transformation region, the peak temperature was between Ac3 and Ac1. Under the heating of welding thermal cycles, only a part of the original structure transformed into austenite, and a mixed structure with uneven grain size was formed after cooling. Thus, the hardness decreased significantly in this area. Meanwhile, the figure indicated that the hardness difference between the normalized martensite structure and the quenched martensite structure was very small. It could be seen from the microhardness distribution of welded joints that the solid-state transformation and softening effects of NM450TP wear-resistant steel were significant. To improve the calculation accuracy of the residual stress of NM450TP wear-resistant steel welded joints, it was necessary to consider the solid-state transformation and the softening effect of the base metal in the numerical simulation.

4.2. Temperature Field

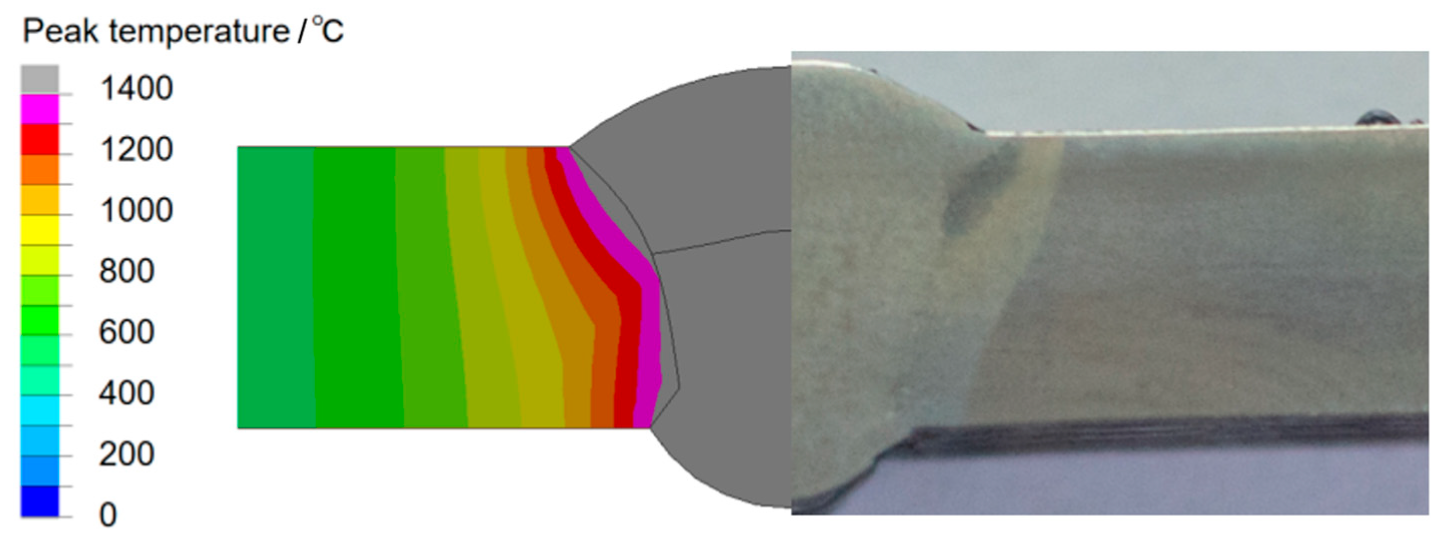
Figure 12 shows the computational and experimental fusion zones. When the temperature of material point was over 1400 °C, the material was regard as fusion zone. From this figure, the computational fusion zone agreed well with experimental fusion zone.
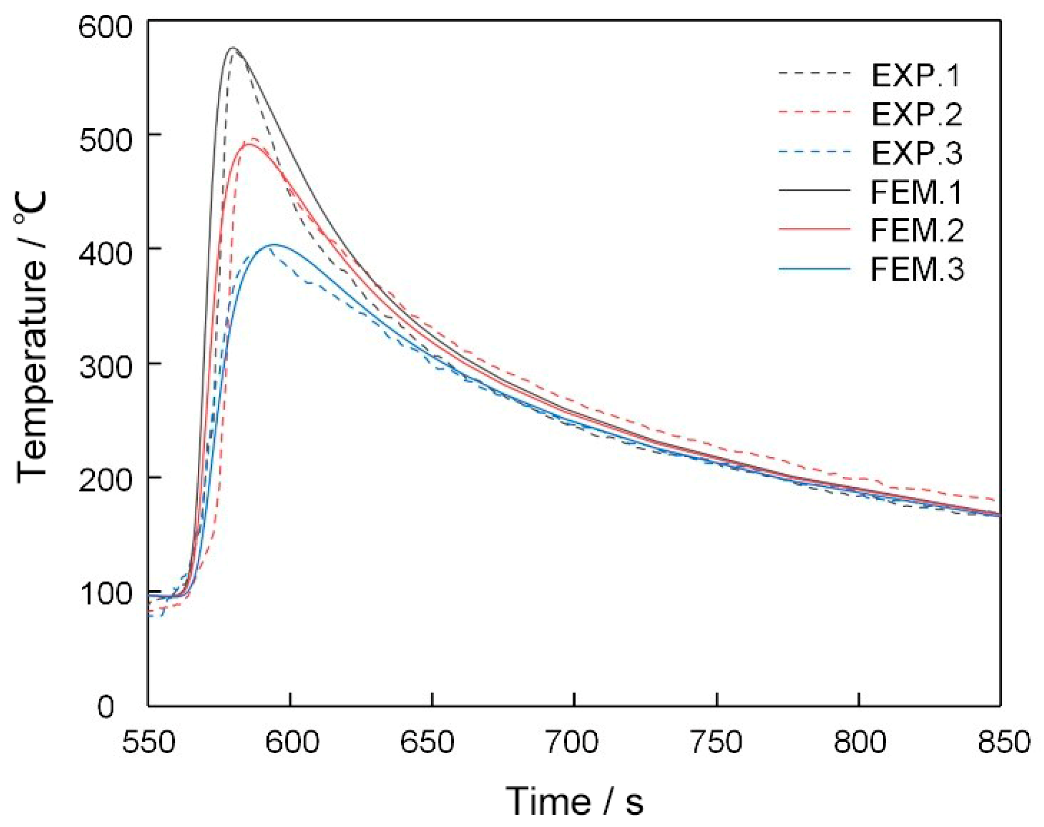
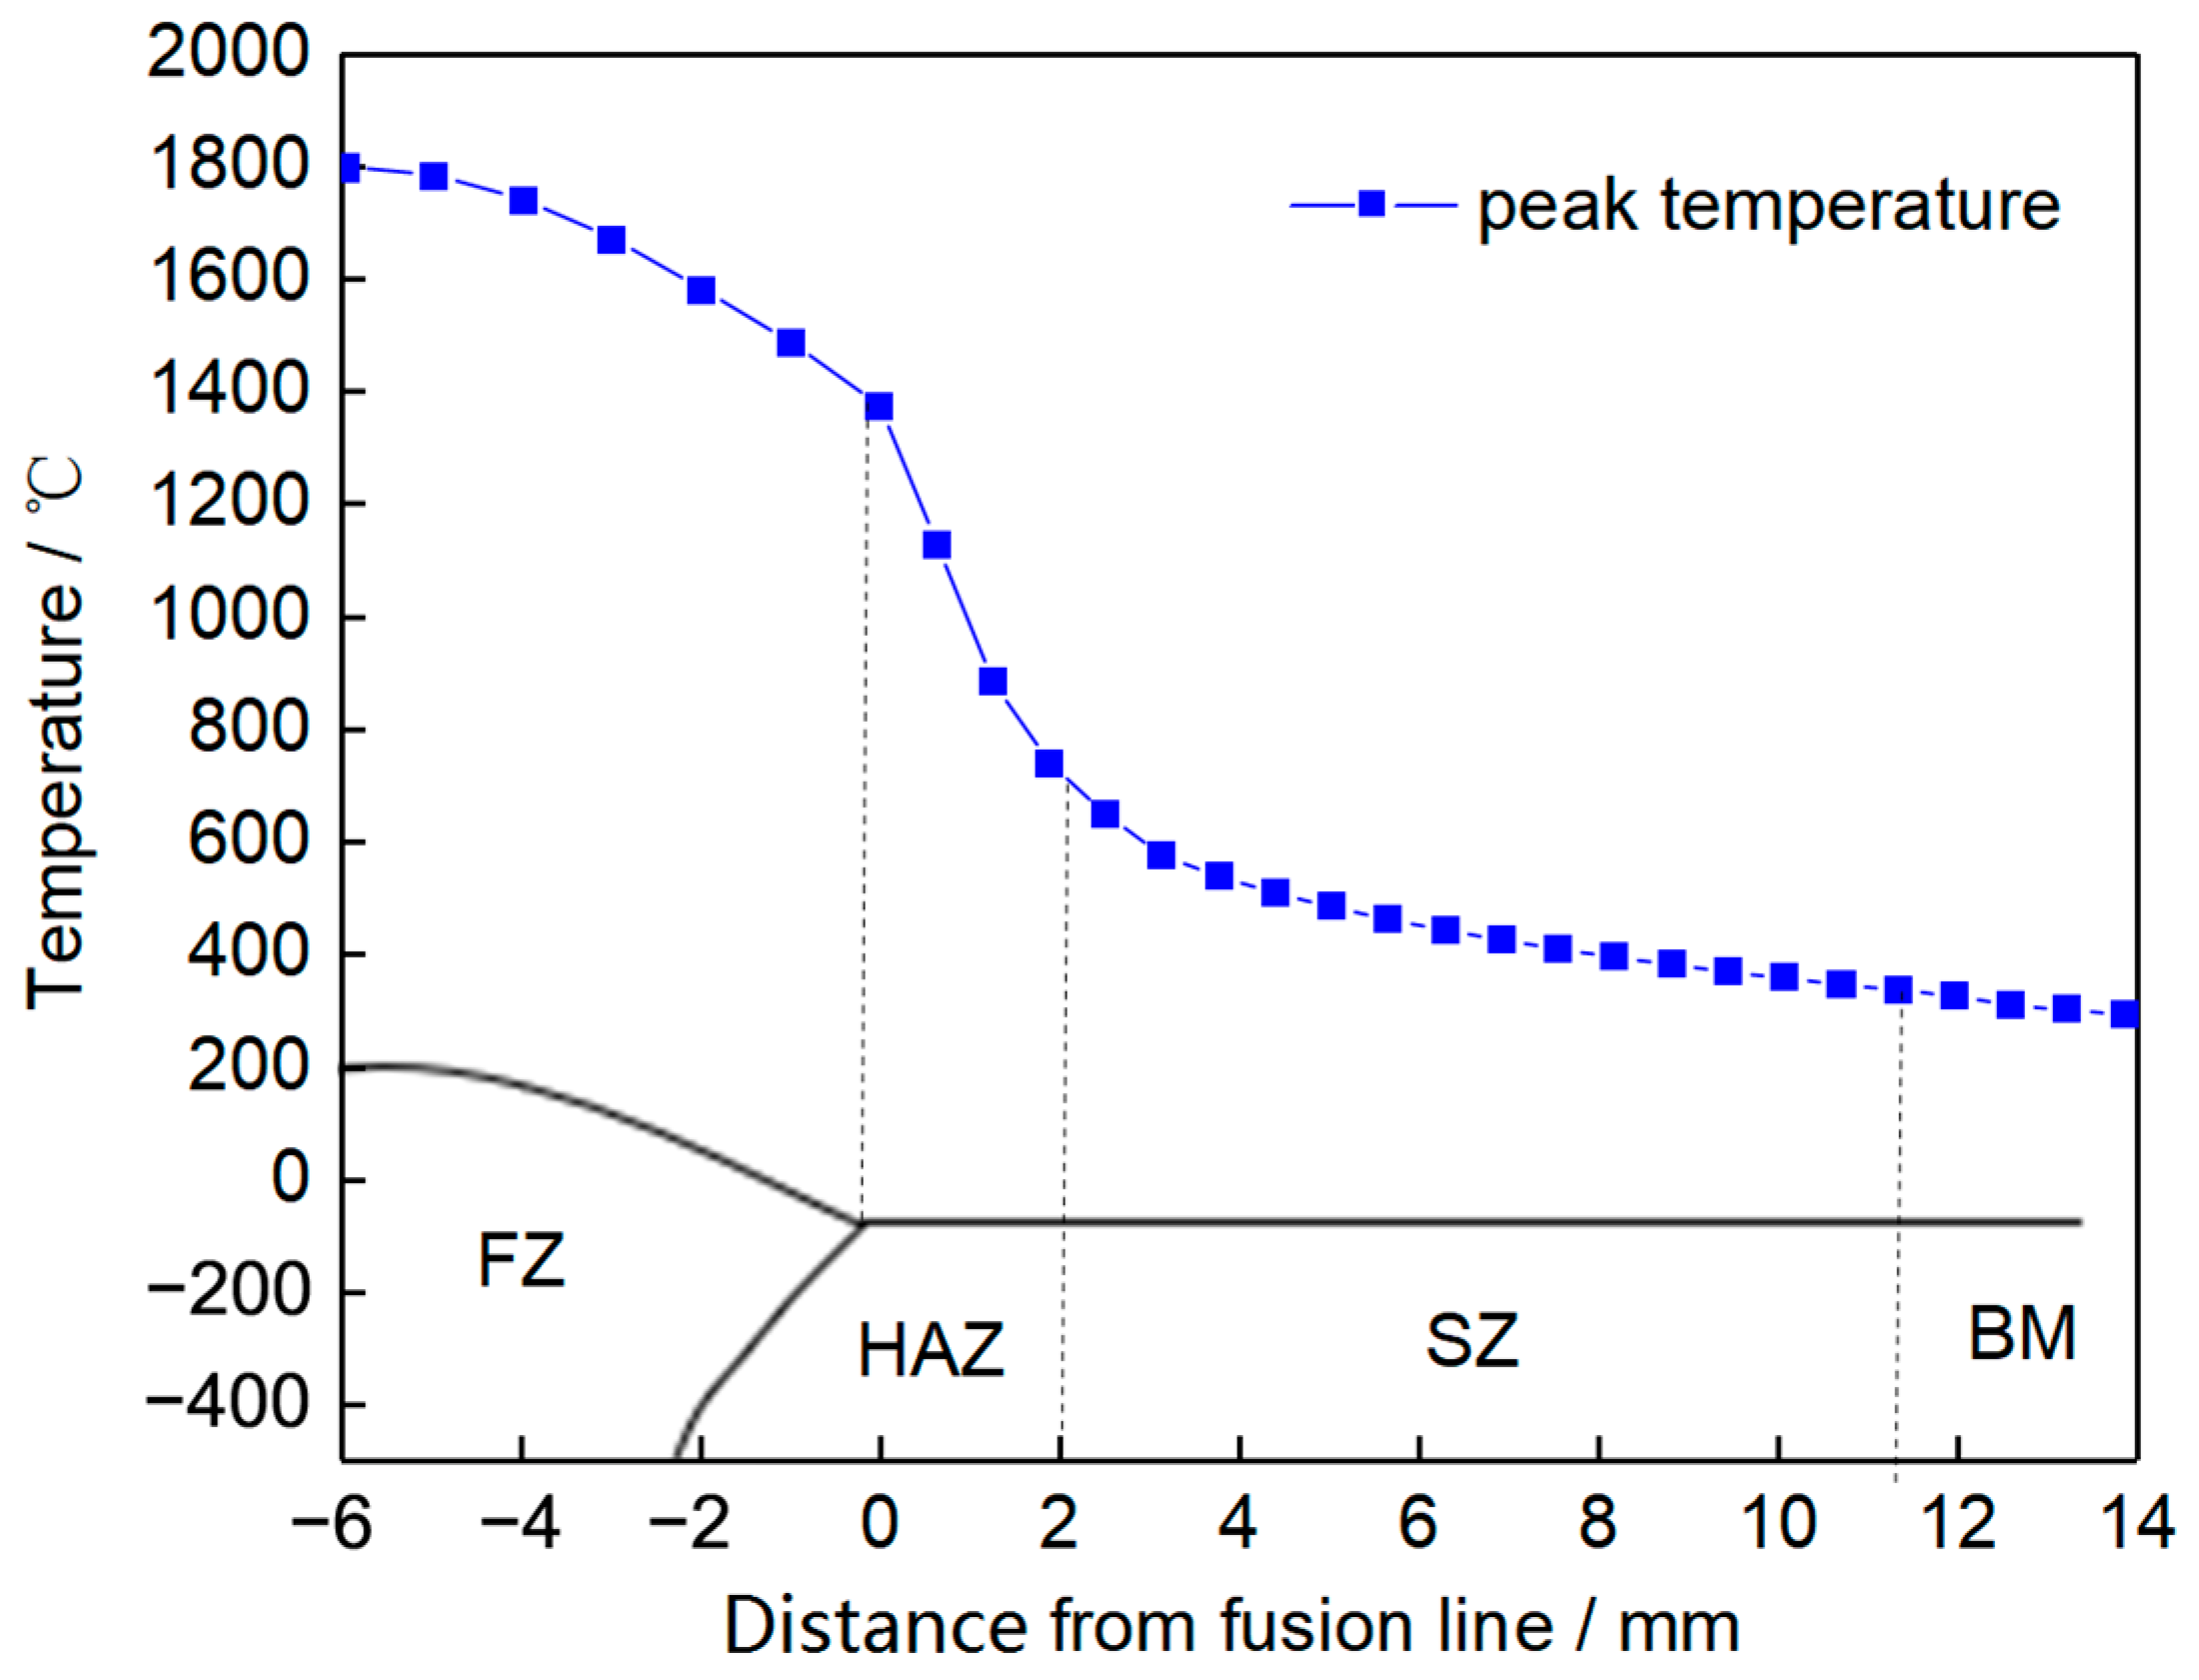
Thermal cycles at 3 mm, 5 mm, and 8 mm from the weld toe were measured. Figure 13 shows the calculated results and the experimental results. It could be seen from this figure that the peak temperature obtained by the experimental measurement was very close to the numerical simulation result, and the difference between the two was less than 10 °C. The curve of the heating part indicated that within 0 s to 25 s, there was a specific difference between the experimental value and the measured value in the heating speed. In the cooling part, when the time was 60 s, the difference between the experimental value and the measured value was the largest. The peak temperature distribution of the central section along L1 was extracted from the numerical simulation temperature field results and compared with the microhardness distribution of the welded joint along L1, as shown in Figure 14. It indicated that the highest peak temperature in the softening zone was 720 °C (Ac1), and the lowest peak temperature in the softening zone was 230 °C.

4.3. Residual Stress

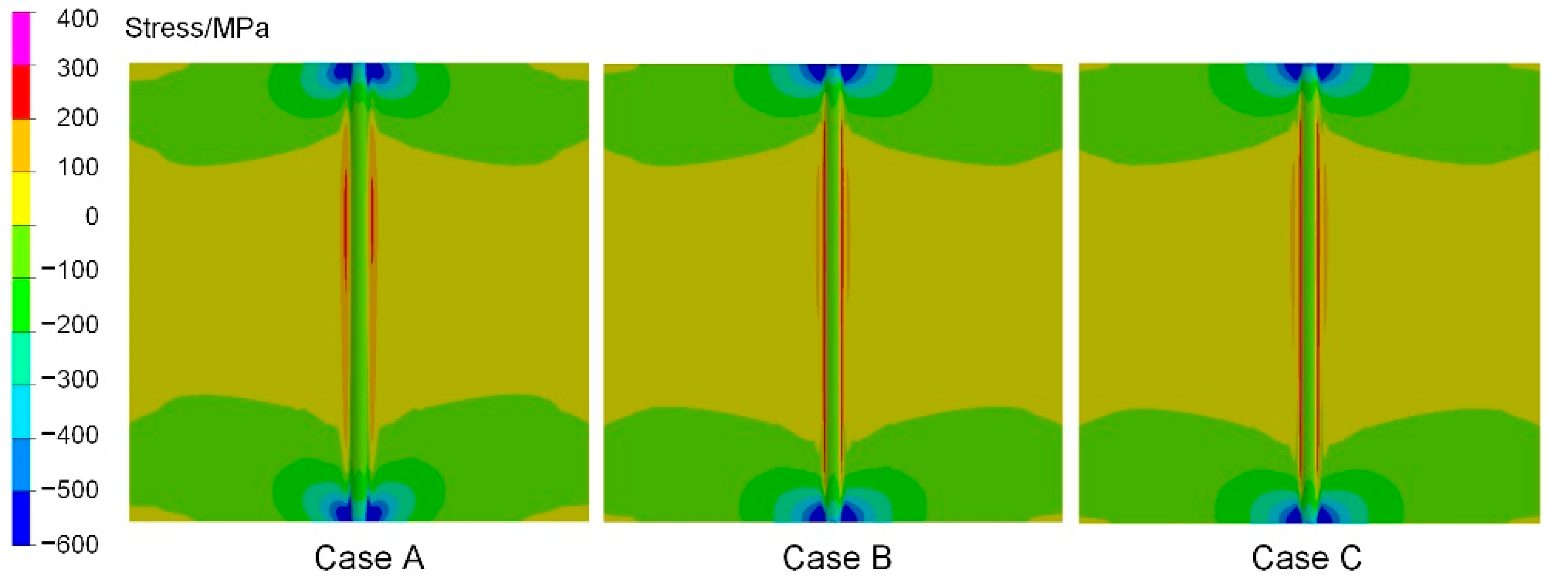
Figure 15 shows the longitudinal residual stress distribution on the upper surface of the NM450TP wear-resistant steel welded joint. It could be seen that the longitudinal residual stress in the three calculation cases was symmetrically distributed. Due to the geometric end effect [33], the longitudinal stress distribution at both ends of the joint was complicated. The distribution of longitudinal residual stress was nearly the same in the regions other than the two ends and their vicinity. The longitudinal residual stress distribution in Case B was different from that in Case A. The peak tensile stress on the upper surface of Case B was lower than that of Case A. In the central area of the upper surface, the tensile stress zone in Case B was wider than that in Case A. In addition, the compressive stress zone on the upper surface of Case B was different from that of Case A. From the comparison of the two, it could be seen that the solid-state phase transformation had a significant impact on the magnitude and distribution of the longitudinal residual stress calculation results. Compared with Case B, although Case C considered the softening effect, the longitudinal stress distribution on the upper surface had no significant change.
Figure 16 shows the longitudinal residual stress distribution in the central section of the NM450TP wear-resistant steel welded joint. In the heat-affected zone of Case A, the peak longitudinal tensile residual stress was close to the room-temperature yield strength of the NM450TP wear-resistant steel. As the distance from the weld increased, the residual stress gradually decreased and turned to compressive stress. Compared with Case A, the tensile residual stress in the heat-affected zone of Case B decreased significantly. This was due to the martensitic transformation of the heat-affected zone structure during the cooling process. The volume expansion reduced the tensile stress at this location so that the high longitudinal residual stress zone was significantly reduced. In the central section of Case B, the peak tensile residual stress appeared in the base metal adjacent to the heat-affected zone. Compared with Case B, the magnitude and distribution of longitudinal tensile residual stress in the heat-affected zone of Case C did not change significantly, while the peak value of longitudinal tensile residual stress adjacent to the heat-affected zone was significantly reduced.
Figure 17 shows the comparison between the calculated and experimental results of the longitudinal residual stress distribution on the upper surface. In the calculation results, the longitudinal tensile residual stress was mainly distributed in the zone about 10 mm from the weld center. In Case A, a high tensile stress (1170 MPa) formed in the heat-affected zone. Since Case B considered the solid-state phase transformation, the peak value of longitudinal residual stress in the heat-affected zone and the high-stress region decreased slightly compared with Case A. Case C considered both solid-state phase transformation and softening effect; the peak value of longitudinal residual stress in the heat-affected zone and the range of high-stress region decreased significantly, and the peak value of tensile stress was about 870 MPa. From the comparison between the calculation and experimental results of longitudinal residual stress distribution, it could be seen that the calculation results of Case C are in good agreement with the experimental measurement results. Therefore, for NM450TP wear-resistant steel, to obtain higher-precision residual stress calculation results, it was necessary to consider both solid-state phase transformation and softening effects.
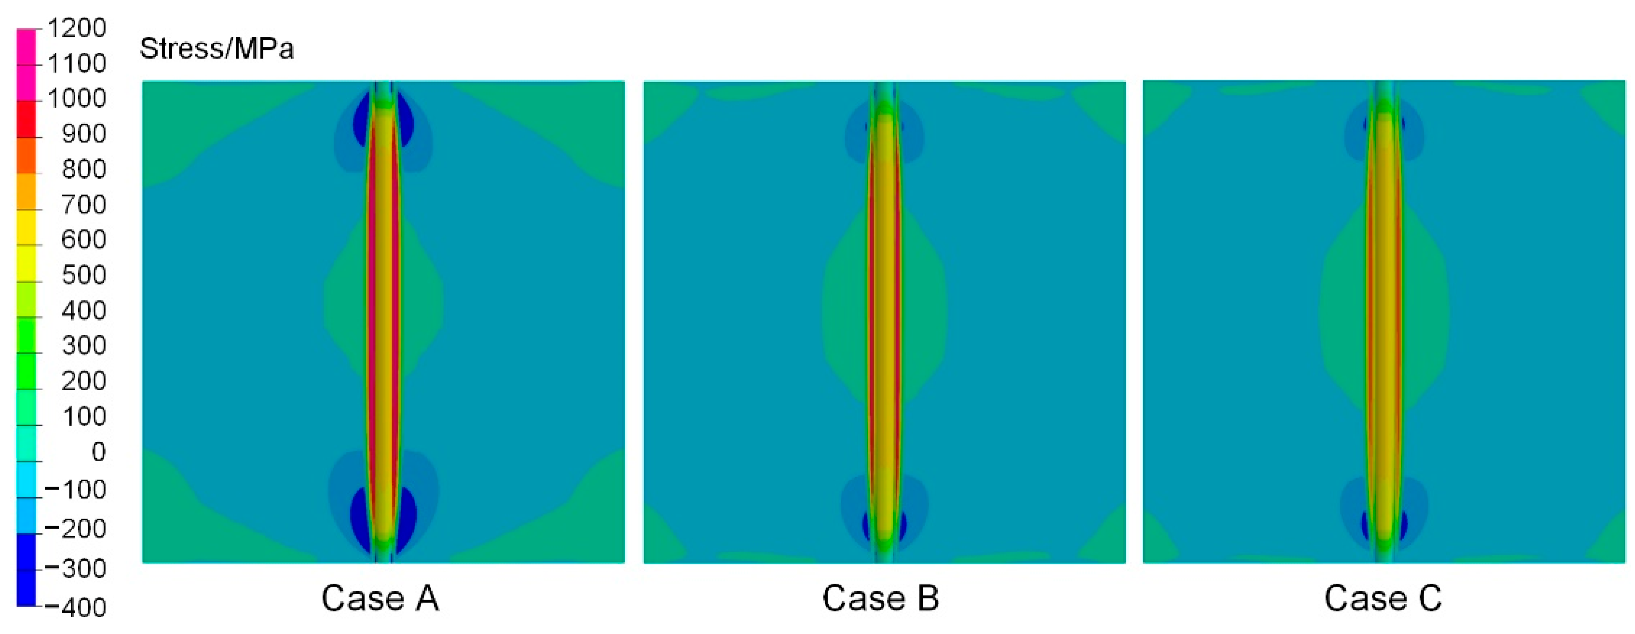
Figure 18 shows the transverse residual stress distribution on the upper surface of the NM450TP wear-resistant steel welded joint. The compressive residual stress zone in Case A and Case B were different with each other. From the comparison, it can be seen that the solid-state phase transformation influenced the calculation results of the transverse residual stress. Compared with Case B, although Case C considered the softening effect, there was no significant change in the transverse stress distribution on the upper surface of both cases.
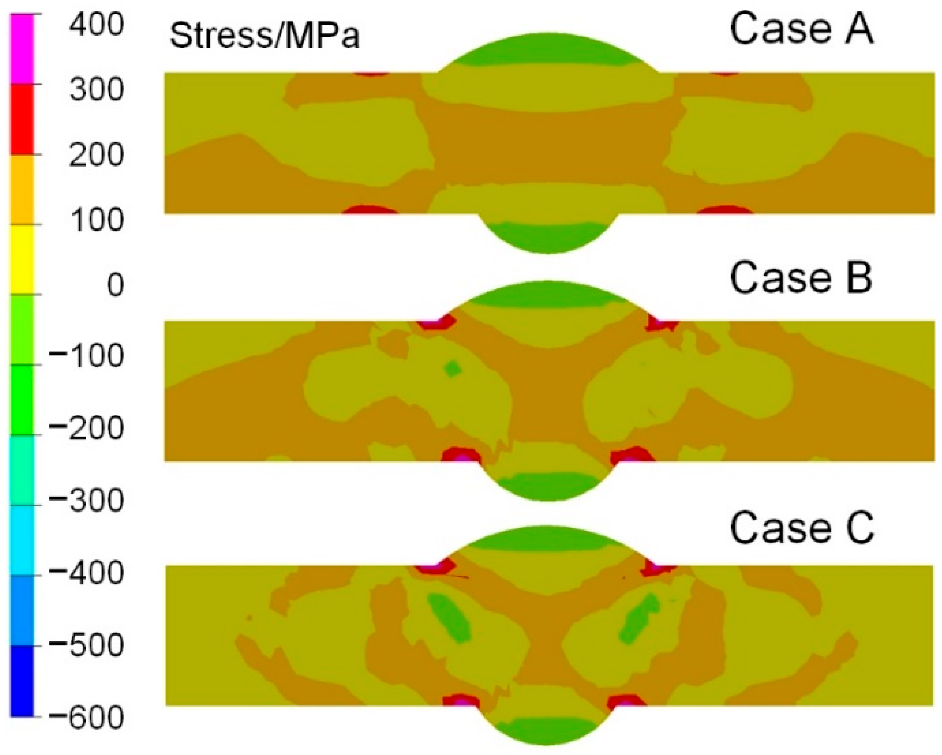
Figure 19 shows the transverse residual stress distribution at the central section of the NM450TP wear-resistant steel welded joint. It could be seen that the calculation results in the three calculation cases were significantly different. The most obvious difference was the location of high transverse tensile residual stress. In Case A, the high transverse tensile stress was located in the heat-affected zone. In Case B and Case C, the high tensile stress was distributed at the weld toes, which was more consistent with the actual situation. In all three cases, there was large compressive stress on the upper surface of the weld filler metal. However, after considering the solid-state phase transformation, a high compressive stress region also appeared inside the joint in Case B. When the solid-state phase transformation and softening effects were considered at the same time, two high compressive stress regions appeared at the interface between the weld and the base metal on both sides. In addition, since the restraint of the weldment in the transverse direction was smaller than that in the longitudinal direction, the transverse residual stress value of the joint was significantly lower than the longitudinal residual stress value.
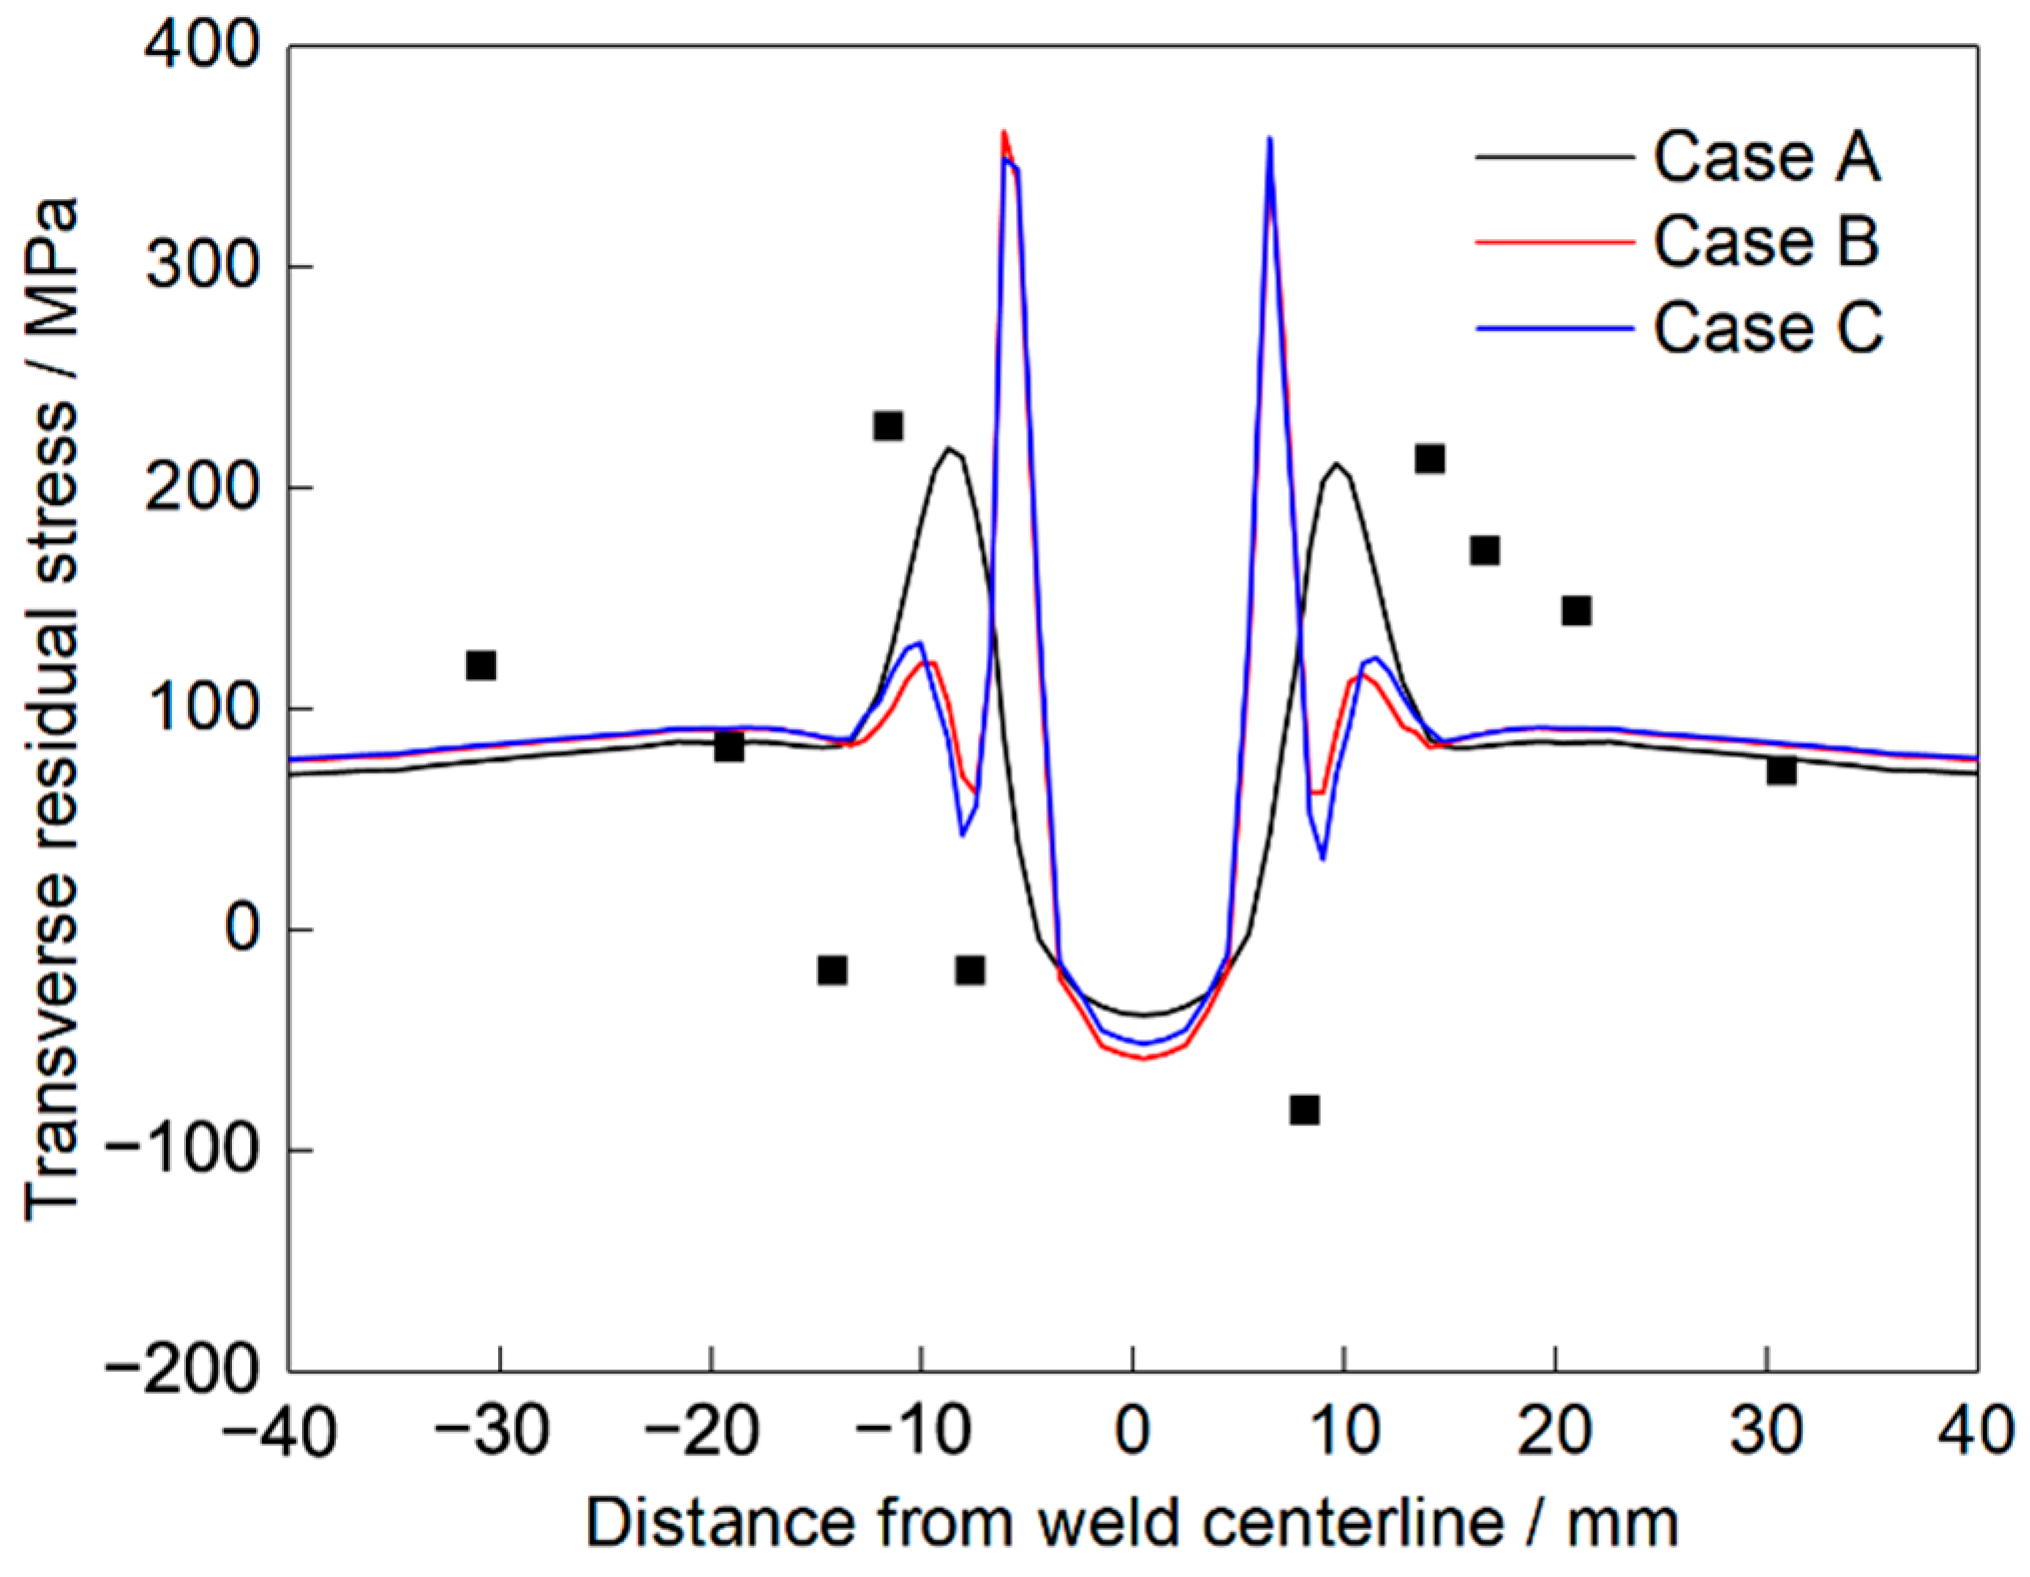
Figure 20 shows the calculated and experimental results of the transverse residual stress on the upper surface of the welded joint. It could be seen from the calculation results that the transverse residual stresses at the weld center were close to each other. However, in the rest of the weld, Case A was quite different from Case B and Case C. After considering the solid-state phase transformation, the peak transverse residual stress (370 MPa) in Case B increased significantly. The transverse residual stress distributions in Case B and Case C were almost the same. It could be seen from the figure that there was a specific deviation between the calculated results and the measured results. This was mainly due to the large stress gradient in the heat-affected zone. During the stress measurement process, the experimental results could not accurately reflect the actual situation due to the limitations of the hole-drilling method and the measurement error. In future research, stress measurement methods with higher precision will be adopted to improve the accuracy of stress-testing.

5. Conclusions

(1)
The average microhardness of the base metal of NM450TP wear-resistant steel was about 450 HV. The maximum microhardness of the heat-affected zone in the joint was 426 HV. The minimum microhardness of the softening zone was about 290 HV, and the width of the softening zone was about 9 mm. The welding thermal cycle had a more significant influence on the hardness of the softening zone than that of the heat-affected zone.
(2)
The solid-state phase transformation had a significant effect on the calculation results of longitudinal residual stress. When considering the solid-state phase transformation, the longitudinal residual stress in the heat-affected zone decreased significantly, and the longitudinal residual stress peak was transferred from the heat-affected zone to the base metal adjacent to the heat-affected zone. The solid-state phase transformation had a certain influence on the calculation results of the transverse residual stress. When considering the solid-state phase transition, the calculated peak value of the transverse residual stress increased.
(3)
The softening effect had little effect on the distribution of longitudinal residual stress but influenced the peak longitudinal residual stress in the softening zone. The peak stress on the base metal adjacent to the heat-affected zone was 870 MPa, which decreased by 300 MPa compared to the calculated result without considering the softening effect. The softening effect had little effect on the distribution shape and peak value of the transverse residual stress. The peak value of the transverse residual stress was 370 MPa, which was much smaller than the room-temperature yield strength of the base metal.
(4)
The comparison between the numerical simulation results and the experimental results indicated that the calculation results of the welding residual stress in the joint were in the best agreement with the experimental values when the solid-state phase transformation and softening effects were considered at the same time. When calculating the welding residual stress of similar materials, it was recommended to consider both solid-state phase transformation and softening effects.

Author Contributions

Conceptualization, G.F., C.W. and D.D.; methodology, G.F., C.W., L.H. and D.D.; software, C.W.; validation, G.F. and C.W.; formal analysis, G.F. and C.W.; investigation, G.F. and C.W.; resources, G.F. and D.D.; data curation, G.F. and C.W.; writing—original draft preparation, G.F. and C.W.; writing—review and editing, G.F.; visualization, G.F., C.W. and G.L.; supervision, G.F., T.L. and D.D.; project administration, G.F. and D.D.; funding acquisition, G.F. and D.D. All authors have read and agreed to the published version of the manuscript.

Funding

This research was funded by the National Natural Science Foundation of China, grant number 51875063 and 51905055; by the National Key R&D Program of China, grant number 2021YFF0501004; by the Natural Science Foundation of Chongqing, grant number cstc2020jcyj-msxmX0115; by the Fundamental Research Funds for the Central Universities Project, grant number 2020CDJLHZZ-086 and 2022CDJXY-010; and by the State Key Laboratory of Advanced Welding & Joining, grant number AWJ-21M08.

Institutional Review Board Statement

Not applicable.

Informed Consent Statement

Not applicable.

Data Availability Statement

Not applicable.

Conflicts of Interest

The authors declare that the research was conducted in the absence of any commercial or financial relationships that could be construed as a potential conflict of interest.

References

  1. Feng, G.; Wang, H.; Wang, Y.; Deng, D.; Zhang, J. Numerical Simulation of Residual Stress and Deformation in Wire Arc Additive Manufacturing. Crystals 2022, 12, 803. [Google Scholar] [CrossRef]
  2. Wang, Y.; Feng, G.; Pu, X.; Deng, D. Influence of welding sequence on residual stress distribution and deformation in Q345 steel H-section butt-welded joint. J. Mater. Res. Technol. 2021, 13, 144–153. [Google Scholar] [CrossRef]
  3. Peng, Y.; Song, L.; Zhao, L.; Ma, C.; Zhao, H.; Tian, Z. Research progress on weldability of advanced steel materials. Acta Metall. Sin. 2020, 56, 601–618. [Google Scholar]
  4. Berg, J.; Stranghoener, N.; Kern, A.; Hoevel, M. Variable amplitude fatigue tests at high frequency hammer peened welded ultra high strength steel S1100. Procedia Struct. Int. 2016, 2, 3554–3561. [Google Scholar] [CrossRef] [Green Version]
  5. Tomkow, J.; Landoski, M.; Fydrych, D.; Rogalski, G. Underwater wet welding of S1300 ultra-high strength steel. Mar. Struct. 2022, 81, 103120. [Google Scholar] [CrossRef]
  6. Derazkola, H.A.; García Gil, E.; Murillo-Marrodán, A.; Méresse, D. Review on Dynamic Recrystallization of Martensitic Stainless Steels during Hot Deformation: Part I—Experimental Study. Metals 2021, 11, 572. [Google Scholar] [CrossRef]
  7. Derazkola, H.A.; Garcia, E.; Murillo-Marrodán, A.; Fernandez, A.C. Review on modeling and simulation of dynamic recrystallization of martensitic stainless steels during bulk hot deformation. J. Mater. Res. Technol. 2022, 18, 2993–3025. [Google Scholar] [CrossRef]
  8. Hu, X.; Feng, G.; Wang, Y.; Zhang, C.; Deng, D. Influence of lumping passes on calculation accuracy and efficiency of welding residual stress of thick-plate butt joint in boiling water reactor. Eng. Struct. 2020, 222, 111136. [Google Scholar] [CrossRef]
  9. Lu, S.; Wang, H.; Dai, P.; Deng, D. Effect of creep on prediction accuracy and calculating efficiency of residual stress in post weld heat treatment. Acta Metall. Sin. 2019, 55, 1581–1592. [Google Scholar]
  10. Deng, D.; Zhang, C.; Pu, X.; Liang, W. Influence of material model on prediction accuracy of welding residual stress in an austenitic stainless steel multi-pass butt-welded joint. J. Mater. Eng. Perform. 2017, 26, 1494–1505. [Google Scholar] [CrossRef]
  11. Qu, Z.; Xia, L. Study on welding deformation numerical simulation for ultra-high strength steel BS960E. Procedia Manuf. 2019, 37, 97–104. [Google Scholar] [CrossRef]
  12. Sun, Y.; Shi, Q.; Qi, Y.; Zhang, S.; Cui, Q. Numerical simulation of multiphysics coupling in welding process of high strength and low alloy steel. J. Mech. Eng. 2019, 55, 168–177. [Google Scholar]
  13. Deng, D.; Murakawa, H. FEM prediction of buckling distortion induced by welding in thin plate panel structures. Comput. Mater. Sci. 2008, 43, 591–607. [Google Scholar] [CrossRef]
  14. Deng, D.; Zhang, Y.; Li, S.; Tong, Y. Influence of solid-state phase transformation on residual stress in P92 steel welded joint. Acta Metall. Sin. 2016, 52, 394–402. [Google Scholar]
  15. Fang, J.; Dong, S.; Xu, B.; Wang, Y.; He, P.; Xia, D.; Zhang, Z. Finite element analysis of stress field in laser cladding forming considering solid state phase transformation. Chin. J. Lasers 2015, 42, 0503009. [Google Scholar]
  16. Nishimura, R.; Ma, N.; Liu, Y.; Li, W.; Yasuki, T. Measurement and analysis of welding deformation and residual stress in CMT welded lap joints of 1180MPa steel sheets. J. Manuf. Process. 2021, 72, 515–528. [Google Scholar] [CrossRef]
  17. Li, H.; Huang, Z.; Zhang, C.; Wei, W. Study on softening phenomenon of welded joints of low-alloy high-strength wear-resistant steel. Hot Work. Technol. 2020, 49, 19–23. [Google Scholar]
  18. Li, S.; Ren, S.; Zhang, Y.; Deng, D.; Murakawa, H. Numerical investigation of formation mechanism of welding residual stress in P92 steel multi-pass joints. J. Mater. Process. Technol. 2017, 244, 240–252. [Google Scholar] [CrossRef]
  19. Khalaf, H.I.; Al-Sabur, R.; Abdullah, M.E.; Kubit, A.; Derazkola, H.A. Effects of Underwater Friction Stir Welding Heat Generation on Residual Stress of AA6068-T6 Aluminum Alloy. Materials 2022, 15, 2223. [Google Scholar] [CrossRef]
  20. Deng, D.; Murakawa, H. Numerical simulation of temperature field and residual stress in multi-pass welds in stainless steel pipe and comparison with experimental measurements. Comput. Mater. Sci. 2006, 37, 269–277. [Google Scholar] [CrossRef]
  21. Deng, D. Influence of deposition sequence on welding residual stress and deformation in an austenitic stainless steel J-groove welded joint. Mater. Des. 2013, 49, 1022–1033. [Google Scholar] [CrossRef]
  22. Deng, D.; Kiyoshima, S. Influence of annealing temperature on calculation accuracy of welding residual stress in a SUS304 stainless steel joint. Acta Metall. Sin. 2014, 50, 626–632. [Google Scholar]
  23. Goldak, J.; Chakravarti, A.; Bibby, M. A new finite element model for welding heat sources. Metall. Mater. Trans. 1984, 15, 299–305. [Google Scholar] [CrossRef]
  24. Kumar-Krishnasamy, R.; Siegele, D. 3D modelling of a multi pass dissimilar tube welding and post weld heat treatment of nickel based alloy and chromium steel. Int. J. Press. Vessel. Pip. 2010, 87, 643–649. [Google Scholar] [CrossRef]
  25. Hu, L.; Wang, Y.; Li, S.; Zhang, C.; Deng, D. Research on microstructure and hardness prediction method of Q345 steel welded joints based on SH-CCT Diagram. Acta Metall. Sin. 2021, 57, 1073–1086. [Google Scholar]
  26. Kumar, S.; Awasthi, R.; Viswanadham, C.S.; Bhanumurthy, K.; Dey, G. Thermo-metallurgical and thermo-mechanical computations for laser welded joint in 9Cr–1Mo(V, Nb) ferritic/martensitic steel. Mater. Des. 2014, 59, 211–220. [Google Scholar] [CrossRef]
  27. Yaghi, A.H.; Hyde, T.H.; Becker, A.A.; Williams, J.A.; Sun, W. Residual stress simulation in welded sections of P91 pipes. J. Mater. Process. Technol. 2005, 167, 480–487. [Google Scholar] [CrossRef]
  28. Ruitenberg, G.; Woldt, E.; Petford-Long, A.K. Comparing the Johnson–Mehl–Avrami–Kolmogorov equations for isothermal and linear heating conditions. Thermochim. Acta 2001, 378, 97–105. [Google Scholar] [CrossRef]
  29. Tatsuo, I. Unified transformation-thermoplasticity and the application. J. Jpn. Soc. Mater. Sci. 2007, 56, 352–356. [Google Scholar]
  30. Leblond, J.B.; Devaux, J.C. Mathematical modelling of transformation plasticity in steels I: Case of ideal-plastic phases. Int. J. Plast. 1989, 5, 551–572. [Google Scholar] [CrossRef]
  31. Perić, M.; Nižetić, S.; Garašić, I.; Gubeljak, N.; Vuherer, T.; Tonković, Z. Numerical calculation and experimental measurement of temperatures and welding residual stresses in a thick-walled T-joint structure. J. Therm. Anal. Calorim. 2020, 141, 313–322. [Google Scholar] [CrossRef]
  32. Gannon, L.; Liu, Y.; Pegg, N.; Smith, M. Effect of welding sequence on residual stress and distortion in flat-bar stiffened plates. Mar. Struct. 2010, 23, 385–404. [Google Scholar] [CrossRef]
  33. Wei, L.; Murakawa, H.; Deng, D. Investigation of welding residual stress distribution in a thick-plate joint with an emphasis on the features near weld end-start. Mater. Des. 2015, 67, 303–312. [Google Scholar]
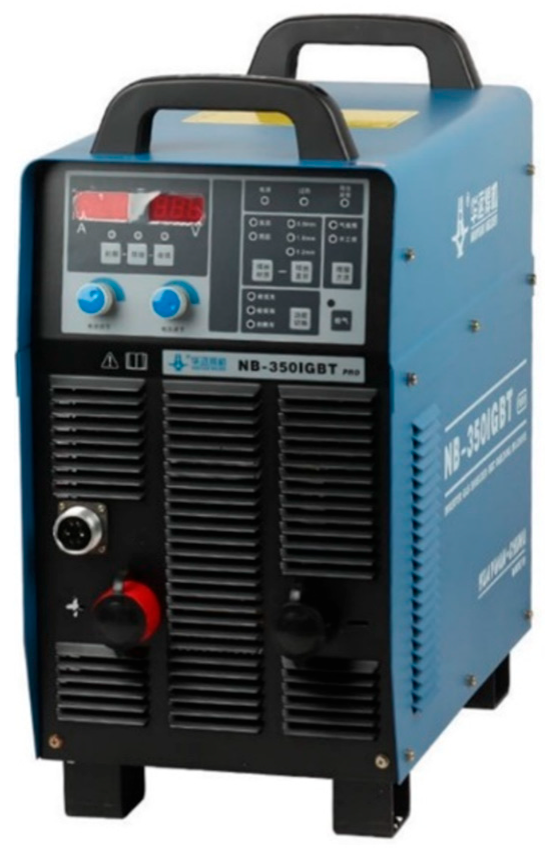
Figure 1. Welding machine.
Crystals 12 01093 g001
Figure 2. (a) Dimensions of welded joint and (b) pass arrangement.
Crystals 12 01093 g002
Figure 3. Temperature field measurement.
Crystals 12 01093 g003
Figure 4. Stress measurement.
Crystals 12 01093 g004
Figure 5. Hardness measurement.
Crystals 12 01093 g005
Figure 6. Finite element model.
Crystals 12 01093 g006
Figure 7. Temperature-dependent thermal properties of NM450TP wear-resistant steel (M, martensite; A, austenite).
Crystals 12 01093 g007
Figure 8. Temperature–strain curves of NM450TP steel during heating and cooling (Ms—martensite transformation start temperature, Ac1—austenization start temperature, Ac3—austenization finish temperature).
Crystals 12 01093 g008
Figure 9. Softening model.
Crystals 12 01093 g009
Figure 10. Mechanical properties of NM450TP wear-resistant steel.
Crystals 12 01093 g010
Figure 11. Microhardness distribution in the welded joint.
Crystals 12 01093 g011
Figure 12. Computational and experimental fusion zone.
Crystals 12 01093 g012
Figure 13. Simulation results and experimental results of welding thermal cycles.
Crystals 12 01093 g013
Figure 14. Peak temperature distribution along L2.
Crystals 12 01093 g014
Figure 15. Longitudinal residual stresses distributions on upper surfaces.
Crystals 12 01093 g015
Figure 16. Longitudinal residual stresses distributions on central section of welded joint.
Crystals 12 01093 g016
Figure 17. Computational and experimental results of longitudinal residual stress.
Crystals 12 01093 g017
Figure 18. Transverse residual stress distribution on the upper surface of the joint.
Crystals 12 01093 g018
Figure 19. Transverse residual stresses distributions in central section.
Crystals 12 01093 g019
Figure 20. Computational and experimental results of transverse welding residual stress distribution.
Crystals 12 01093 g020
Table 1. Chemical compositions of NM450TP wear-resistant steel (wt.%).
MaterialsCSiMnPSAlNbTiB
NM450TP≤0.28≤1.80≤2.00≤0.025≤0.010≤0.015≤0.22≤0.22≤0.0060
Table 2. Chemical compositions of ER100S-G (wt.%).
MaterialsCSiMnCrNiMo
ER100S-G<0.10.51.60.31.40.2
Table 3. Welding parameters.
Welding PassCurrent (A)Voltage (V)Welding Speed (mm/s)
1164172.0
2168172.4
Table 4. Calculation cases.
CaseSolid-State Phase TransformationSoftening Effect
ANoNo
BYesNo
CYesYes
Publisher’s Note: MDPI stays neutral with regard to jurisdictional claims in published maps and institutional affiliations.