Article

Mechanical Response and Fracture of Pultruded Carbon Fiber/Epoxy in Various Modes of Loading

1
School of Mechanical Engineering, Tel-Aviv University, Tel Aviv 6997801, Israel
2
Department of Mechanical Engineering, Ben-Gurion University, Beer-Sheva 8410501, Israel
*
Author to whom correspondence should be addressed.
Crystals 2022, 12(6), 850; https://doi.org/10.3390/cryst12060850
Submission received: 17 May 2022 / Revised: 9 June 2022 / Accepted: 13 June 2022 / Published: 16 June 2022

Abstract

:
Pultrusion is a continuous process of forming constant cross-sections of unidirectional composites with a significant long length. This unique process is implemented widely in the composites industry due to its continuous, automated, and highly productive nature. The current research focused on mechanical response characterization at three modes of loading: tensile, compression, and shear loading of coupons made from a graphite/epoxy 1 mm sheet. In addition, the effects of holes and notches were examined in terms of mechanical properties. The mechanical behavior was assessed through stress–strain curves with careful attention on the curve profile, macroscopic fracture modes observations, and optical microscopic tracking with continuous video records. The mechanical tests follow standards with some critiques on the shear test. Finite element analysis (FEA) was used to accurately determine the shear modulus, and for other mechanical investigations. By nature, under tension, the unidirectional fiber composite at 0° orientation exhibits high strength (2800 MPa), with very low strength at 90° orientation (40 MPa). Both orientations display linear mechanical behavior. Under compression, 0° orientation exhibits low strength (1175 MPa), as compared to tension due to the kinking phenomena, which is the origin in the deviation from linear behavior. Under shear, both orientations exhibit approximately the same shear strength (45 MPa for 0° and 47 MPa for 90°), which is mainly related to the mechanical properties of the epoxy resin. In general, in the presence of holes, the remote fracture stress in the various modes of loading did not change significantly, as compared to uniform coupons; however, some localized delamination crack growth occurred at the vicinity of the holes, manifested by load drops up to the final fracture. This behavior is also attributed to the tension of notched coupons. FEA shows that the shear values were unaffected by manufacturing imperfections, coupon thickness, and by asymmetrical gripping up to 3 mm, with minor effect in the case of a small deviation from the load line. Selected experimental tests support the FEA tendencies.

1. Introduction

“Pultrusion” in composite materials is derived from the words “pull” and “extrusion”. Preliminary steps consist of pulling continuous fibers through a bath of resin, then passing them through pre-formers, following curing in a heated die. Nowadays, 3D printing processes are considered in the development and implementation of thermoplastic pultrusion processes that can obtain a carbon fiber/polypropylene (CF/PP) filament [1]. The pultrusion process is characterized by manufacturing composite materials into continuous constant cross-section profiles, such as flat panels, through I-beams, Z-sections, solid bars and hollow tubes. This process is very effective because it is a continuous technique in producing low-cost, high quality structural products, which are very attractive in terms of their lightweight and corrosion resistance, and they are used in aerospace [2], sporting, architecture, and transportation/automobile industries. New applications for pultruded composites are appearing almost daily. They range from non-conducting ladder rail to stiffened panels for aerospace applications. More recently, pultruded components have been used in the automobile industry as drive shafts. The products have a consistent quality, with almost no complementary finishing steps before usage as they are close to the required dimensional tolerances. The common fiber reinforcements are S-glass, carbon (C), and Kevlar within the matrix resins such as epoxy, phenolic, and even thermoplastics. In terms of mechanical response, the pultruded profiles exhibit higher flexibility, tensile strength, and structural performance, as compared to those fabricated with another reactive polymer process. However, because the system consists of two phases, a large mismatch in mechanical properties is observed. The C fiber behaves in a brittle manner, while the epoxy exhibits extensive plastic deformation before fracture that leads to a highly anisotropic response. As an example, the deformation along the fibers under tension and compression is controlled by the fibers accompanied by a linear stress–strain response, with abrupt failure due to the fracture of the fibers under tensile loading, or kinking under compression loading. In the case of transverse compression in-plane shear, the nonlinear stress–stress relationship is developed due to the deformation of the polymeric matrix and/or the interface fiber/resin.
Nowadays the increasing demand for integrating pultrusion products into structural applications, especially in aircraft structures, requires special attention on quality control and a comprehensive understanding and knowledge of the mechanical fracture process with and without defects such as open holes and damage.
The prediction of unidirectional (UD) fiber composite strength and the sequence events, which lead to final failure in the tensile mode, received extensive attention in the composite field. Three constituents control the strength of UD fiber composites, the fiber, the resin matrix, and their interface. Statistical and analytical methods are being used to predict the UD fiber composite strength. For the former, perfect bonding between fibers and matrix was assumed. Lately, the authors in [3] introduced a new prediction method using UD carbon fiber composites with a different interfacial shear strength (IFSS), demonstrating a reasonable agreement with the experiments. In addition, they suggest a new predictive method evaluating the optimal IFSS for the maximum tensile strength of UD fiber composites, indicating that the tensile strength increases with increased IFSS, reaching a maximum at an optimal strength and decreasing for further higher IFSS.
The fracture process of a UD fiber composite under axial tension is known to be a local phenomenon in which a cluster of few fibers participate, triggered by one fiber break. The authors in [4] also considered the important role of matrix failure between the fibers using an axisymmetric multi-cylinder model. They concluded that the fracture scenario is dependent on whether the initial fiber break is due to manufacturing or under loading. For example, in the case of the former, the matrix crack initiates as a brittle crack from the broken fiber end and grows normal to the fiber axis. The stress concentration produced by the broken fiber in the intact neighboring fibers is further enhanced by the matrix crack and is highest when the crack front reaches the fibers.
Unlike tensile loading, compressive failure is characterized by its variety and complexity of modes. It is well known that the compressive strength is almost independent of fiber tensile strength and frequently lower than expected. This behavior is related to the fact that small misalignments in fiber orientation angles with respect to the loading direction, may cause shear buckling which depends significantly on the matrix non-linearity [5]. Misalignments are generally attributed to the inherent part of the manufacturing process. The authors in [6] established a kink band model, which triggered the shear buckling in case of compressive loading, resulting in a compressive strength formula based on initial misalignment analysis [7]. In the kink band model, the plastic shear properties were also considered, mainly affected by the matrix polymers. The authors in [8] proposed a modified kink band model for compressive failure, and theoretically determined the compressive strength along with the kink band failure angle. In addition, the model can predict how the kink band is propagated and inclined, and why the shear buckling breaks out at that very kinking angle.
The shear behavior of composites becomes a significant issue because various types of structures are being exposed to such stresses [9]. Characterization of shear properties is more difficult than the two uniaxial modes because, usually, other stress components besides the shear stress arise in “shear testing”. When the shear yield stress is sought in a complex stress state, significant non-linear deformations of the matrix before fracture and progressive development of damage are observed [10,11]. Thus, beyond extensive experimental evaluation, by seeking an appropriate set-up shear testing, numerical simulation study becomes an important and essential tool in reproducing the complex deformation and damage mechanisms that arise under in-plane shear [12,13].
Discontinuities, such as open holes and cutouts, affect the strength, and these are accompanied by an important effect on the growth of damage zones [14]. Moreover, the mechanical response of notched structures becomes more complex, caused by their specific features such as heterogeneity, anisotropy, or strain gradients. As suggested by [15], in the case of tensile loading, modeling strategies must not only be able to take account of the damage modes of laminated structures (fiber breakage, matrix cracking, splitting, delamination) and their interactions, but also capture the stress gradients at the hole edge. The existence of holes in compression loading reduces the strength even more than tension. This trend was related to damage initiation by a combination of fiber micro-buckling and delamination, as observed by [16] on compressive failure in graphite-epoxy laminates containing a single hole. In addition, shearing of continuous strand mat layers was detected by [17], in compressive pultruded composite plates with holes.
This research is aimed at characterizing the mechanical response of pultruded T-700 carbon fibers with thermoset epoxy resin under tension, compression, and shear loading. Attention was given to the failure sequence events and the fracture modes on macro- and micro-scales as a function of fiber orientations. In addition, to increase the reliability of the mechanical response integrity of pultruded products in particular, and fiber-reinforced composite structures in general, damage and failure mechanisms must be recognized. This has been characterized by the presence of open holes with various diameters in the three modes of loading, as well as notch effects in the tensile mode. These defects represent the natural state of the composite after the manufacturing process and are responsible for nonlinear phenomena before the catastrophic failure. Moreover, in the case where the damage occurred during service, such as after an impact [18], it is necessary to evaluate the mechanical response of the damaged state according to the aeronautical requirements. Therefore, the current study simulates via comprehensive tests, the mechanical behavior of defected samples to strengthen the reliability of using structures from composite materials. The various mechanical tests follow the ASTM standards with some critique on the shear test with the input of FEA. The latter was applied for other mechanical issues such as the influences of misalignment and shifting from axiality and the notch profile on the shear properties. This topic is important to assess the sensitivity of such mechanical parameters in affecting the mechanical property values.

2. Materials and Experimental Procedures

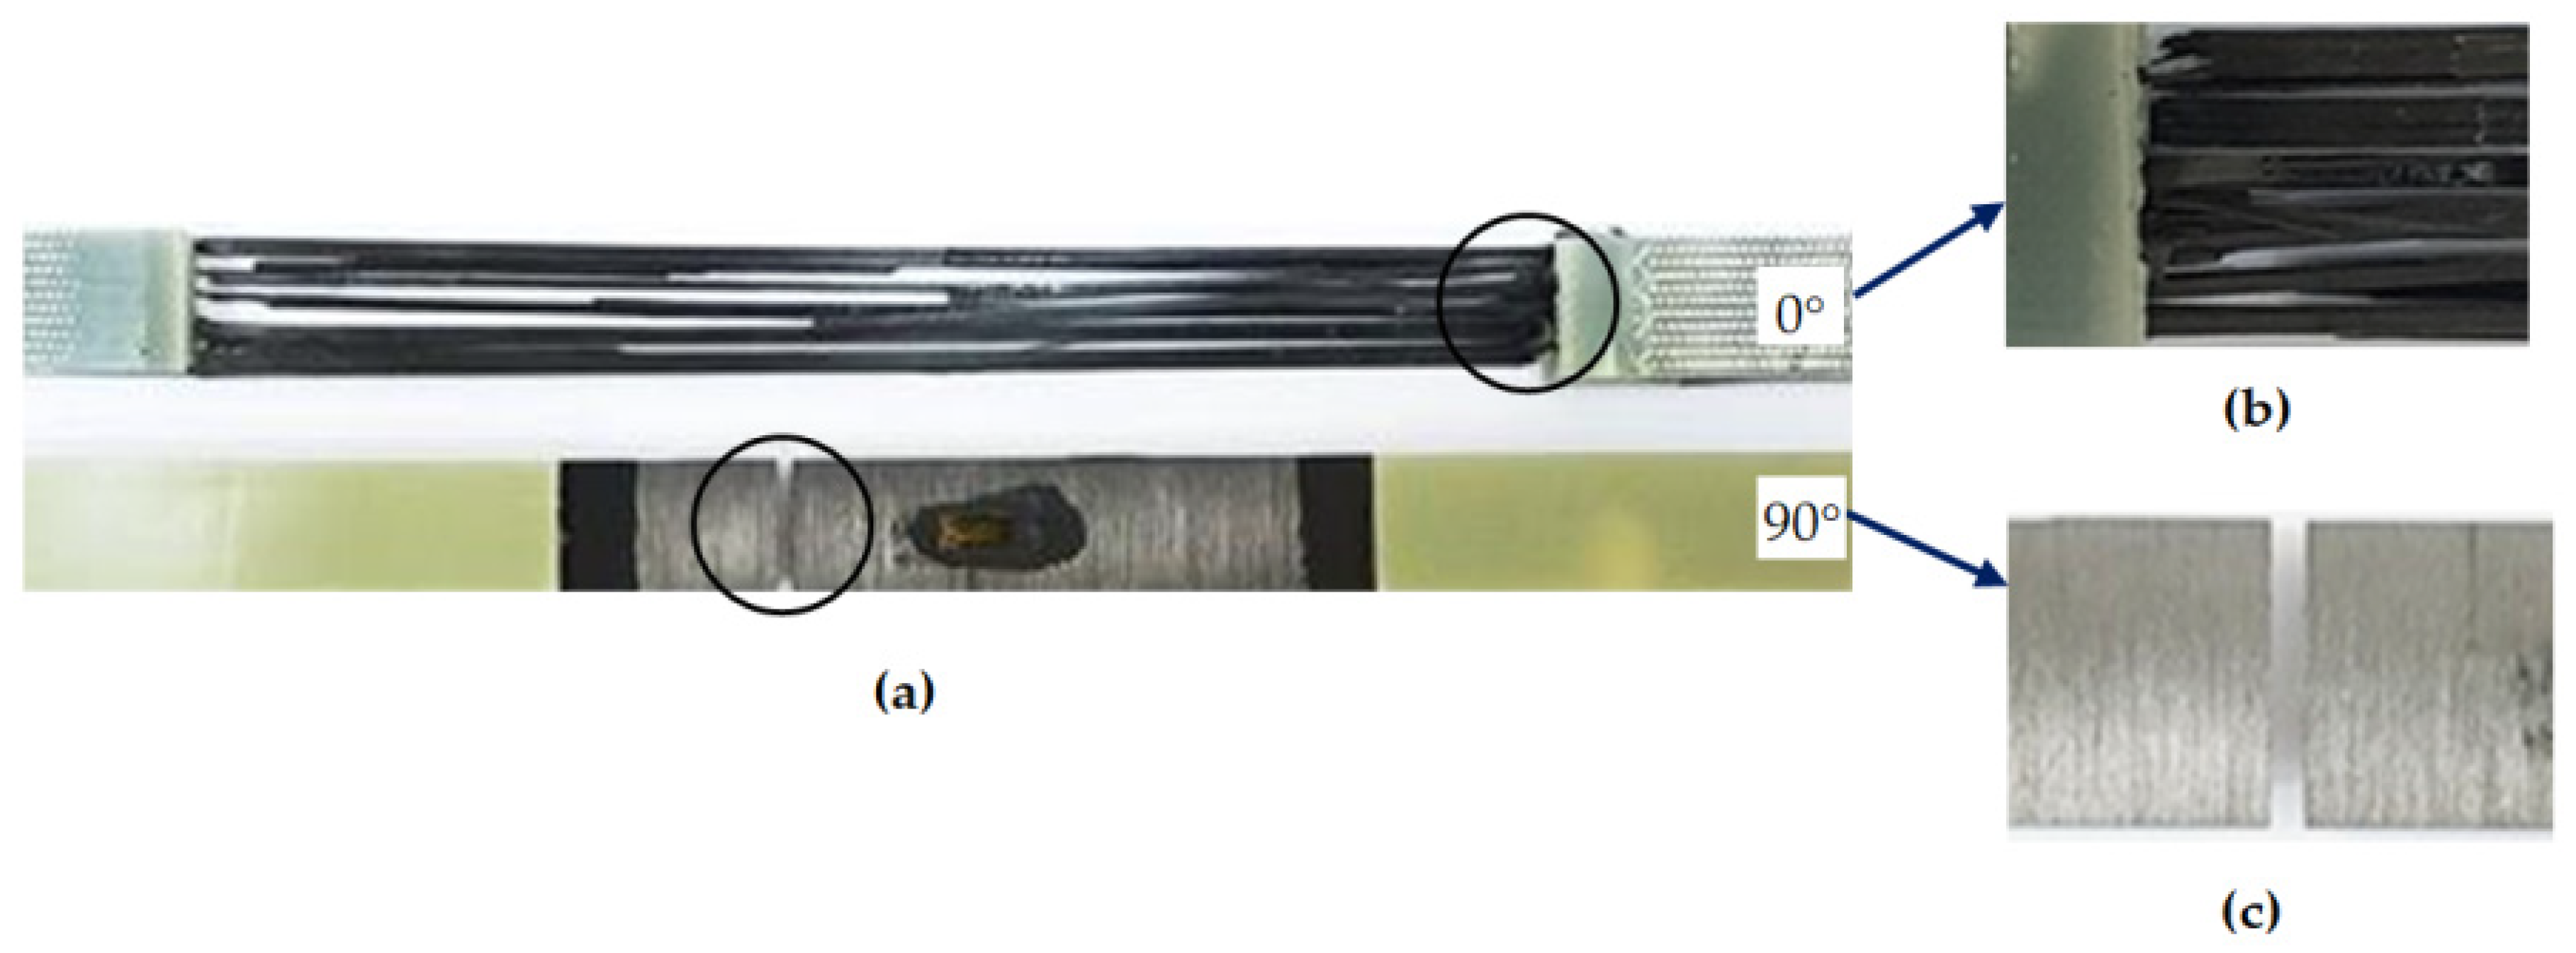
Pultruded laminate, in the form of a plate with a thickness of 1 mm, made of T-700 carbon fibers (70% in volume) with thermoset epoxy resin, was manufactured by Gordon Composites Engineered Structural Materials Montrose, CO, USA. In general, the pultrusion process (similar to the extrusion of metals) consists of five steps: filament feeding, resin impregnation, pre-die forming, shaping and cutting, and, finally, pulling and cutting. The tension and shear coupons were prepared using 1 ply, while for the compression coupons, 3 plies were glued after the precise process used to manufacture tension, compression and shear coupons. For tension and compression, longitudinal (0°) and perpendicular (90°) coupons were prepared related to the fiber orientation with polyester tabs, as recommended by the standard. In the shear mode, coupons with fibers perpendicular to the applied load were noted as 0° and coupons with fibers parallel to the applied load noted as 90°. The mechanical behavior was determined in the three modes of loading, according to ASTM standards: using [19] for tension, [20] for compression and [21] for shear, following the general recommendations of [22], applicable to pultruded composites. 
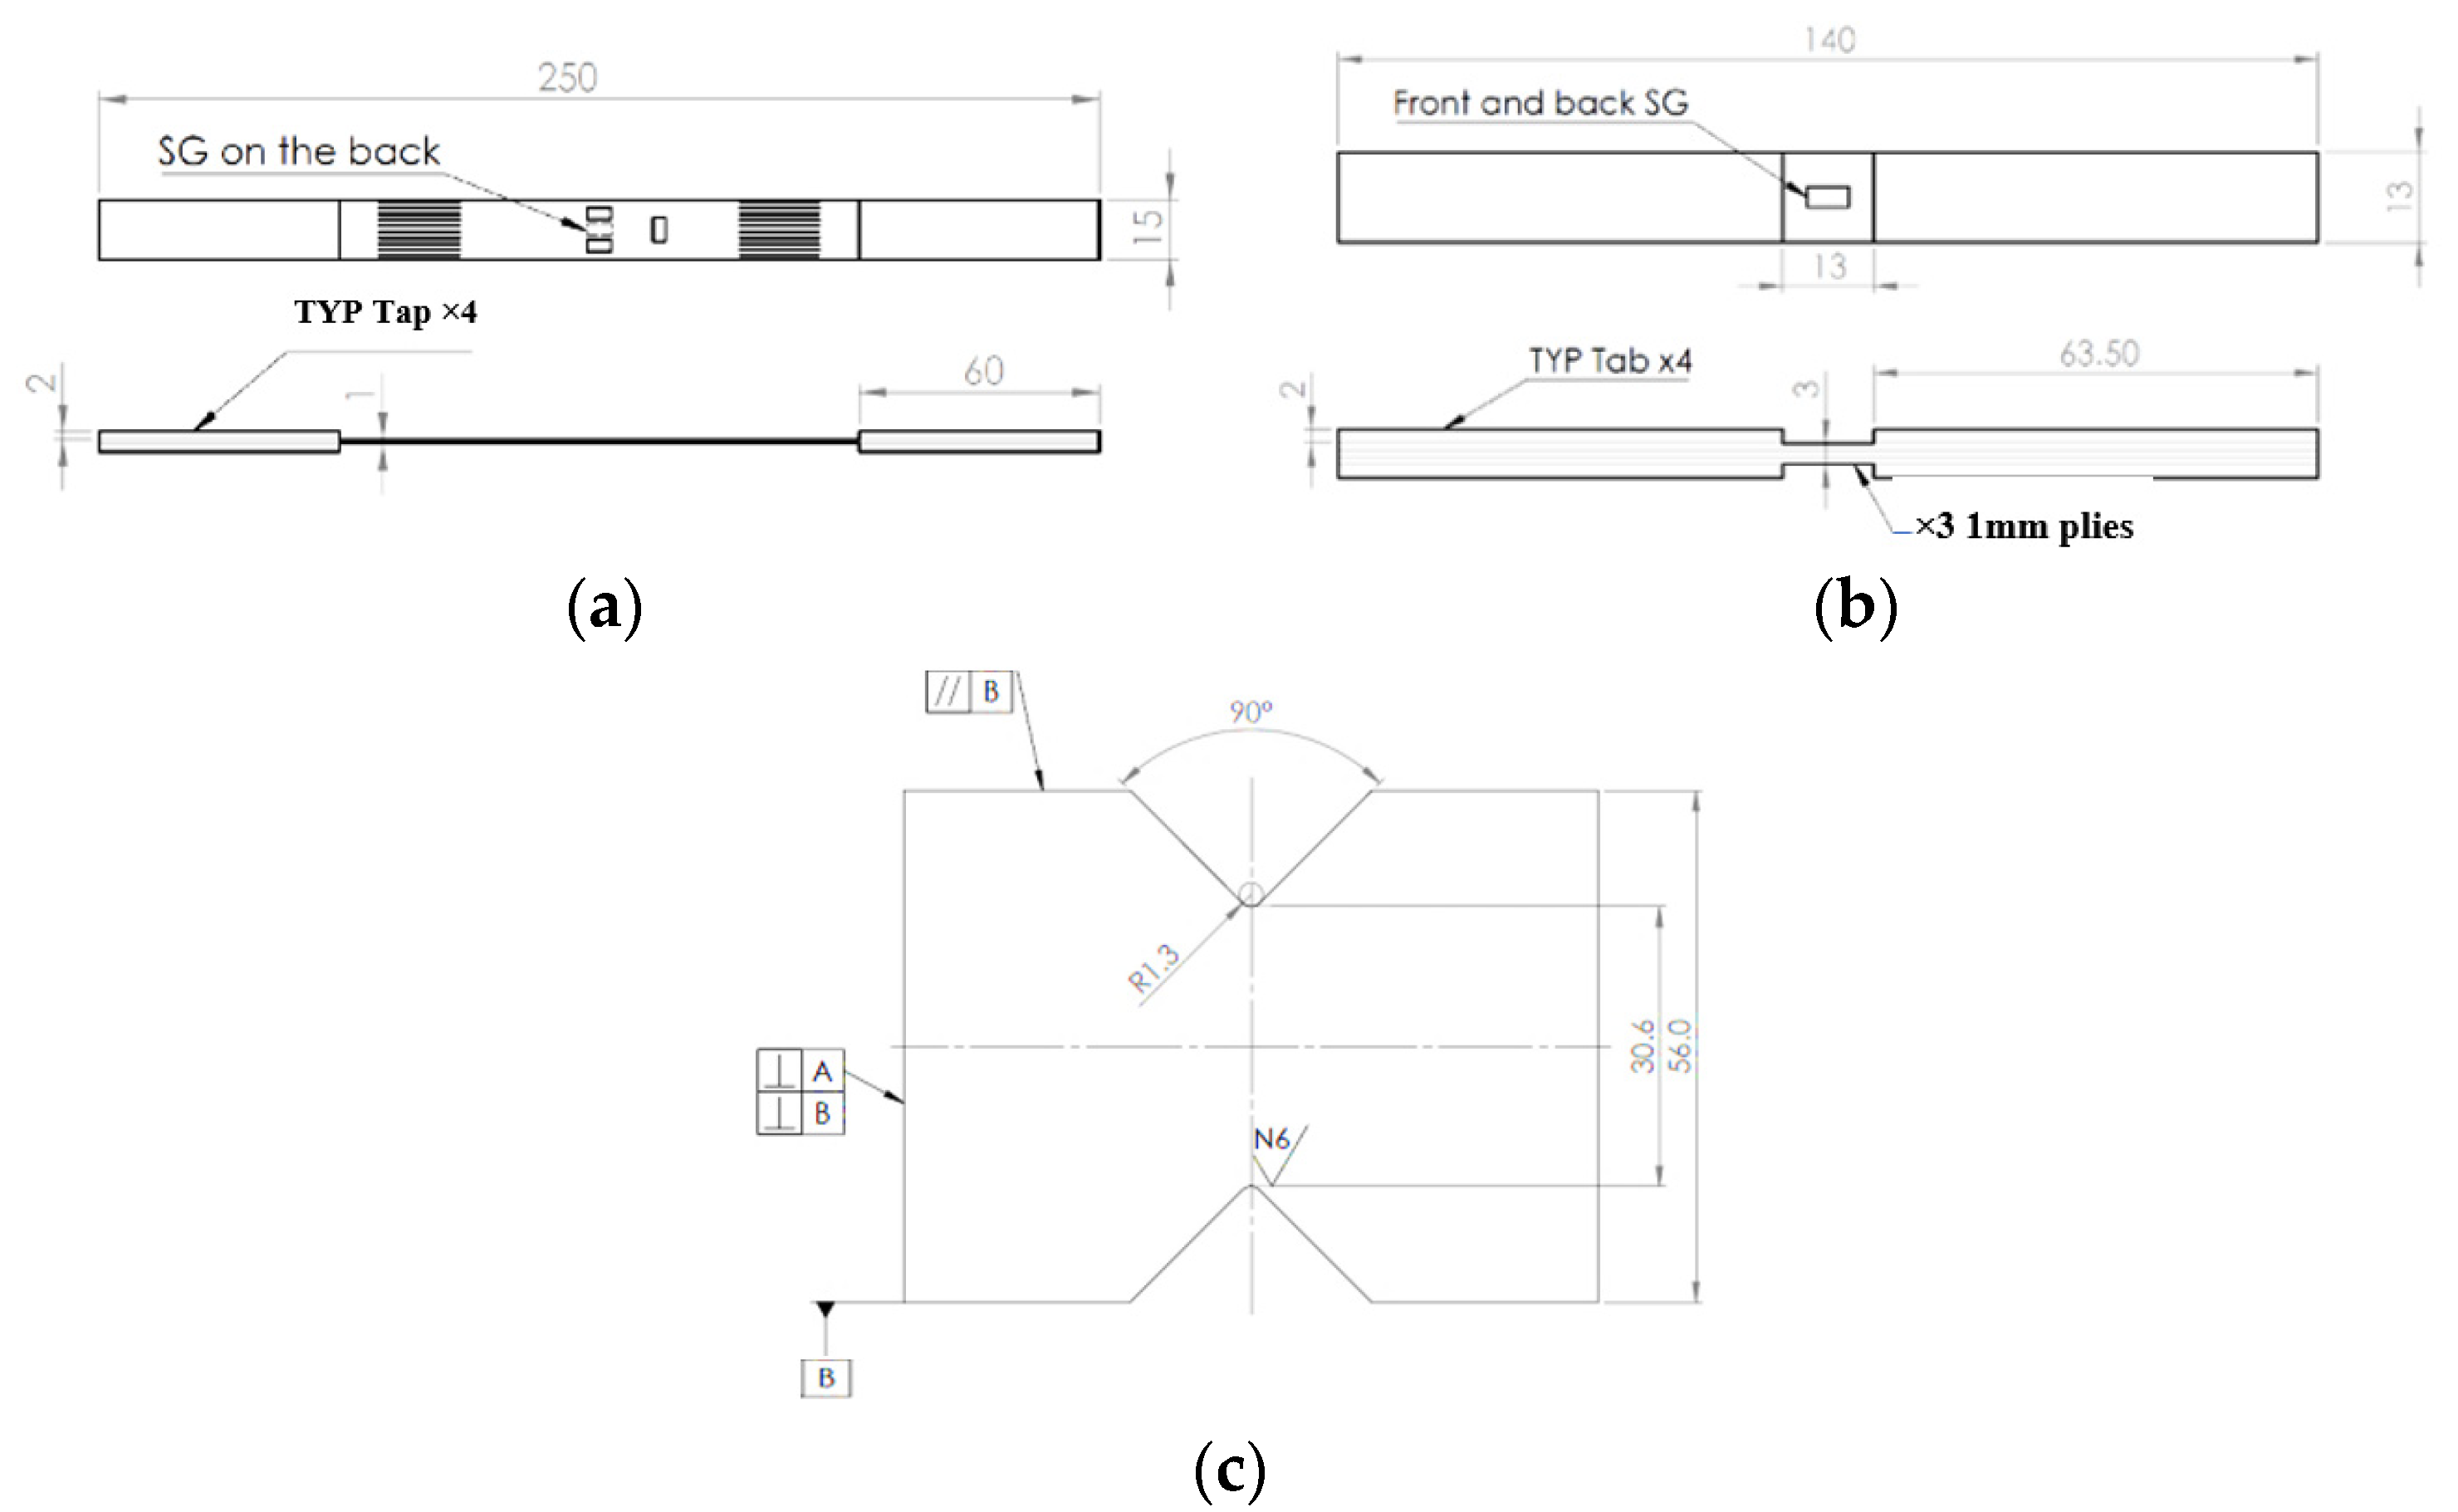
Figure 1a–c shows the coupon configuration and its dimensions, including the strain gauge (SG) locations for the tension, compression, and shear modes, respectively. The coupon dimensions were measured both by digital devices, as well as by a stereoscope microscope with attention to the notch radius and other critical dimensions. In the case of compression, coupons of a thickness of 3 mm were tested, and in the case of shear, coupons of a thickness of 1 mm and 2 mm were tested.
Tensile tests were performed using friction grips and a computerized electro-mechanical Instron (Norwood, MA, USA) machine with a capacity of 100 KN, shown in Figure 2a. Displacement control with a constant crosshead velocity of 0.5 mm/min was applied and the strain was measured utilizing uniaxial SGs (SG -C2A-XX-125LW-350 by Micro-Measurements with a 3 mm gauge length-GL) located at the center of the coupon. In addition, the mechanical response, with attention to the centered hole diameter effect and side notch sensitivity degree, was characterized by testing the same set-up with coupons consisting of a central hole with diameters ranging from 2.5 mm to 9.5 mm and a centered double edge notch with a notch depth (ND) of 1.25, 1.45 and 2.25 mm. For the latter, selected coupons were instrumented by four SGs located: two along the fibers adjacent to the hole and two far away, with one along and the second perpendicular to the fibers. Compression tests were performed by the same machine with similar test conditions using compression fixtures acquired from Wyoming Test Fixtures (Salt Lake City, UT, USA) as shown in 
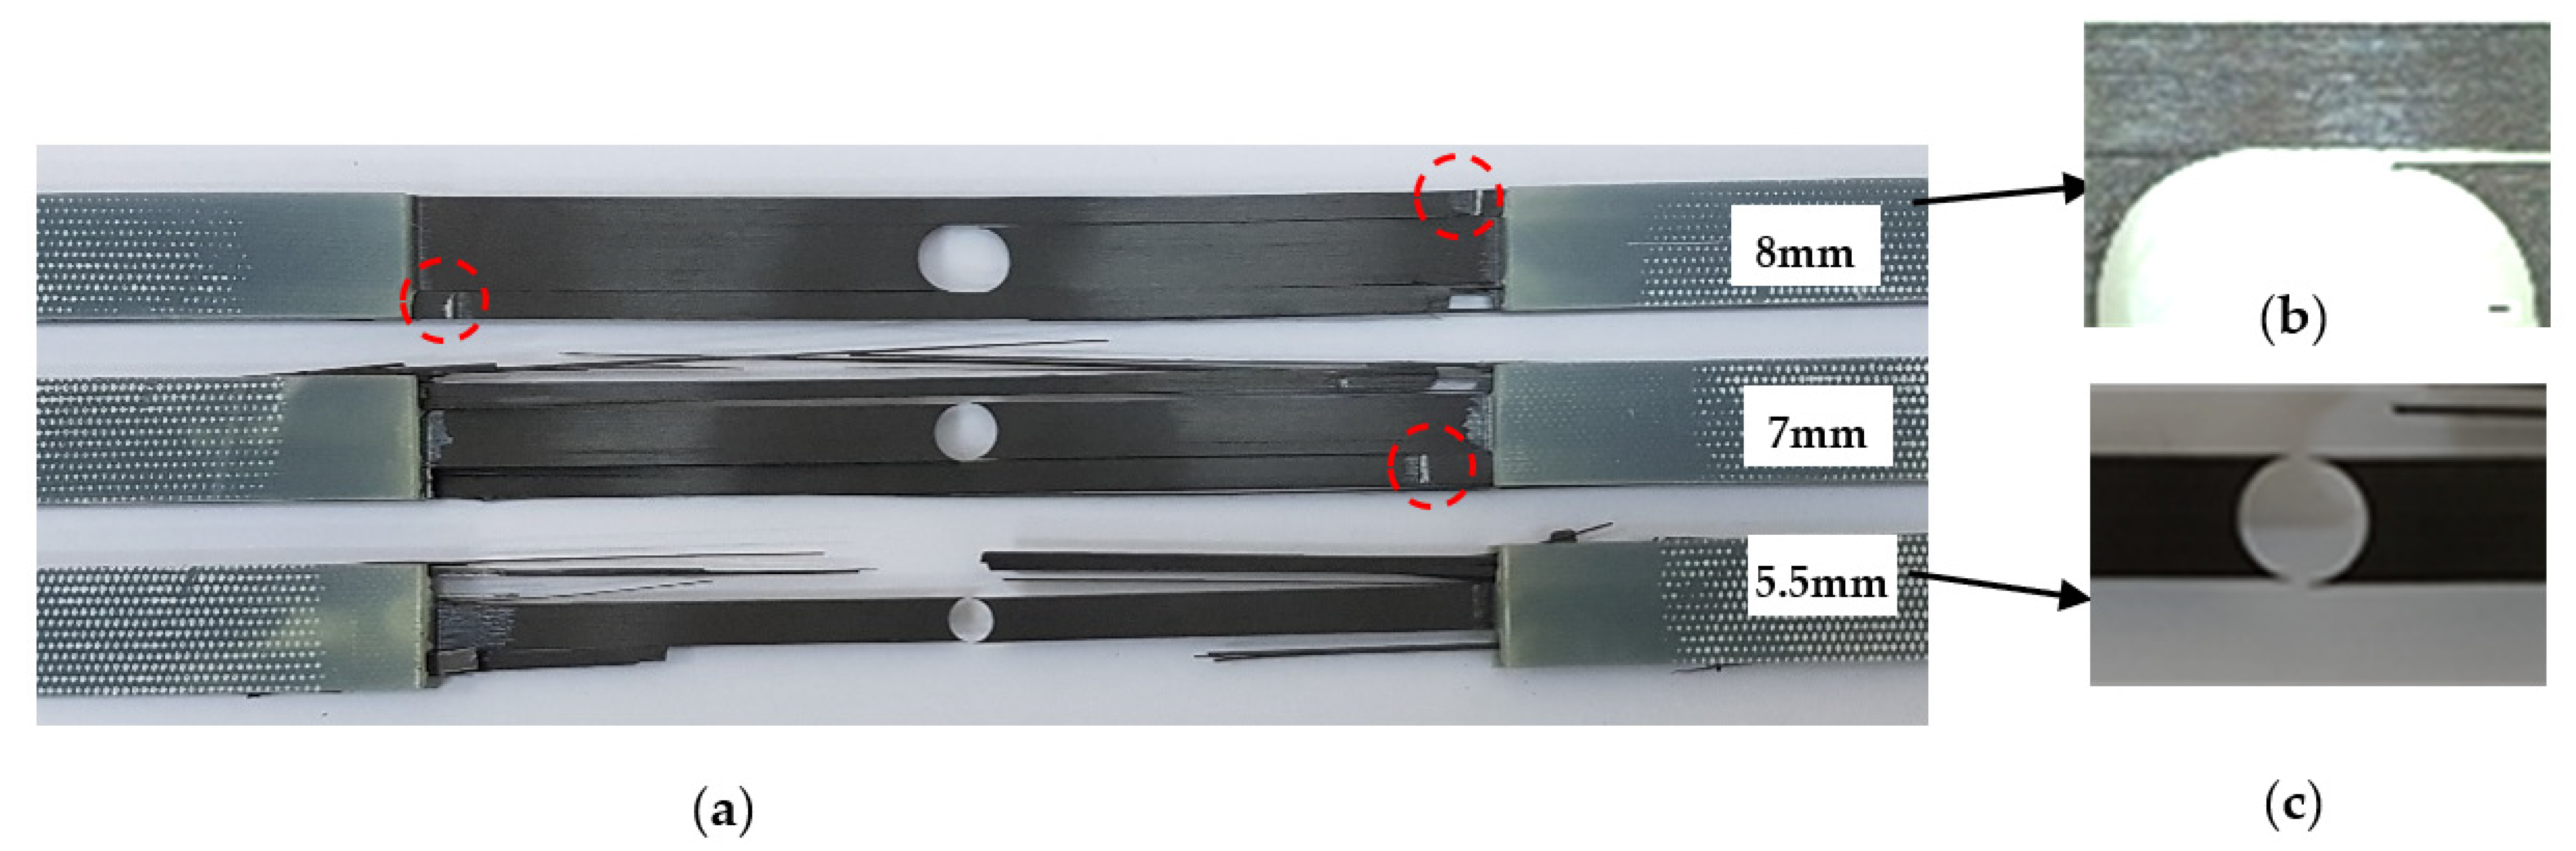
Figure 2b. The strain was measured by the same type of SGs as mentioned above. The SG was located at the center of the coupon. The thickness of 2 mm (shear) and 3 mm (compression) was obtained by using 3 M DP460 glue (Saint Paul, MN, USA) with an 80 °C/4 h post-curing temperature. The effect of open holes, with diameters ranging from 2.5 to 5.5 mm, on the mechanical response, was also addressed. Shear properties were established using a Shimadzu 20 kN machine (Tokyo, Japan), with a shear fixture acquired from Thumler GmbH (Nurnberg, Germany) and ±45° SGs (C2A-XX-062LV-120 with a 1.5 mm GL) (Figure 2c). The strain, load, and displacement values were measured simultaneously by a Vishay data logger computerized system 7000 (Malvern, PA, USA).
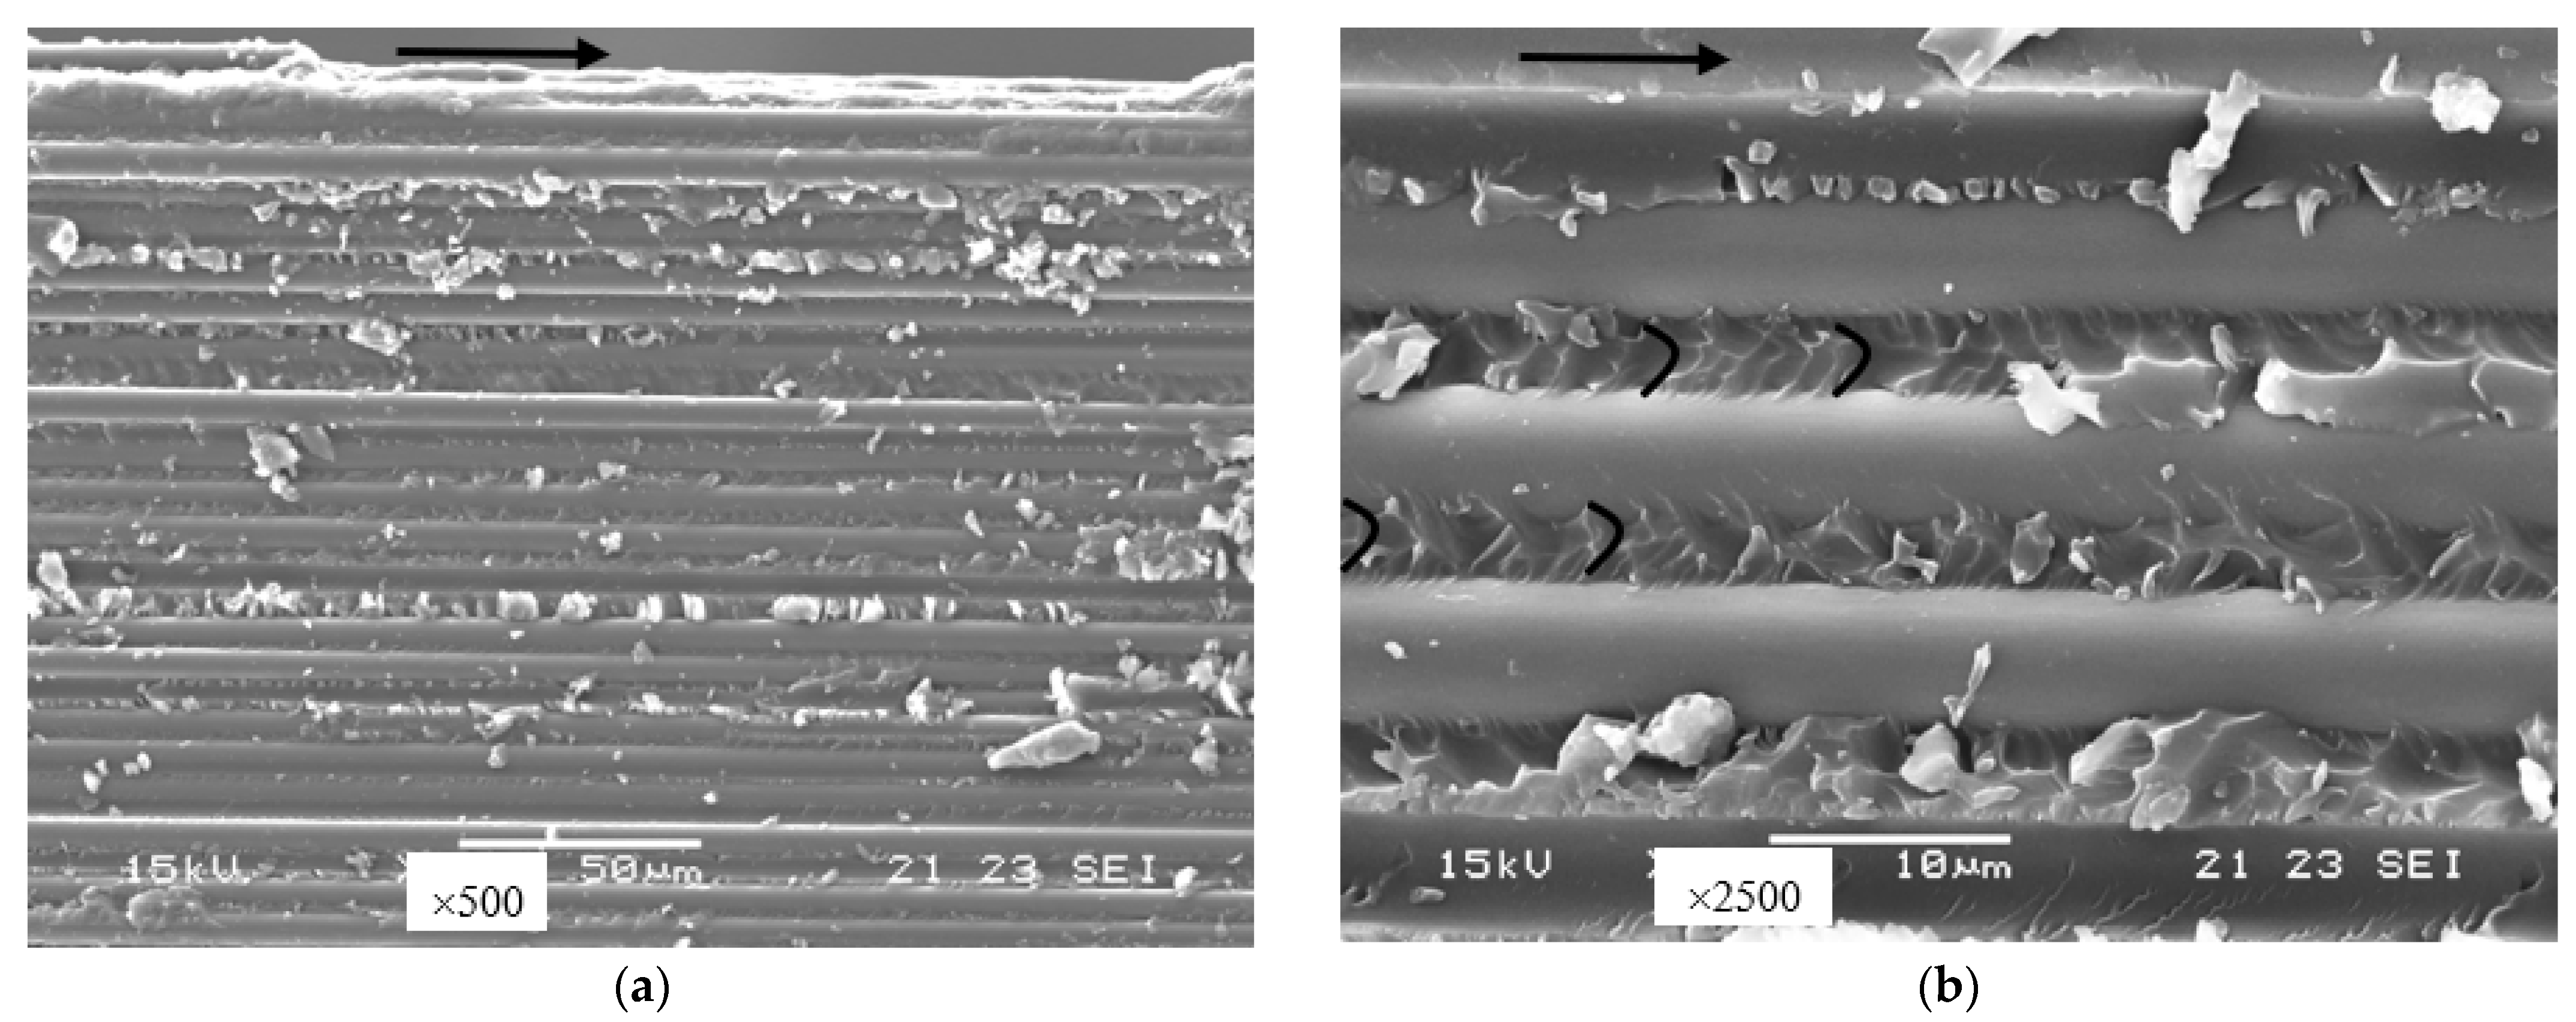
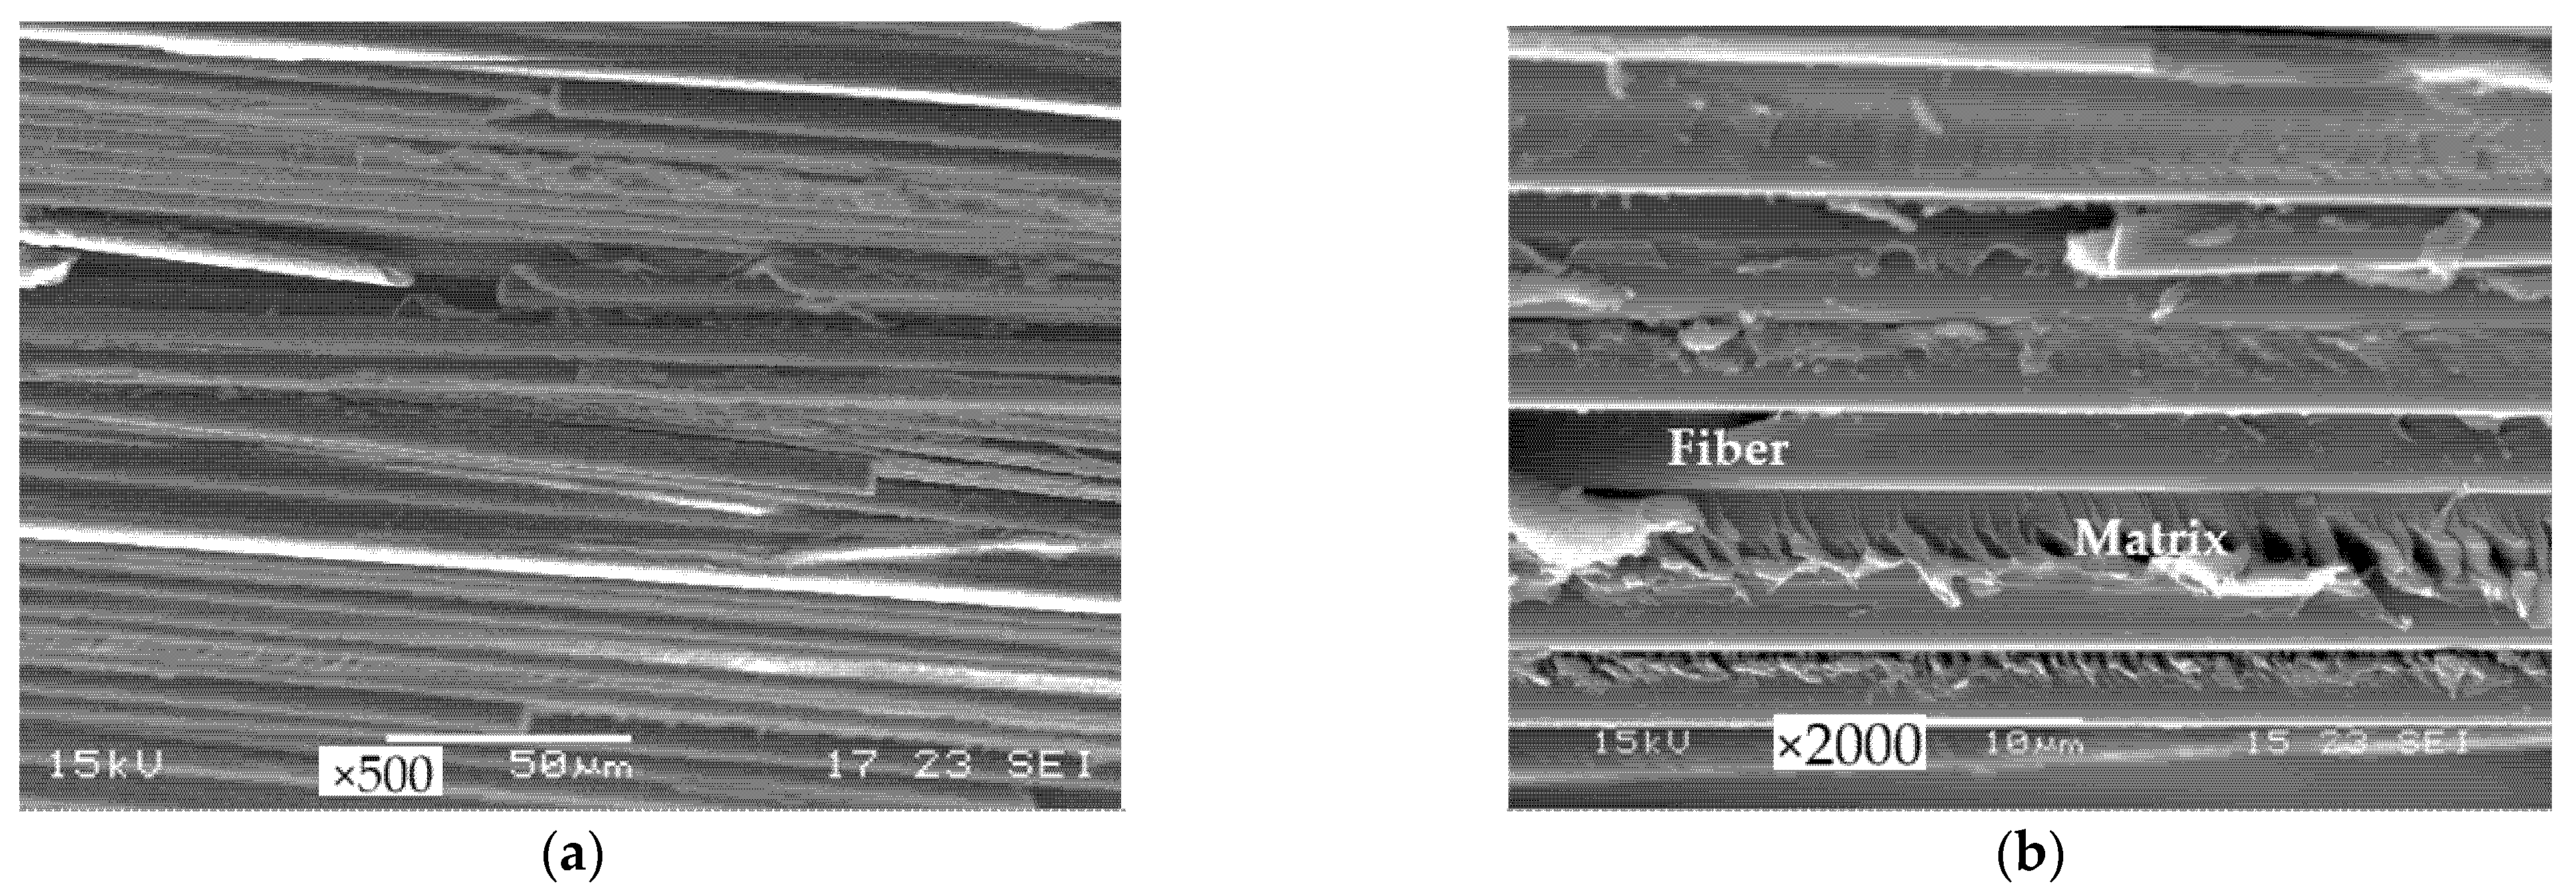
Finally, optical microscopy and scanning electron microscopy (SEM) were used to characterize the crack location and path, the macro- and the micro-fracture modes as a function of the loading modes.

3. Results

3.1. Mechanical and Fracture Behavior in Tension–Compression and Shear

The following three paragraphs describe the experimental activity in tension, compression, and shear loading using uniform coupons. The results are given in terms of stress–strain curves. In addition, tabulated results are shown and the macroscopic response to some selected microscopic fracture modes, with attention to the critical features, are also presented.

3.1.1. Tension

Figure 3a,b illustrates the mechanical response in tension for 0° and 90° coupons, respectively. As shown (Figure 3a), at 0° orientation, the composite exhibits a linear behavior, with a Young modulus of 132.5 ± 1.7 GPa, and a tensile strength of 2799 ± 2 MPa with approximately 2% of strain. These results are in a good correlation compared to a tensile strength of 2550 MPa with a modulus of 135 GPa listed by [23] for nearly the same composite (T700 and epoxy resin) with 60% fiber volume. In the 90° configurations, the tensile strength is approximately 40 MPa, as compared to 70 MPa given in the data sheet. This difference is due to the highest volume fraction in the current composite. Table 1 summarizes the mechanical properties including the Poisson ratio in both orientations. As shown, the deviation of all the measured parameters is very small, which specifies the high reproducibility of this composite. Not shown here, the microstructure characterization indicates a high-quality manufacturing process, manifested by very low defects with almost uniform volume fraction. Figure 4a depicts the macroscopic tensile fracture modes for 0° and 90° coupons. As displayed, the failure of the 0° coupons developed from fracture of fiber bundles (Figure 4b), whereas, for the 90° coupons, the fracture path was flat and occurred at the interface fiber/matrix (Figure 4c).

3.1.2. Compression

Figure 5a,b illustrates the mechanical behavior under compression for 0° and 90° coupons, respectively. For the 0° orientation (Figure 5a), the composite exhibits a linear stress–strain relationship up to about 850 MPa (see the inner figure) with ultimate compression stress around 1300 MPa with 1.2% of strain. The deviation from linearity results from the kinking phenomena, as shown in Figure 6e (indicated by a dashed circle). It appears that the kink bands started in the upper grip zone and were accompanied by axial cracks parallel to the fibers (Figure 6c,d). It is assumed that these bands were initiated due to the stress concentration caused by the grips or by misalignment of the fixture. In the case of the 90° coupons, elastic/plastic behavior is detected with a stress level of approximately 140 MPa with 2% of strain. The reproducibility in compression is smaller than in tension, as shown in Table 2. This trend is due to small misalignments (an inherent part of the manufacturing process) in the fiber orientation angle, with respect to the loading direction, which may cause shear buckling, which depends significantly on the matrix’s non-linearity. For the 90° coupons, the compression mode stimulated shear stresses, which resulted in higher stress, compared to lower one in tensile mode. This change is manifested by the inclined fracture mode, which occurs through the thickness (Figure 6a,b). The shear mode in compression is reflected with some similarity of microscopic features (serrated type fracture), as in “pure shear” (see later on), as shown in Figure 7a,b.

3.1.3. Shear: Double V Notched (DVN) Coupons

Figure 8 illustrates the shear stress–strain curves for the different orientations 0° and 90°. In both orientations, the mechanical behavior is characterized by elastic–plastic behavior; for 90°, the stress–strain relationship is smooth up to fracture (Figure 8b), whereas for 0°, it ends by two consecutive load drops (Figure 8a,c), similar to the “pop in” phenomena in metallic materials.
The load relaxation is due to delamination crack growth perpendicular to the applied load initiated at the intersection of the notch root and the straight flank (see Figure 9a). The alternate crack extension occurs on one side of the coupon followed by a crack growth on the opposite side. This phenomenon occurs randomly without any preference side (although, in most cases, we have noticed that the first one occurs at the static grip). As displayed in some cases (Figure 8c), the second event arises at a stress lower than the first, while for other cases, it happened at a higher or equal stress. Figure 8d emphasizes the difference in the mechanical response including the low modulus for the 90° coupons (see later for some arguments on this difference). Table 3 summarizes the various mechanical properties for the different orientations; τr and γr represent the shear stress and strain, respectively, at first noticed load relaxation. It is important to note that the shear modulus, determined using the 90°, is lower by 15%, and the shear strain is larger by 40%, as compared to the 0° coupons. The low value of the modulus was also accompanied by a deviation in linear behavior at a lower shear stress (14.4 MPa, as compared to 17.6 MPa for 0°). Note that fracture shear stress for the 0° coupons was taken at the first load drop, whereas for the 90° coupons, it is the ultimate one. The crack initiation sites for the 0° and 90° coupons are shown in Figure 9a,b respectively, (marked by arrows). As is shown for both cases, the delamination cracks were initiated at the intersection of the notch root and the straight flank, which indicates that this point is critical, as will be shown by FEA. As mentioned, the shear modulus for the 90° coupons is lower than for the 0° coupons, and by examining the fracture surface of both orientations, one can provide reasons for this mechanical distinction. Figure 10 illustrates the fracture shear modes in two magnifications for both orientations. The fracture of the 0° coupons (Figure 10a) is accompanied by a higher energy fracture surface, as compared to the 90° coupons (Figure 10c). This argument is being manifested by the fracture of the epoxy resin, whereas for the 0° coupons, a serrated-type fracture is observed between the fibers indicating an applied shear mode (Figure 10b), in comparison to a more tensile-like mode in the 90° coupons, which resulted in separation/de-bonding of the matrix creating such columns. This difference in the fracture surface is expressed by the shear modulus values and may give a hint on the state of the stress at the root of the notch. This issue will be discussed later on with the support of FEA.

3.2. Mechanical and Fracture Behavior in the Presence of Holes and Notches

The following three paragraphs describe the experimental activity in tension, compression and shear loading using holed coupons, respectively. The results are given in terms of stress–strain curves. In addition, tabulated results are presented and the macroscopic, with some selected microscopic, fracture modes, with attention to the critical features, are presented.

3.2.1. Coupons with Holes in Tension

Figure 11a–c shows the nominal stress–strain and stress-displacement related to the presence of holes, while increasing hole diameters from 2.5 mm up to 9 mm. The nominal stress has been calculated according to the net section ((W-D)/t, where W is width, D-diameter and t-thickness). Only selected holed coupons were instrumented by strain gauges. Figure 11a illustrates the stress–strain for a 2.5 mm holed coupon with an expanded region up to 1000 MPa. Almost no change in the Young modulus was noticed for the localized strain gauges and remote gauge, as compared to the reference, which was taken from a uniform coupon. The other curves (Figure 11b,c) are given in terms of displacement, although this display has no physical meaning. The curves lie on a narrow strip with almost the same fracture stress (see Table 4). The first stress drop/relaxation, marked as σnom-r, is noticed in the early stage of loading, at around 500 MPa (see Figure 11c). This phenomenon is related to delamination growth along with the applied load near the hole (see later on). In coupons with a hole diameter of 7 mm, pull out of the fiber bundle occurs at the edges of the tabs before reaching the maximum fracture stress.
Nevertheless, expanding the stress range up to the σnom-r, (Figure 11c) indicates three trends; (1) The stiffness of the coupon increases as the hole diameter increases, (2) Moderate decreases of σnom-r with hole diameter (see also Figure 12), while excluding the results for holes of 7 mm and 9 mm diameter, is due to the pullout phenomenon. (3) As the hole diameter increases, the change in the load drop increases, which indicates an increase in the delamination crack growth steps (Figure 13). The curves in the last figure were shifted by about 0.2 mm to emphasize the number and the amount of stress relaxation.
Figure 14 illustrates the macro-fracture modes of holed coupons. As shown (indicated by arrows), in the case of the 7–8 mm coupons (as well as at the 9 mm coupon not shown), the pullout phenomenon occurs at the tabs at stresses lower than the strength value. This is because the shear stresses at the interface gluing tabs cannot withstand the higher stresses developed at the two ligaments after the development of σnom-r. This condition does not arise at the 5.5 mm coupons where, instead, the two ligaments are being fractured. Figure 15a,b shows the microscopic fracture modes resulting from delamination crack growth emanating from the vicinity of the hole towards the tabs (the arrows designated the growth direction). The fracture of the epoxy resin exhibits a “v” type fracture (see arrows) which indicates the direction of growth very similar to chevron-type cracking in semi-brittle materials. The alternate delamination growth and arrest mechanism may be related to such a type of quasi-brittle fracture, similar to the pop in phenomenon during a fracture toughness test of metallic materials with the same mechanical behavior.

3.2.2. Notched Coupons in Tension

Figure 16a–c illustrates the mechanical response of notched coupons with various notch depths with the same notch radius (0.25 mm). Figure 16a displays the stress–strain curves for the notched coupon with 1 mm, in comparison with an unflawed one (the strain gauge was located at the center between the two notches). Almost no effect is noticed on the Young modulus and the fracture stress. However, when inspecting the displacements (Figure 16b,c), the stress–displacement relationships are characterized by three regions (see also the inner figure): (1) Up to around 250 MPa, the coupons exhibit the same stiffness with a smooth curve. (2) The change in the slope is accompanied by small stress drops of up to approximately 1000 MPa, with higher stiffness for the larger notch. At the end of this stage, significant stress relaxation is observed, followed by an additional stress relaxation with further loading, as shown in Figure 16b (the curves were shifted by approximately 0.2 mm to emphasize the relaxation phenomenon). (3) As the second stress relaxation occurs, the slope changes slightly until the final fracture, indicating damage accumulation. This mechanical behavior can be explained by the macroscopic fracture modes, as given in Figure 17. The first change may be related to microscopic damage at the interface fiber/matrix, which increases up to a macroscopic delamination growth in the vicinity of the tip notch radius, which alters the opposite notch as the load increases. As for the holed coupons, the result of both delamination cracks in two ligaments carries on the progressive load until fracture (Figure 17a,b). However, in notched coupons, only two/three events appeared, which led to catastrophic failure, as compared to holed coupons where multiple events occurred before the final fracture. This difference is also expressed by the higher value of stress relaxation for the notched coupon, as compared to the holed coupon. The change in the mechanical behavior and fracture sequence between both defected coupons will be discussed later on. As for the holed coupons, the fracture stress is almost unaffected by the notch depths. For most coupons, the delamination crack develops at the tip radius (see Figure 17c). Table 5 summarizes the mechanical properties of the various coupons. As listed, the first stress relaxation increases as the notch depth increases, while the fracture stress is almost unchanged.

3.2.3. Coupons with Holes in Compression

Figure 18a,b presents stress vs. displacement in the compression mode with increasing hole diameter from 2.5 mm to 5.5 mm. The mechanical response is characterized by elastic behavior (Figure 18a) similar to that observed in the un-holed coupons. Minor stress drops were noticed, which intensified as the hole diameter increased (Figure 18b). This behavior is similar to that observed in the tensile mode as a result of delamination growth parallel to the applied load. This mode of fracture is well presented in Figure 19a–d where, in the case of the 5.5 mm coupon, the final fracture was ended by two parts resulting from delamination extension up to the end of the tabs (Figure 19d). The first stress fracture relaxation, the ultimate nominal stress, and the fracture pattern is almost unaffected by the hole diameter as listed in Table 6.

3.2.4. Coupons with Holes in Shear

The mechanical response of holed coupons in shear loading revealed that almost no changes were noticed compared to un-holed coupons and it was independent of the hole diameter. This trend was manifested by the same profile of the shear stress–strain curves, namely two consecutive stress relaxations were seen just after the entrance to the plastic region. In the case of the holed coupons, the shear strain was measured from both sides of the hole, while for the un-holed coupons, it was located at the center between the two notches. So, the comparison of the curves is only qualitative but the measured strains were useful for the FEA (see later on). The failure was not initiated at the holes, but the radii of the V-notches, similar to the un-holed coupons. The stress relaxations were related to the delamination crack growth from the notch in an alternate fashion (Figure 20a). Further loading caused extra stress relaxations being related to cracks initiated from both sides of the hole, perpendicular to the loading direction (Figure 20b). As mentioned, the shear stress value, which represents the first noticed load relaxation, was not affected by the presence of a hole diameter, so the shear stress in Table 7 is an average value of the whole holed coupons. Two sets of holed coupons were tested, one with two layers bonded and the second one bonded only at four points close to the edges of the coupons. The bonded set exhibited a significant standard deviation with the average close to the un-holed coupons, while the “un-bonded” set displayed a smaller standard deviation; however, the average value was lower than for the un-holed one. Both results indicate the problematic aspect of the bonded procedure in both methods, which was documented by the metallographic study as well as by the stereographic microscope. These results encourage us to test coupons with one layer with and without holes, results which will be discussed later on.

4. Discussion

Wonjin et al. [3] used statistical methods based on the inhomogeneity of fibrous materials, combined with an analytical method, to predict the tensile strength of UD fiber composites with given multiple fractures. The material used in their study was almost the same as in the present study (carbon fiber Toray T700 with 7µm fiber diameter, epoxy resin with 46% volume fraction, and the shear stress was approximately 60 MPa). Here, the volume fraction was 70%, while the shear stress was about 45 MPa. Using the predictive tensile strength for the optimal shear stress, as in [3], the strength in our study, taking into account the high-volume fraction, is very close to that predicted (2600 MPa, as compared to the 2780 MPa experimentally determined).
When considering the compression mechanical behavior, Nayeem et al. [24] developed a micromechanical model with attention on the matrix failure, since matrix failure occurs before fiber failure. This has been carried out by separating the stress–strain states in the matrix and fiber components from a representative volume element [25], which predicts failure at the fiber and matrix level by obtaining the volume-averaged stress state in the fiber and the matrix. Instead of taking the average stress state, Nayeem et al. [24], used the amplification technique to calculate the principal stresses and strains at several locations to identify a critical location, allowing the fiber and matrix failure to be examined in detail. This work predicted the shear failure mode in compression at 90°, whilst as the fiber orientation decreases towards 0°, shear buckling developed at kinking angles, as was also suggested by Tsuyoshi and Kazuro [8]. In the current study, the two extreme modes were observed and the kink angle was around 17°, whilst [8,26] observed 27° for a different matrix, and volume fractions as also observed. One can follow the mentioned research and predict the compressive strength based on the kink angle.
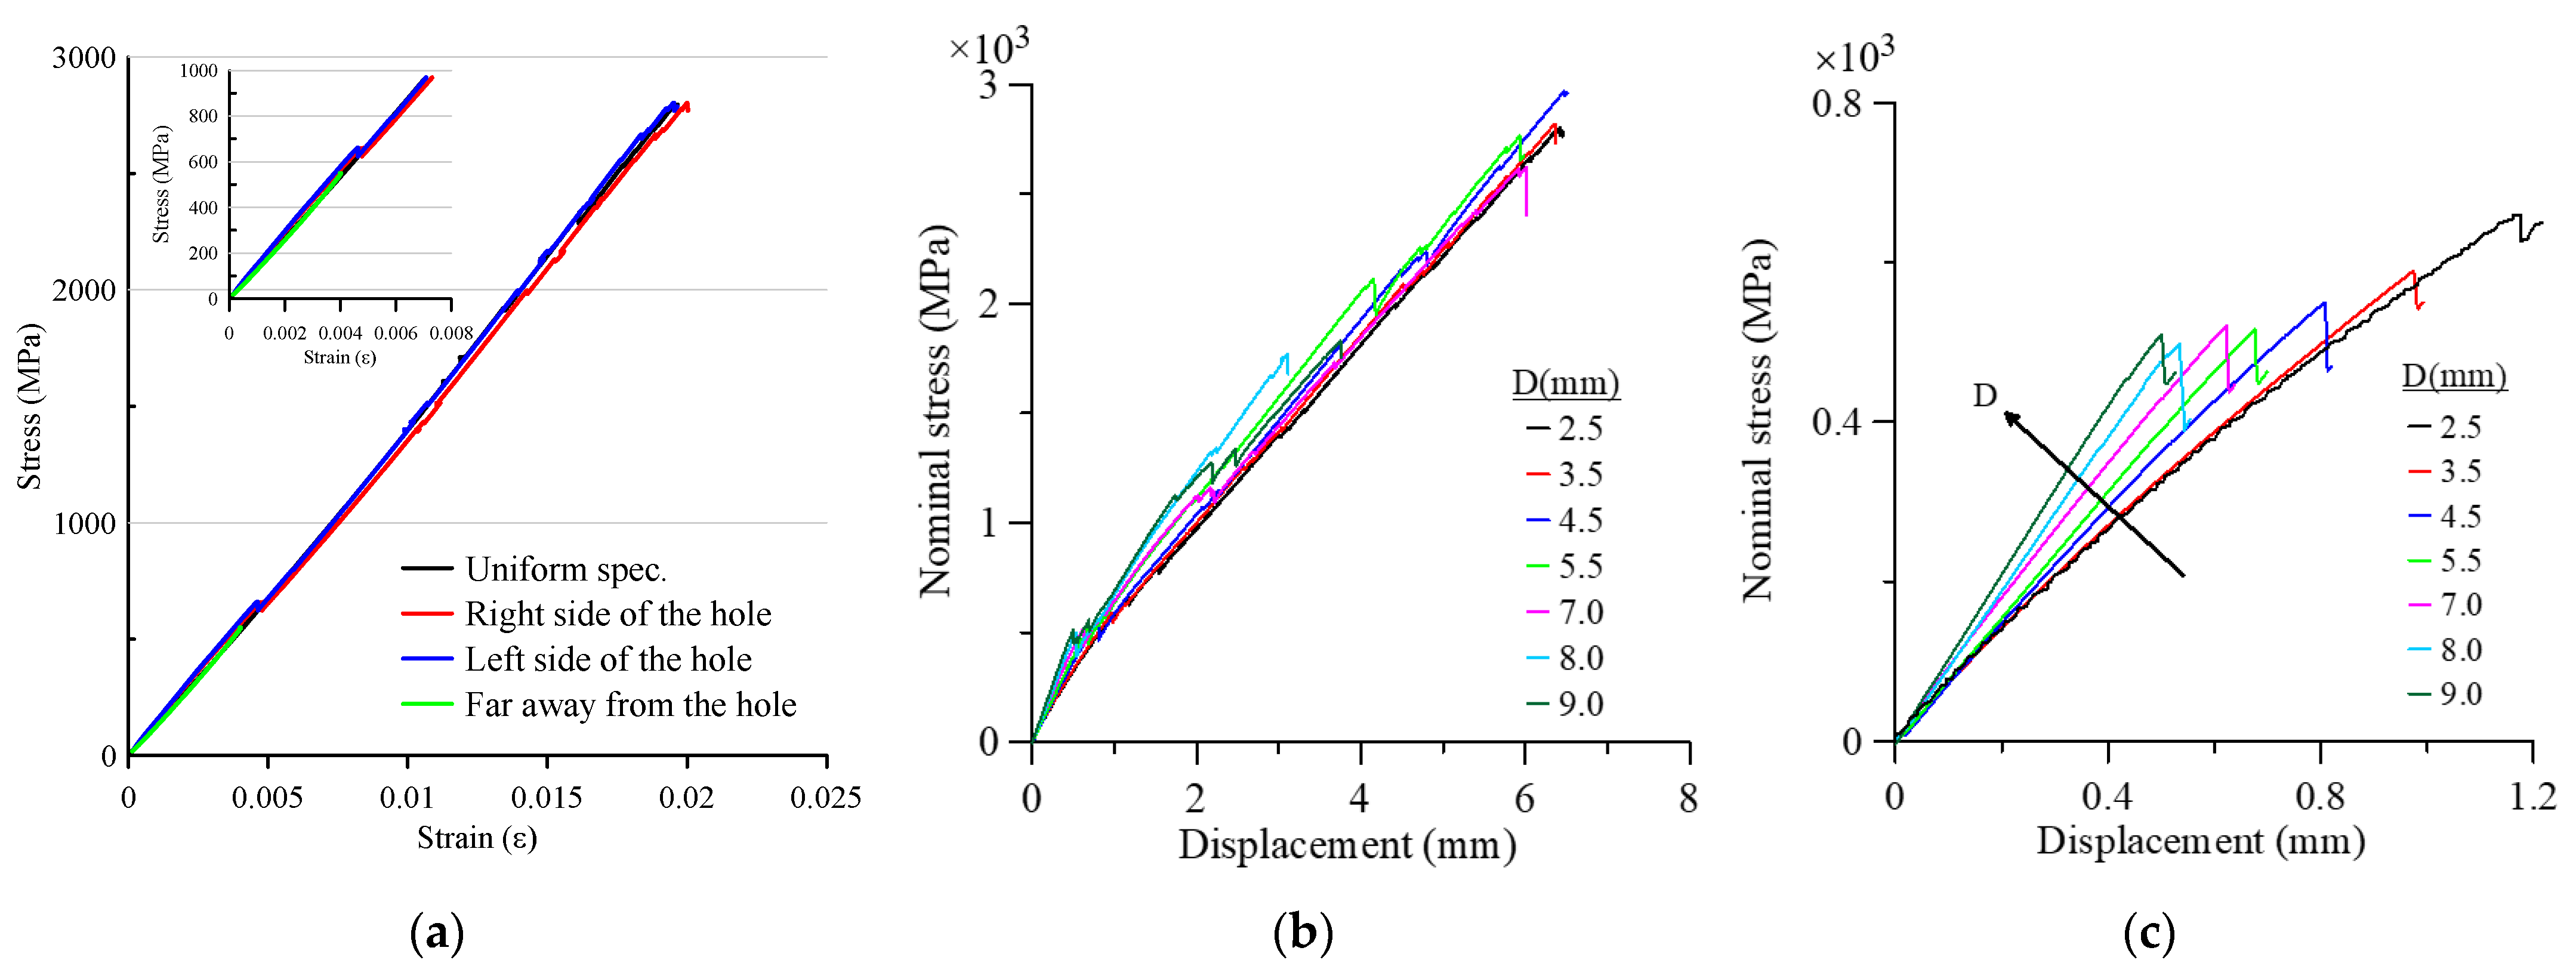
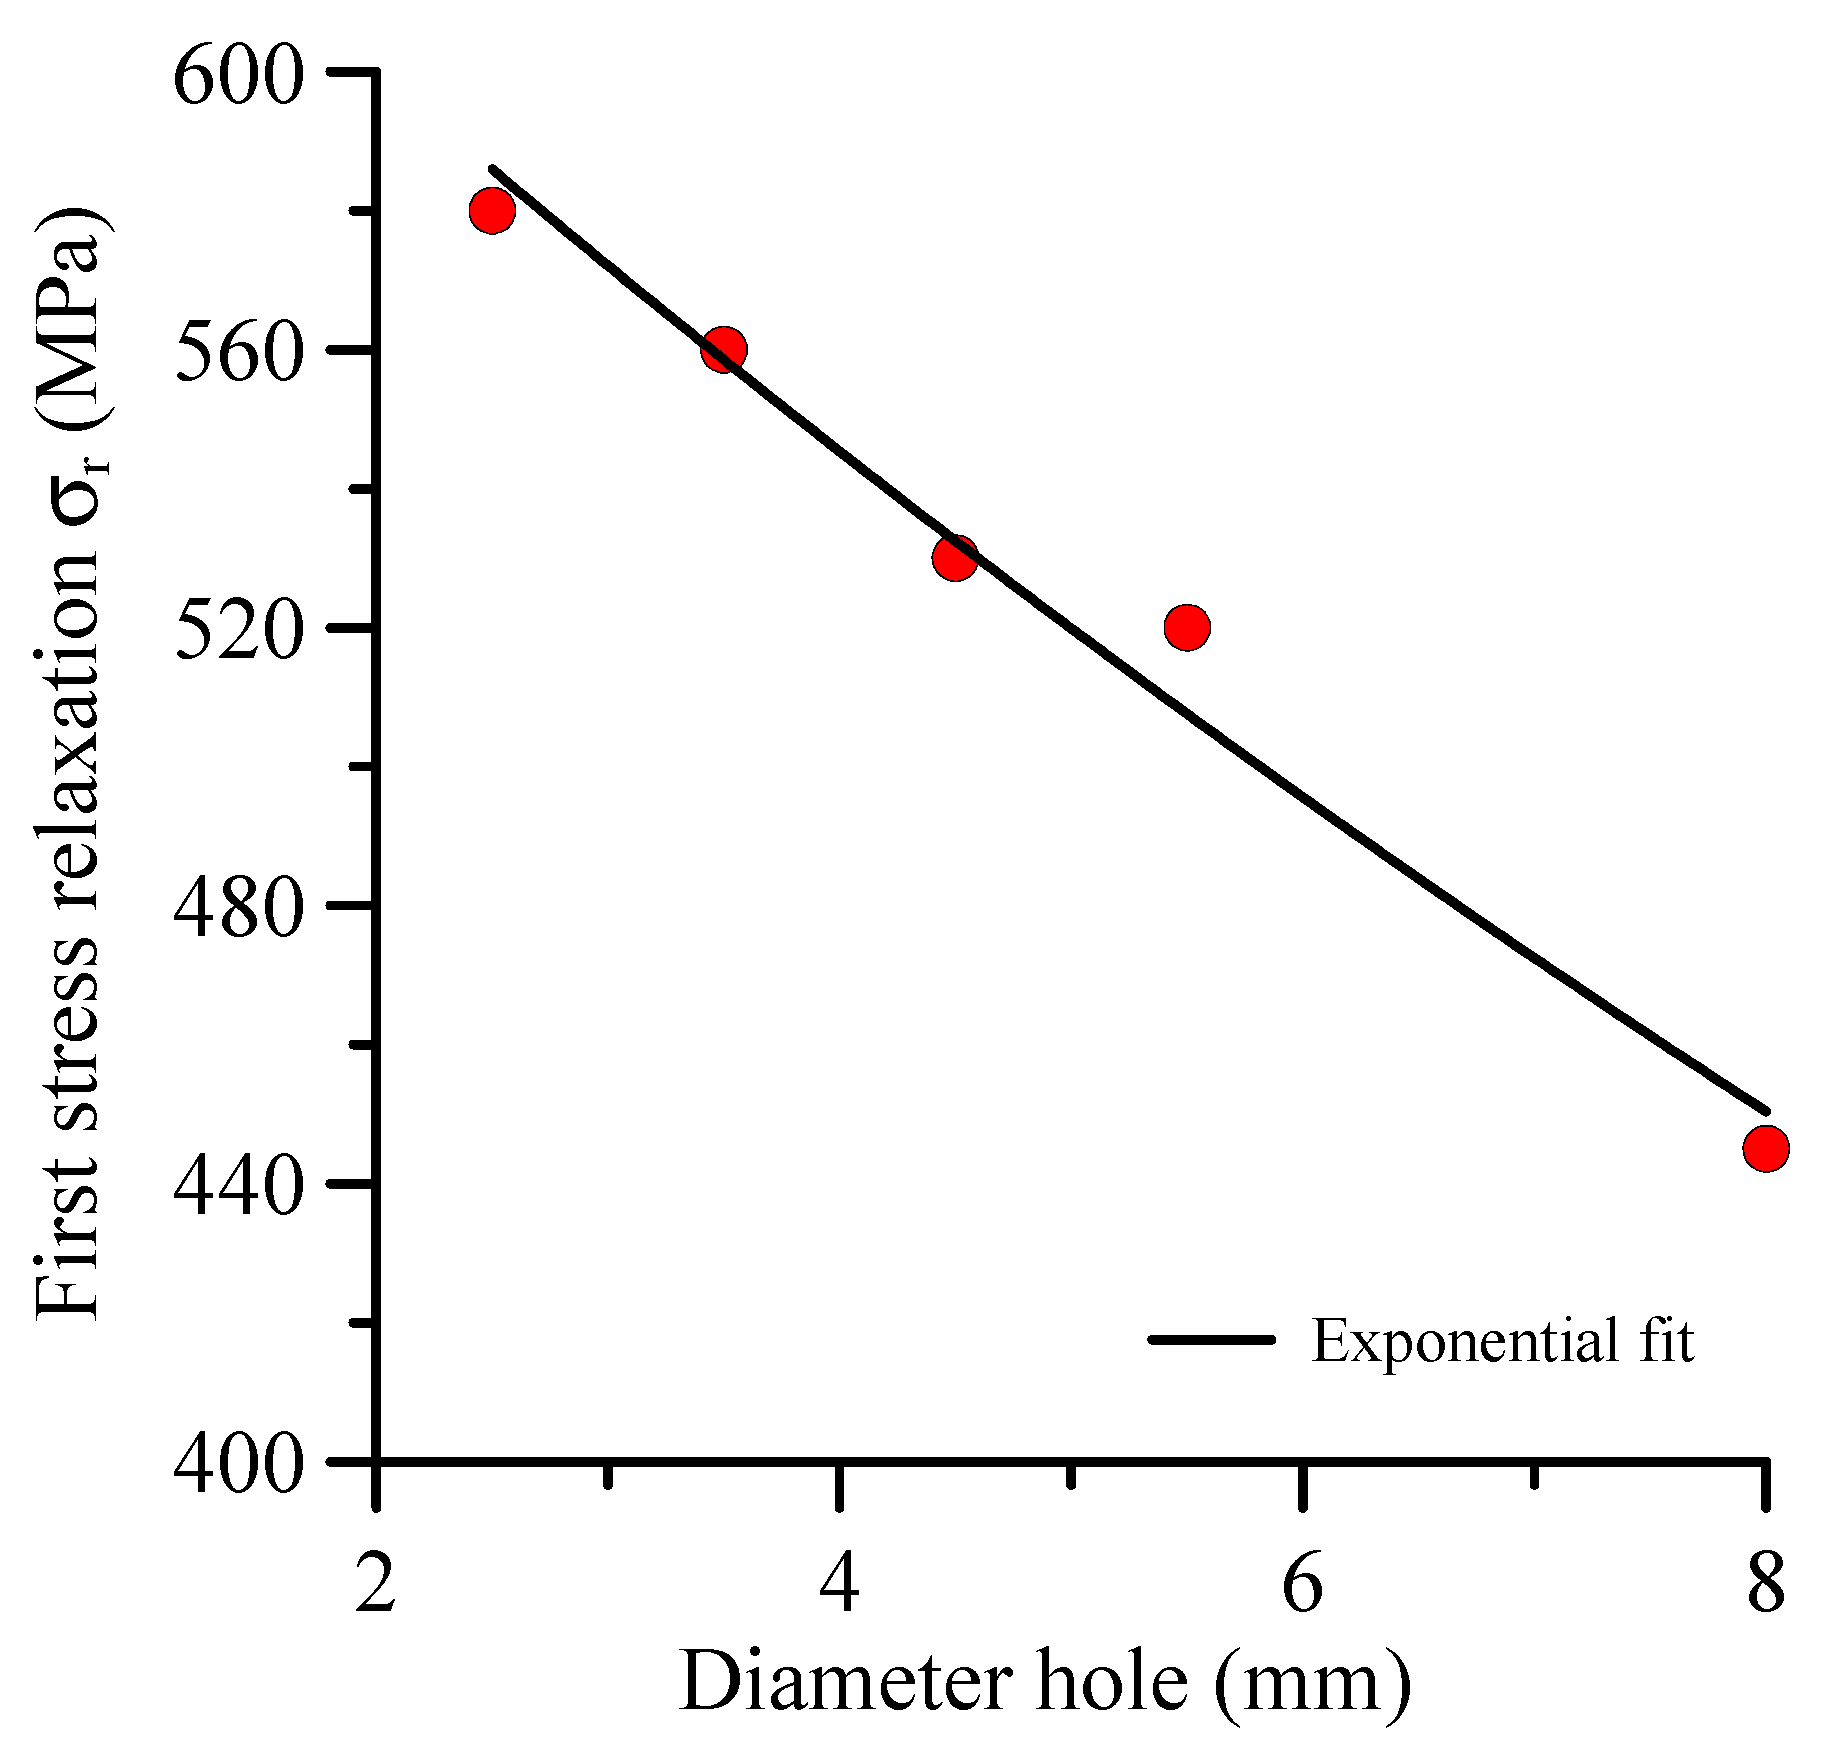
Referring to the effects of the presence of various diameter holes and different notch depths, with a fixed notch radius of 100 µm, Figure 21 illustrates the degradation in the mechanical response in terms of first stress relaxation, σr, due to splitting phenomena, and the nominal fracture stress based on the net section. The σr represents localized properties influenced by the epoxy resin and interface fiber/matrix properties, and the nominal fracture stress represents remote properties affected by the composite layup and fibers. As shown in
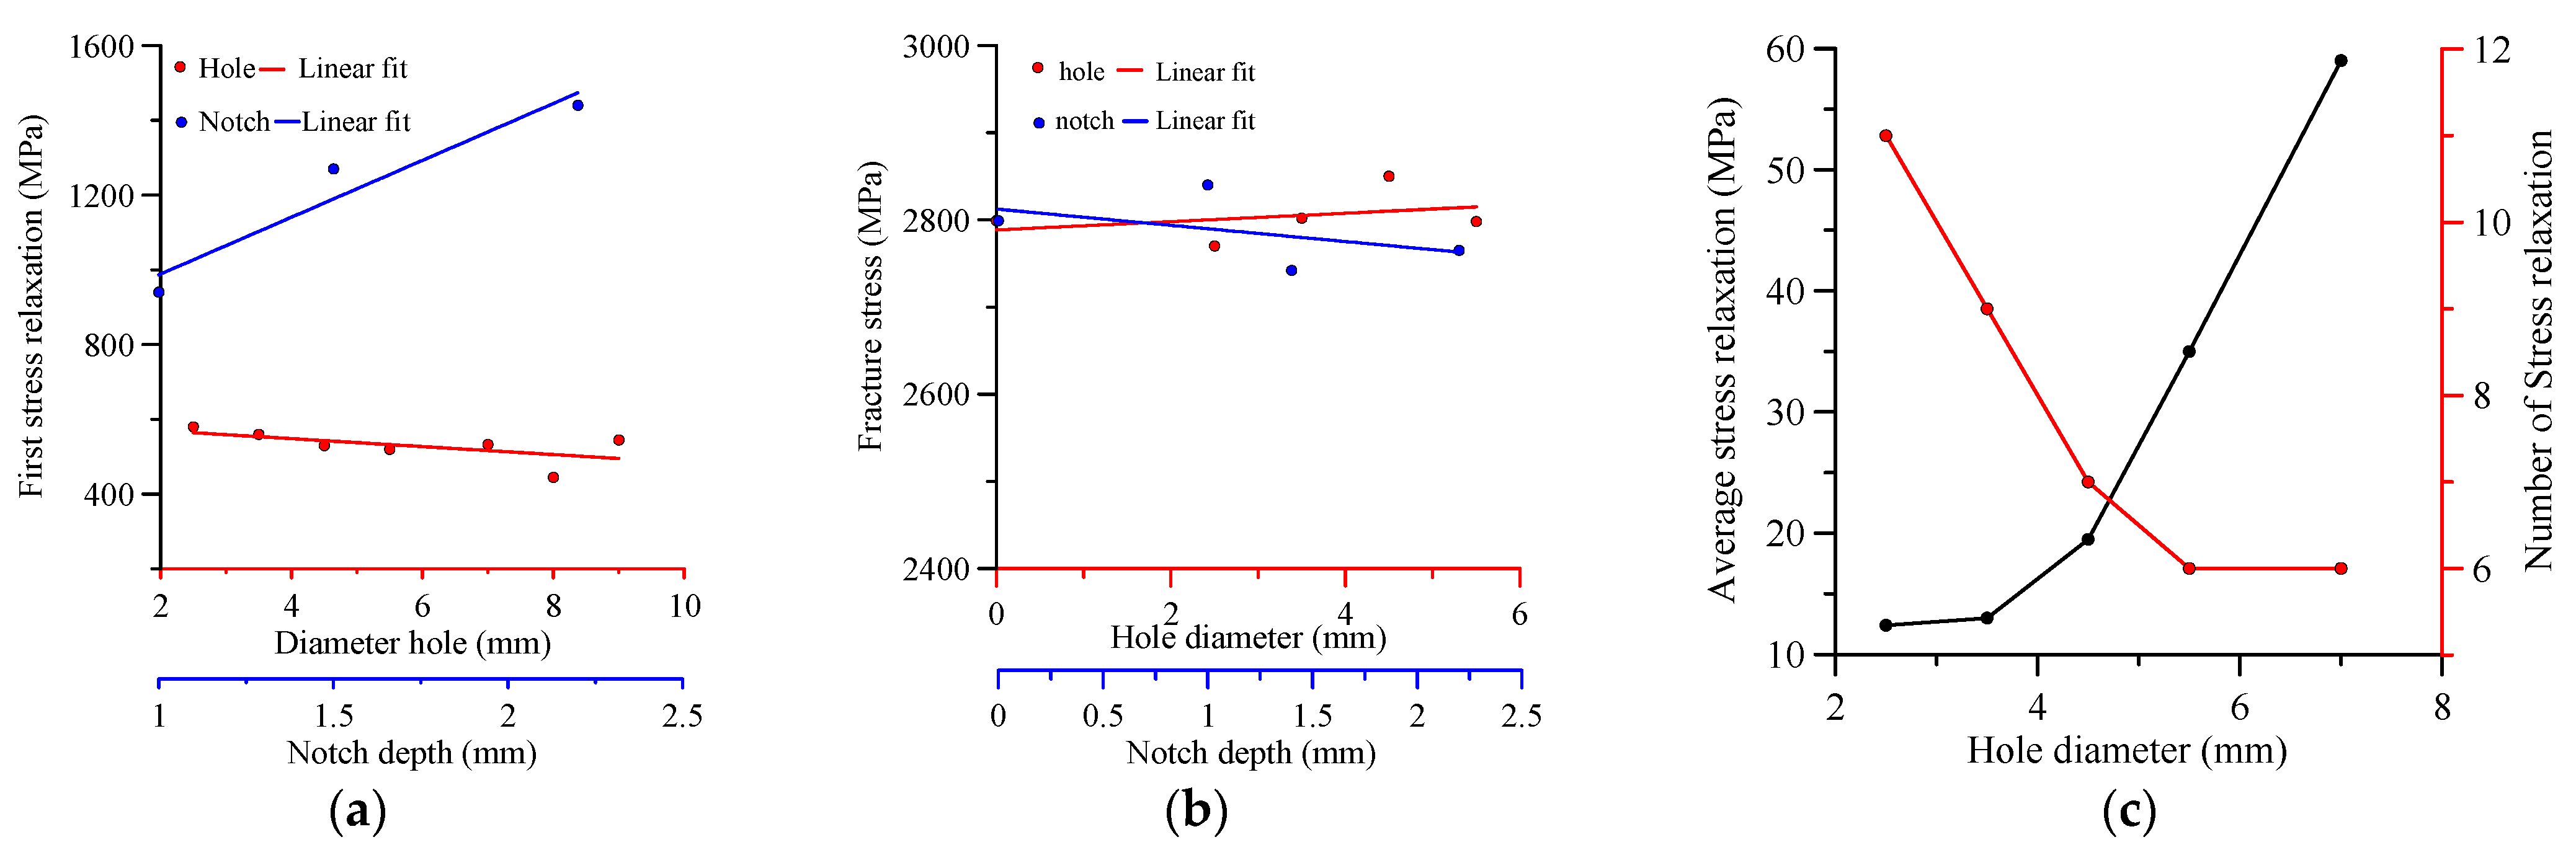
 Figure 21a, σr value decreases moderately as the hole diameter increases, while for the notch, it increases significantly as the notch depth increases. The nominal fracture stress is almost unchanged with diameter, while for the notch, it decreases slightly (Figure 21b). In addition to the mechanical degradation shown in Figure 21a, as the hole diameter increases, the amount of the stress relaxation increases, in addition to the number of stress drops decreasing (Figure 21c). Actually, these findings confirm that as the hole diameter increases, the degradation in the strength increases. In the case of a notch, the number of stress drops is almost the same, with a slight increase in the amount of stress relaxation with the notch depth. In a unidirectional laminate, it is known that failure initiating at the tip of a discontinuity (hole or notch) propagates along the fibers, as shown clearly in the current research. Such a cracking mechanism is known as a split. The problem of a transverse notch in a unidirectional laminate was first analyzed by Cook and Gordon [27] who noted that the propagation along with the fiber at the tip of the notch occurred due to the shear stress concentration. They also argued that the initiation of split was caused by the transverse stress σy, which reduces to zero immediately after initiation as there can be no stress normal to the free surface. The problem of unidirectional laminates was analyzed by Zweben [28], by making use of shear lag assumptions. He was able to successfully predict the fiber load concentration factor and initiation of matrix failure near the notch tip. Mar and Lin [29] have experimentally studied the split initiation and have argued in favor of shear stress being responsible for split initiation. By using woven construction fabric, which has a natural resistance to splitting. Due to the interaction of the fibers at the crossovers, this represents a barrier to a crack in the matrix running and causing catastrophic failure.
There is a clear difference between compression and tension in both uniform and holed coupons, as summarized in Table 8. The fracture stress in compression is about 40% of the tension for the 0° coupons; however, in the 90° coupons, it is more than three-times the tension value. The modulus and the fracture strain are higher for the 0° coupons under tension, compared to compression, and the trend is reversed for the 90° coupons. This dissimilarity between tension and compression for the 0° orientation is related to the micro-buckling, or kinking, in 0° plies, a phenomena which developed during the compression mode, as illustrated in Figure 6d and mentioned by [8]. In the case of the 90° orientation, where no kinking is observed, the properties in the compression mode are higher, as compared to tension.
For holed coupons, the fracture stress in the 0° coupons does not change with the presence of holes, no matter the diameter dimension or the loading mode. However, in the pre-failure phenomena, some changes can be pointed out: (1) The value in compression is slightly higher than tension (700 MPa compared to 640 MPa for the smallest diameter); (2) A moderate decrease in the pre-failure stress is obtained in compression, compared to tension, which indicates the sensitivity of this value to the mode of loading; (3) A large number of stress relaxations (more than six, and up to 10) is observed, compared to two in compression, in spite of the increase in hole diameter; (4) The amount of stress relaxations in compression is almost constant at about of 5–7 MPa, compared to tens of MPa under tension; (5) The two events in compression are apart from each other by about 100 MPa without any effect on the hole diameter, compared to sometimes greater than 400 MPa and, alternatively, less than 20 MPa; (6) In terms of failure appearance, in compression, the two split cracks are in opposite directions, whereas, under tension, two delamination cracks were observed on both sides, leaving two ligaments on both sides of the hole.
The ASTM standard D7078 [21] cannot be used as is for the determination of the shear modulus of unidirectional composites, since a different modulus is obtained when using 0° coupons, compared to 90° coupons. The correct shear modulus was computed using high-order FEA (Stress Check by ESRD, St. Louis, MO, USA), as explained herein. By using the measured force F, displacement of the right (or left) edge Uy and shear strain γ in the center of the coupon, for the two orientations 0° and 90°, using FEA, one may determine the accurate value of the shear modulus. In the experiments, the applied force vs. the shear strain (F vs. γ), and F vs. displacement curves, are available; so, ∆γ and ∆Uy (as shown schematically in Figure 22a,b, respectively) are used to determine the modulus for a given ∆F in the linear behavior. A 2D plane-stress FE model that mimics the non-gripped region of the shear coupon is created, as depicted in Figure 22c. The mesh consists of a high-order (A high-order element allows to increase the polynomial order of the shape functions from 1 to 8 to monitor the error in energy norm – see Barna Szabo and Ivo Babuska, “Finite Element Analysis”, Wiley, 1991) triangle and quadrilateral elements. On the left boundary, a vertical displacement Uy = ∆UExp and horizontal displacement Ux = 0 is prescribed, whereas, at the right edge clamped boundary, conditions are prescribed. The Young modulus ELt and ETt and Poisson ratio obtained in the tensile experiments are assigned to all finite elements.
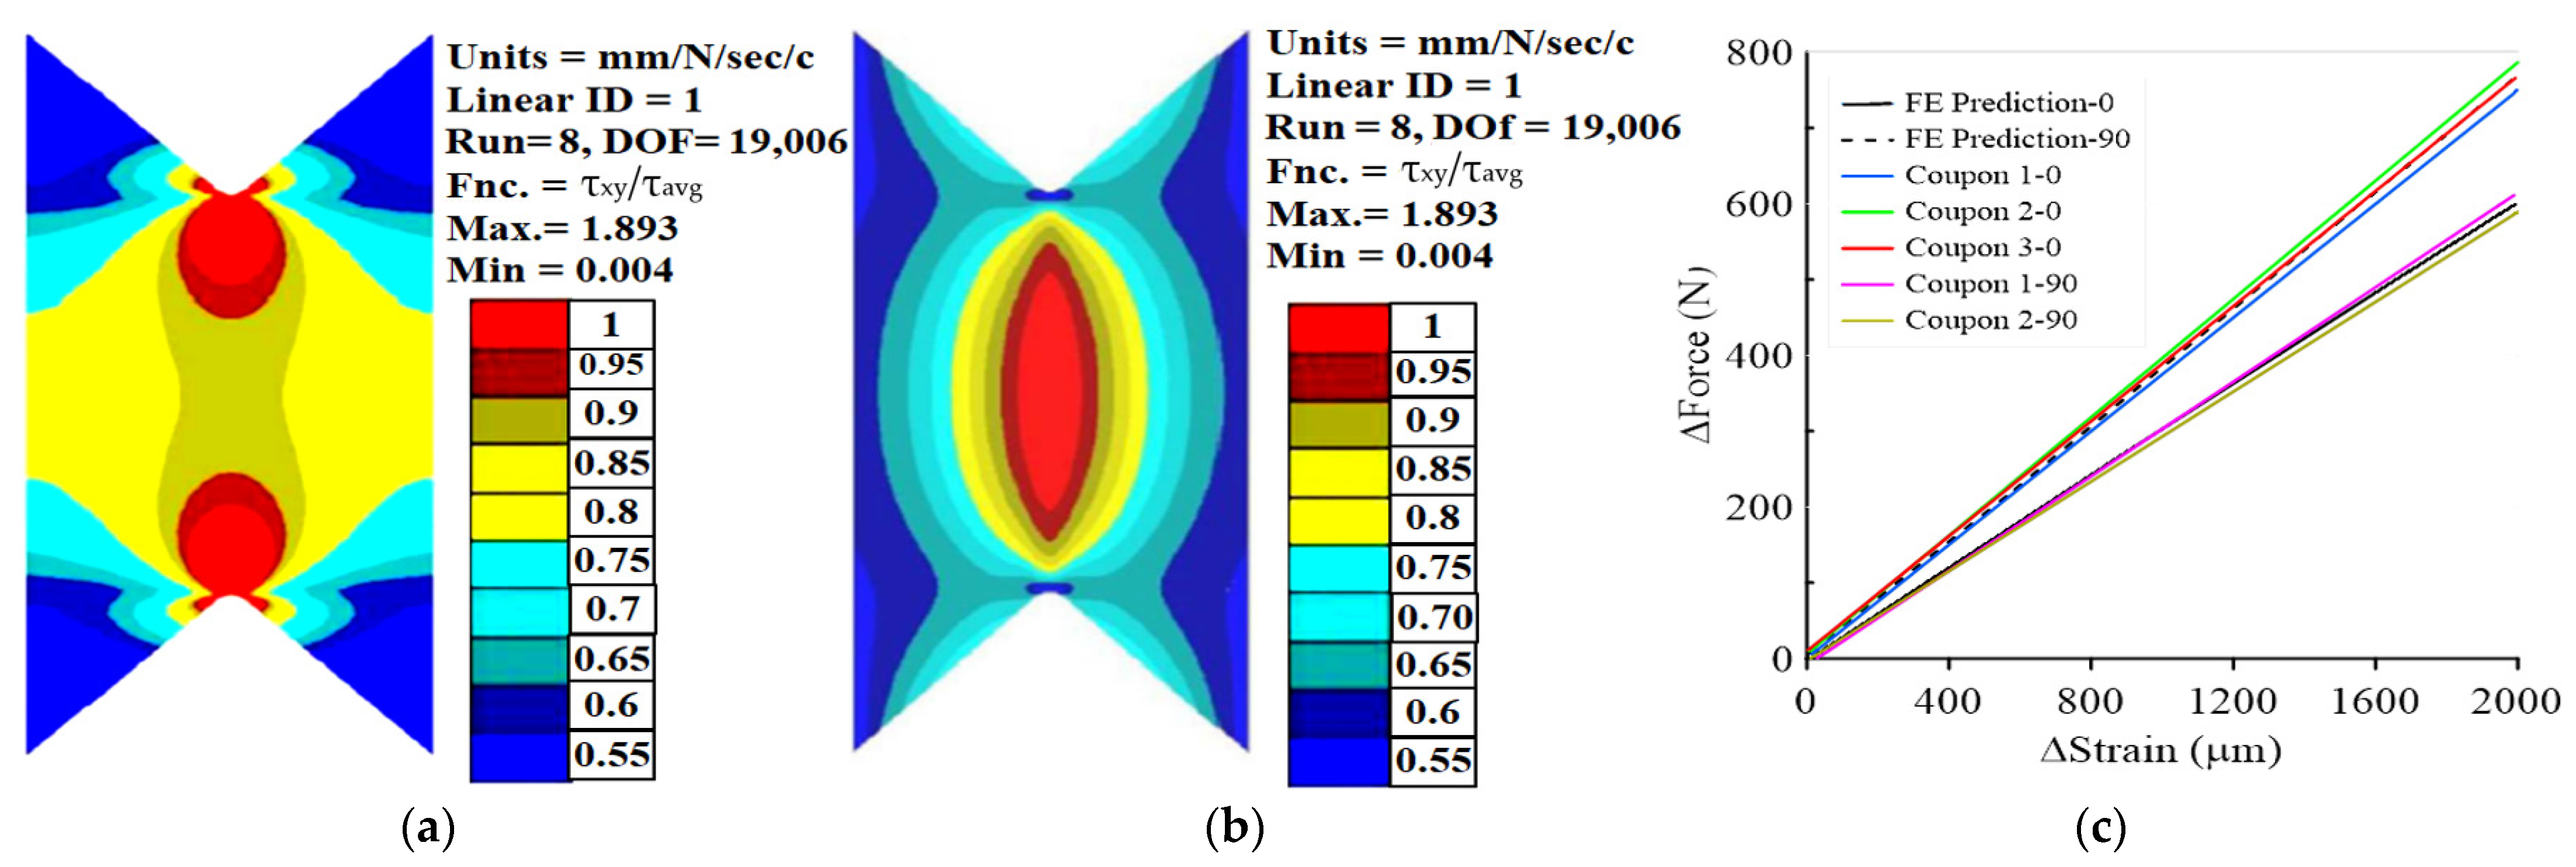
Eight FEAs were performed by increasing the polynomial degree of the shape functions in a hierarchical manner, thus ensuring that the numerical errors are under control and are less than 1% at p = 8. The shear stress computed by the FEA, normalized by the “average shear stress” (F/A), denoted by τxyavg, is presented in Figure 23a,b for 0° and 90°, respectively. The shear stress is not uniform for both orientations and significantly different. In the center region of the 90° coupon, the shear stress is larger by about 11%, compared to the average stress, while in the 0° coupons, it is 13% smaller. To determine the correct shear modulus, we first started with an approximation of the shear modulus G*LT that was assigned to the finite element model. By applying the displacements Uy = ∆UExp and computing ΔFFE on the left edge (integrating τxy along the left edge), we may inspect its value and also estimate the average shear strain Δγ*FE at the strain gauge location. Iteratively, one needs to correct the assigned value of G*LT in the FE model, so that the FE force fits the experimental one (linear analysis) and Δγ*FE strain is similar to the experimental value.
The correct shear modulus is the one that, when assigned to the FE model, the FE results of F vs. γ and F vs. displacement are obtained in the experiments for the two orientation coupons. Displacements were not measured during the experiments (this was not required according to the standard), so we found ∆UExp and G, by trial and error, having ∆F and ∆γ. Finally, the obtained shear modulus for the pultrusion was: GLT = GT L = 5.33 GPa.
To confirm the shear-modulus determination (a material property independent of the direction of the shear load), we used it to mimic the experimental observations of F vs. γ for the 0° and 90° orientations. One may note that the FE results with the determined GLT, fit well with the experimental results (Figure 23c). The different slopes in Figure 23c, for the same assigned shear modulus in the FEA, are due to the assignment of the longitudinal Young modulus along the 0° or 90° directions.
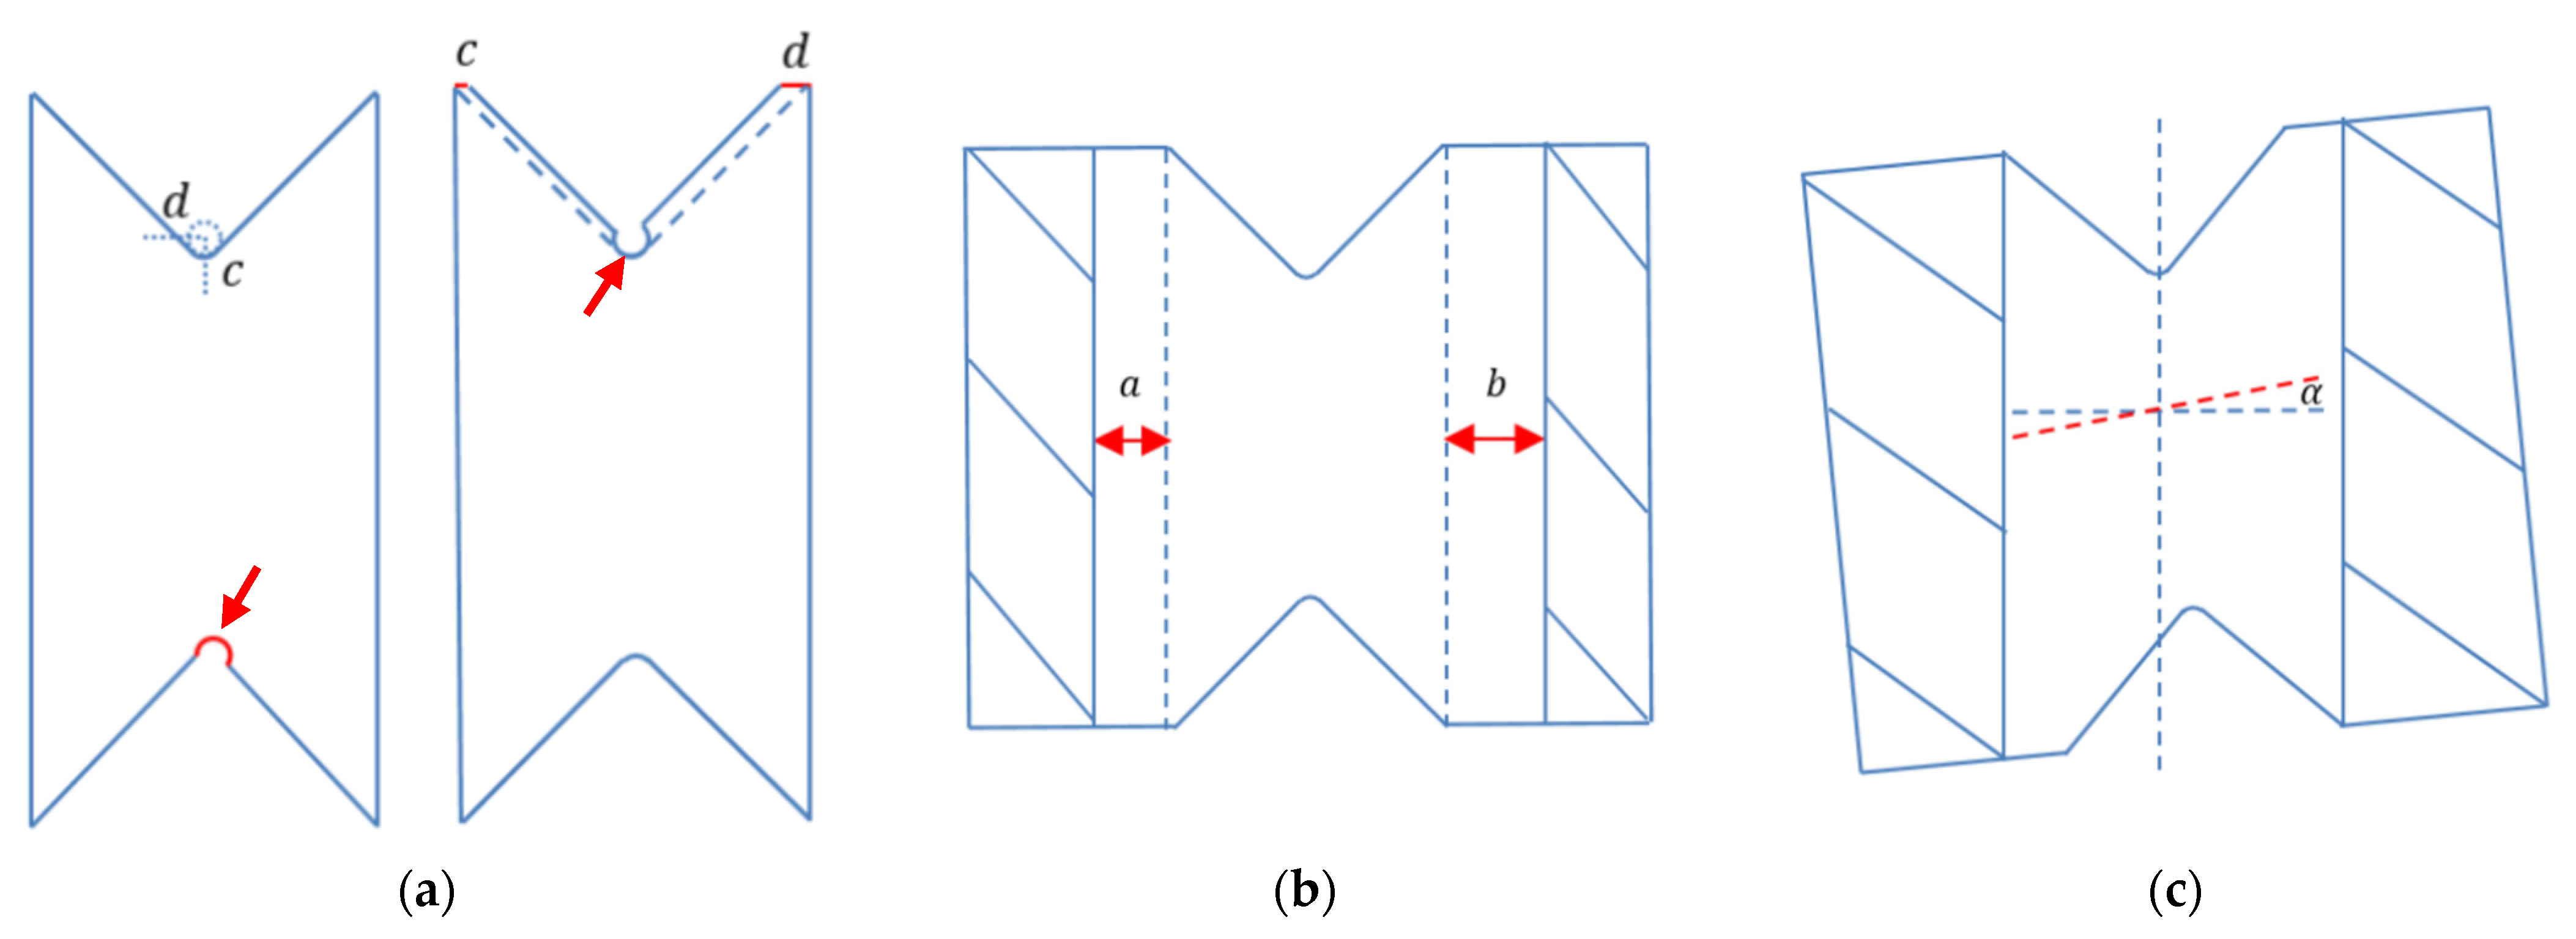
FEA was also applied to investigate the sensitivity of the ultimate shear stress due to defects related to manufacturing (Figure 24a) and inaccuracies associated with the experimental procedures (Figure 24b,c). Two extreme conditions of manufacturing imperfections are presented in Figure 24a. The FEA results demonstrated that both defects may have a large influence on σyy; however the change in τxy is less than 10%. The current study experimentally examined this issue for a smaller deviation, as shown in 
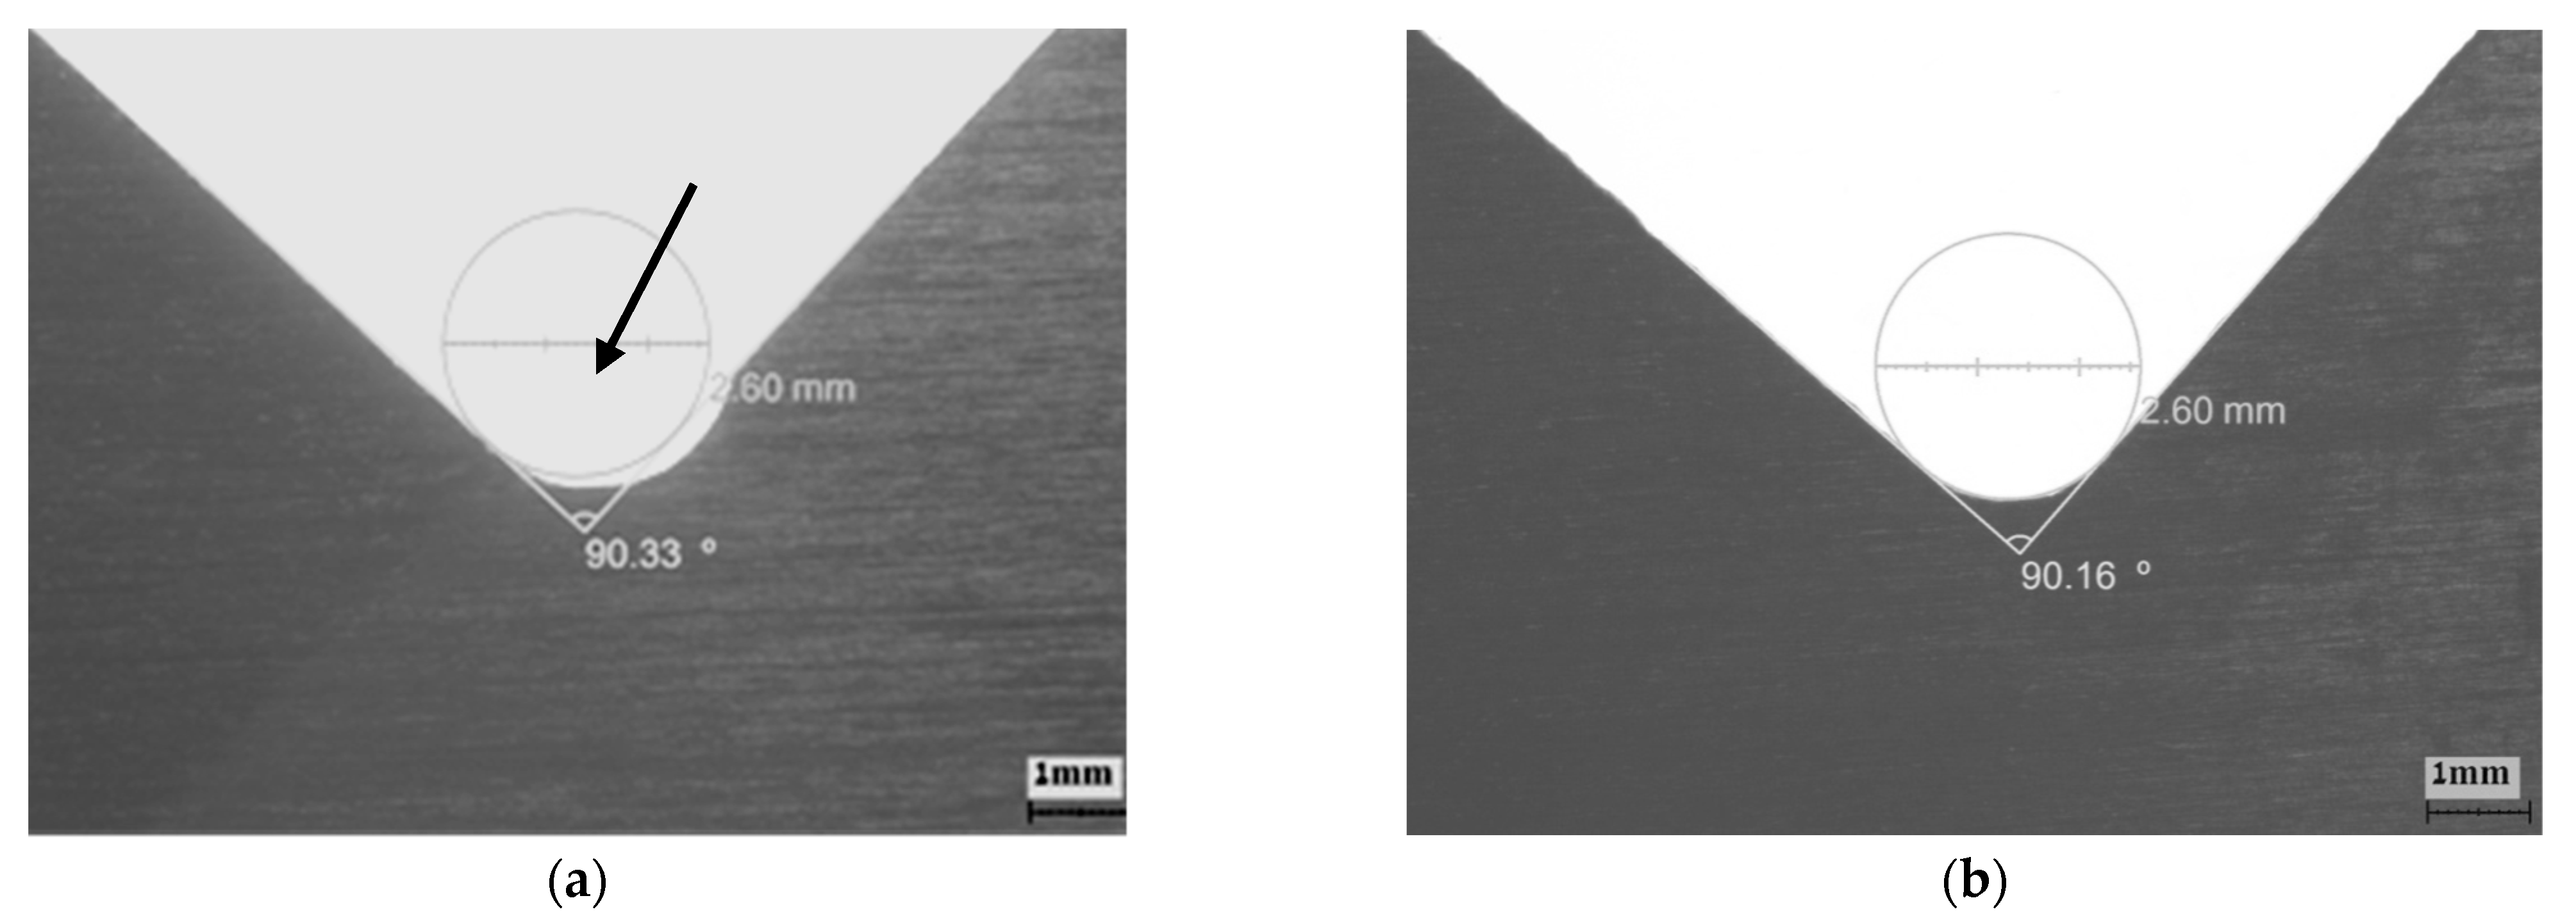
Figure 25a,b, for a perfect and defective radius, respectively, only for the 0° orientation. Table 9 summarizes the results for coupons of 1 mm and 2 mm thickness. As shown, the shear values are unaffected by manufacturing imperfections or by coupon thickness. In the condition shown in Figure 24b, FEA revealed that asymmetrical gripping of up to 3 mm does not change σyy or σxy. For the 3mm, an orientation angle from the load-line of up 2° decreased the τxy by about 7%, where for 1°, no change was found.
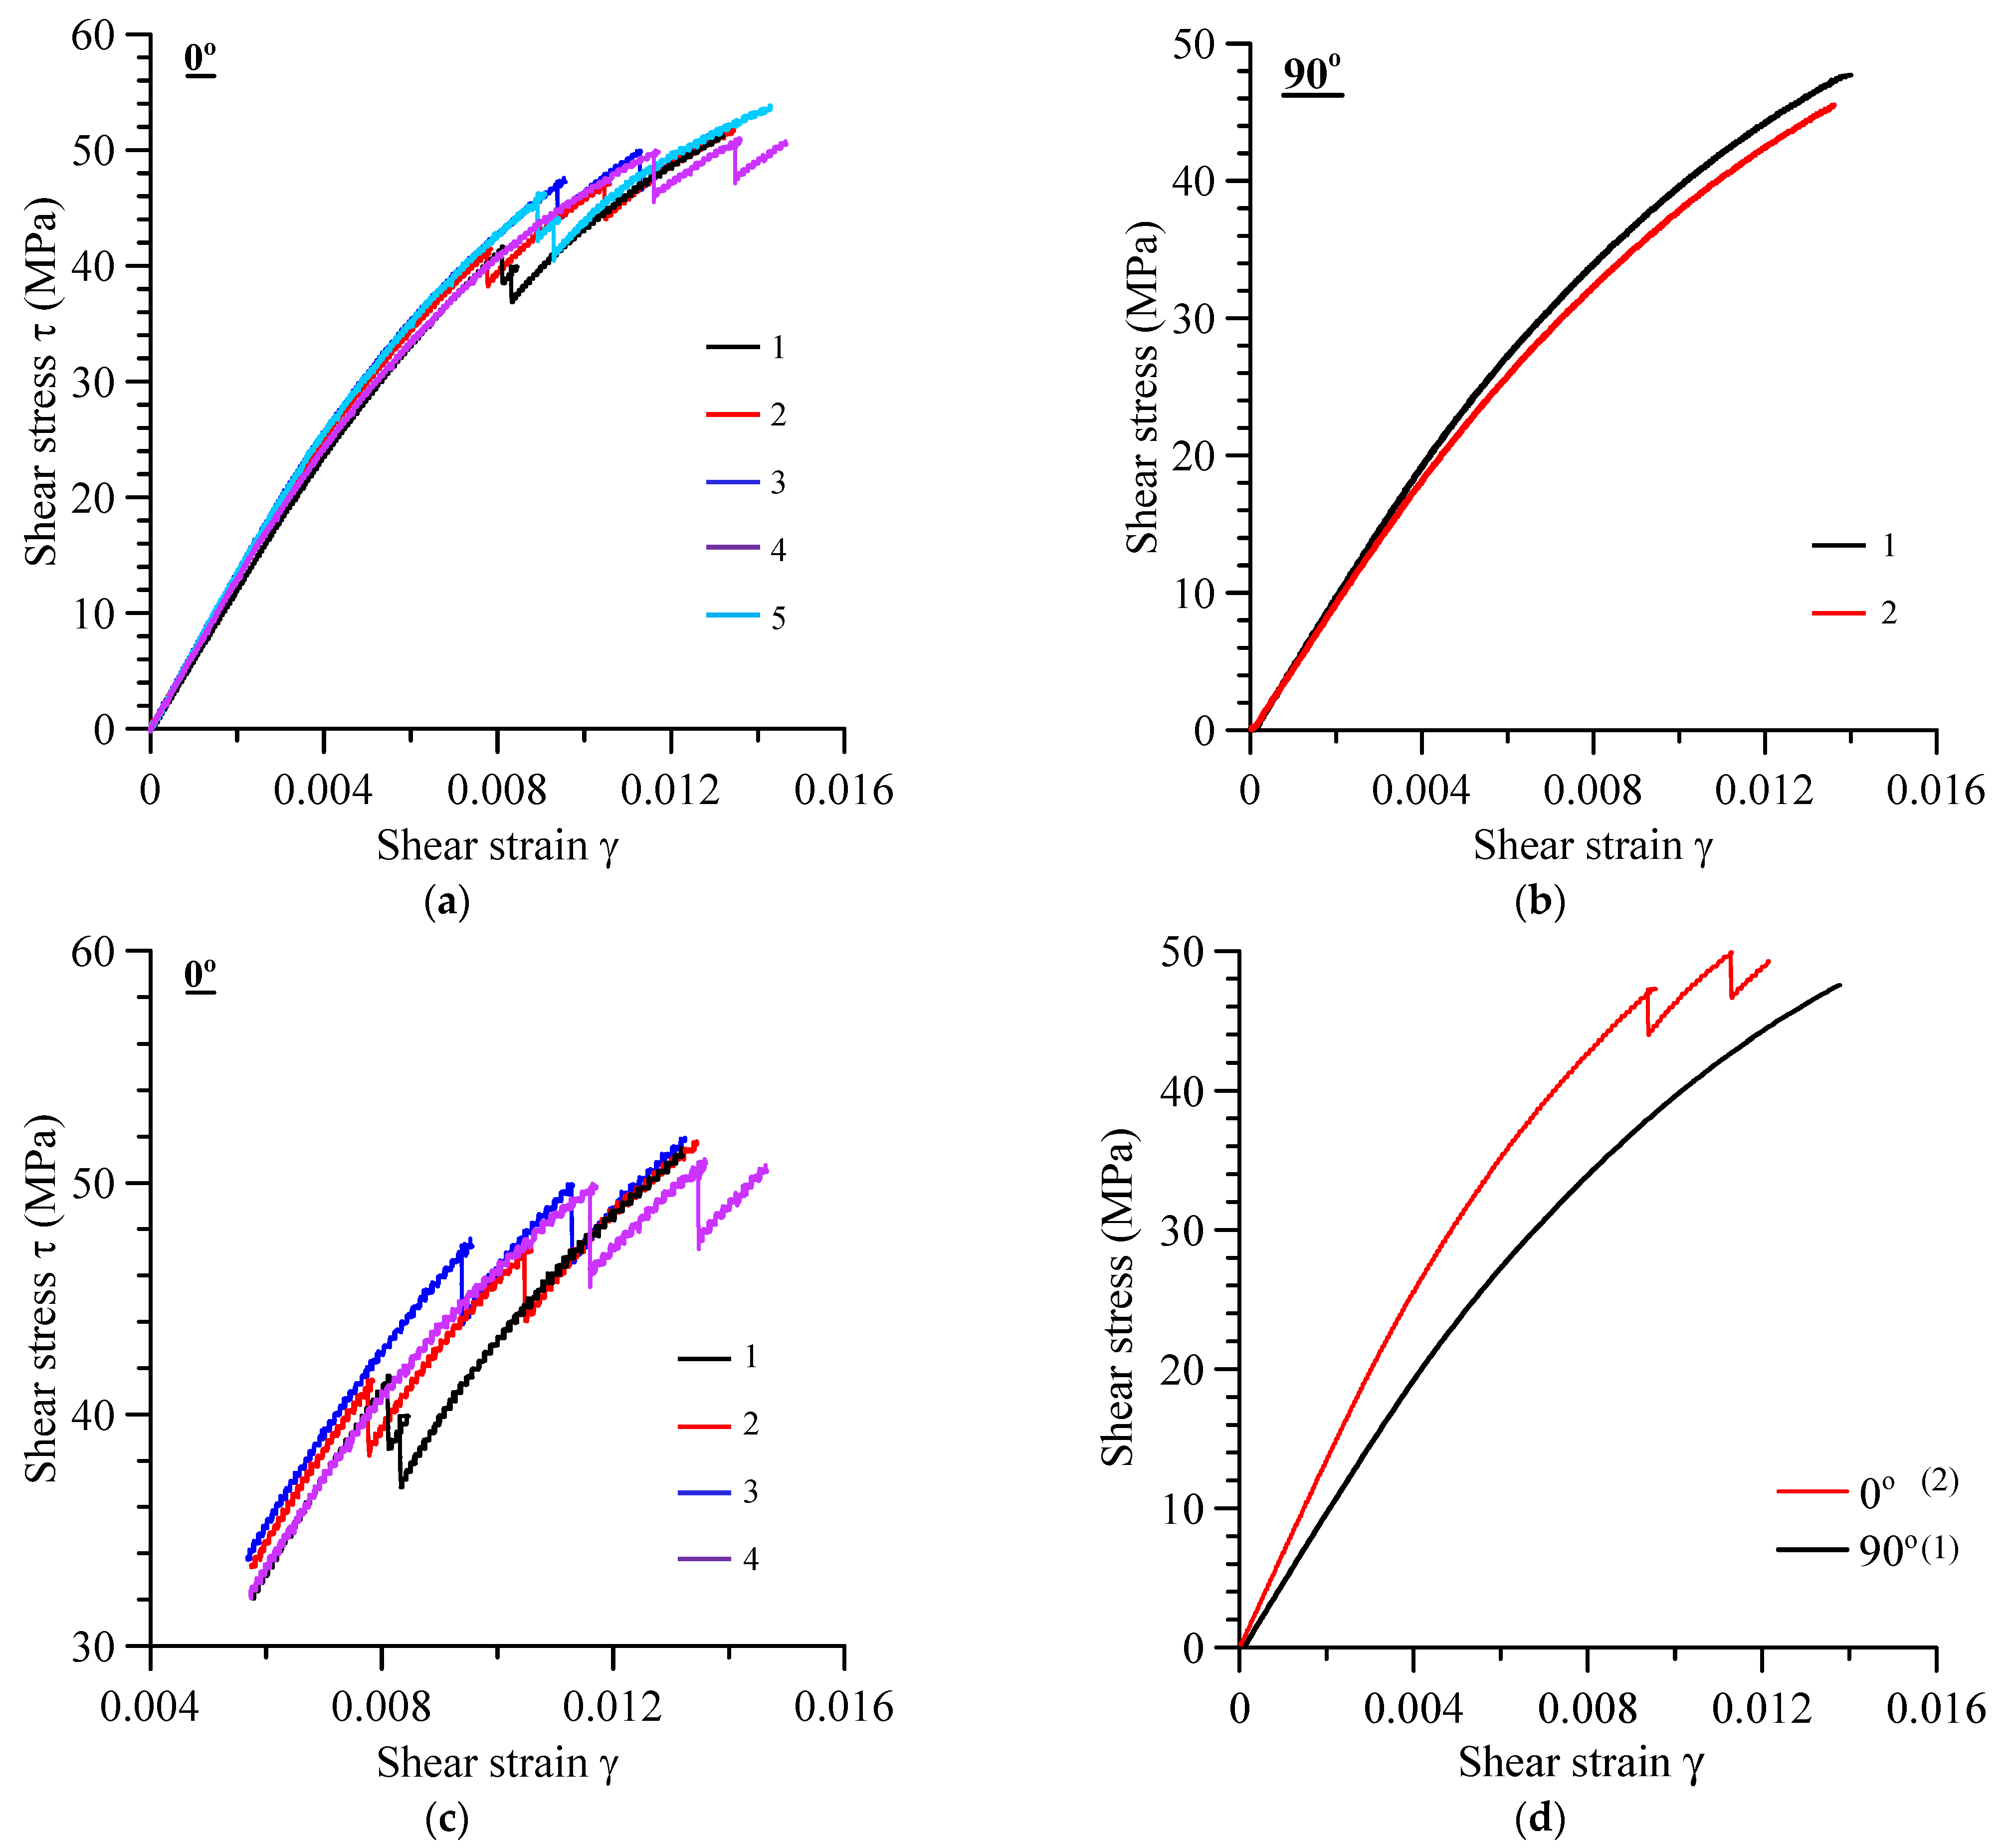
The experimental results, as well as the FEA predictions, follow the same trends as reported by Jinmen et al. [
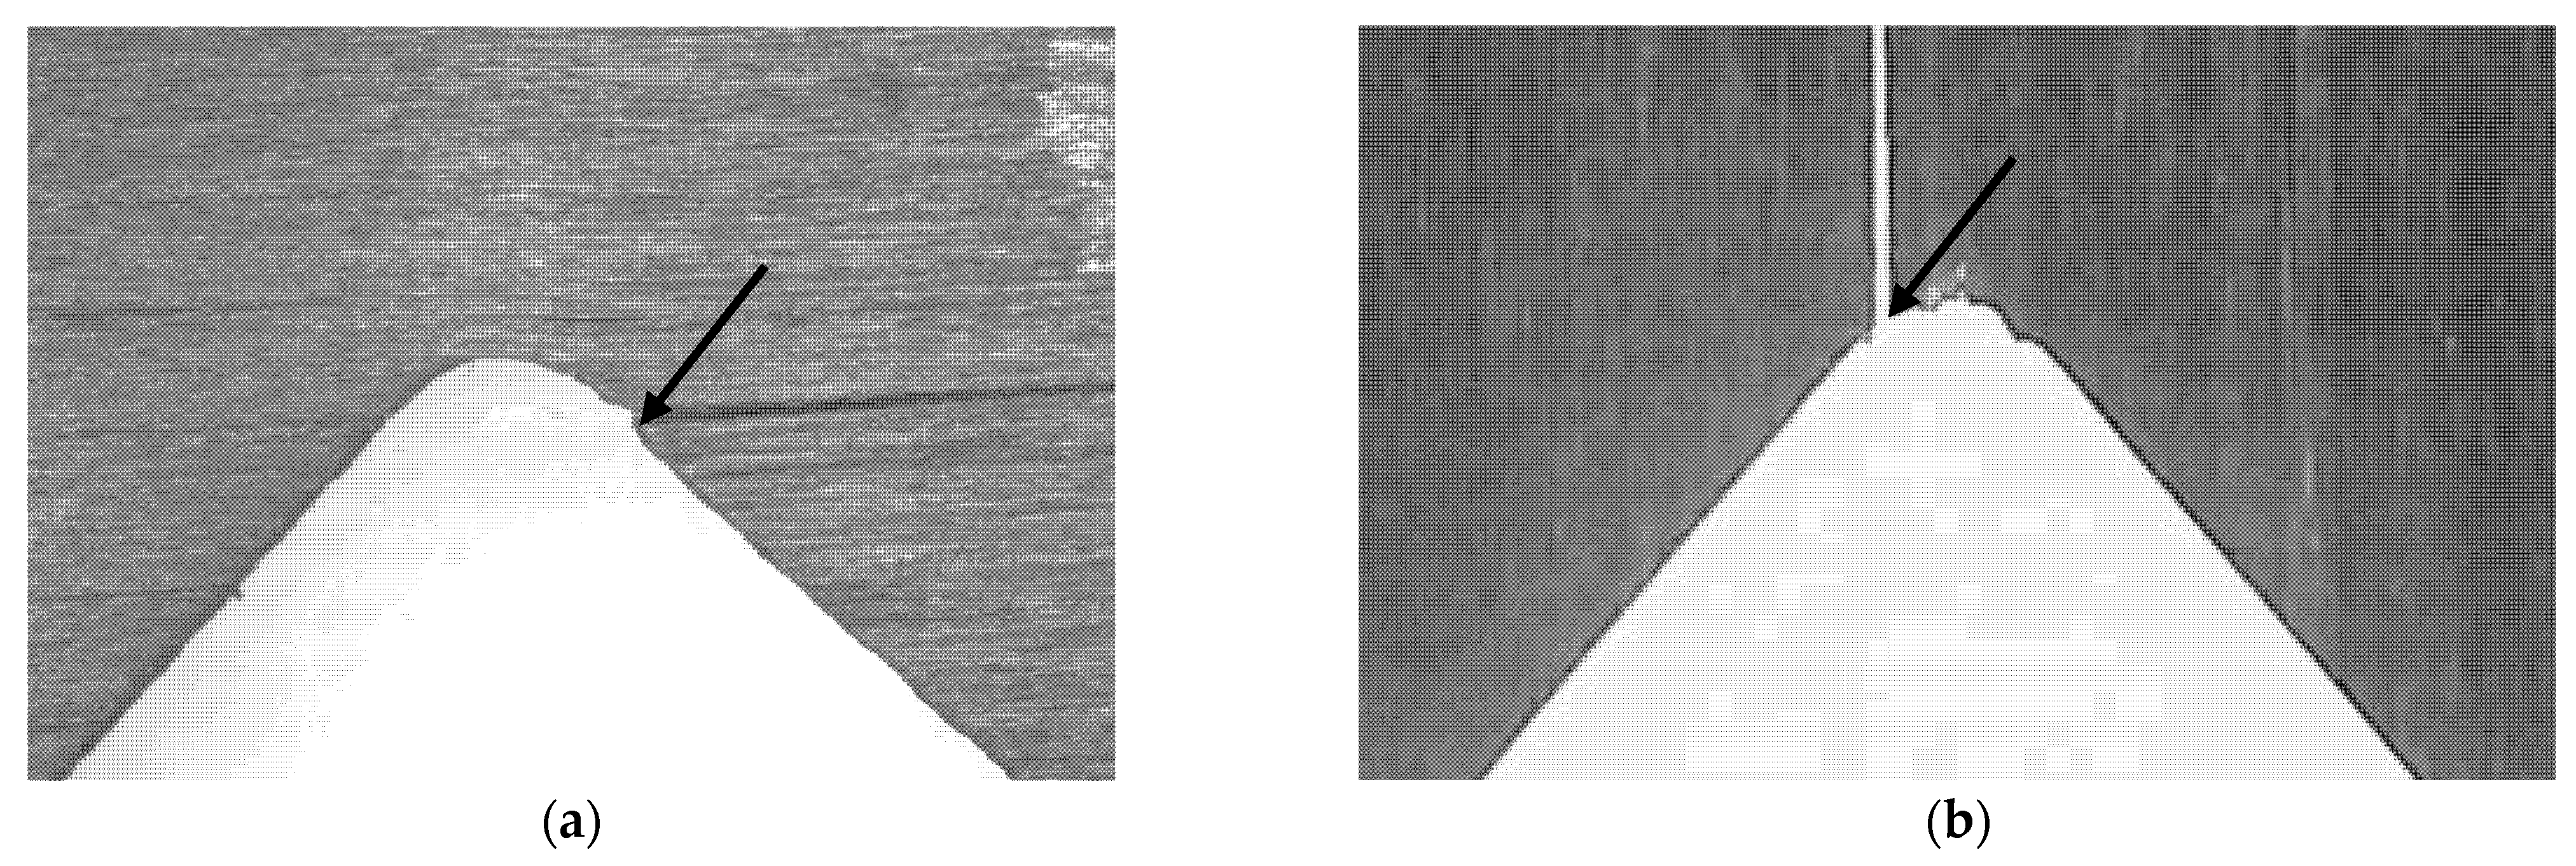
30], using the V-notch shear test for unidirectional hybrid composites. First, the mechanical response, in terms of stress–strain curves, is very similar for both orientations, namely two consecutive load drops for the 0° orientation and a continuous one up to fracture for the 90° orientation. Second, non-linearity is observed in the shear stress–strain curve for both orientations, starting from the lower level of shear strain (around 0.5%), the same order of magnitude as in the current study. They claim that this deviation is related to the initiation of micro-cracks or micro-damage, together with fiber instability at the notch root, rather than the plasticity of the epoxy which exhibits a shear yield strain range of about 6%. This argument is correct based on a preliminary study (not reported here) using the AE method which indicates other damage events instead of the deformation plasticity mechanism of the epoxy resin. Third, the location of the cracks in both orientations initiated at the intersection of the notch root and the straight flank, as in our study, is shown in Figure 9a,b. They confirmed this by FEA and showed that the maximum values of the stress components (σx, σy, τxy) occurred near the intersection point. Fourth, the values of the predicted shear modulus by FEA are independent of the orientation (5.07 GPa) as predicted here (5.37 GPa), as well the average shear modulus is higher for the 0° orientation as compared to the 90° one (6.8 GPa, 4.9 GPa, respectively), as observed here (6.6 GPa, 4.9 GPa). Moreover, they corrected the modulus by extracting the C factor using FEA and found the value for the 90° is close to the one predicted by FEA (5.34 GPa, 5.07 GPa). Here, we also found the same tendency based on FEA. This result is because the 90° coupons had better purity and uniformity in the shear stress distribution over the test region compare to the 0° coupons.
At last, some differences in the microscopic fracture modes of 0° and 90° were observed, which related to the state of the stresses at the notch root. Jinmen et al. [30] showed that for the 0° coupons, a mixed-mode prevails but is dominated by the opening mode, while the 90° orientation is dominated by the opening mode.
Finally, concerning the effect of the opening hole on the mechanical behavior in the shear mode for the 0° coupons, FEAs were performed mimicking the experimental results, showing the highest stress concentration in the vicinity of a notch and at a hole (Figure 26). Table 10 summarizes the results indicating that, as the hole diameter increases, the ratio of the maximum transverse, σyy, of the notch to the corresponding hole increases as well. The same trend was obtained for the shear stress ratio listed in Table 10. These results confirm the finding that the presence of holes in the double V-notch did not affect the shear stress or the shear-strain curve.

5. Conclusions

  • An extensive study on the material properties of pultrusion has shown that the Young modulus and Poisson ratio can be obtained with high repeatability, with a significant difference between tensile and compressive behavior in the 0° orientation (2800 MPa in tension and 1175 MPa n compression). This is attributed mainly to the kinking phenomenon, which is also the origin of the deviation from linear behavior.
  • We also showed that ASTM standard D7078 cannot be used in its present form to determine shear material properties for pultrusion, and a remedy using FEA was provided. In both orientations, approximately the same shear strength was detected (45 MPa for 0° and 47 MPa for 90°). The latter tendency is mainly related to the mechanical properties of the epoxy resin.
  • In the presence of holes, the remote fracture stress in the various modes of loading did not change significantly, as compared to uniform coupons; however, some localized delamination crack growth occurred at the vicinity of the holes, manifested by load drops up to the final fracture. This trend was also noticed in the case of tension of notched coupons.
  • FEA shows that the shear values were unaffected by manufacturing imperfections, coupon thickness, and by asymmetrical gripping of up to 3 mm, with a minor effect in the case of a small deviation from the load line. These trends were verified by selected experimental tests.

Author Contributions

Conceptualization, A.B., J.B. and Z.Y.; Data curation, S.L. and S.D.; Funding acquisition, J.B. and Z.Y.; Investigation, A.B., I.G., S.L. and S.D.; Methodology, Z.Y.; Resources, J.B. and Z.Y.; Software, S.L. and S.D.; Supervision, J.B. and Z.Y.; Validation, I.G., S.L. and S.D.; Writing—original draft, A.B.; Writing—review & editing, A.B. All authors have read and agreed to the published version of the manuscript.

Funding

The authors acknowledge “MAFAT” support, which made this research possible. No contract number is applicable.

Institutional Review Board Statement

Not applicable.

Informed Consent Statement

Not applicable.

Data Availability Statement

Not applicable.

Conflicts of Interest

The authors declare no conflict of interest.

References

  1. Ferreira, F.; Fernandes, P.; Correia, N.; Marques, A.T. Development of a Pultrusion Die for the Production of Thermoplastic Composite Filaments to Be Used in Additive Manufacture. J. Compos. Sci. 2021, 5, 120. [Google Scholar] [CrossRef]
  2. Shi, J.; Tong, M. Multi-Scale Nonlinear Progressive Damage and Failure Analysis for Open-Hole Composite Laminates. Aerospace 2022, 9, 59. [Google Scholar] [CrossRef]
  3. Na, W.; Lee, G.; Sung, M.; Han, H.N.; Yu, W.-R. Prediction of the tensile strength of unidirectional carbon fiber composites considering the interfacial shear strength. Compos. Struct. 2017, 168, 92–103. [Google Scholar] [CrossRef]
  4. Zhuang, L.; Talreja, R.; Varna, J. Tensile failure of unidirectional composites from a local fracture plane. Compos. Sci. Technol. 2016, 133, 119–127. [Google Scholar] [CrossRef]
  5. Sun, C.; Jun, A.W. Compressive strength of unidirectional fiber composites with matrix non-linearity. Compos. Sci. Technol. 1994, 52, 577–587. [Google Scholar] [CrossRef]
  6. Budiansky, B.; Fleck, N.A. Compressive failure of fibre composites. J. Mech. Phys. Solids 1993, 41, 183–211. [Google Scholar] [CrossRef]
  7. Argon, A. Fracture of composites, volume 1. In Treatise of Materials Science and Technology; Academic Press: New York, NY, USA, 1972. [Google Scholar]
  8. Matsuo, T.; Kageyama, K. Compressive failure mechanism and strength of unidirectional thermoplastic composites based on modified kink band model. Compos. Part A Appl. Sci. Manuf. 2017, 93, 117–125. [Google Scholar] [CrossRef]
  9. Yan, K.; Zhang, C.; Qiao, S.; Li, M.; Han, D. Failure and strength of 2D-C/SiC composite under in-plane shear loading at elevated temperatures. Mater. Des. 2011, 32, 3504–3508. [Google Scholar] [CrossRef]
  10. Totry, E.; González, C.; LLorca, J.; Molina-Aldareguía, J. Mechanisms of shear deformation in fiber-reinforced polymers: Experiments and simulations. Int. J. Fract. 2009, 158, 197–209. [Google Scholar] [CrossRef]
  11. Shin, E.; Pae, K. Effects of hydrostatic pressure on in-plane shear properties of graphite/epoxy composites. J. Compos. Mater. 1992, 26, 828–868. [Google Scholar] [CrossRef]
  12. Totry, E.; Molina-Aldareguía, J.M.; González, C.; LLorca, J. Effect of fiber, matrix and interface properties on the in-plane shear deformation of carbon-fiber reinforced composites. Compos. Sci. Technol. 2010, 70, 970–980. [Google Scholar] [CrossRef]
  13. Kier, Z.T.; Salvi, A.; Theis, G.; Waas, A.M.; Shahwan, K. Estimating mechanical properties of 2D triaxially braided textile composites based on microstructure properties. Compos. Part B Eng. 2015, 68, 288–299. [Google Scholar] [CrossRef] [Green Version]
  14. Pierron, F.; Green, B.; Wisnom, M.R. Full-field assessment of the damage process of laminated composite open-hole tensile specimens. Part I: Methodology. Compos. Part A Appl. Sci. Manuf. 2007, 38, 2307–2320. [Google Scholar] [CrossRef]
  15. Achard, V.; Bouvet, C.; Castanié, B.; Chirol, C. Discrete ply modelling of open hole tensile tests. Compos. Struct. 2014, 113, 369–381. [Google Scholar] [CrossRef] [Green Version]
  16. Waas, A.; Babcock, C., Jr. Observation of the Initiation and Progression of Damage in Compressively Loaded Composite Plates Containing a Cutout; NASA: Washington, DC, USA, 1986.
  17. Saha, M.; Prabhakaran, R.; Waters, W., Jr. Compressive behavior of pultruded composite plates with circular holes. Compos. Struct. 2004, 65, 29–36. [Google Scholar] [CrossRef]
  18. Barile, C.; Casavola, C.; Pappalettera, G. Digital image correlation comparison of damaged and undamaged aeronautical CFRPs during compression tests. Materials 2019, 12, 249. [Google Scholar] [CrossRef] [PubMed] [Green Version]
  19. ASTM D3039/3039M; Standard Test Method for Tensile Properties of Polymer Matrix Composite Materials. ASTM International: West Conshohocken, PA, USA, 2008.
  20. ASTM D6641/D6641M-09; Standard Test Method for Flexural Properties of Polymer Matrix Composite Materials. ASTM International: West Conshohocken, PA, USA, 2014.
  21. ASTM D7078/D7078M-12; ASTM D7078/D7078M-12. Standard test method for shear properties of composite materials by the V-notched beam method. ASTM Internationa: West Conshohocken, PA, USA, 2015.
  22. ASTM D7745-11; Standard Practice for Testing Pultruded Composites. ASTM International: West Conshohocken, PA, USA, 2011.
  23. Toray Carbon Fibers America, Inc. Toryaca T700S Data Sheet; Technical Data Sheet No CFA-005; Toray Carbon Fibers America, Inc.: Decatur, AL, USA, 2018. [Google Scholar]
  24. Chowdhury, N.T.; Wang, J.; Chiu, W.K.; Yan, W. Matrix failure in composite laminates under compressive loading. Compos. Part A Appl. Sci. Manuf. 2016, 84, 103–113. [Google Scholar] [CrossRef]
  25. Key, C.T.; Lua, J. Constituent based analysis of composite materials subjected to fire conditions. Compos. Part A Appl. Sci. Manuf. 2006, 37, 1005–1014. [Google Scholar] [CrossRef]
  26. Herakovich, C.T.; Mirzadeh, F. Properties of pultruded graphite/epoxy. J. Reinf. Plast. Compos. 1991, 10, 2–28. [Google Scholar] [CrossRef]
  27. Cook, J.; Gordon, J. A mechanism for the control of crack propagation in all-brittle systems. Proc. R. Soc. Lond. Ser. A Math. Phys. Sci. 1964, 282, 508–520. [Google Scholar]
  28. Zweben, C. An approximate method of analysis for notched unidirectional composites. Eng. Fract. Mech. 1974, 6, 1–10. [Google Scholar] [CrossRef]
  29. Mar, J.W.; Lin, K. Characterization of splitting process in graphite/epoxy composites. J. Compos. Mater. 1979, 13, 278–287. [Google Scholar] [CrossRef]
  30. He, J.; Chiang, M.Y.; Hunston, D.L.; Han, C.C. Application of the V-notch shear test for unidirectional hybrid composites. J. Compos. Mater. 2002, 36, 2653–2666. [Google Scholar] [CrossRef]
Figure 1. Coupon dimensions and SG location, for each mode of loading; (a) tension; (b) compression; (c) shear.
Crystals 12 00850 g001
Figure 2. Experimental set-up for the various modes of loading and SG location; (a) tension; (b) compression; (c) shear.
Crystals 12 00850 g002
Figure 3. Stress–strain curves in tensile mode for different fibers orientations; (a) 0°; (b) 90°.
Crystals 12 00850 g003
Figure 4. Tensile fracture modes for the 0° and the 90° coupons; (a) general view; (b) 0°; (c) 9°.
Crystals 12 00850 g004
Figure 5. Stress–strain curves in compression mode for different orientations; (a) 0°; (b) 90°.
Crystals 12 00850 g005
Figure 6. Compression fracture modes at different orientations; (a,b) top and side views, 90°; (c,d) top and side view, 0°; (e) the kinking phenomena.
Crystals 12 00850 g006
Figure 7. Microscopic fracture modes obtained in compression; (a) general view; (b) serrated type fracture in the matrix epoxy resin.
Crystals 12 00850 g007
Figure 8. Shear stress–strain curves for different orientations; (a) 0° entire curves up to fracture (3 coupons); (b) 90° entire curves up to fracture (two coupons); (c) 0° expanded zone where load relaxations were noticed; (d) comparison curves of 0° and 90° coupons (chose representative).
Crystals 12 00850 g008
Figure 9. Sites of delamination cracks in DVN coupons for various orientations; (a) 0°; (b) 90°.
Crystals 12 00850 g009
Figure 10. Microscopic fracture modes developed during shear at different orientations; (a,b) 0°; (c,d) 90°.
Crystals 12 00850 g010
Figure 11. Mechanical response of holed coupons in terms of nominal stress; (a) stress–strain of 2.5 mm holed coupon; (b) stress –displacement full curves up to fracture; (c) expanded region where σr is observed for the various holes’ diameter (the arrow indicates increasing in D).
Crystals 12 00850 g011
Figure 12. The dependency of σr with increasing hole diameter.
Crystals 12 00850 g012
Figure 13. The change in the number and amount of stress relaxation with hole diameter.
Crystals 12 00850 g013
Figure 14. The tensile fracture modes in the holed 0° coupons with different diameters; (a) general view; (b) 5.5 mm; (c) 8 mm (the dashed circles indicate the zone where the fracture occurred).
Crystals 12 00850 g014
Figure 15. Microscopic fracture mode developed during tensile of holed coupons; (a) general view; (b) the chevron-type cracking of the epoxy resin between the carbon fibers.
Crystals 12 00850 g015
Figure 16. Nominal stress vs. strain and displacement for various notched coupons; (a) stress vs. strain for ND = 1 mm; (b) stress vs. displacement curves up to fracture; (c) extended zone where load relaxations were detected.
Crystals 12 00850 g016
Figure 17. Tensile fracture modes in the 0° orientation of notched coupons with ND-2.4 mm; (a) general view; (b) two ligaments left after fracture; (c) the fracture profile at the notch radius.
Crystals 12 00850 g017
Figure 18. Stress vs. displacement in the compression mode, in the presence of various holes; (a) complete curves; (b) expanded regions where local load relaxation is observed.
Crystals 12 00850 g018
Figure 19. Compression fracture mode in the 0° orientation of holed coupons with various hole diameter; (a) 2.5 mm; (b) 3.5 mm; (c) 4.5 mm; (d) 5.5 mm.
Crystals 12 00850 g019
Figure 20. Macroscopic fracture modes in shear loading of holed coupons; (a) delamination cracks at the V-notch; (b) cracks occurring as a result of further loading at 5.5 mm holed coupon.
Crystals 12 00850 g020
Figure 21. The hole and the notch effect on the mechanical response in tension; (a) first stress relaxation vs. hole diameter and notch depth; (b) fracture stress; (c) the amount and the number of stress relaxations.
Crystals 12 00850 g021
Figure 22. Experimental curves used for the FEA procedure; (a) F vs. γ; (b) F vs. displacement; (c) FE model and boundary conditions.
Crystals 12 00850 g022
Figure 23. (a,b) Normalized shear stress, as obtained by the FEA at p = 8, for 0° and 90° orientations, respectively; (c) computed compared to experimental force vs. shear strain.
Crystals 12 00850 g023
Figure 24. (a,b) Possible sources that may be affecting the shear stress value; (a) defect in the notch radius (marked by arrows); (b) asymmetrical gripping, a ≠ b; (c) deviation from the load line marked by the angle α.
Crystals 12 00850 g024
Figure 25. Radius profile and the angle notch for the shear coupon machined in (a) mechanical (arrow mark the defect) and (b) water cutting.
Crystals 12 00850 g025
Figure 26. Stress concentration, as computed by a FEA at p = 8 at a notch (a,c) and at a hole (b,d) for the different predicted stresses: (a,b) σyy, (c,d) τxy.
Crystals 12 00850 g026aCrystals 12 00850 g026b
Table 1. Tensile properties in both orientations for four coupons.
OrientationModulus (GPa)Fracture Stress (MPa)Fracture Strain (%)Poisson RatioNo. of Coupons
132.5 ± 1.72799 ± 21.96 ± 0.110.307 ± 0.0074
90°9.1 ± 0.336 ± 20.40 ± 0.010.022 ± 0.0024
Table 2. Mechanical properties in compression mode of uniform coupons for the two orientations.
OrientationModulus (GPa)Fracture Stress (MPa)Fracture Strain (%)Number of Coupons
118 ± 2.11175 ± 1571.1 ± 0.24
90°10.3 ± 1.7142 ± 10.61.85 ± 0.45
Table 3. Mechanical properties for the shear coupons for the two orientations.
OrientationG12 (GPa)τr (MPa)γr (%)Number of Coupons
6.6 ± 0.244.8 ± 3.20.092 ± 0.0156
90°4.9 ± 0.146.7 ± 1.61.36 ± 0.012
Only two specimen were tested due to limitations in the raw materials.
Table 4. Tensile stresses for holed coupons at different holes diameter.
Diameter (mm)σnom-r (MPa)σnom (MPa)Number of Coupons
2.5640 ± 582770 ± 1254
3.5560 ± 442802 ± 964
4.5530 ± 362903 ± 1153
5.5520 ± 262798 ± 1143
7533 ± 452468 ± 133 *3
8445 ± 401713 ± 54 *3
9545 ± 401952 ± 372 *3
* These coupons did not reach the actual fracture load due to the pullout phenomenon.
Table 5. Tensile stresses notched coupons.
Notch Depth (mm)σnom-r (MPa)σnom (MPa)Number of Coupons
1.0094028401
1.6–1.451270 ± 2502742 ± 413
2.4–2.151440 ± 1272765 ± 1303
Table 6. Mechanical properties of holed coupons in the compression mode of loading.
Hole Diameter (mm)First Stress Relaxation (MPa)Fracture Stress (MPa)Number of Coupons
2.57001175 ± 124
3.56001135 ± 1403
4.55851233 ± 793
5.56001157 ± 553
Table 7. Shear stress of notched coupons in the presence of various holes.
Propertyτs (MPa)Number of Coupons
Bonded two layers41.5 ± 7.618
“Un-bonded”two layers36.4 ± 3.620
Table 8. Comparison of mechanical properties between tension and compression of uniform coupons.
PropertyModulus (GPa)Fracture Stress (MPa)Fracture Strain (%)
Orientation90°90°90°
Mode
Tension132.5 ± 1.79.1 ± 0.32799 ± 236 ± 21.96 ± 0.110.40 ± 0.003
Compression118 ± 2.110.3 ± 1.71175 ± 157142 ± 10.61.1 ± 0.21.85 ± 0.4
Table 9. Shear values for different radius profile and thickness.
Thickness (mm)GLT
(GPa)
τxy
(MPa)
γ
(%)
Number of
Coupons
Property
1defective6 ± 0.244.1 ± 2.30.97 ± 0.055
2defective6 ± 0.245.0 ± 3 3
1perfect6.6 ± 0.244.8 ± 3.2 6
Table 10. Ratios of the notch/hole transverse and shear stresses for different holes diameter.
Hole Diameter (mm)(σyy)notch/(σyy)hole(τxy)notch/(τxy)hole
2.50.081.22
3.51.111.25
41.131.27
4.51.161.28
5.51.211.31
6.51.261.34
Publisher’s Note: MDPI stays neutral with regard to jurisdictional claims in published maps and institutional affiliations.

