
Improved Method for Preparing Nanospheres from Pomelo Peel to Achieve High Graphitization at a Low Temperature

 , ,
, ,  , ,
, ,  , and
, and
Abstract
:1. Introduction
2. Materials and Methods
2.1. Material
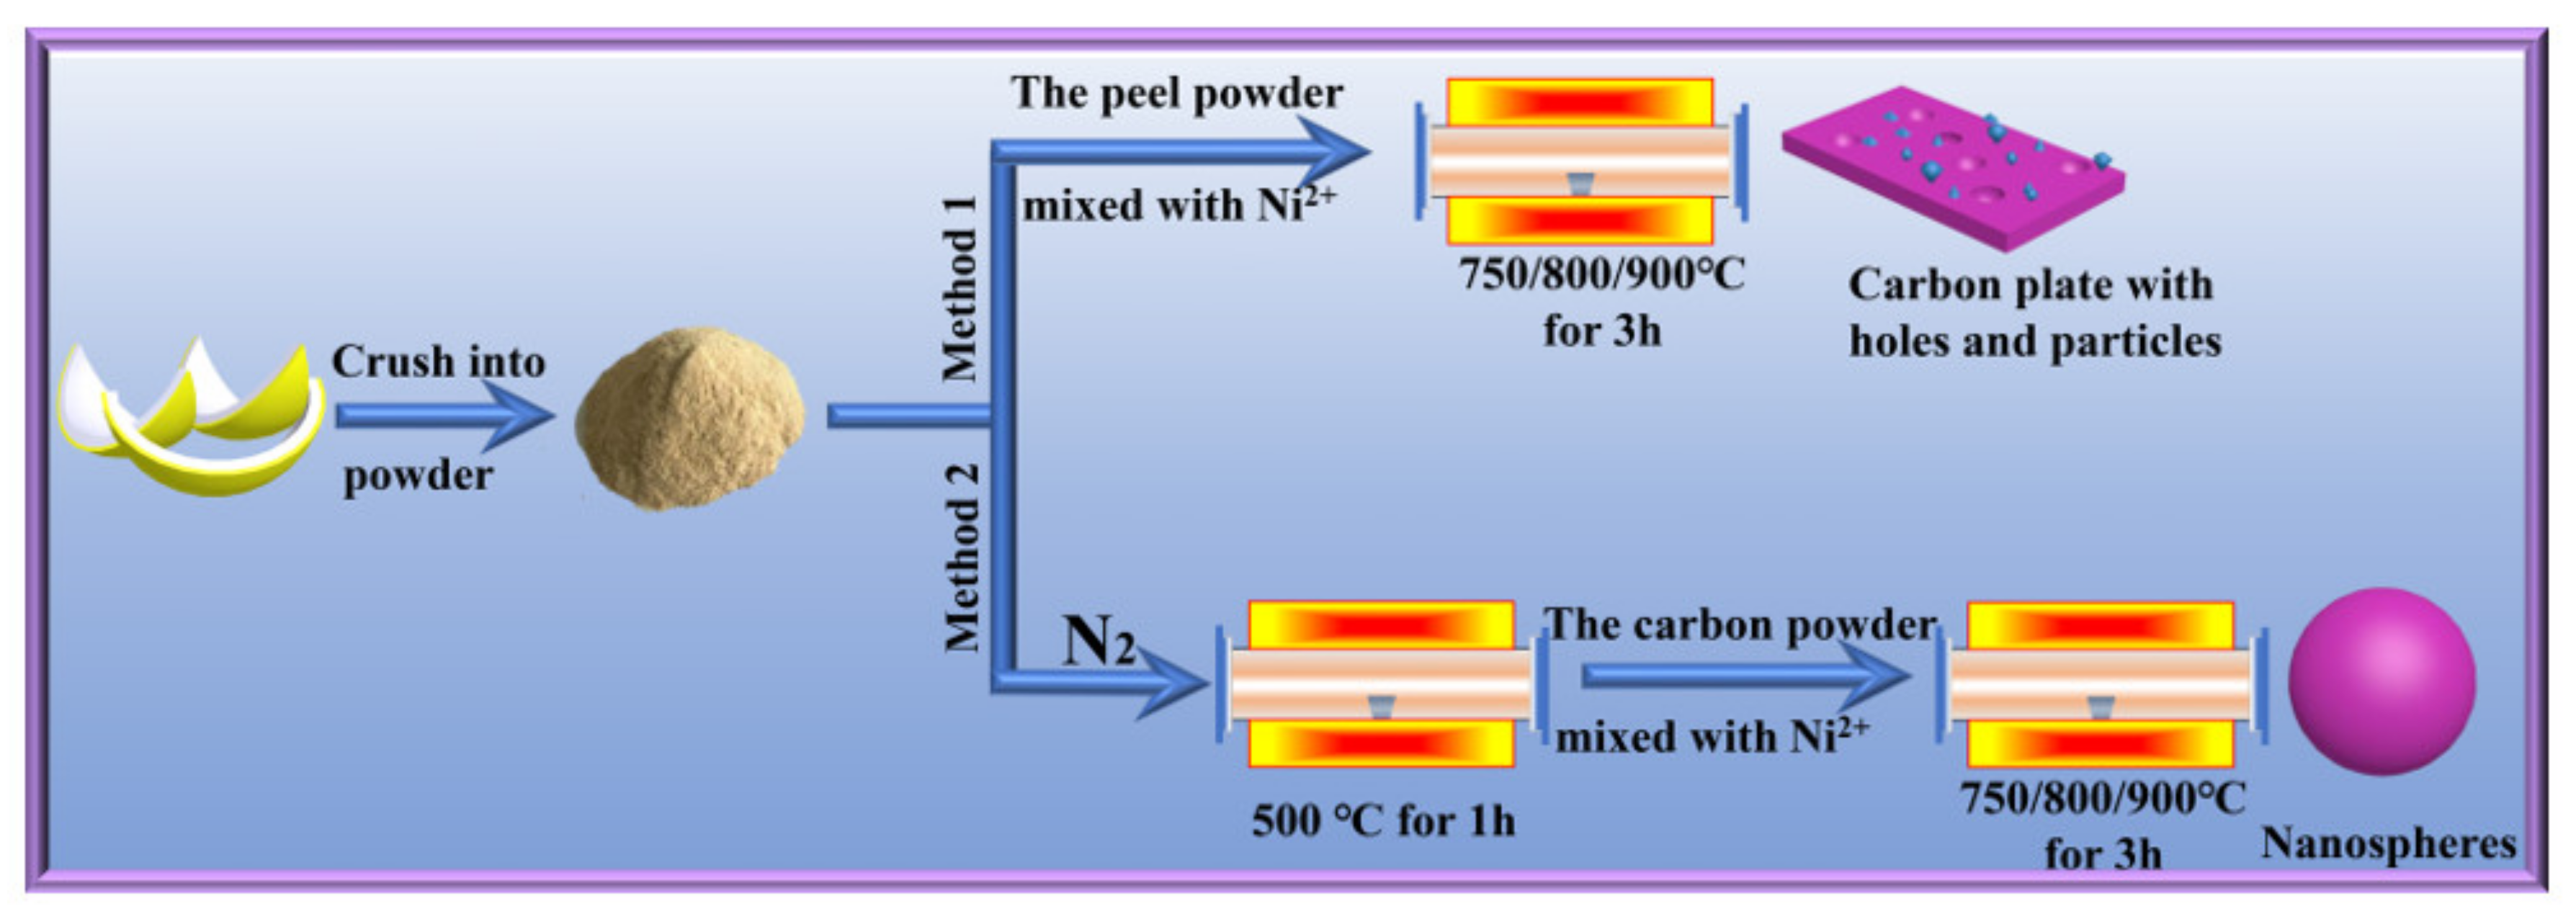
2.2. Method
2.3. Characterization of the Peel Biomass
3. Results and Discussions
4. Conclusions
- (1)
- This paper explores the improved methods and traditional methods for graphitization. With the improved method, the degree of graphitization can reach 80.23% at 900 °C, which is slightly lower than that of commercial graphite (90.23%) and much higher than that of the sample at 900 °C (48.84%) with the traditional method.
- (2)
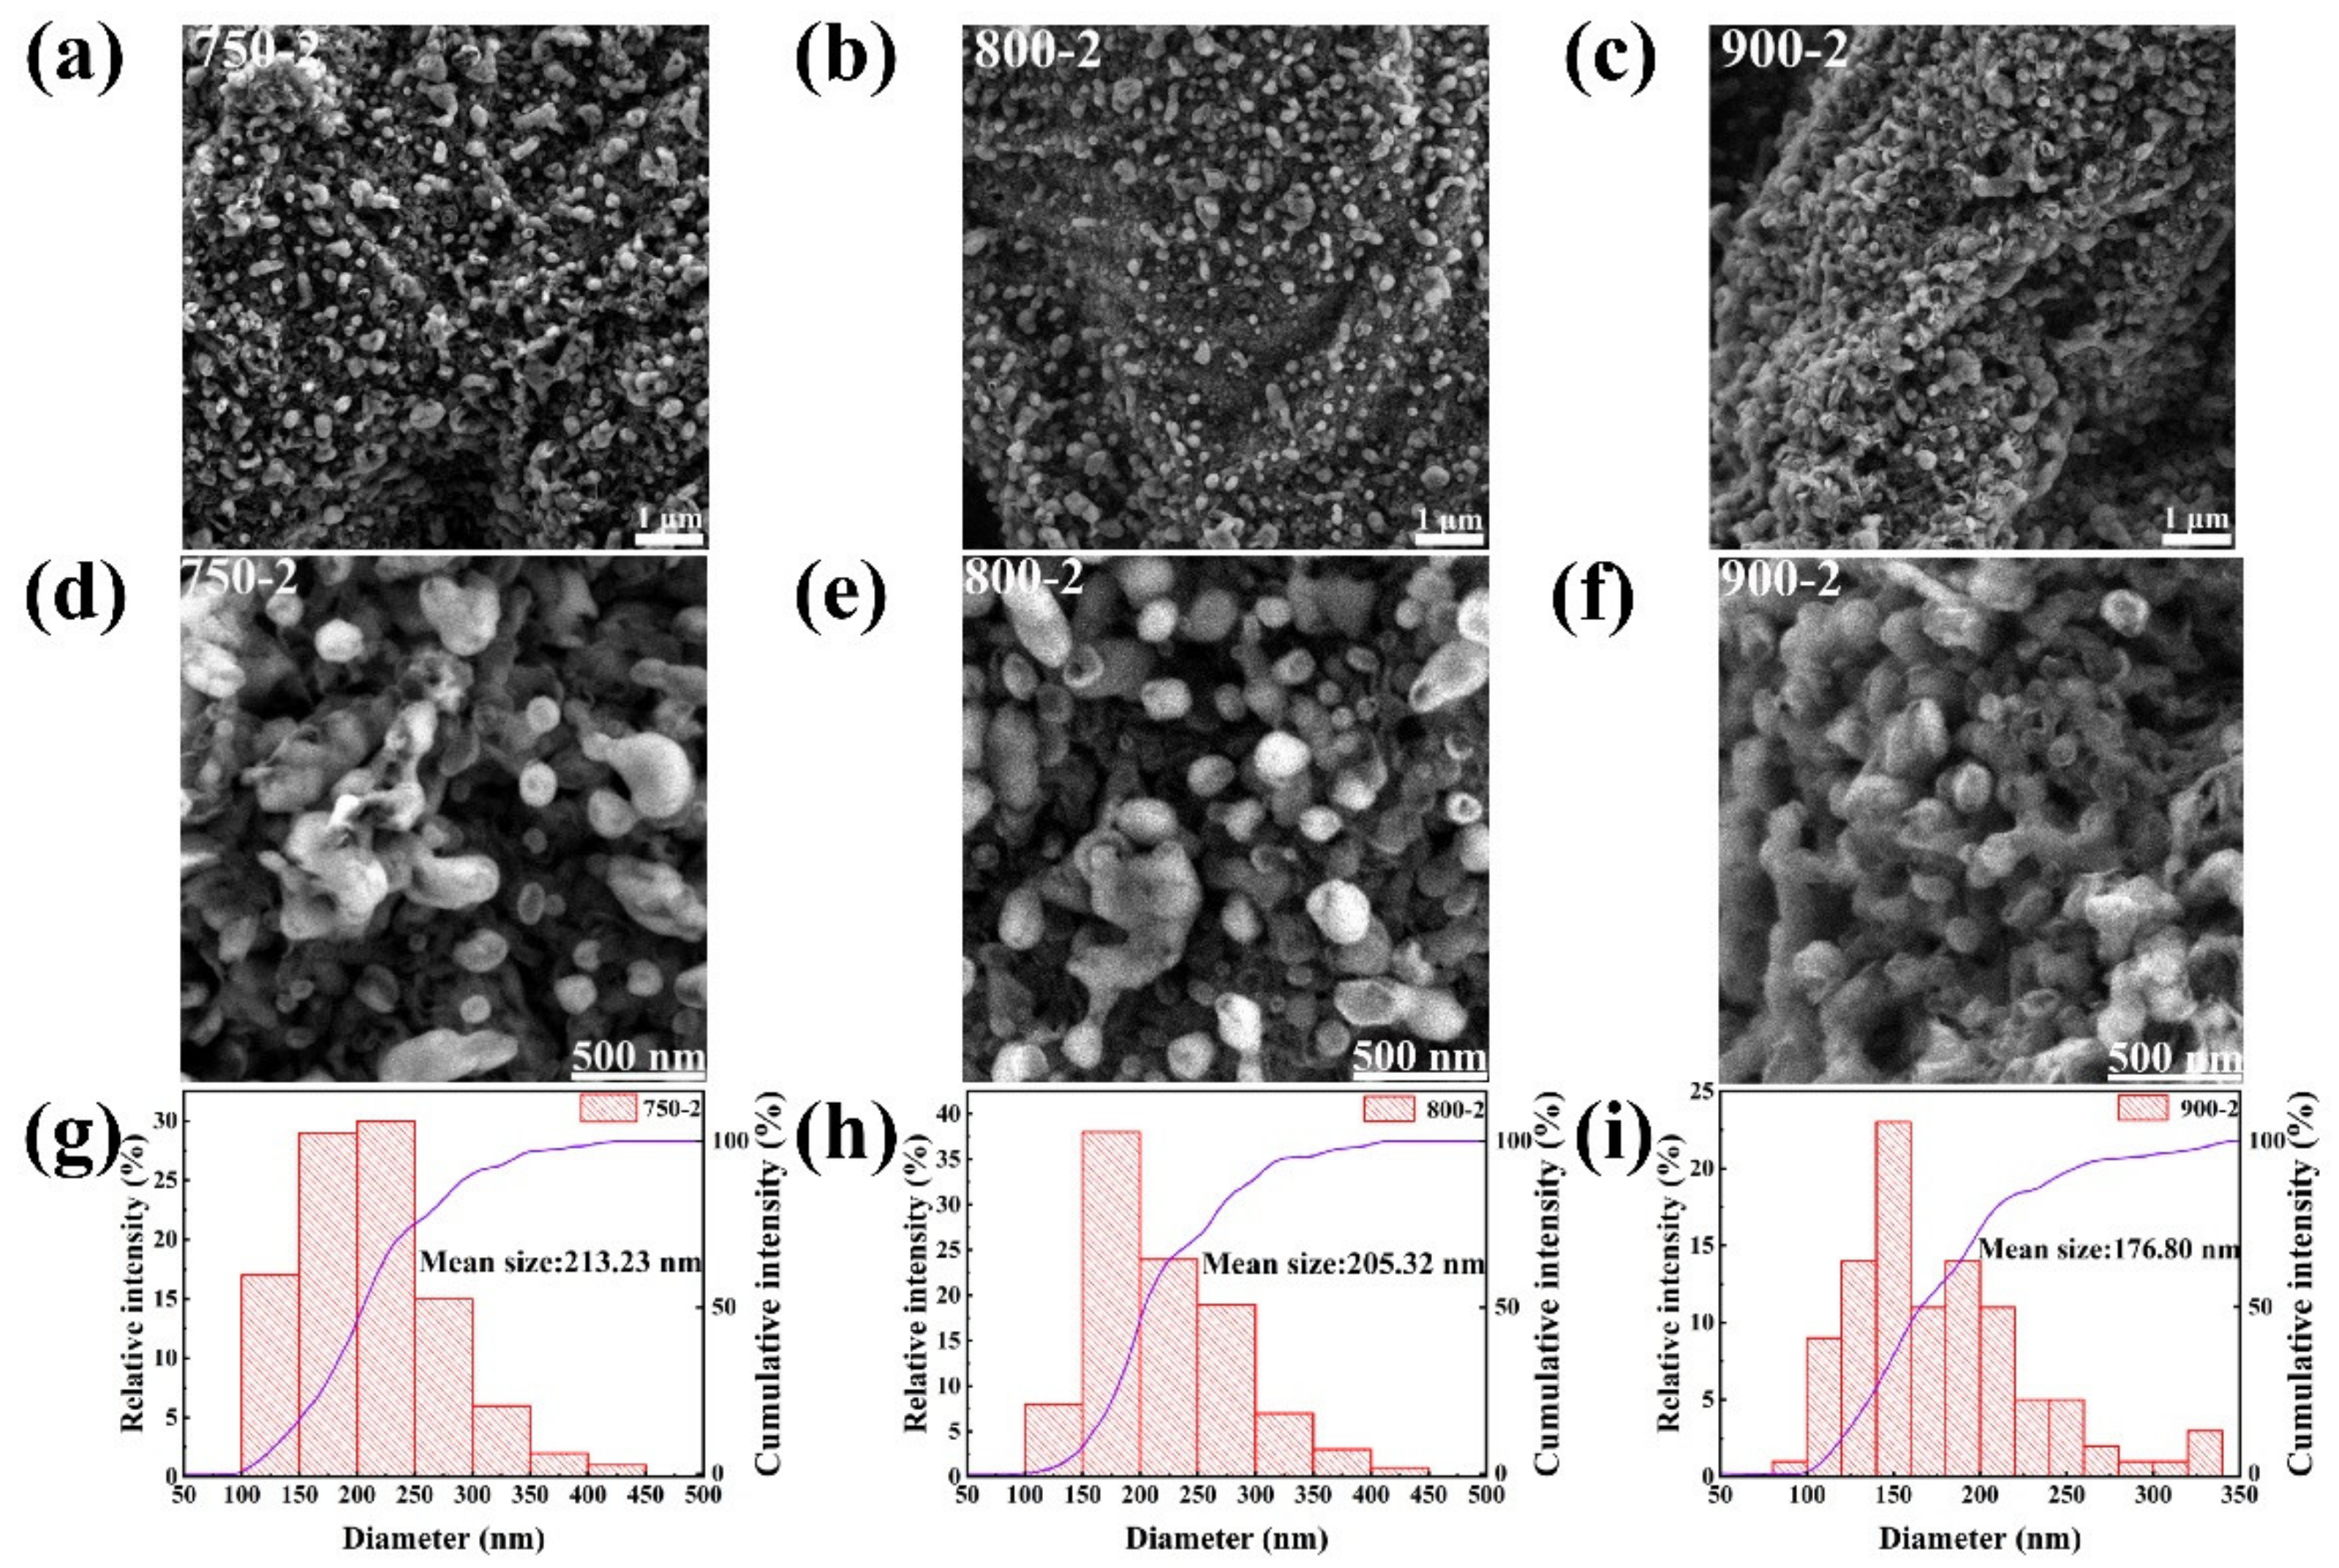
- With the improved method, pomelo peels can be transformed into highly graphitized nanospheres at 900 °C. It can be seen from TEM that the plane interlayer spacing of (002) is 0.337 nm, which is very close to the theoretical value of pure graphite (0.3354 nm).
- (3)
- Whether the traditional method or the improved method is used, the temperature plays an important role in the catalysis of pomelo peel by Ni.
- (4)
- This work can turn pomelo peels into valuable materials, reduce environmental pollution, and, more importantly, reduce energy consumption and promote sustainable development.
Supplementary Materials
Author Contributions
Funding
Institutional Review Board Statement
Informed Consent Statement
Data Availability Statement
Acknowledgments
Conflicts of Interest
References
- Xiao, L.; Ye, F.; Zhou, Y.; Zhao, G. Utilization of pomelo peels to manufacture value-added products: A review. Food Chem. 2021, 351, 129247. [Google Scholar] [CrossRef] [PubMed]
- Chen, X.; Xu, X.; Lu, Z.; Zhang, W.; Yang, J.; Hou, Y.; Wang, X.; Zhou, S.; Li, Y.; Wu, L.; et al. Carbon footprint of a typical pomelo production region in China based on farm survey data. J. Clean. Prod. 2020, 277, 124041. [Google Scholar] [CrossRef]
- Cheng, D.; Ngo, H.H.; Guo, W.; Chang, S.W.; Nguyen, D.D.; Zhang, X.; Varjani, S.; Liu, Y. Feasibility study on a new pomelo peel derived biochar for tetracycline antibiotics removal in swine wastewater. Sci. Total Environ. 2020, 720, 137662. [Google Scholar] [CrossRef] [PubMed]
- Wang, W.; Chen, M. Catalytic degradation of sulfamethoxazole by peroxymonosulfate activation system composed of nitrogen-doped biochar from pomelo peel: Important roles of defects and nitrogen, and detoxification of intermediates. J. Colloid Interface Sci. 2022, 613, 57–70. [Google Scholar] [CrossRef]
- Wu, M.C.; Zhang, R.H.; Liu, K.; Sun, J.; Chan, K.Y.; Zhao, T.S. Mesoporous carbon derived from pomelo peel as a high-performance electrode material for zinc-bromine flow batteries. J. Power Sources 2019, 442, 227255. [Google Scholar] [CrossRef]
- Chen, Q.; Tan, X.; Liu, Y.; Liu, S.; Li, M.; Gu, Y.; Zhang, P.; Ye, S.; Yang, Z.; Yang, Y. Biomass-derived porous graphitic carbon materials for energy and environmental applications. J. Mater. Chem. A 2020, 8, 5773–5811. [Google Scholar] [CrossRef]
- Aval, L.F.; Ghoranneviss, M.; Pour, G.B. High-performance supercapacitors based on the carbon nanotubes, graphene and graphite nanoparticles electrodes. Heliyon 2018, 4, e00862. [Google Scholar] [CrossRef] [Green Version]
- Ma, Y.; Hu, Z.; Huo, K.; Lu, Y.; Hu, Y.; Liu, Y.; Hu, J.; Chen, Y. A practical route to the production of carbon nanocages. Carbon 2005, 43, 1667–1672. [Google Scholar] [CrossRef]
- Cassell, A.M.; Raymakers, J.A.; Kong, J.; Dai, H. Large scale CVD synthesis of single-walled carbon nanotubes. J. Phys. Chem. B 1999, 103, 6484–6492. [Google Scholar] [CrossRef]
- Sevilla, M.; Sanchís, C.; Valdés-Solís, T.; Morallón, E.; Fuertes, A.B. Direct synthesis of graphitic carbon nanostructures from saccharides and their use as electrocatalytic supports. Carbon 2008, 46, 931–939. [Google Scholar] [CrossRef] [Green Version]
- Fan, C.-L.; He, H.; Zhang, K.-H.; Han, S.-C. Structural developments of artificial graphite scraps in further graphitization and its relationships with discharge capacity. Electrochim. Acta 2012, 75, 311–315. [Google Scholar] [CrossRef]
- Huang, S.; Guo, H.; Li, X.; Wang, Z.; Gan, L.; Wang, J.; Xiao, W. Carbonization and graphitization of pitch applied for anode materials of high power lithium ion batteries. J. Solid State Electrochem. 2013, 17, 1401–1408. [Google Scholar] [CrossRef]
- Zhang, S.; Liu, Q.; Zhang, H.; Ma, R.; Li, K.; Wu, Y.; Teppen, B.J. Structural order evaluation and structural evolution of coal derived natural graphite during graphitization. Carbon 2020, 157, 714–723. [Google Scholar] [CrossRef]
- Liu, H.; Cheng, C.; Wu, H. Sustainable utilization of wetland biomass for activated carbon production: A review on recent advances in modification and activation methods. Sci. Total Environ. 2021, 790, 148214. [Google Scholar] [CrossRef] [PubMed]
- Danish, M.; Ahmad, T. A review on utilization of wood biomass as a sustainable precursor for activated carbon production and application. Renew. Sustain. Energy Rev. 2018, 87, 1–21. [Google Scholar] [CrossRef]
- Li, H.; Zhang, H.; Li, K.; Zhang, J.; Sun, M.; Su, B. Catalytic graphitization of coke carbon by iron: Understanding the evolution of carbon Structure, morphology and lattice fringes. Fuel 2020, 279, 118531. [Google Scholar] [CrossRef]
- Wang, K.; Cao, Y.; Wang, X.; Kharel, P.R.; Gibbons, W.; Luo, B.; Gu, Z.; Fan, Q.; Metzger, L. Nickel catalytic graphitized porous carbon as electrode material for high performance supercapacitors. Energy 2016, 101, 9–15. [Google Scholar] [CrossRef] [Green Version]
- Thompson, E.; Danks, A.E.; Bourgeois, L.; Schnepp, Z. Iron-catalyzed graphitization of biomass. Green Chem. 2015, 17, 551–556. [Google Scholar] [CrossRef]
- Gomez-Martin, A.; Martinez-Fernandez, J.; Ruttert, M.; Heckmann, A.; Winter, M.; Placke, T.; Ramirez-Rico, J. Iron-Catalyzed Graphitic Carbon Materials from Biomass Resources as Anodes for Lithium-Ion Batteries. ChemSusChem 2018, 11, 2776–2787. [Google Scholar] [CrossRef]
- Sevilla, M.; Fuertes, A.B. Graphitic carbon nanostructures from cellulose. Chem. Phys. Lett. 2010, 490, 63–68. [Google Scholar] [CrossRef] [Green Version]
- Yan, Q.; Li, J.; Zhang, X.; Hassan, E.B.; Wang, C.; Zhang, J.; Cai, Z. Catalytic graphitization of kraft lignin to graphene-based structures with four different transitional metals. J. Nanopart. Res. 2018, 20, 223. [Google Scholar] [CrossRef]
- Destyorini, F.; Yudianti, R.; Irmawati, Y.; Hardiansyah, A.; Hsu, Y.-I.; Uyama, H. Temperature driven structural transition in the nickel-based catalytic graphitization of coconut coir. Diam. Relat. Mater. 2021, 117, 108443. [Google Scholar] [CrossRef]
- Fujimoto, H. Theoretical X-ray scattering intensity of carbons with turbostratic stacking and AB stacking structures. Carbon 2003, 41, 1585–1592. [Google Scholar] [CrossRef]
- Zou, L.; Huang, B.; Huang, Y.; Huang, Q.; Wang, C.A. An investigation of heterogeneity of the degree of graphitization in carbon–carbon composites. Mater. Chem. Phys. 2003, 82, 654–662. [Google Scholar] [CrossRef]
- Qiu, T.; Yang, J.-G.; Bai, X.-J.; Wang, Y.-L. The preparation of synthetic graphite materials with hierarchical pores from lignite by one-step impregnation and their characterization as dye absorbents. RSC Adv. 2019, 9, 12737–12746. [Google Scholar] [CrossRef] [Green Version]
- Sevilla, M.; Sanchis, C.; Valdes-Solis, T.; Morallon, E.; Fuertes, A.B. Synthesis of graphitic carbon nanostructures from sawdust and their application as electrocatalyst supports. J. Phys. Chem. C 2007, 111, 9749–9756. [Google Scholar] [CrossRef] [Green Version]
- Destyorini, F.; Irmawati, Y.; Hardiansyah, A.; Widodo, H.; Yahya, I.N.D.; Indayaningsih, N.; Yudianti, R.; Hsu, Y.-I.; Uyama, H. Formation of nanostructured graphitic carbon from coconut waste via low-temperature catalytic graphitization. Eng. Sci. Technol. Int. J. 2021, 24, 514–523. [Google Scholar]
- Zha, Z.; Zhang, Z.; Xiang, P.; Zhu, H.; Shi, X.; Chen, S. Porous graphitic carbon from mangosteen peel as efficient electrocatalyst in microbial fuel cells. Sci. Total Environ. 2021, 764, 142918. [Google Scholar] [CrossRef]
- Hu, C.; Sedghi, S.; Silvestre-Albero, A.; Andersson, G.G.; Sharma, A.; Pendleton, P.; Rodríguez-Reinoso, F.; Kaneko, K.; Biggs, M.J. Raman spectroscopy study of the transformation of the carbonaceous skeleton of a polymer-based nanoporous carbon along the thermal annealing pathway. Carbon 2015, 85, 147–158. [Google Scholar] [CrossRef] [Green Version]
- Kim, T.; Lee, J.; Lee, K.-H. Full graphitization of amorphous carbon by microwave heating. RSC Adv. 2016, 6, 24667–24674. [Google Scholar] [CrossRef] [Green Version]
- Liu, X.; Zhou, Y.; Zhou, W.; Li, L.; Huang, S.; Chen, S. Biomass-derived nitrogen self-doped porous carbon as effective metal-free catalysts for oxygen reduction reaction. Nanoscale 2015, 7, 6136–6142. [Google Scholar] [CrossRef] [PubMed]
- Schuepfer, D.B.; Badaczewski, F.; Guerra-Castro, J.M.; Hofmann, D.M.; Heiliger, C.; Smarsly, B.; Klar, P.J. Assessing the structural properties of graphitic and non-graphitic carbons by Raman spectroscopy. Carbon 2020, 161, 359–372. [Google Scholar] [CrossRef]
- Chu, P.K.; Li, L. Characterization of amorphous and nanocrystalline carbon films. Mater. Chem. Phys. 2006, 96, 253–277. [Google Scholar] [CrossRef]
- Bao, C.; Shi, K.; Xu, P.; Yang, L.; Chen, H.; Dai, Y.; Liu, H. Purification effect of the methods used for the preparation of the ultra-high purity graphite. Diam. Relat. Mater. 2021, 120, 108704. [Google Scholar] [CrossRef]
- Gong, Y.; Li, D.; Luo, C.; Fu, Q.; Pan, C. Highly porous graphitic biomass carbon as advanced electrode materials for supercapacitors. Green Chem. 2017, 19, 4132–4140. [Google Scholar] [CrossRef]
- Huang, H.; Guo, T.; Wang, K.; Li, Y.; Zhang, G. Efficient activation of persulfate by a magnetic recyclable rape straw biochar catalyst for the degradation of tetracycline hydrochloride in water. Sci. Total Environ. 2021, 758, 143957. [Google Scholar] [CrossRef]
- Liou, T.-H.; Wang, S.-Y.; Lin, Y.-T.; Yang, S. Sustainable utilization of rice husk waste for preparation of ordered nanostructured mesoporous silica and mesoporous carbon: Characterization and adsorption performance. Colloids Surf. A Physicochem. Eng. Asp. 2022, 636, 128150. [Google Scholar] [CrossRef]
- Hou, K.; Yang, X.; Bao, M.; Chen, F.; Tian, H.; Yang, L. Composition, characteristics and antioxidant activities of fruit oils from Idesia polycarpa using homogenate-circulating ultrasound-assisted aqueous enzymatic extraction. Ind. Crops Prod. 2018, 117, 205–215. [Google Scholar] [CrossRef]
- Cao, L.; Zhang, X.; Xu, Y.; Xiang, W.; Wang, R.; Ding, F.; Hong, P.; Gao, B. Straw and wood based biochar for CO2 capture: Adsorption performance and governing mechanisms. Sep. Purif. Technol. 2022, 287, 120592. [Google Scholar] [CrossRef]
- Anton, R. On the reaction kinetics of Ni with amorphous carbon. Carbon 2008, 46, 656–662. [Google Scholar] [CrossRef]
- Zhang, P.; Tan, X.; Liu, S.; Liu, Y.; Zeng, G.; Ye, S.; Yin, Z.; Hu, X.; Liu, N. Catalytic degradation of estrogen by persulfate activated with iron-doped graphitic biochar: Process variables effects and matrix effects. Chem. Eng. J. 2019, 378, 122141. [Google Scholar] [CrossRef]
- Gai, L.; Li, J.; Wang, Q.; Tian, R.; Li, K. Evolution of biomass to porous graphite carbon by catalytic graphitization. J. Environ. Chem. Eng. 2021, 9, 106678. [Google Scholar] [CrossRef]


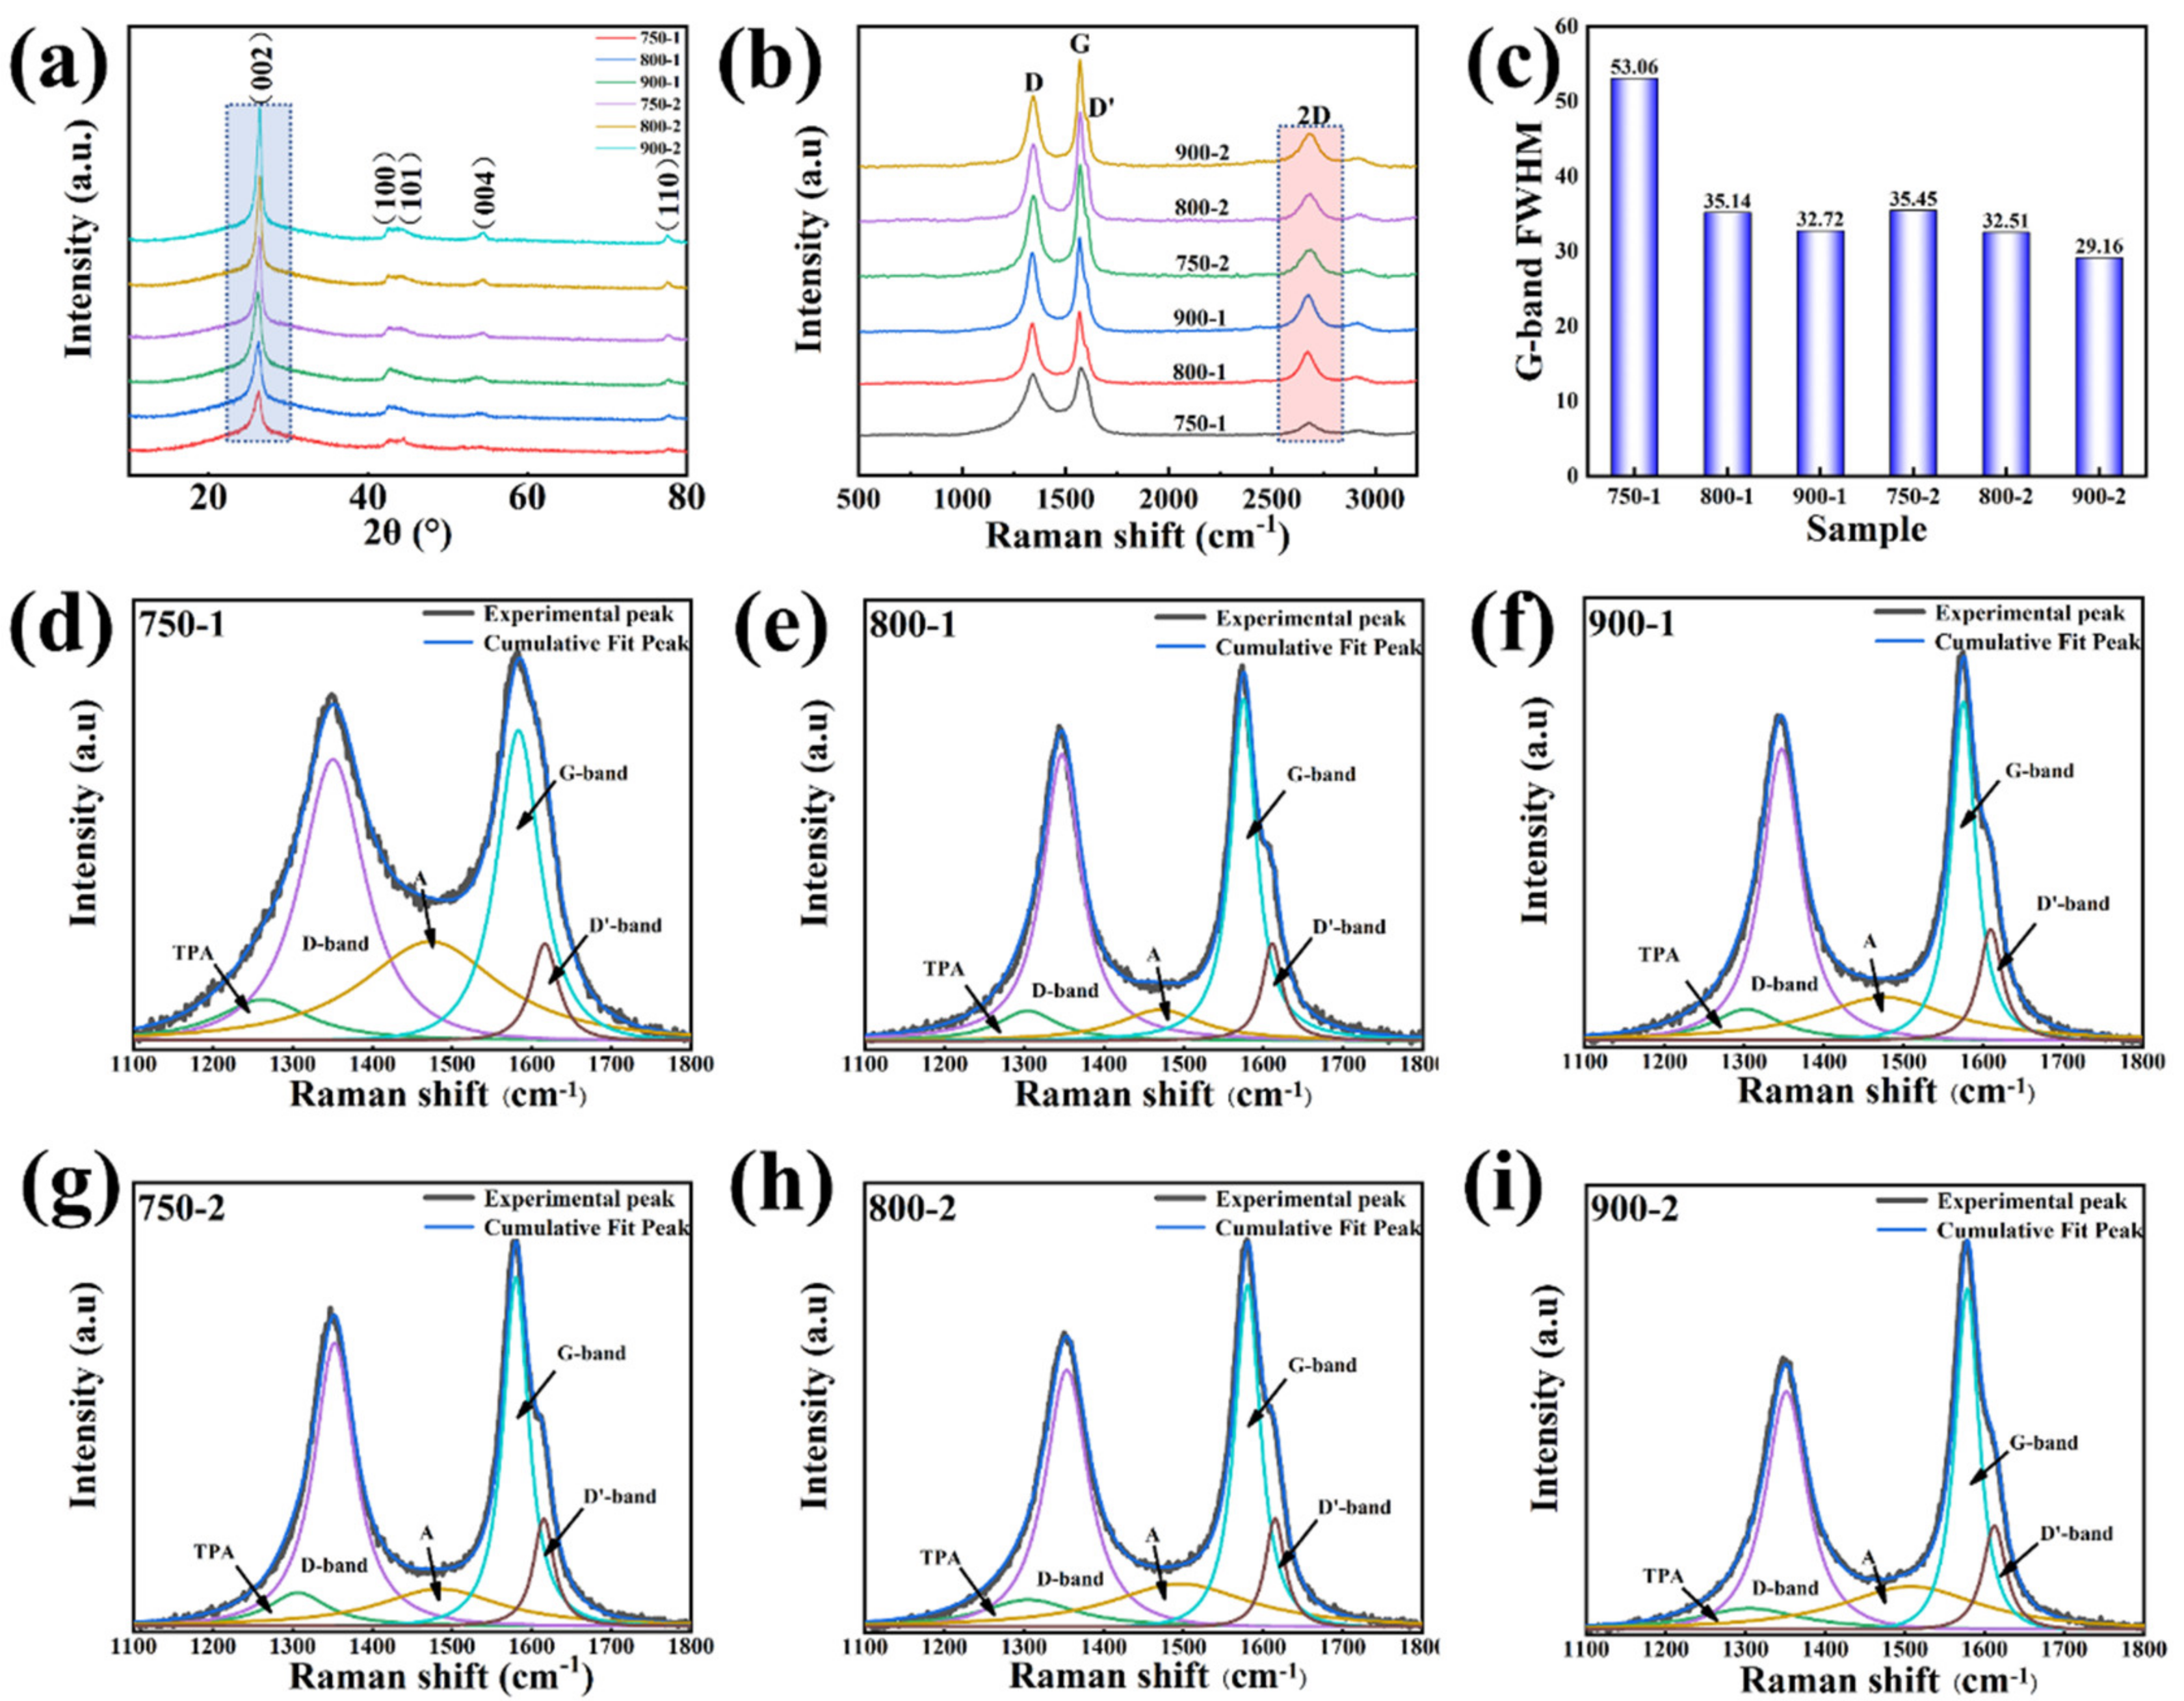
| Sample | d002 (nm) | G (%) | IG/ID | ID/(ID + IG + ID’) |
|---|---|---|---|---|
| 750-1 | 0.3423 | 19.77 | 1.10 | 0.701 |
| 800-1 | 0.341 | 34.88 | 1.17 | 0.655 |
| 900-1 | 0.3398 | 48.84 | 1.19 | 0.641 |
| 750-2 | 0.3376 | 74.42 | 1.33 | 0.618 |
| 800-2 | 0.3375 | 75.58 | 1.37 | 0.591 |
| 900-2 | 0.3371 | 80.23 | 1.43 | 0.509 |
Publisher’s Note: MDPI stays neutral with regard to jurisdictional claims in published maps and institutional affiliations. |
© 2022 by the authors. Licensee MDPI, Basel, Switzerland. This article is an open access article distributed under the terms and conditions of the Creative Commons Attribution (CC BY) license (https://creativecommons.org/licenses/by/4.0/).
Share and Cite
Zeng, L.; Wang, Y.; Guo, Y.; Dai, X.; Chen, L.; He, C.; Nhung, N.T.H.; Wei, Y.; Dodbiba, G.; Fujita, T. Improved Method for Preparing Nanospheres from Pomelo Peel to Achieve High Graphitization at a Low Temperature. Crystals 2022, 12, 403. https://doi.org/10.3390/cryst12030403
Zeng L, Wang Y, Guo Y, Dai X, Chen L, He C, Nhung NTH, Wei Y, Dodbiba G, Fujita T. Improved Method for Preparing Nanospheres from Pomelo Peel to Achieve High Graphitization at a Low Temperature. Crystals. 2022; 12(3):403. https://doi.org/10.3390/cryst12030403
Chicago/Turabian StyleZeng, Lingdong, Youbin Wang, Yixuan Guo, Xiang Dai, Liu Chen, Chunlin He, Nguyen Thi Hong Nhung, Yuezhou Wei, Gjergj Dodbiba, and Toyohisa Fujita. 2022. "Improved Method for Preparing Nanospheres from Pomelo Peel to Achieve High Graphitization at a Low Temperature" Crystals 12, no. 3: 403. https://doi.org/10.3390/cryst12030403
APA StyleZeng, L., Wang, Y., Guo, Y., Dai, X., Chen, L., He, C., Nhung, N. T. H., Wei, Y., Dodbiba, G., & Fujita, T. (2022). Improved Method for Preparing Nanospheres from Pomelo Peel to Achieve High Graphitization at a Low Temperature. Crystals, 12(3), 403. https://doi.org/10.3390/cryst12030403