
Influence of Non-Metallic Inclusions on Local Deformation and Damage Behavior of Modified 16MnCrS5 Steel

 ,
,  ,
,  ,
,  and
and 
Abstract
:1. Introduction
2. Methodology
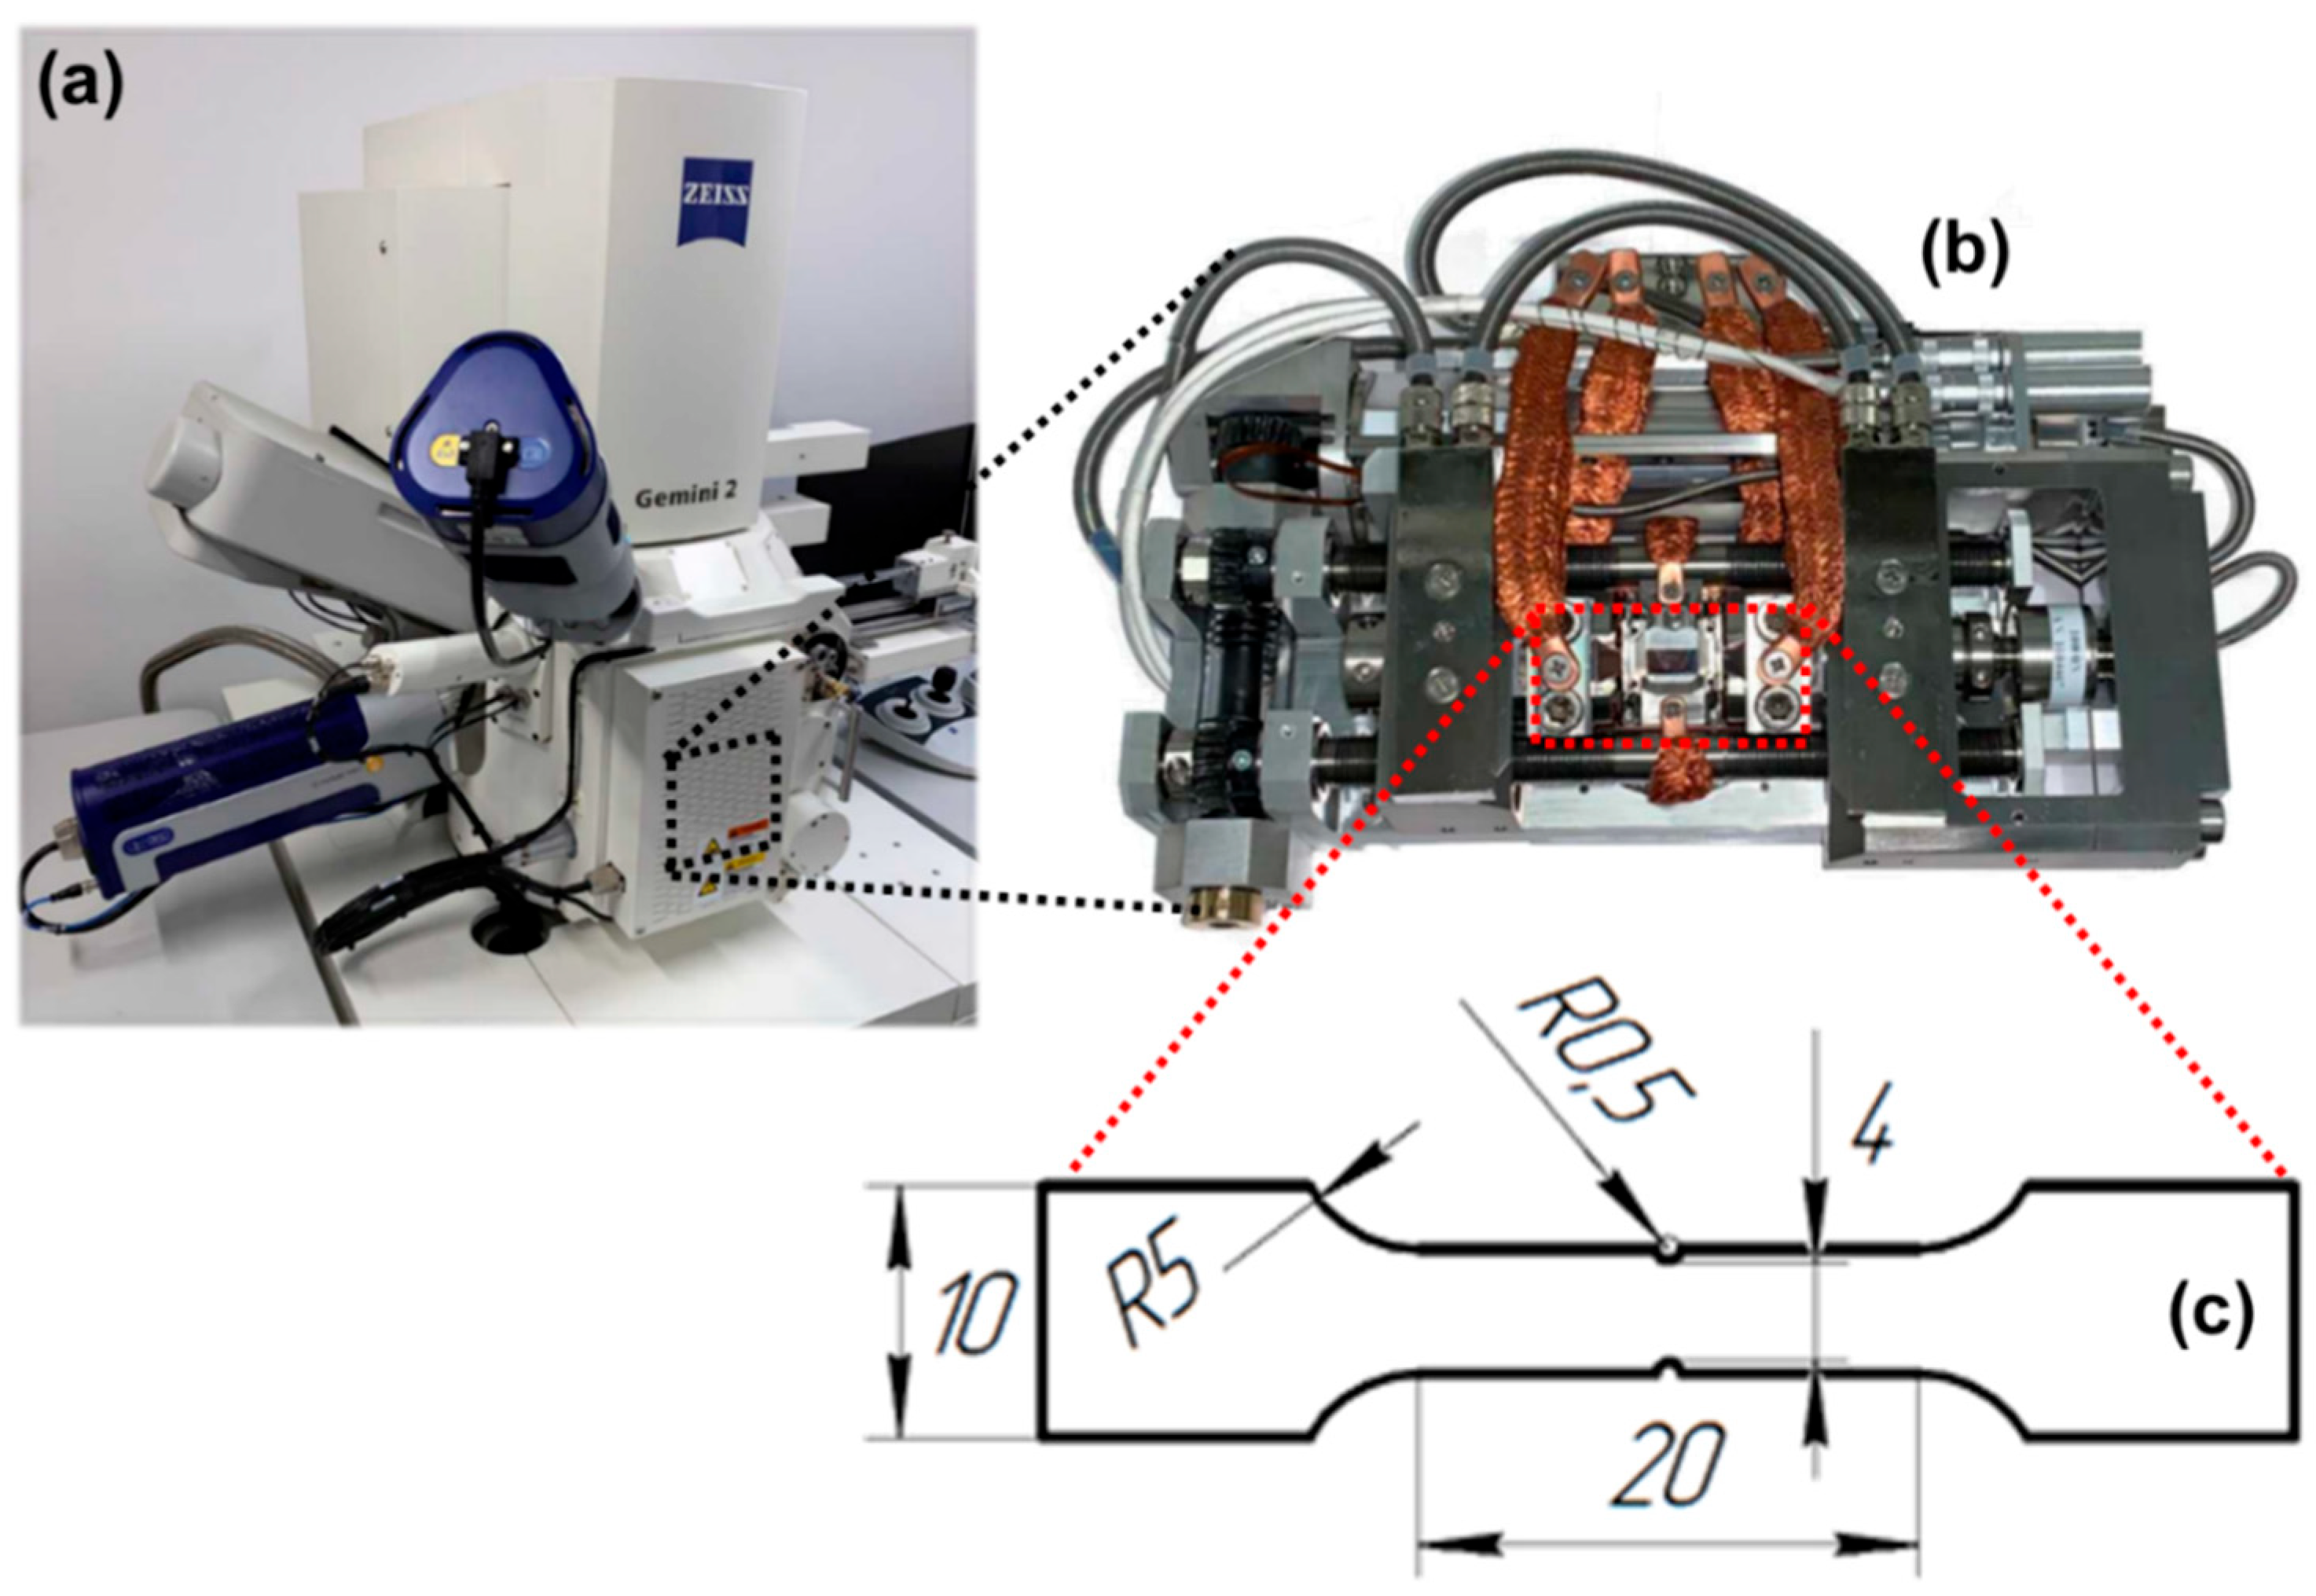
2.1. In Situ Test Setup and Data Collection
2.2. Selection of Area for Full Phase Simulations
2.3. Statistical Analysis of the EBSD Data
2.4. Selection of Area, Tools Used, and Methodology Adopted for In Situ Strain Measurement
3. Numerical Simulation Model Setup

| Elastic Parameters of All the Phases | ||
|---|---|---|
| Parameter | Value | Unit |
| Ferrite-C11,C12,C44 | 233.3, 235.5, 128.0 | GPa |
| Fe3C-C11,C12,C44 [17] | 375.0, 161.0, 130.0 | GPa |
| MnS-C11,C12,C44 [6] | 177.3, 117.0, 25.2 | GPa |
| Al2O3-C11,C12,C44 [10] | 496, 109, 206 [18] | GPa |
| Plastic Parameters of Ferrite Phase | ||
| 0 | 5.6 × 10⁻⁴ | ms−1 |
| S0, [111] | 95 | MPa |
| , [111] | 222 | MPa |
| S0, [112] | 96 | MPa |
| , [112] | 412 | MPa |
| ho | 1 | GPa |
| hαβ | 1.0 | GPa |
| n, w | 3, 2.0 | - |
| Nslip | 12, 12 | - |
| Ntwin | 0 | - |
| Ductile Damage Parameters | ||
| Parameter Description | Value for Ferrite | Unit |
| Interface energy (g0) | 1.0 | Jm−2 |
| Damage mobility coefficient (M) | 0.001 | s−1 |
| Critical plastic strain (Ɛcrit) | 0.5 | - |
| Damage rate sensitivity coefficient (P) | 10 | - |
| Damage diffusion (D) | 1.0 | - |
4. Results
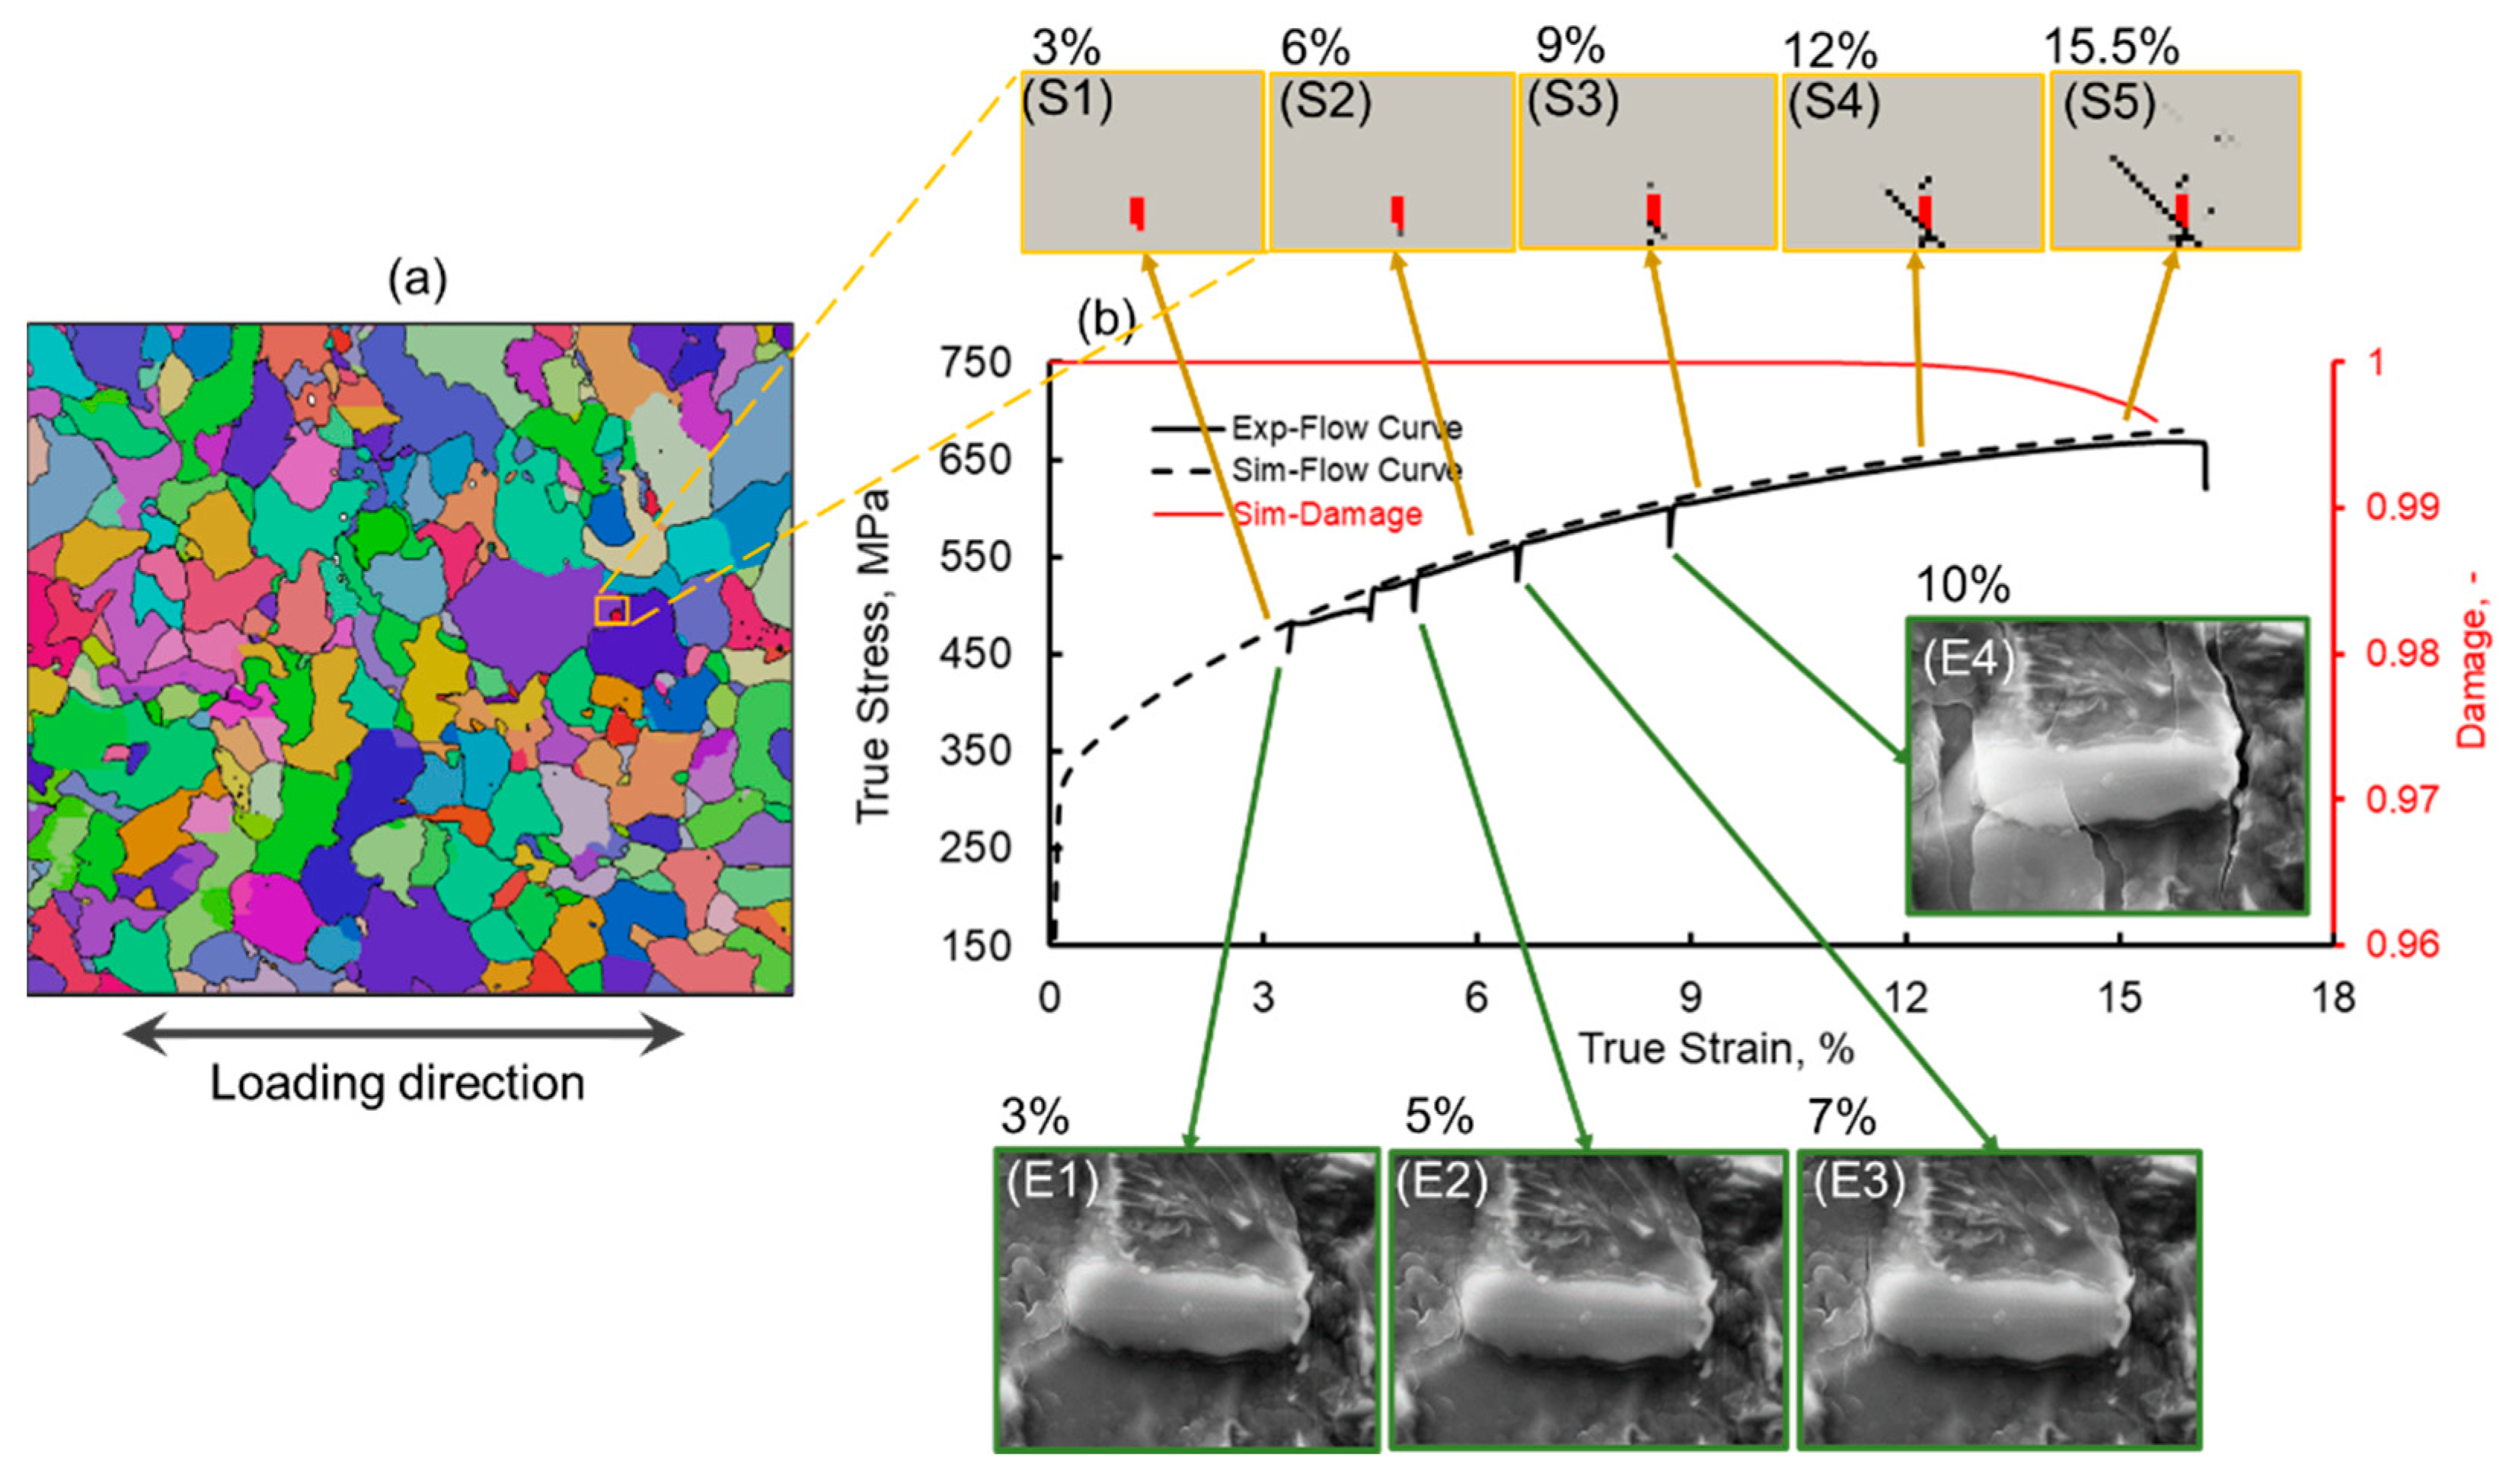
4.1. Global Results of Numerical Simulation
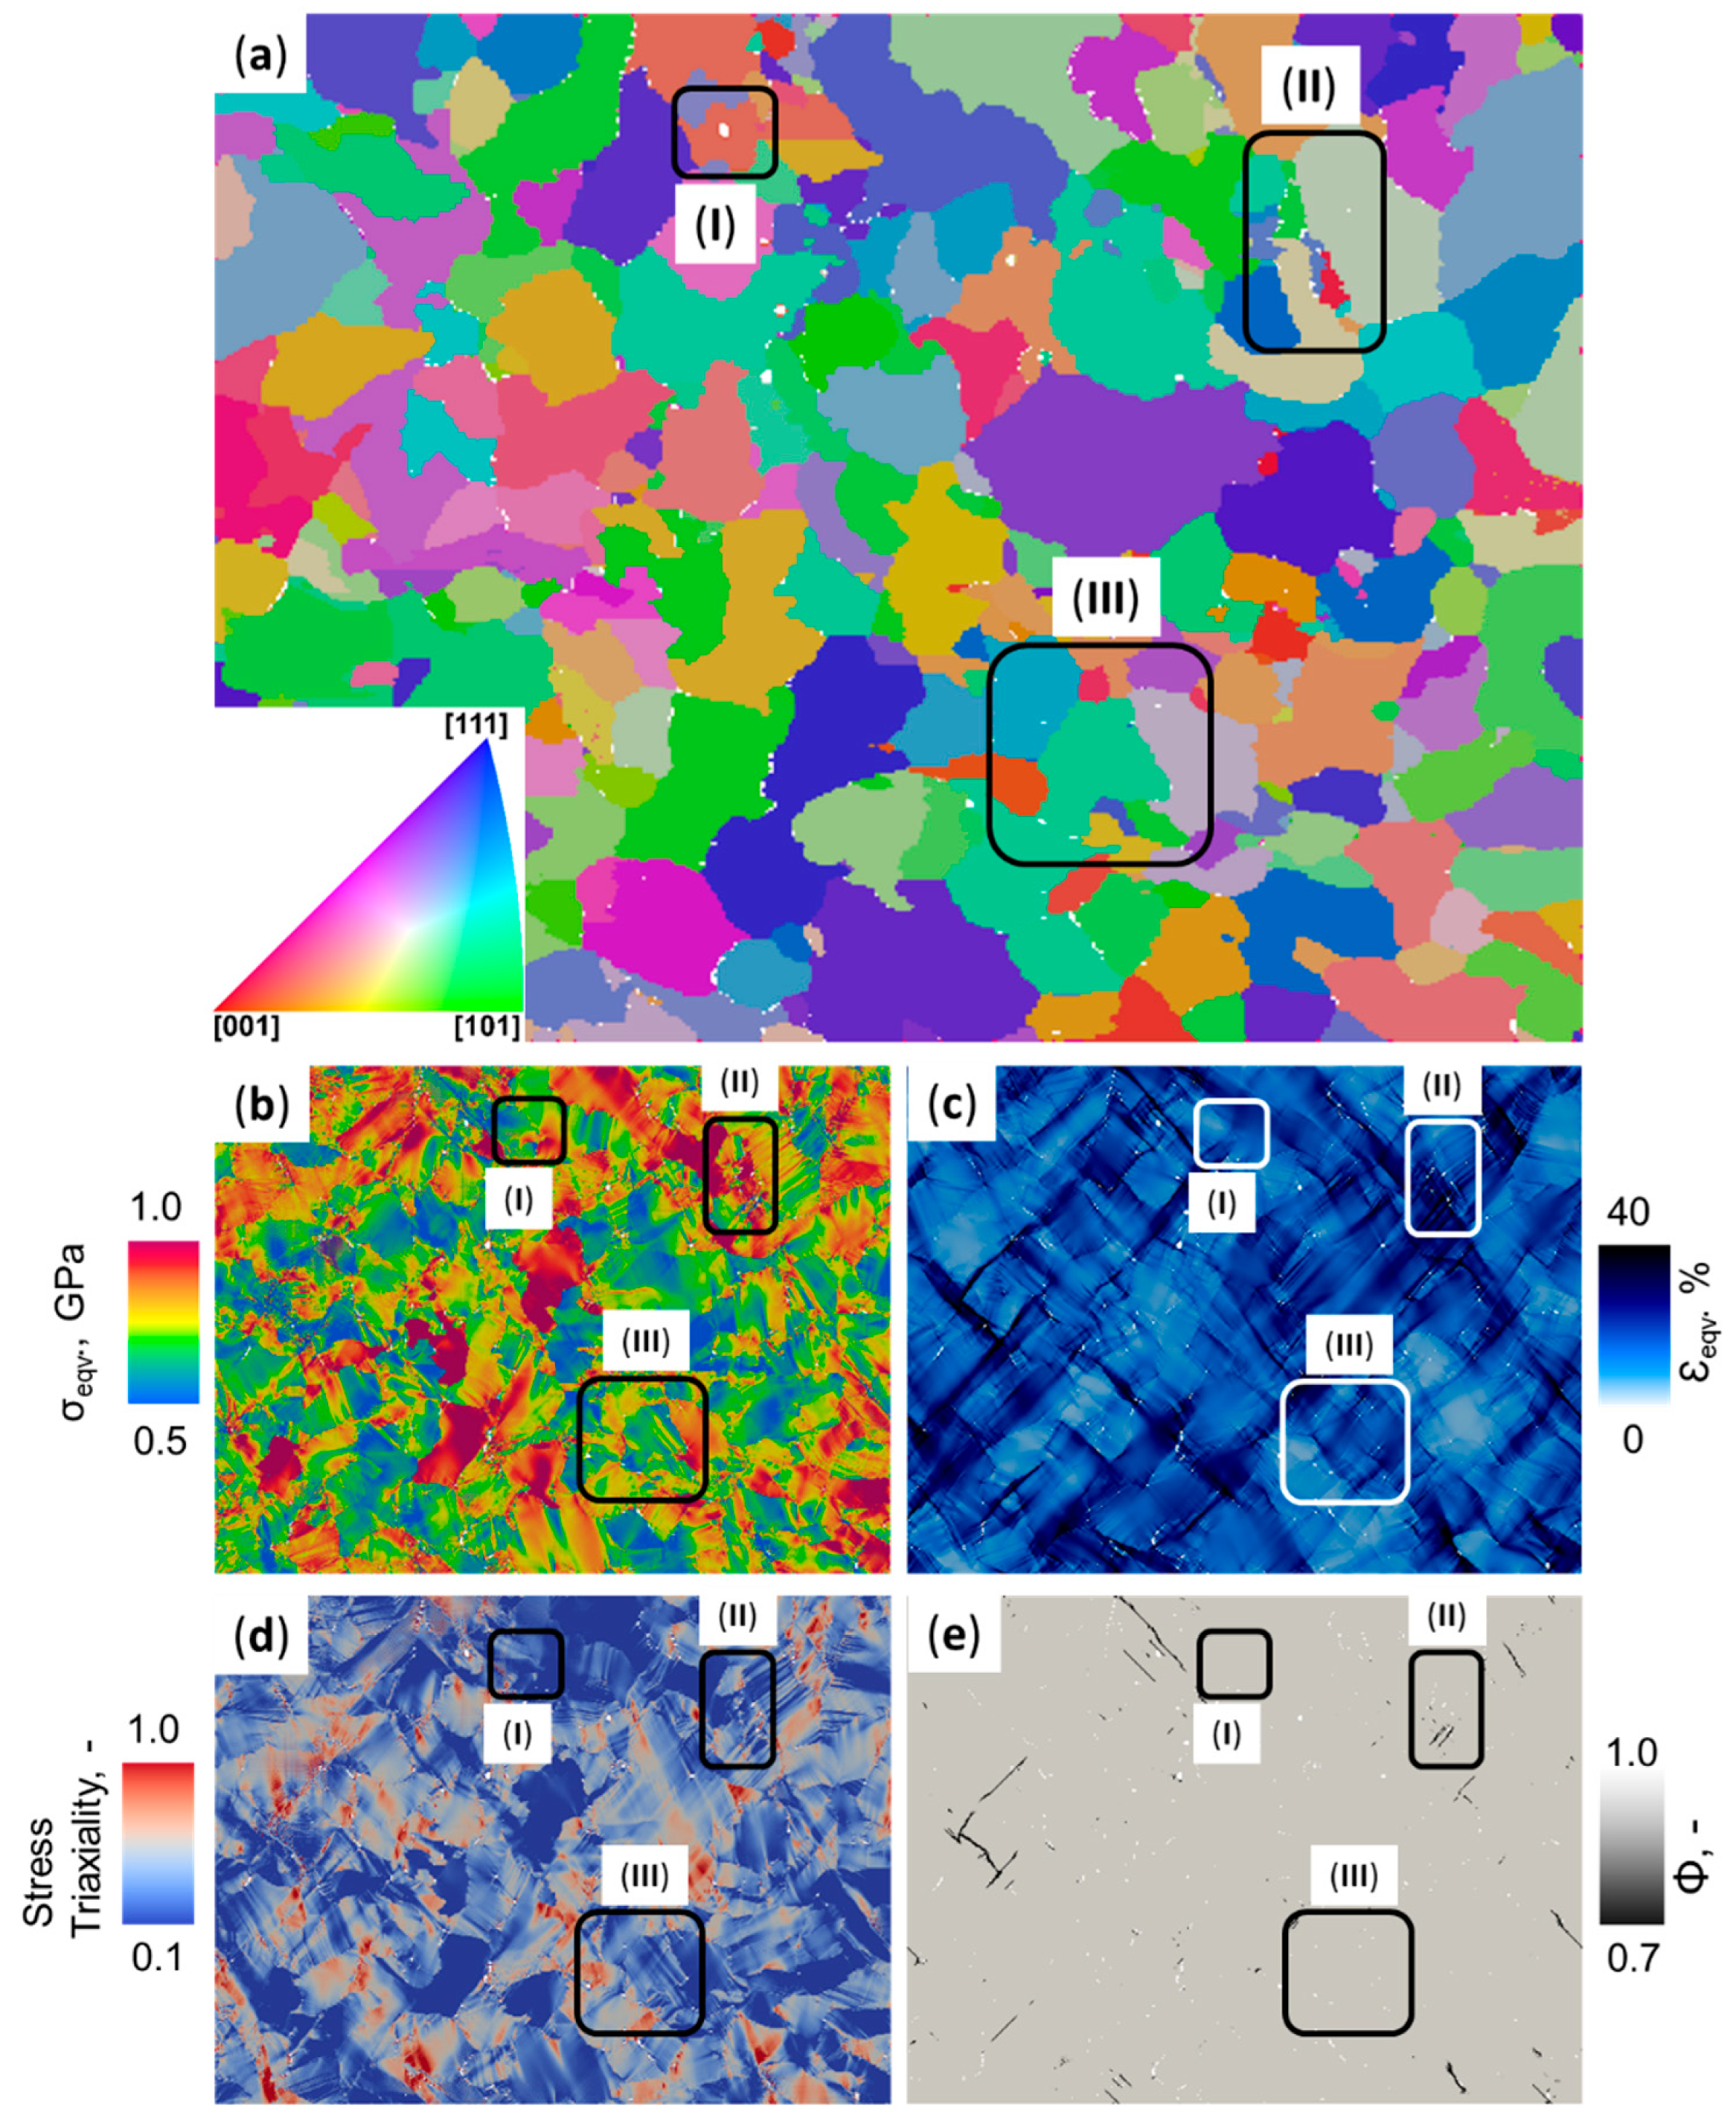
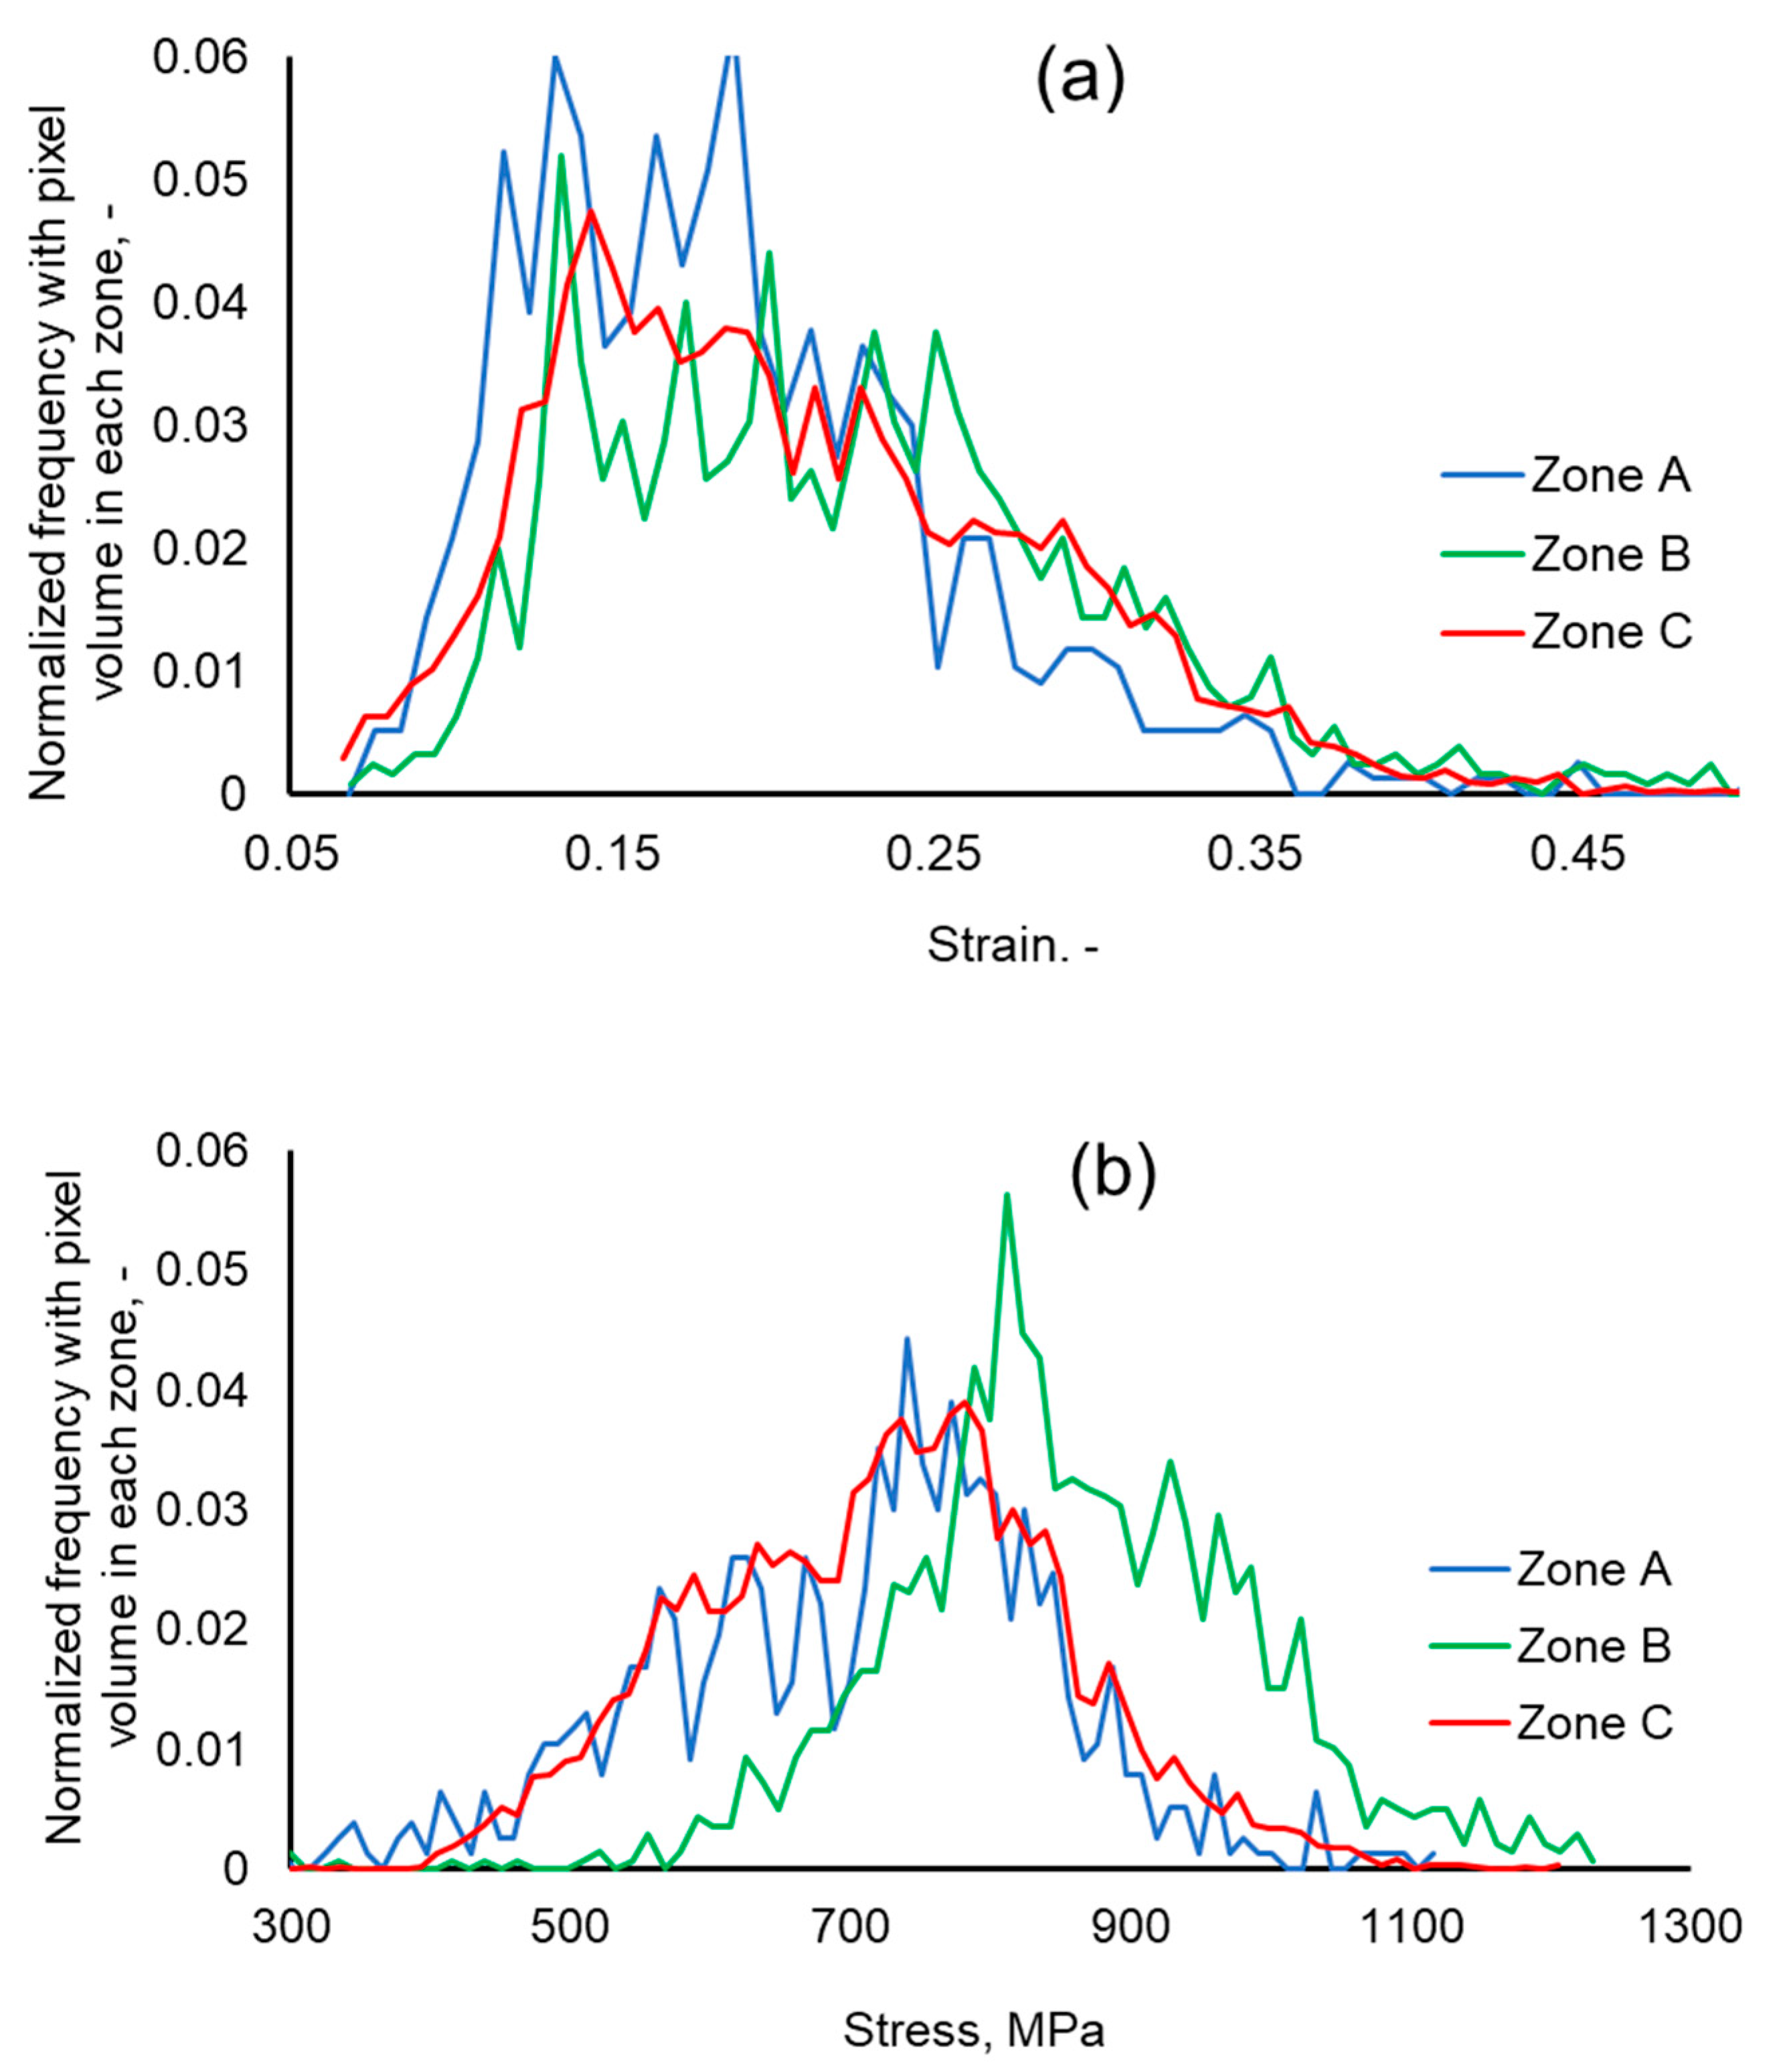
4.2. Local Results of Numerical Simulation
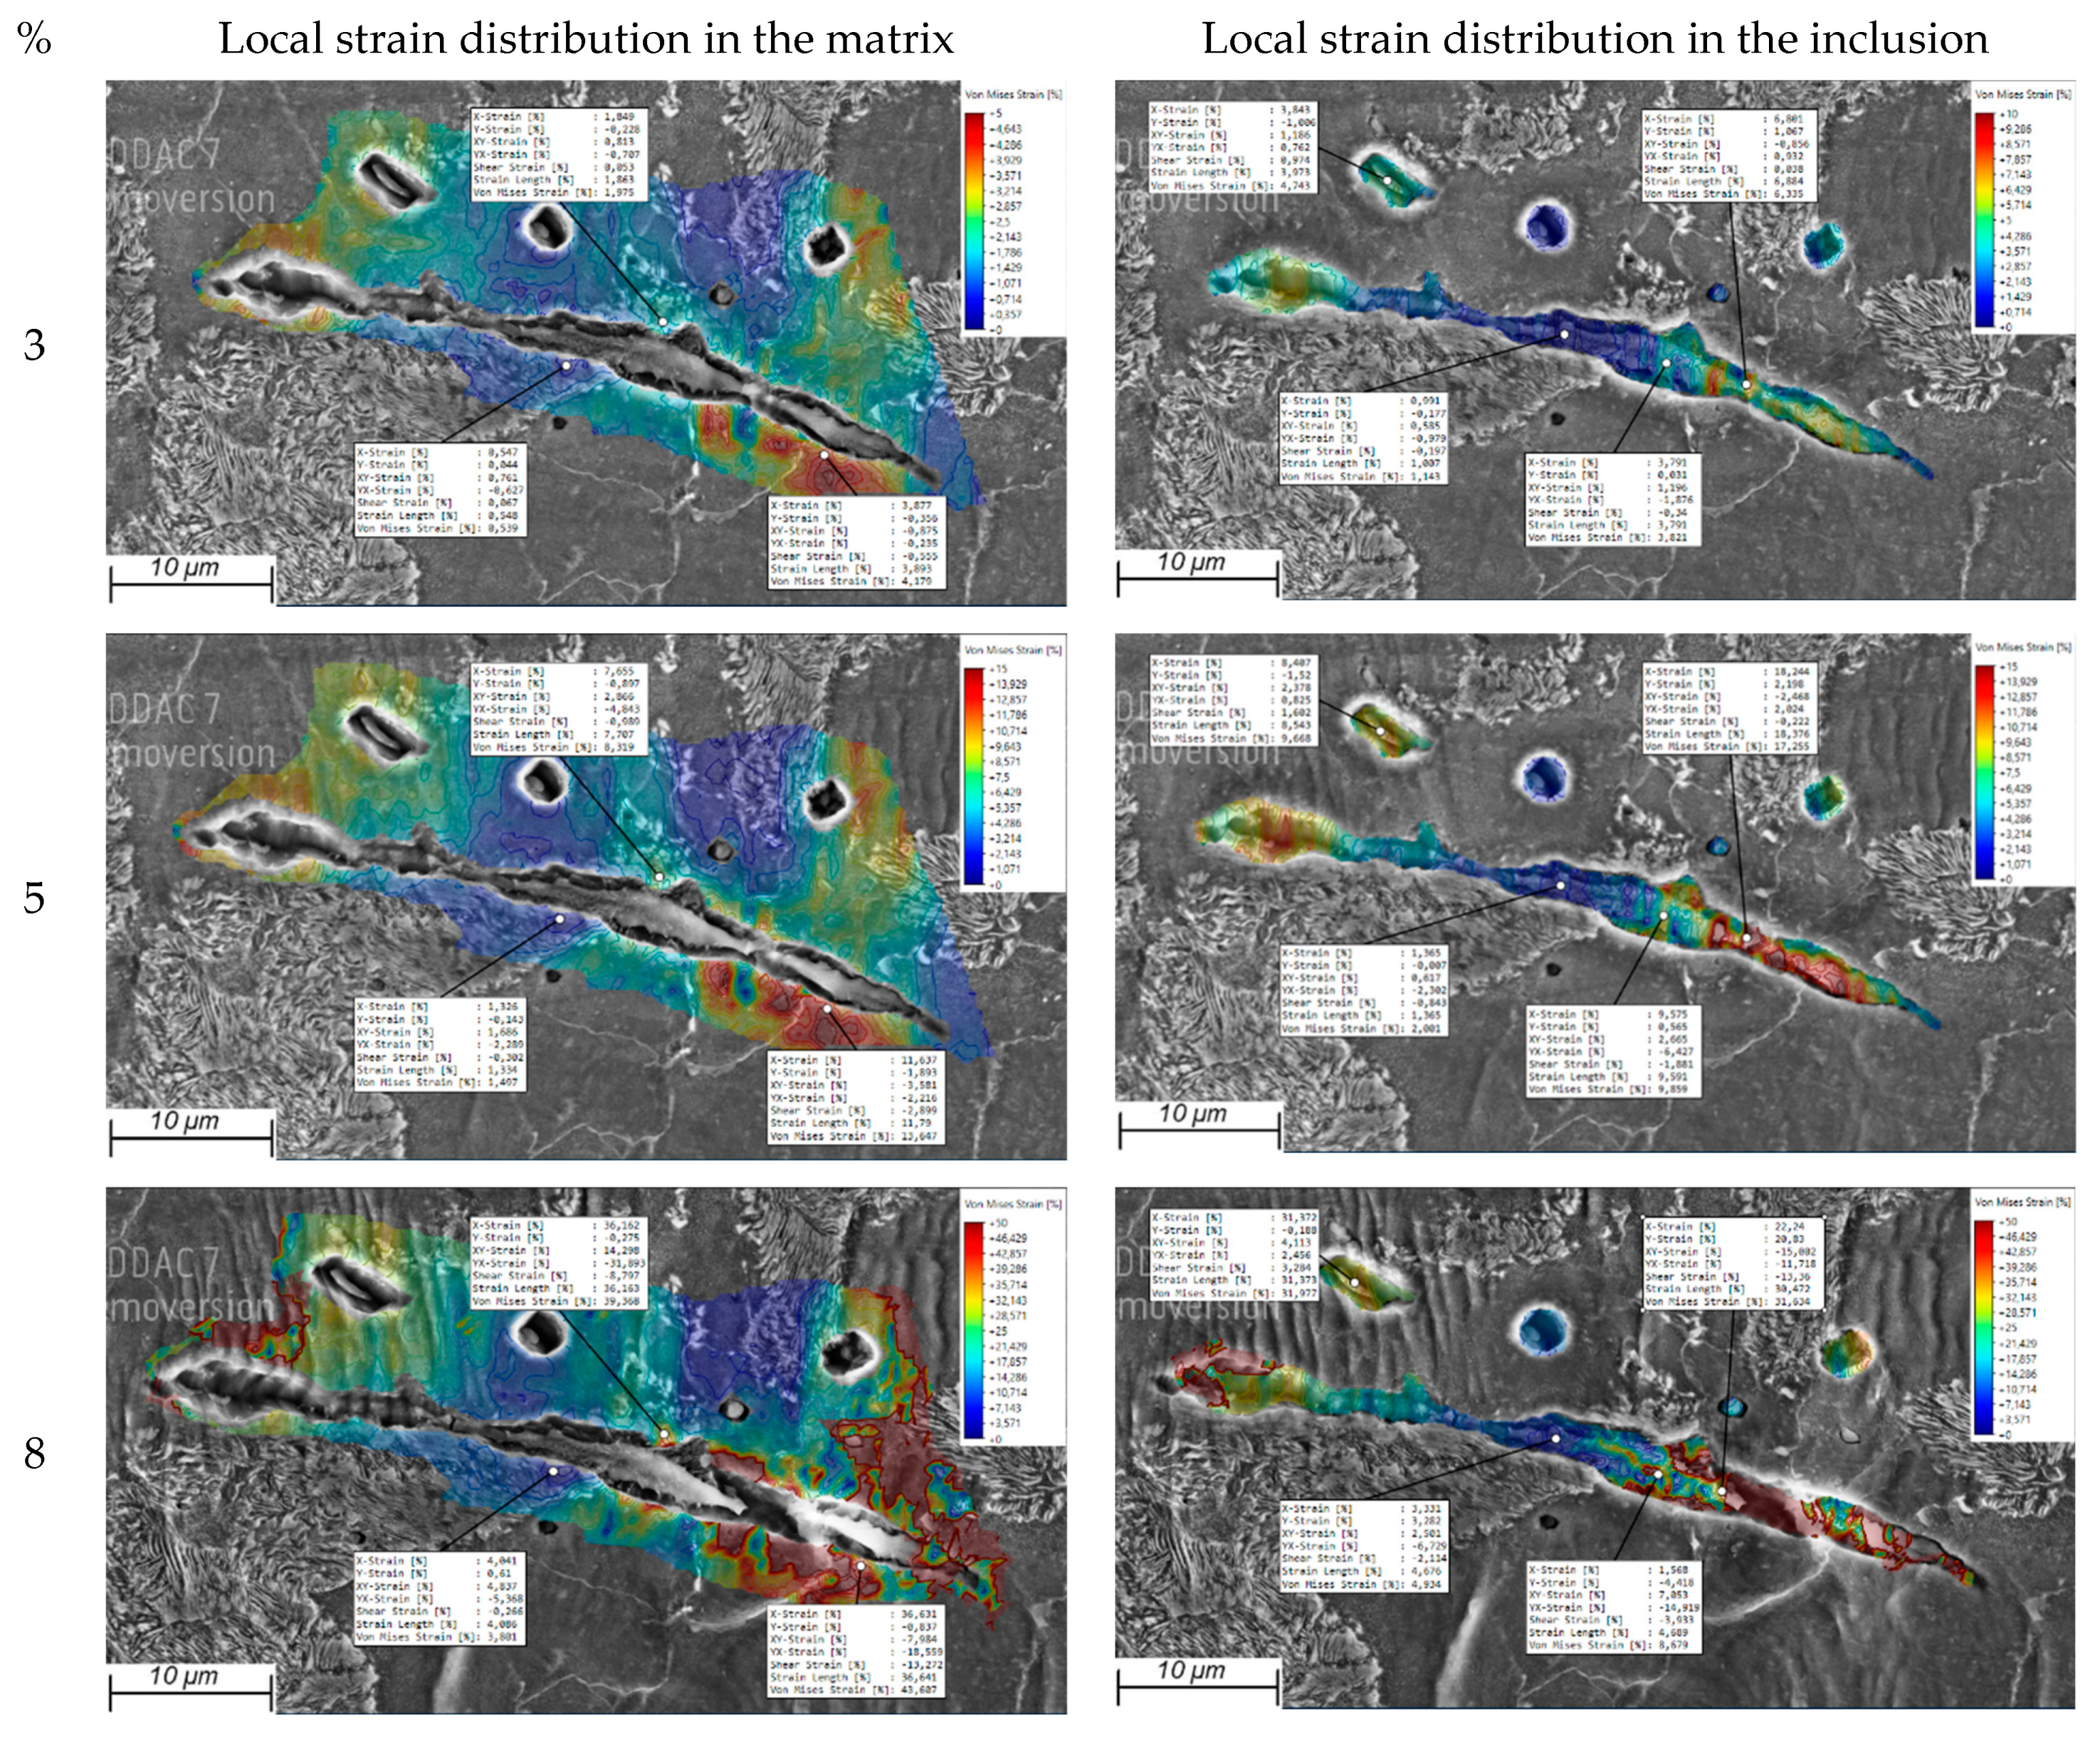
4.3. Local Results of the In Situ Tensile Test
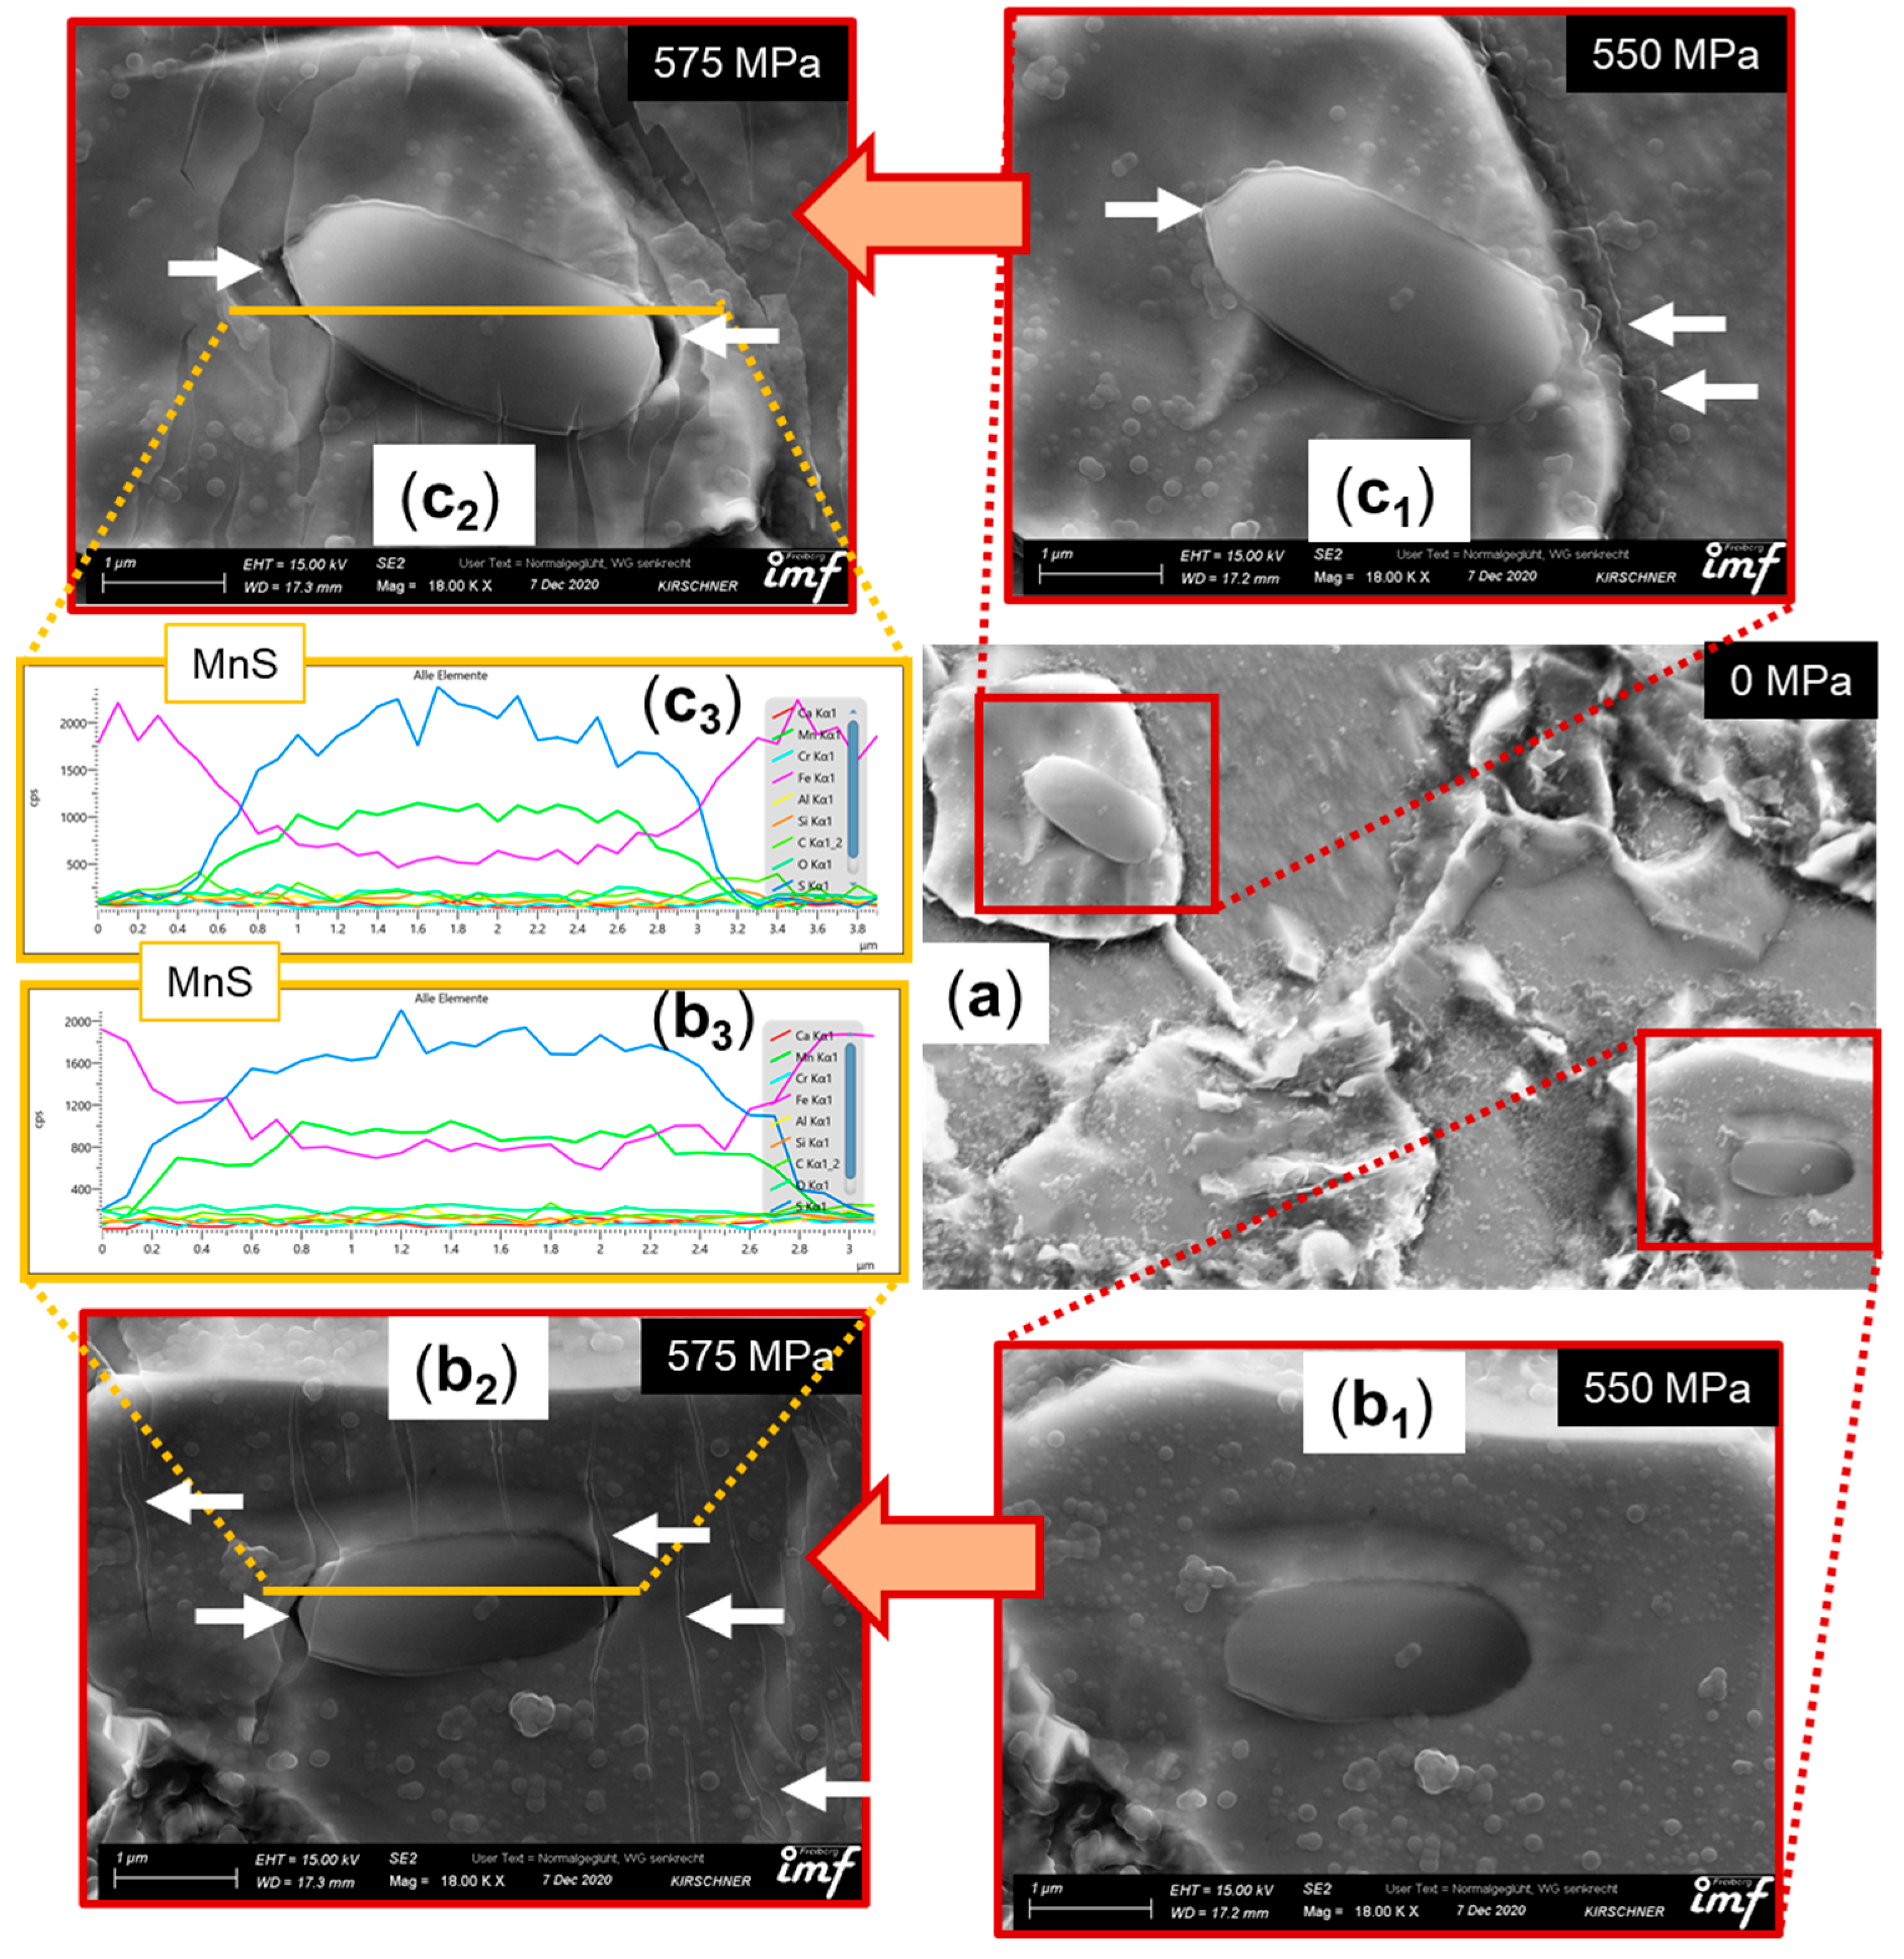
4.4. Damage Evolution around Non-Metallic Inclusions
5. Discussion
6. Conclusions
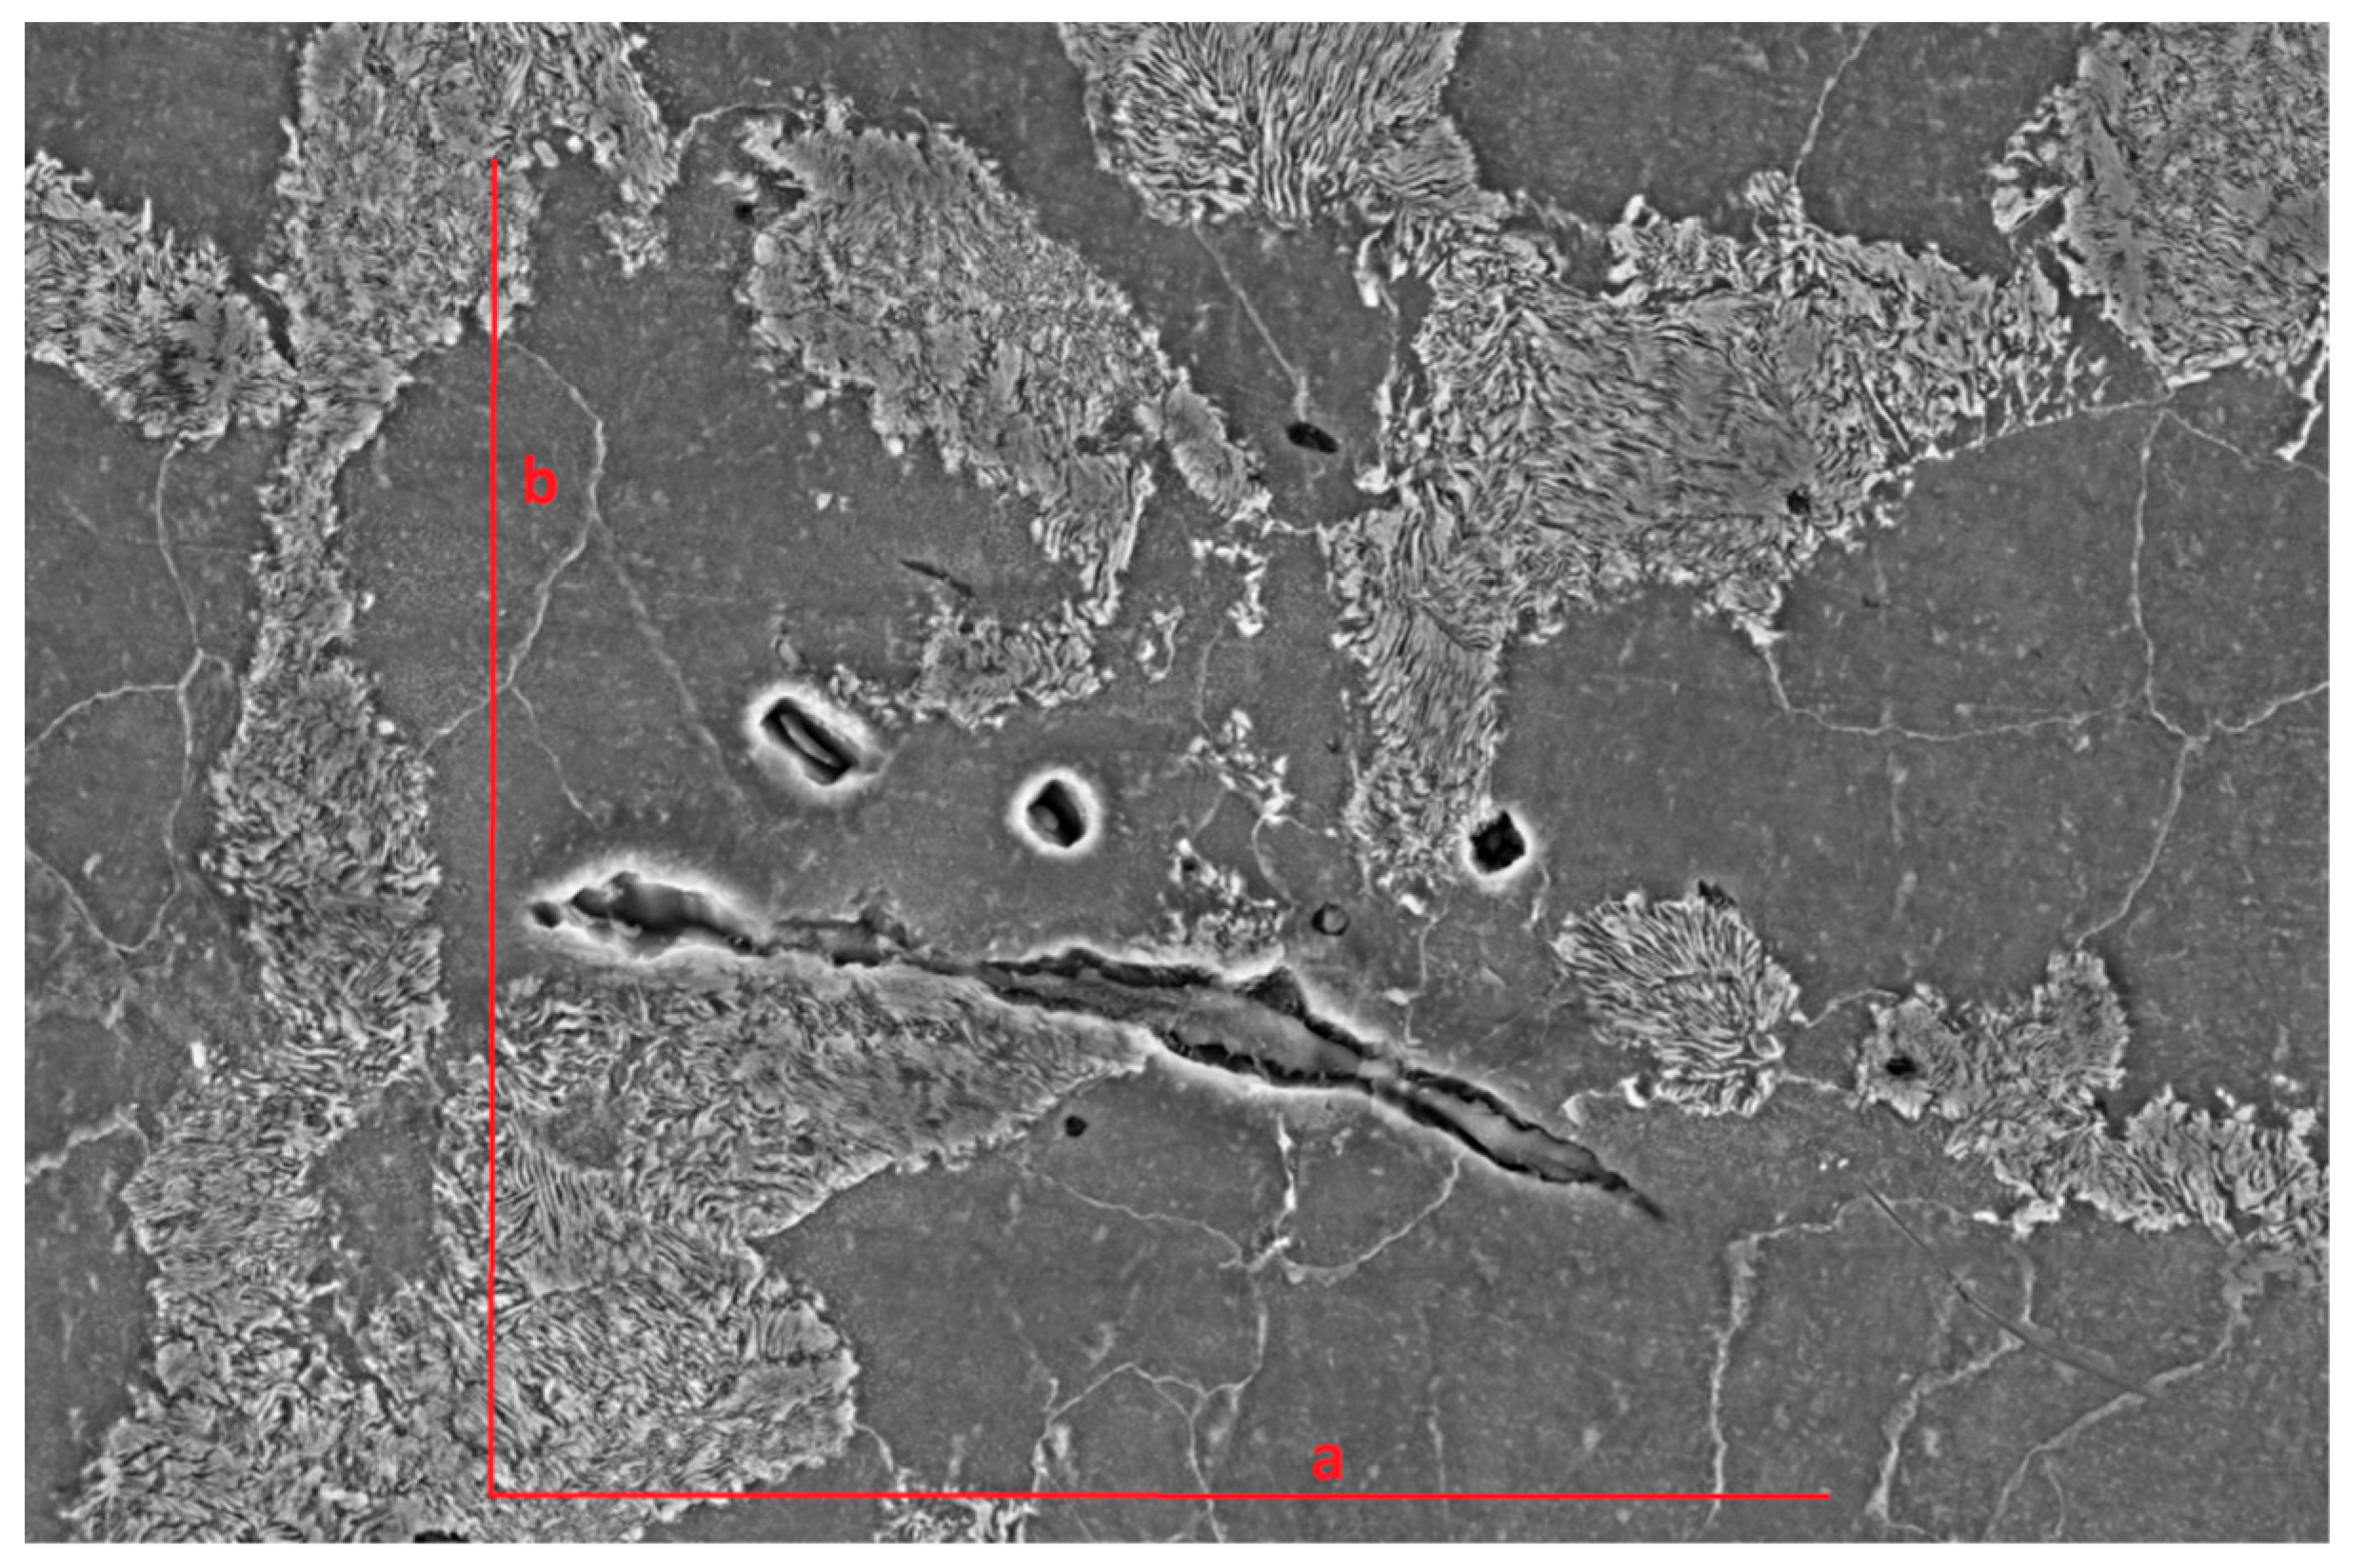
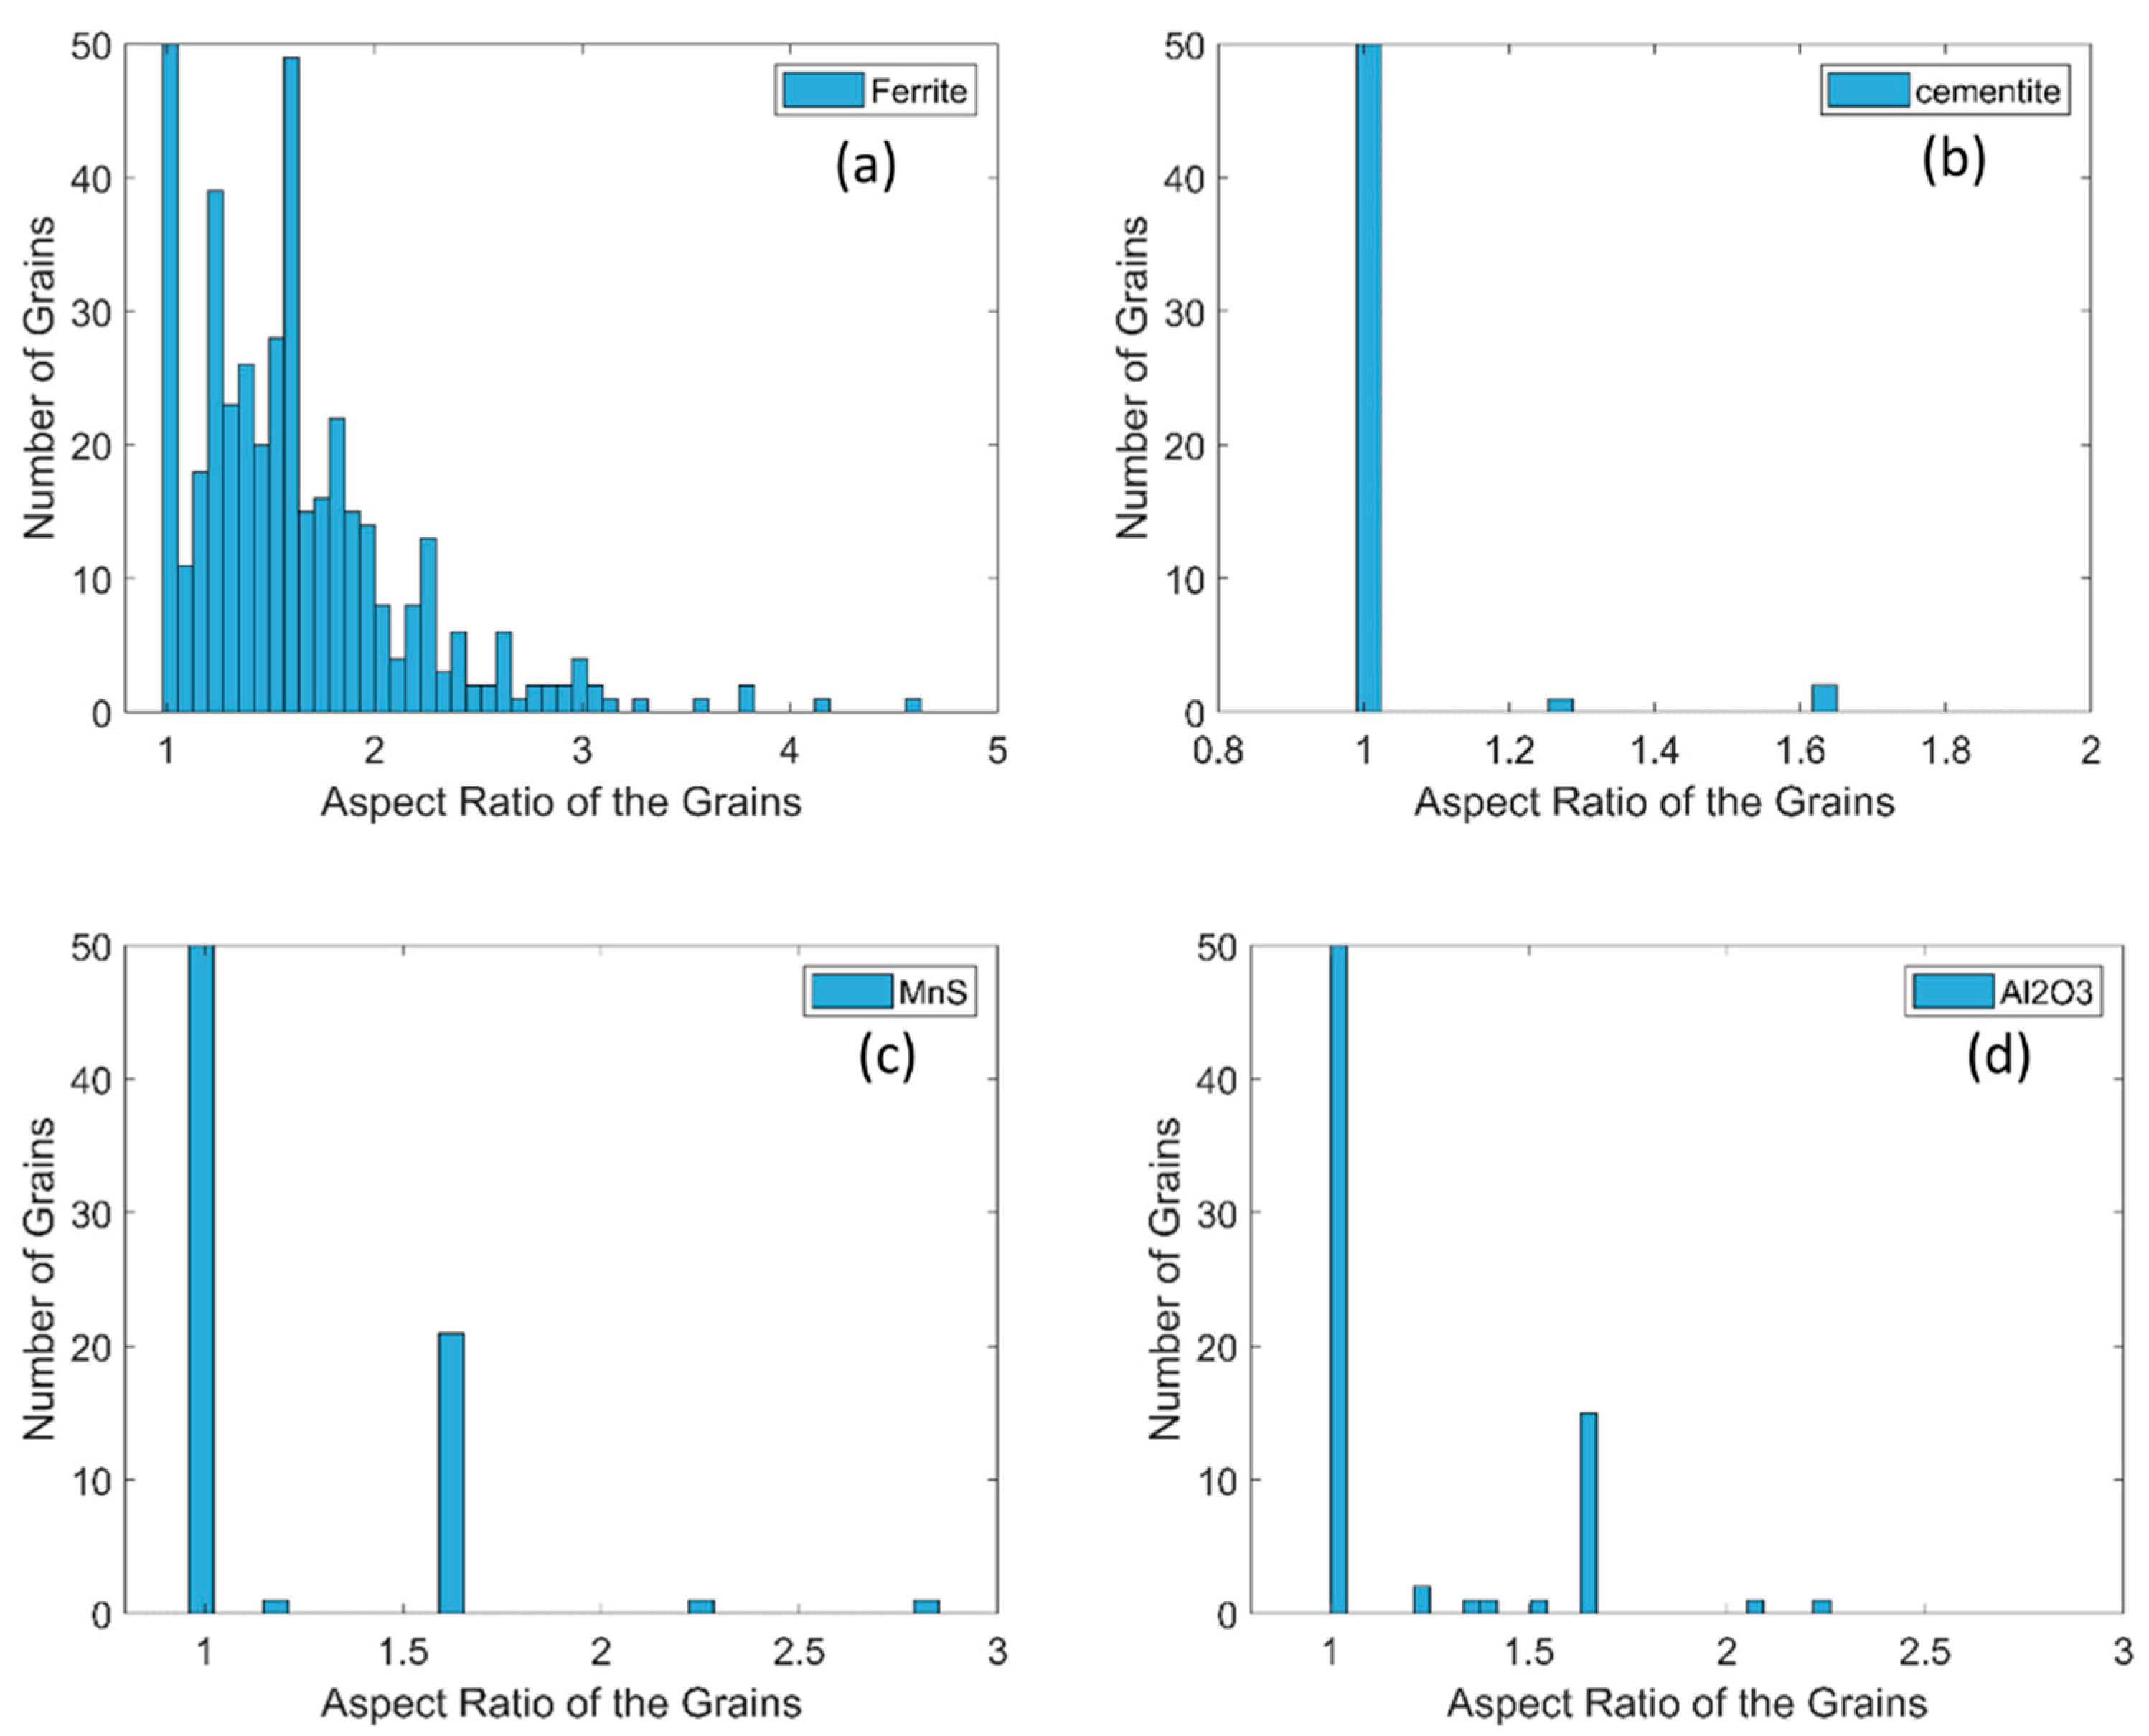
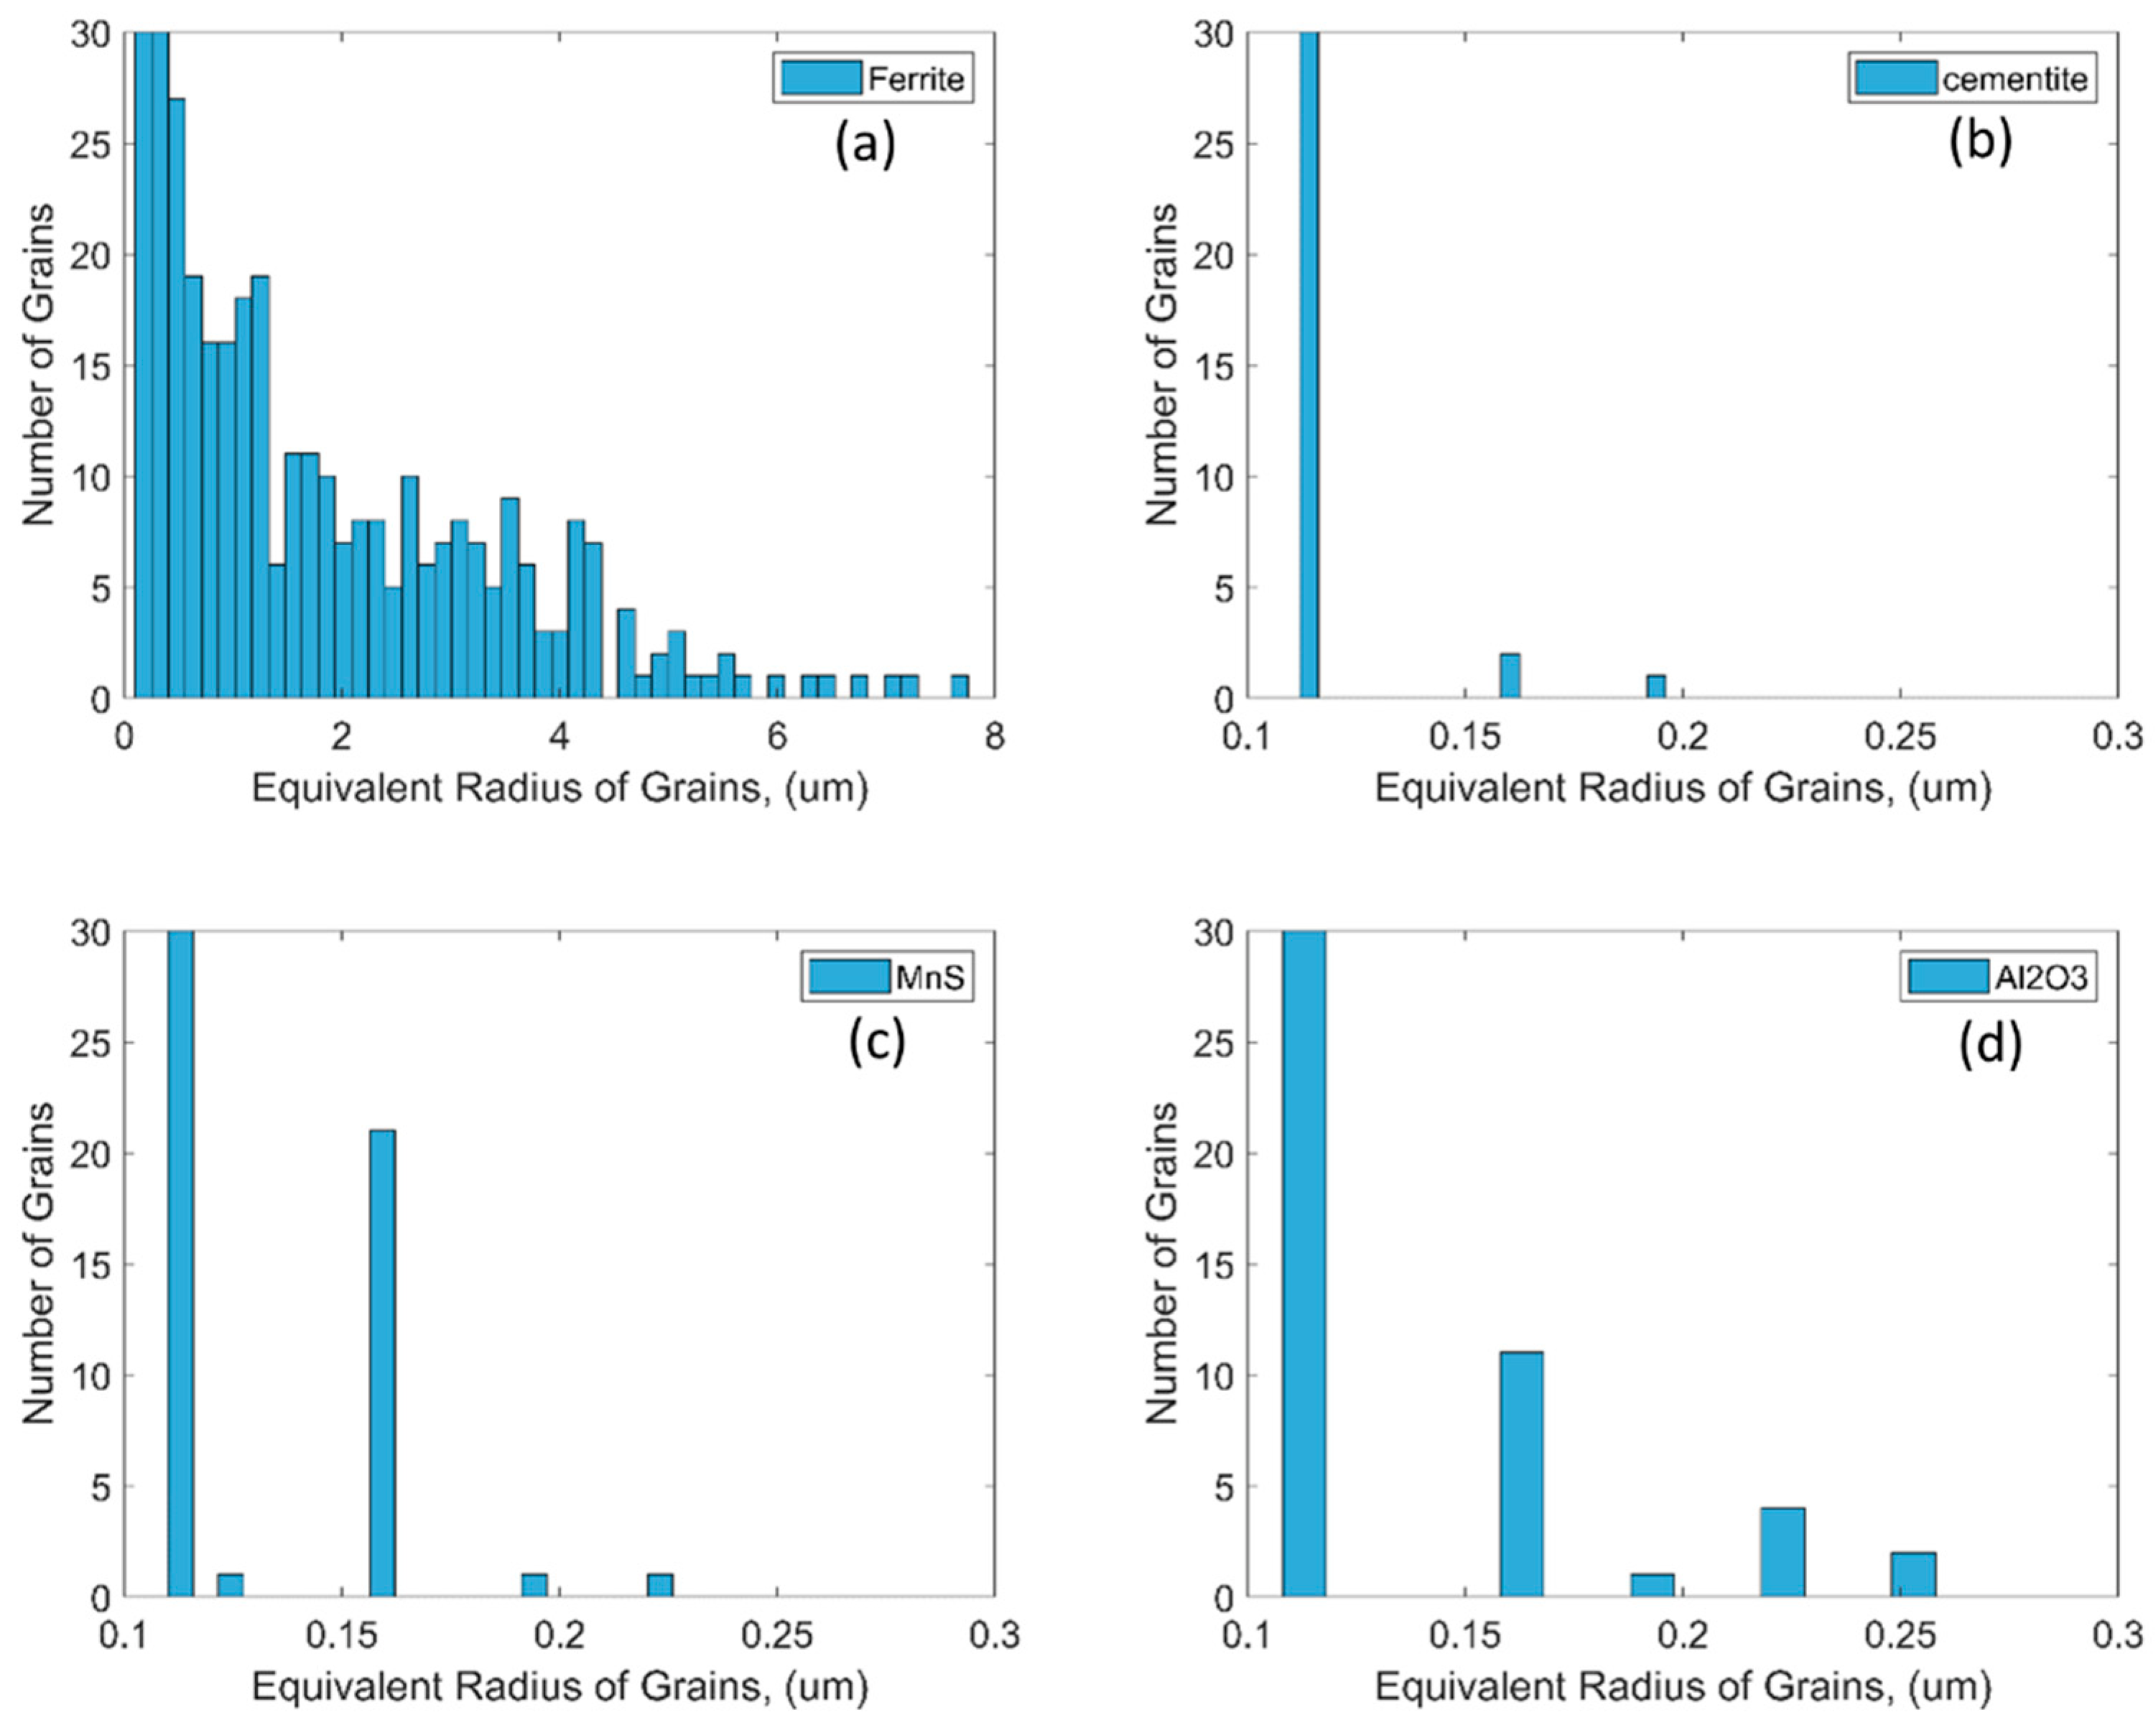
- The non-metallic inclusions are heterogeneously sized and heterogeneously distributed within the ferrite matrix. The inclusions are usually small (size ~2 µm) and elliptical (aspect ratio < ~2), with the exceptions of some extremely large (>10 µm up to 50 µm) and elongated (aspect ratio > 5) inclusions that are also present in the matrix. These large and elongated inclusions play a critical role in defining the limiting formability of the steel under consideration.
- The 2D full phase simulation model developed in the current work provides accurate information about the material’s local damage initiation and propagation under consideration. Although the same areas were not compared quantitatively, the simulation results match the experimental observations of global stress–strain response and the local damage initiation around the inclusions. Hence, the model can be used by engineers and researchers for further material engineering and optimization with confidence.
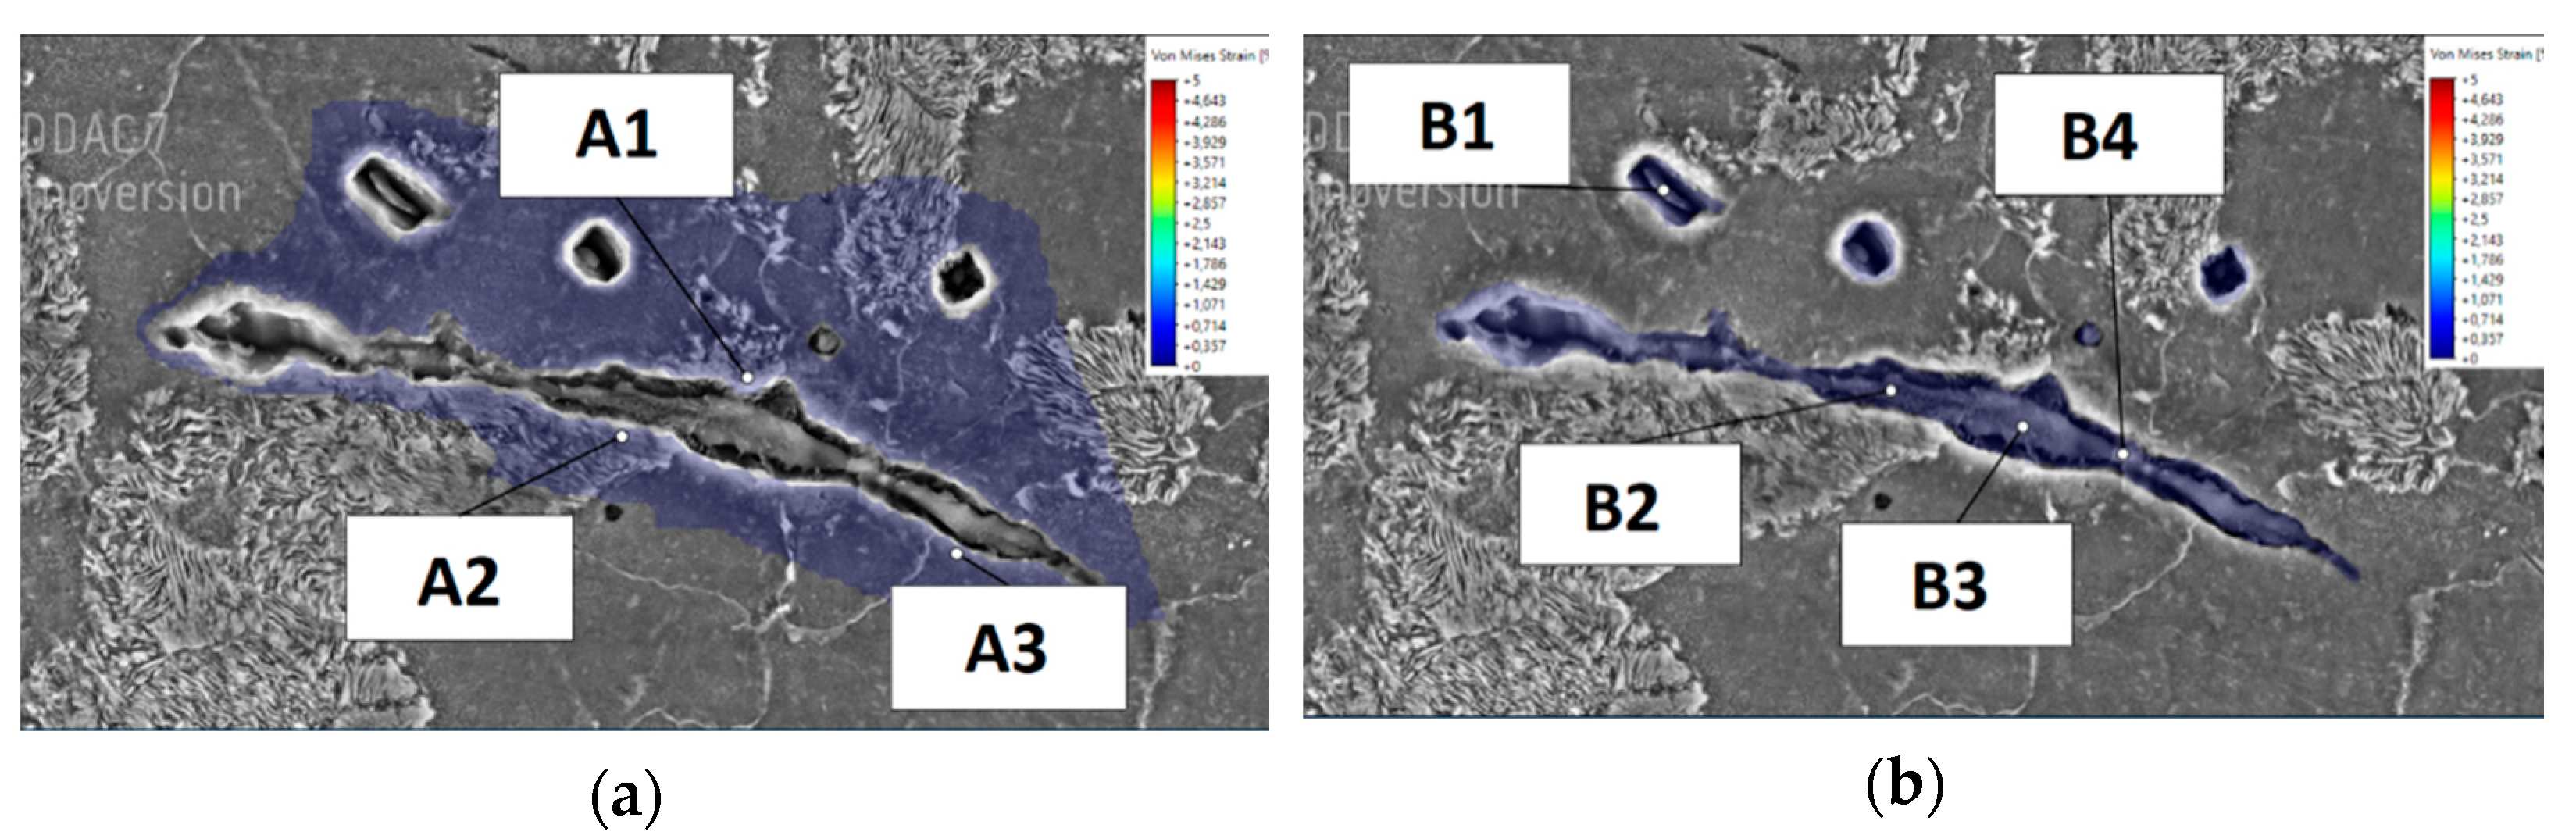
- The local stress and strain largely depend on the local composition and distribution of non-metallic inclusions and the size and orientation of the neighboring ferrite grains. The local stress in highly clustered zones is ~12% higher than the other material zones where the inclusions are more dispersed within the matrix.
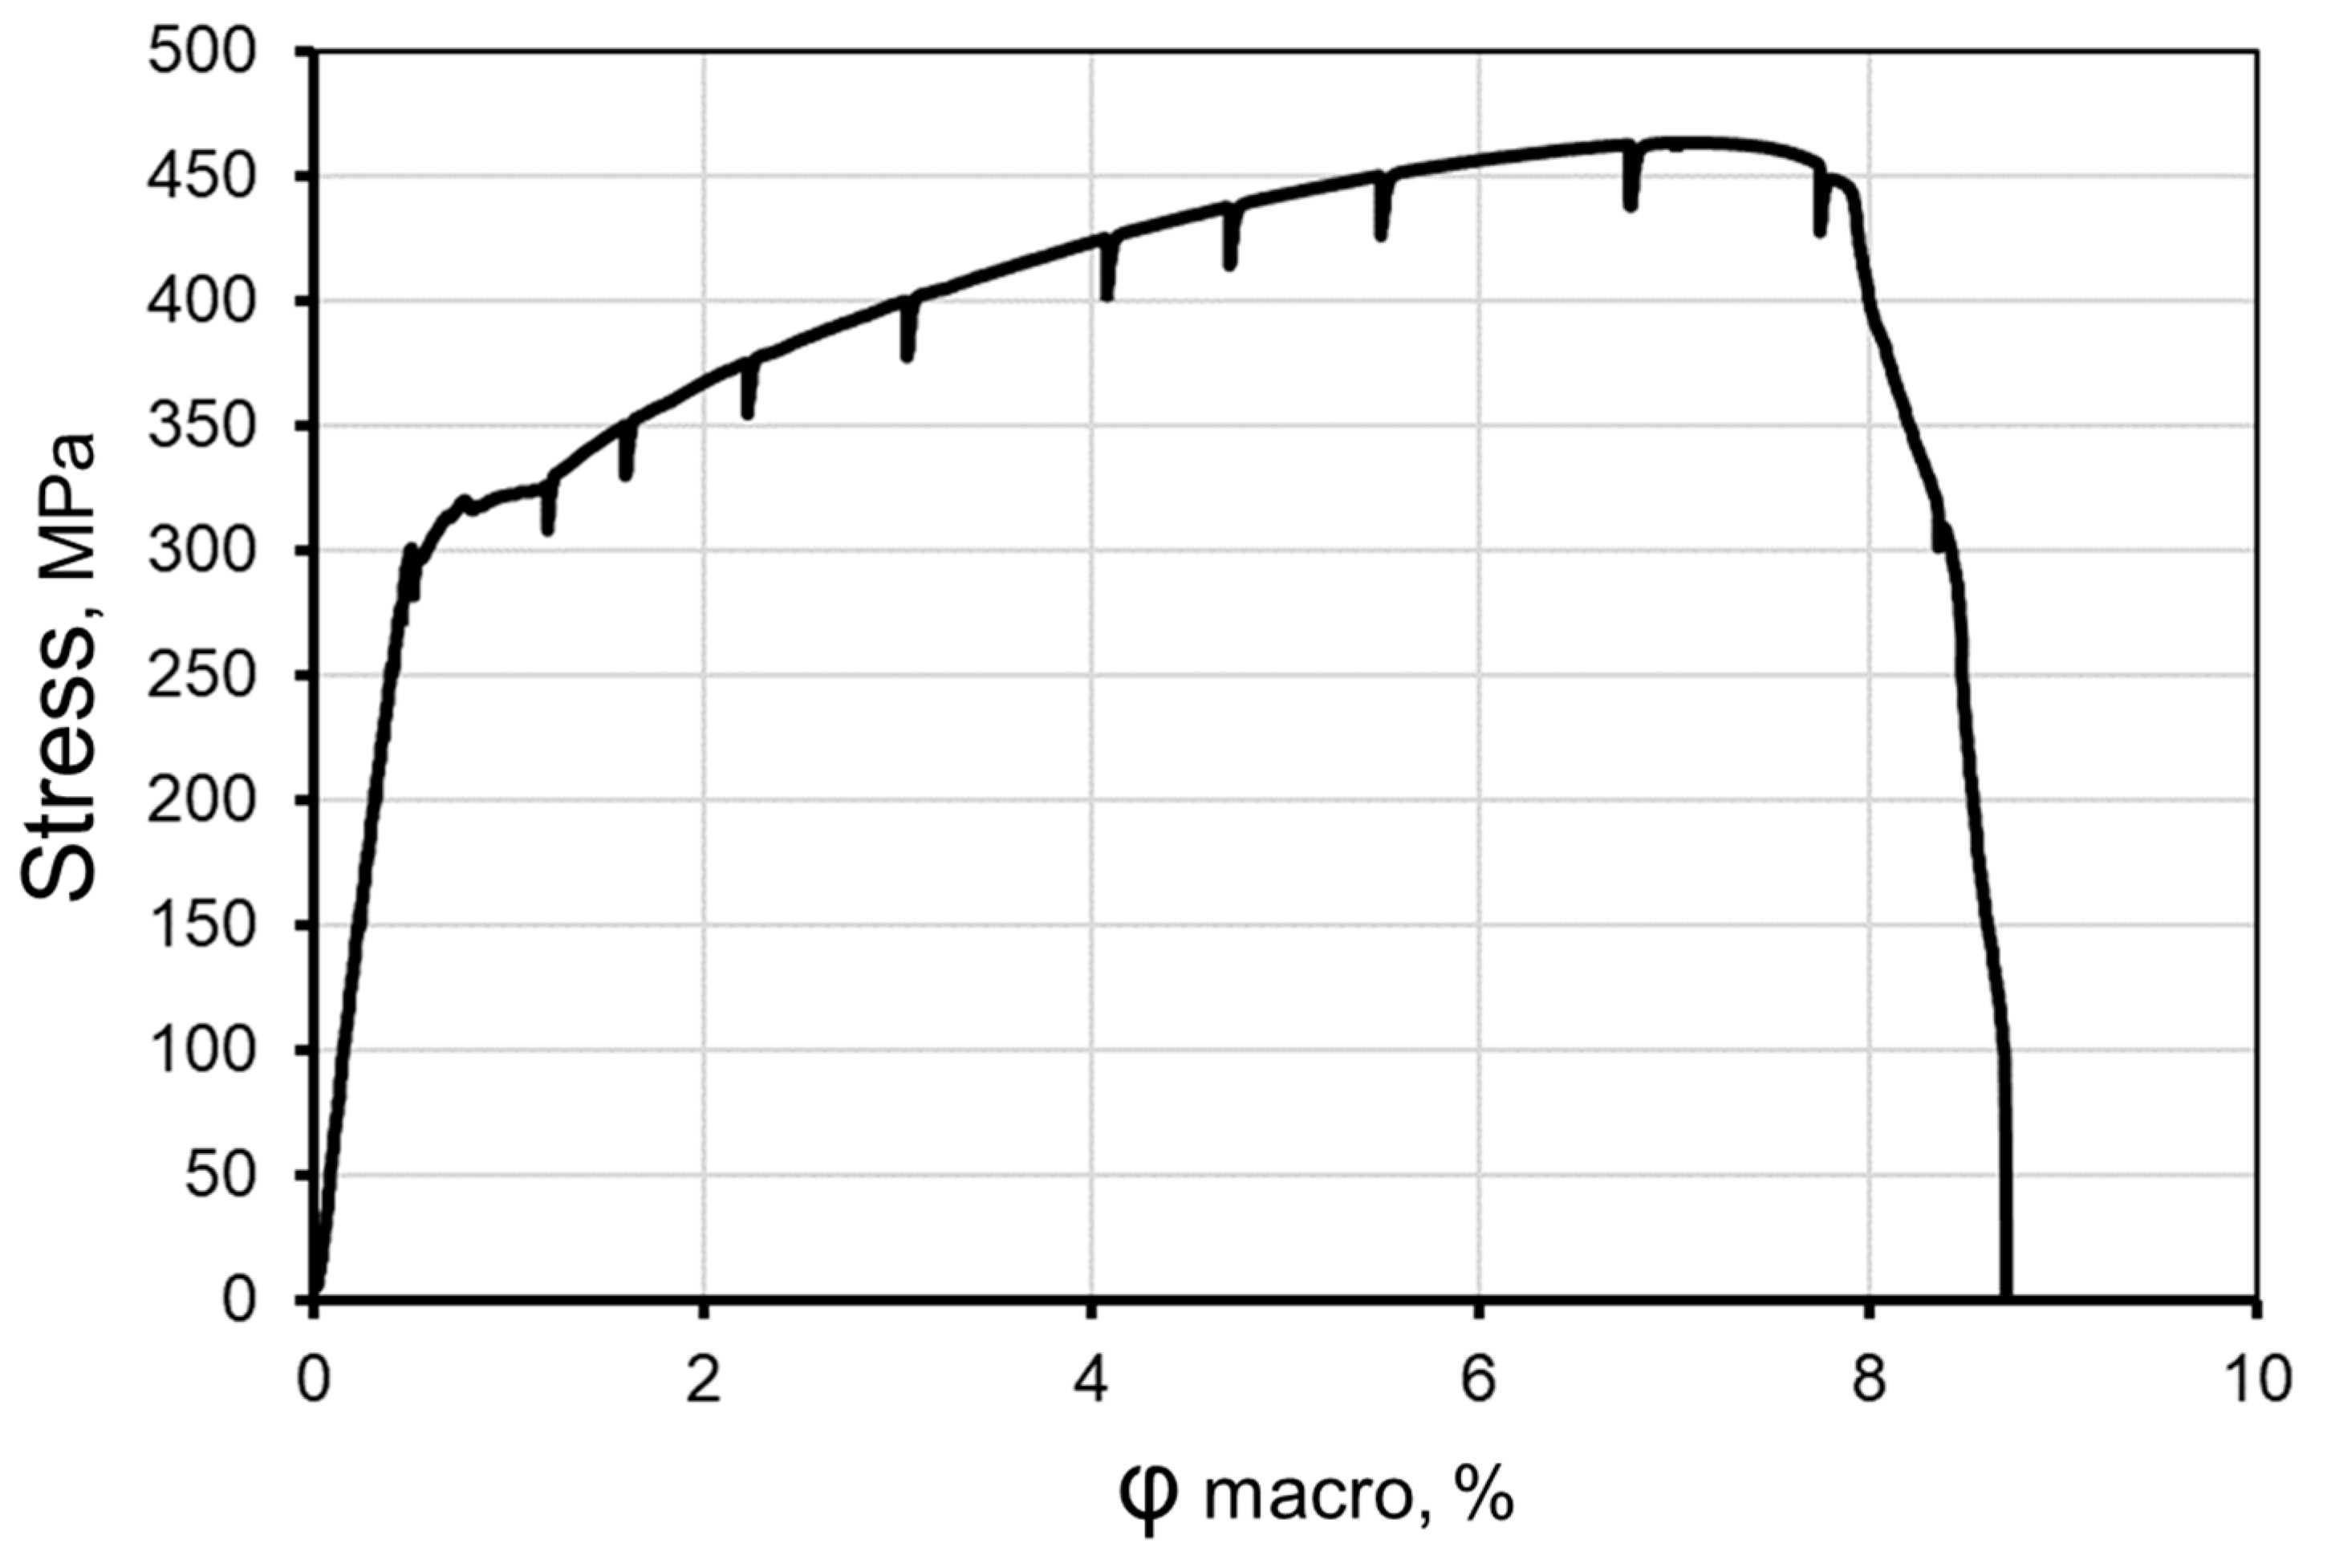
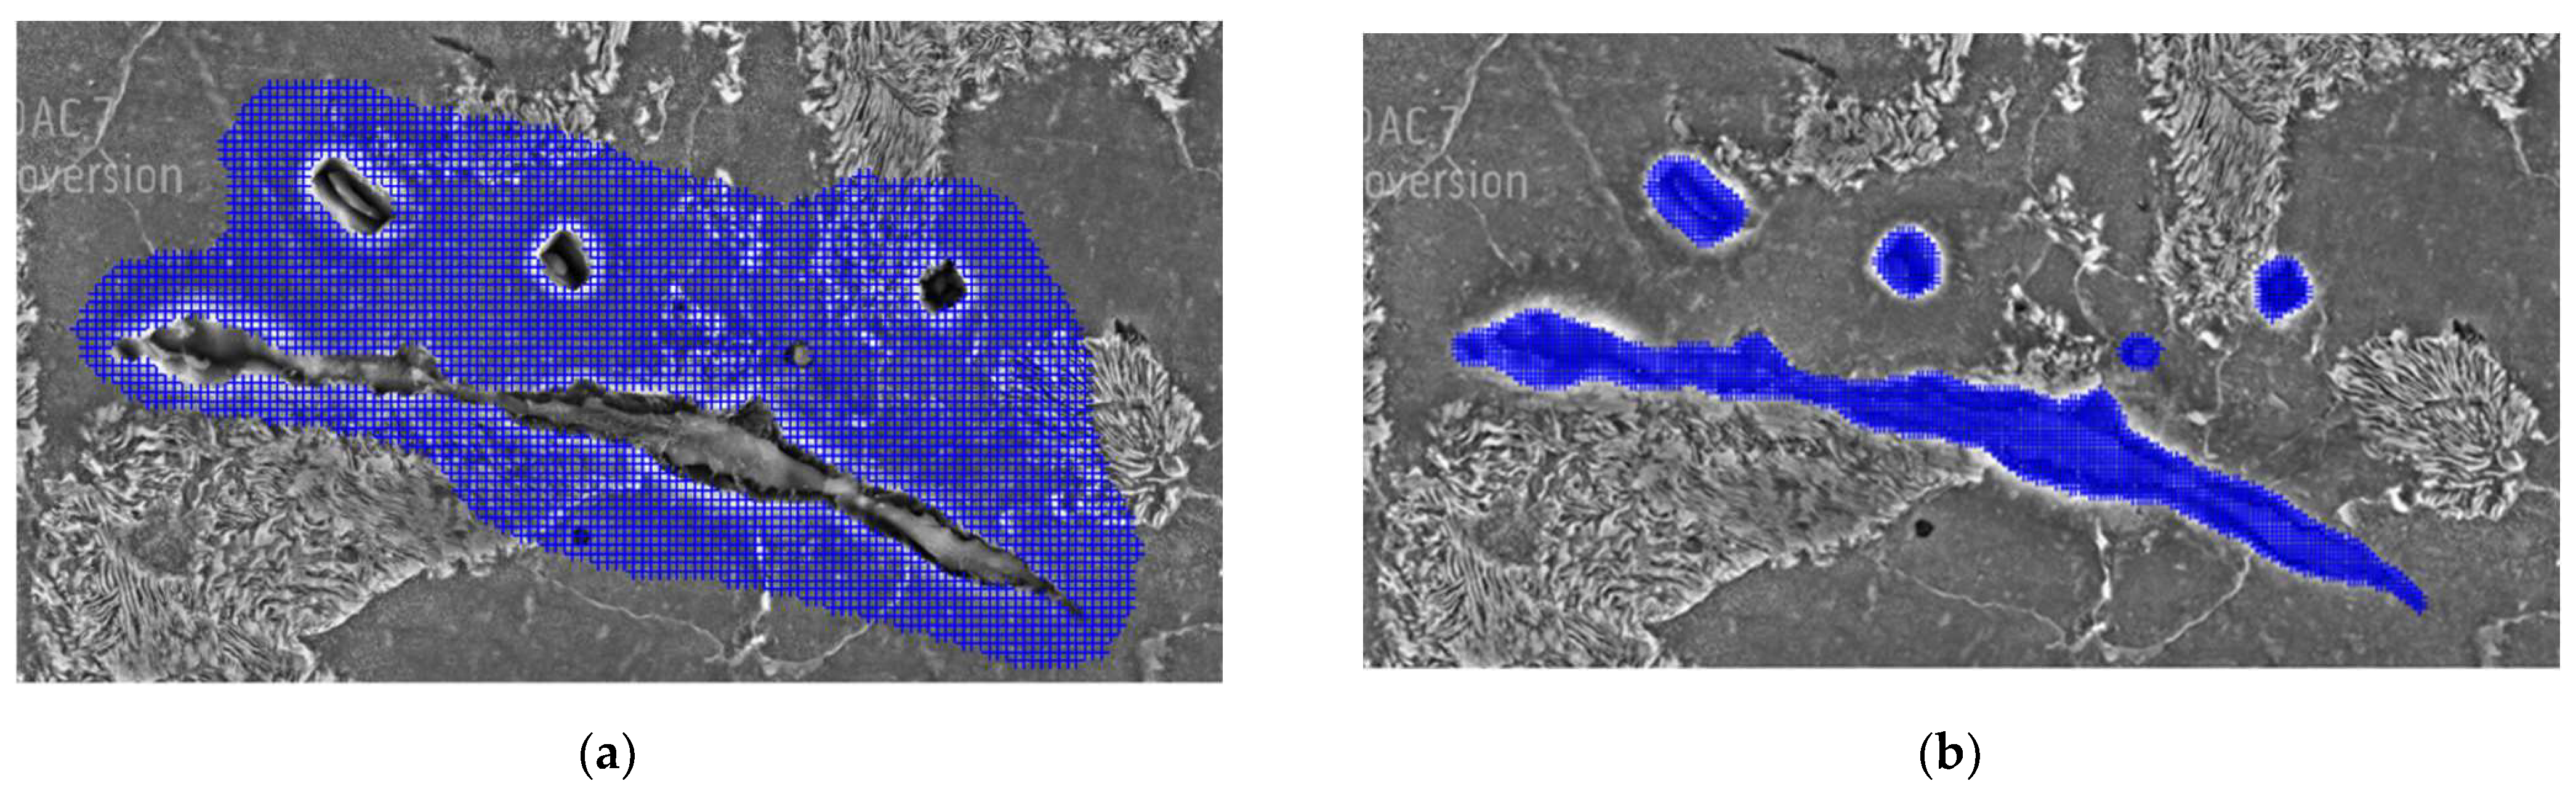
- The damage initiation and propagation also depend on the inclusion size and position. If the inclusion is very large, brittle fracture occurs at relatively lower applied external stress (~450 MPa), which results in the fast damage initiation and propagation in the matrix.For most small and relatively elliptical inclusions, the damage initiates on the matrix/inclusion interface at relatively high-stress regimes (~550 MPa). It propagates at an oblique angle to the applied load. These smaller and relatively elliptical inclusions are also less prone to brittle cracking and strengthen the matrix during deformation.
- An adequate material manufacturing methodology should be employed for the material class under consideration, resulting in small, elliptical, homogeneously distributed inclusions within the ferrite matrix. This would result in a material with better formability and higher damage resistance.
Author Contributions
Funding
Institutional Review Board Statement
Informed Consent Statement
Data Availability Statement
Acknowledgments
Conflicts of Interest
Nomenclature
| Acronyms | |
| Symbol | Description |
| SEM | Scanning electron microscope |
| SE | Secondary electron (detector) |
| BSE | Back scatter electron (detector) |
| EDS | Eenergy dispersive spectorscope |
| EBSD | Electron back scatter diffraction |
| DAMASK | Düsseldorf advanced material simulation kit |
| RVE | Representative volume element |
| NME | Non-metallic inclusions |
Appendix A. Limitations and Challenges Associated with the In Situ Tensile Test Methodology
- The surface of the specimen was metallographically prepared for colloidal silicon dioxide (OPS);
- On a clean polished dip plate, 10–20 drops of OPS were placed along the diameters;
- The specimen was pressed onto the cloth with 1–2 MPa pressure and turned for 1 s at 2 rpm;
- With water flushing and 100 RPS plate speed, the specimen was rotated on the cloth at 1–2 MPa pressure at 2 RPS for 3 s;
- The specimen surface was rinsed with ethanol and dried with a blower.
Appendix B. Local Mises Strain Measurement
| MPa | A [µm] | B [µm] | Angle of Axis A [Degrees] | Angle of Axis B [Degrees] | Angle [Degree] |
|---|---|---|---|---|---|
| 0 | 50 | 50 | 0 | 90 | 90 |
| 300 | 50.63 | 49.87 | 0.5 | 90 | 89.5 |
| 375 | 50.8 | 49.96 | 0.1 | 90.1 | 90 |
| 400 | 51.1 | 49.83 | −0.19 | 90.4 | 90.59 |
| 425 | 51.52 | 49.66 | −0.28 | 90.24 | 90.52 |
| 437 | 51.94 | 49.66 | −0.37 | 90.19 | 90.56 |
| 450 | 52.41 | 49.62 | −0.42 | 90.44 | 90.86 |
| 462 | 53.46 | 49.54 | −0.54 | 90.73 | 91.27 |
| 450_2 | 57.01 | 49.89 | −0.72 | 91.5 | 92.22 |
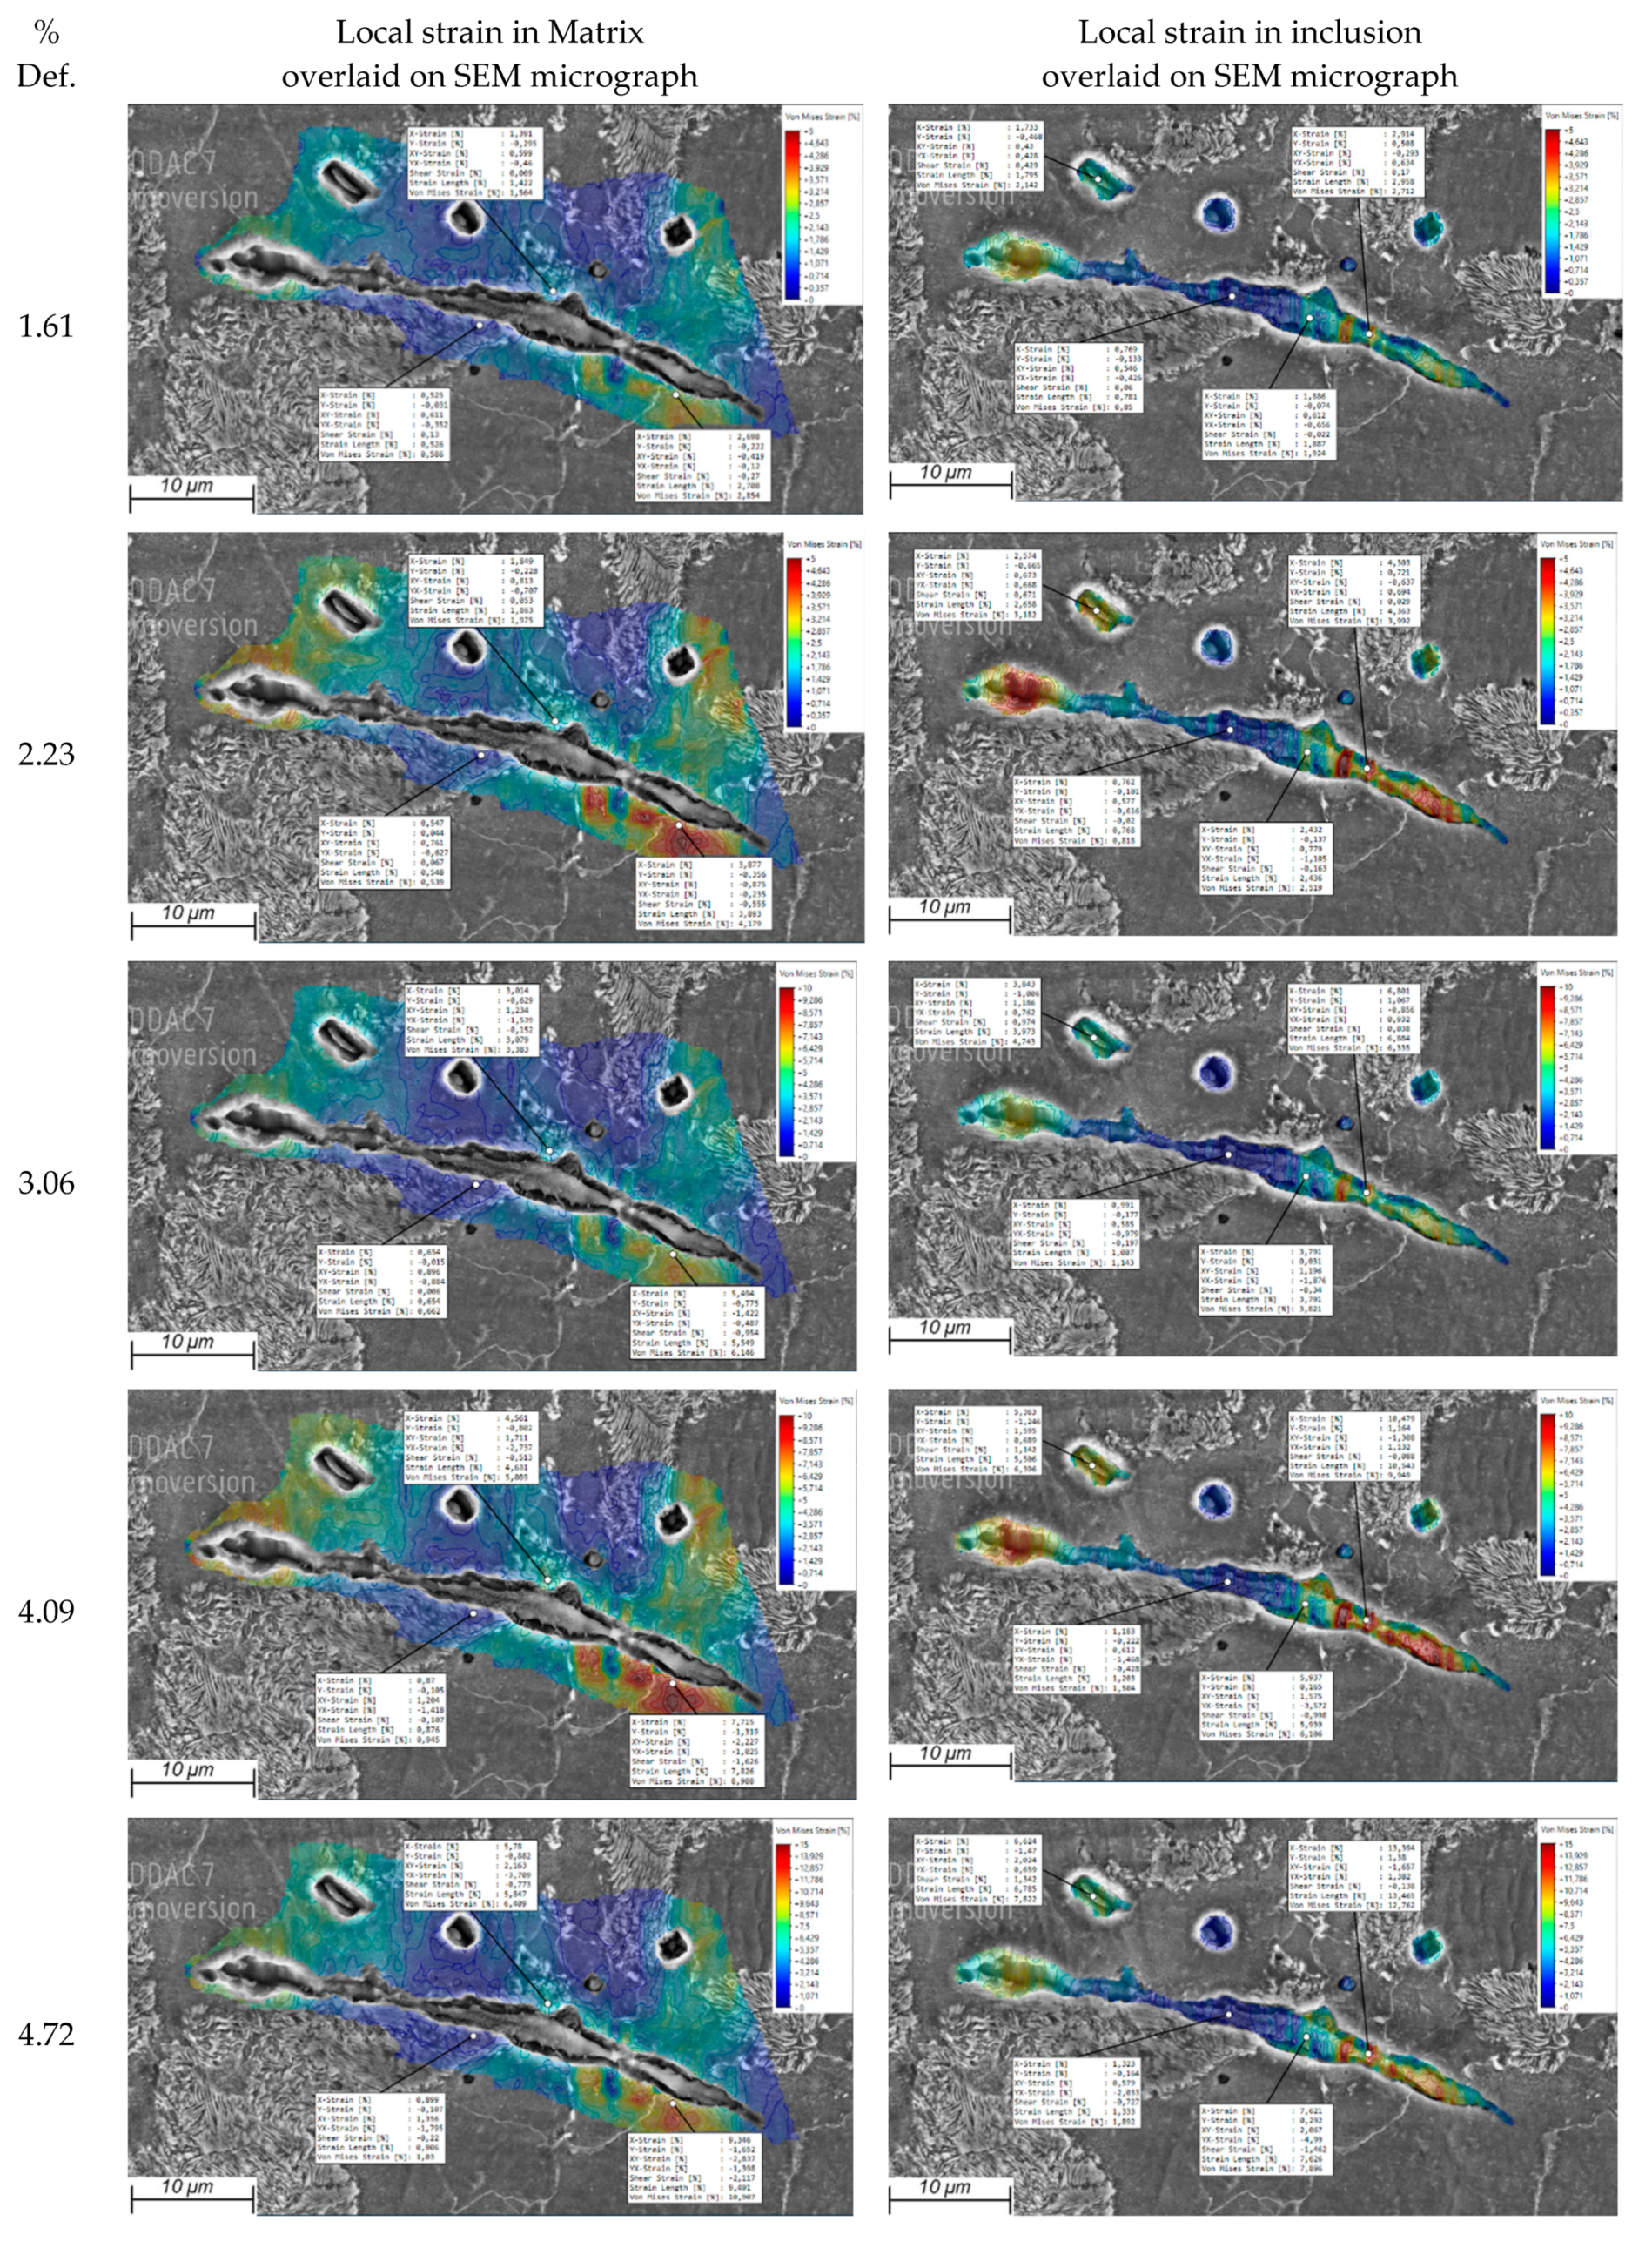
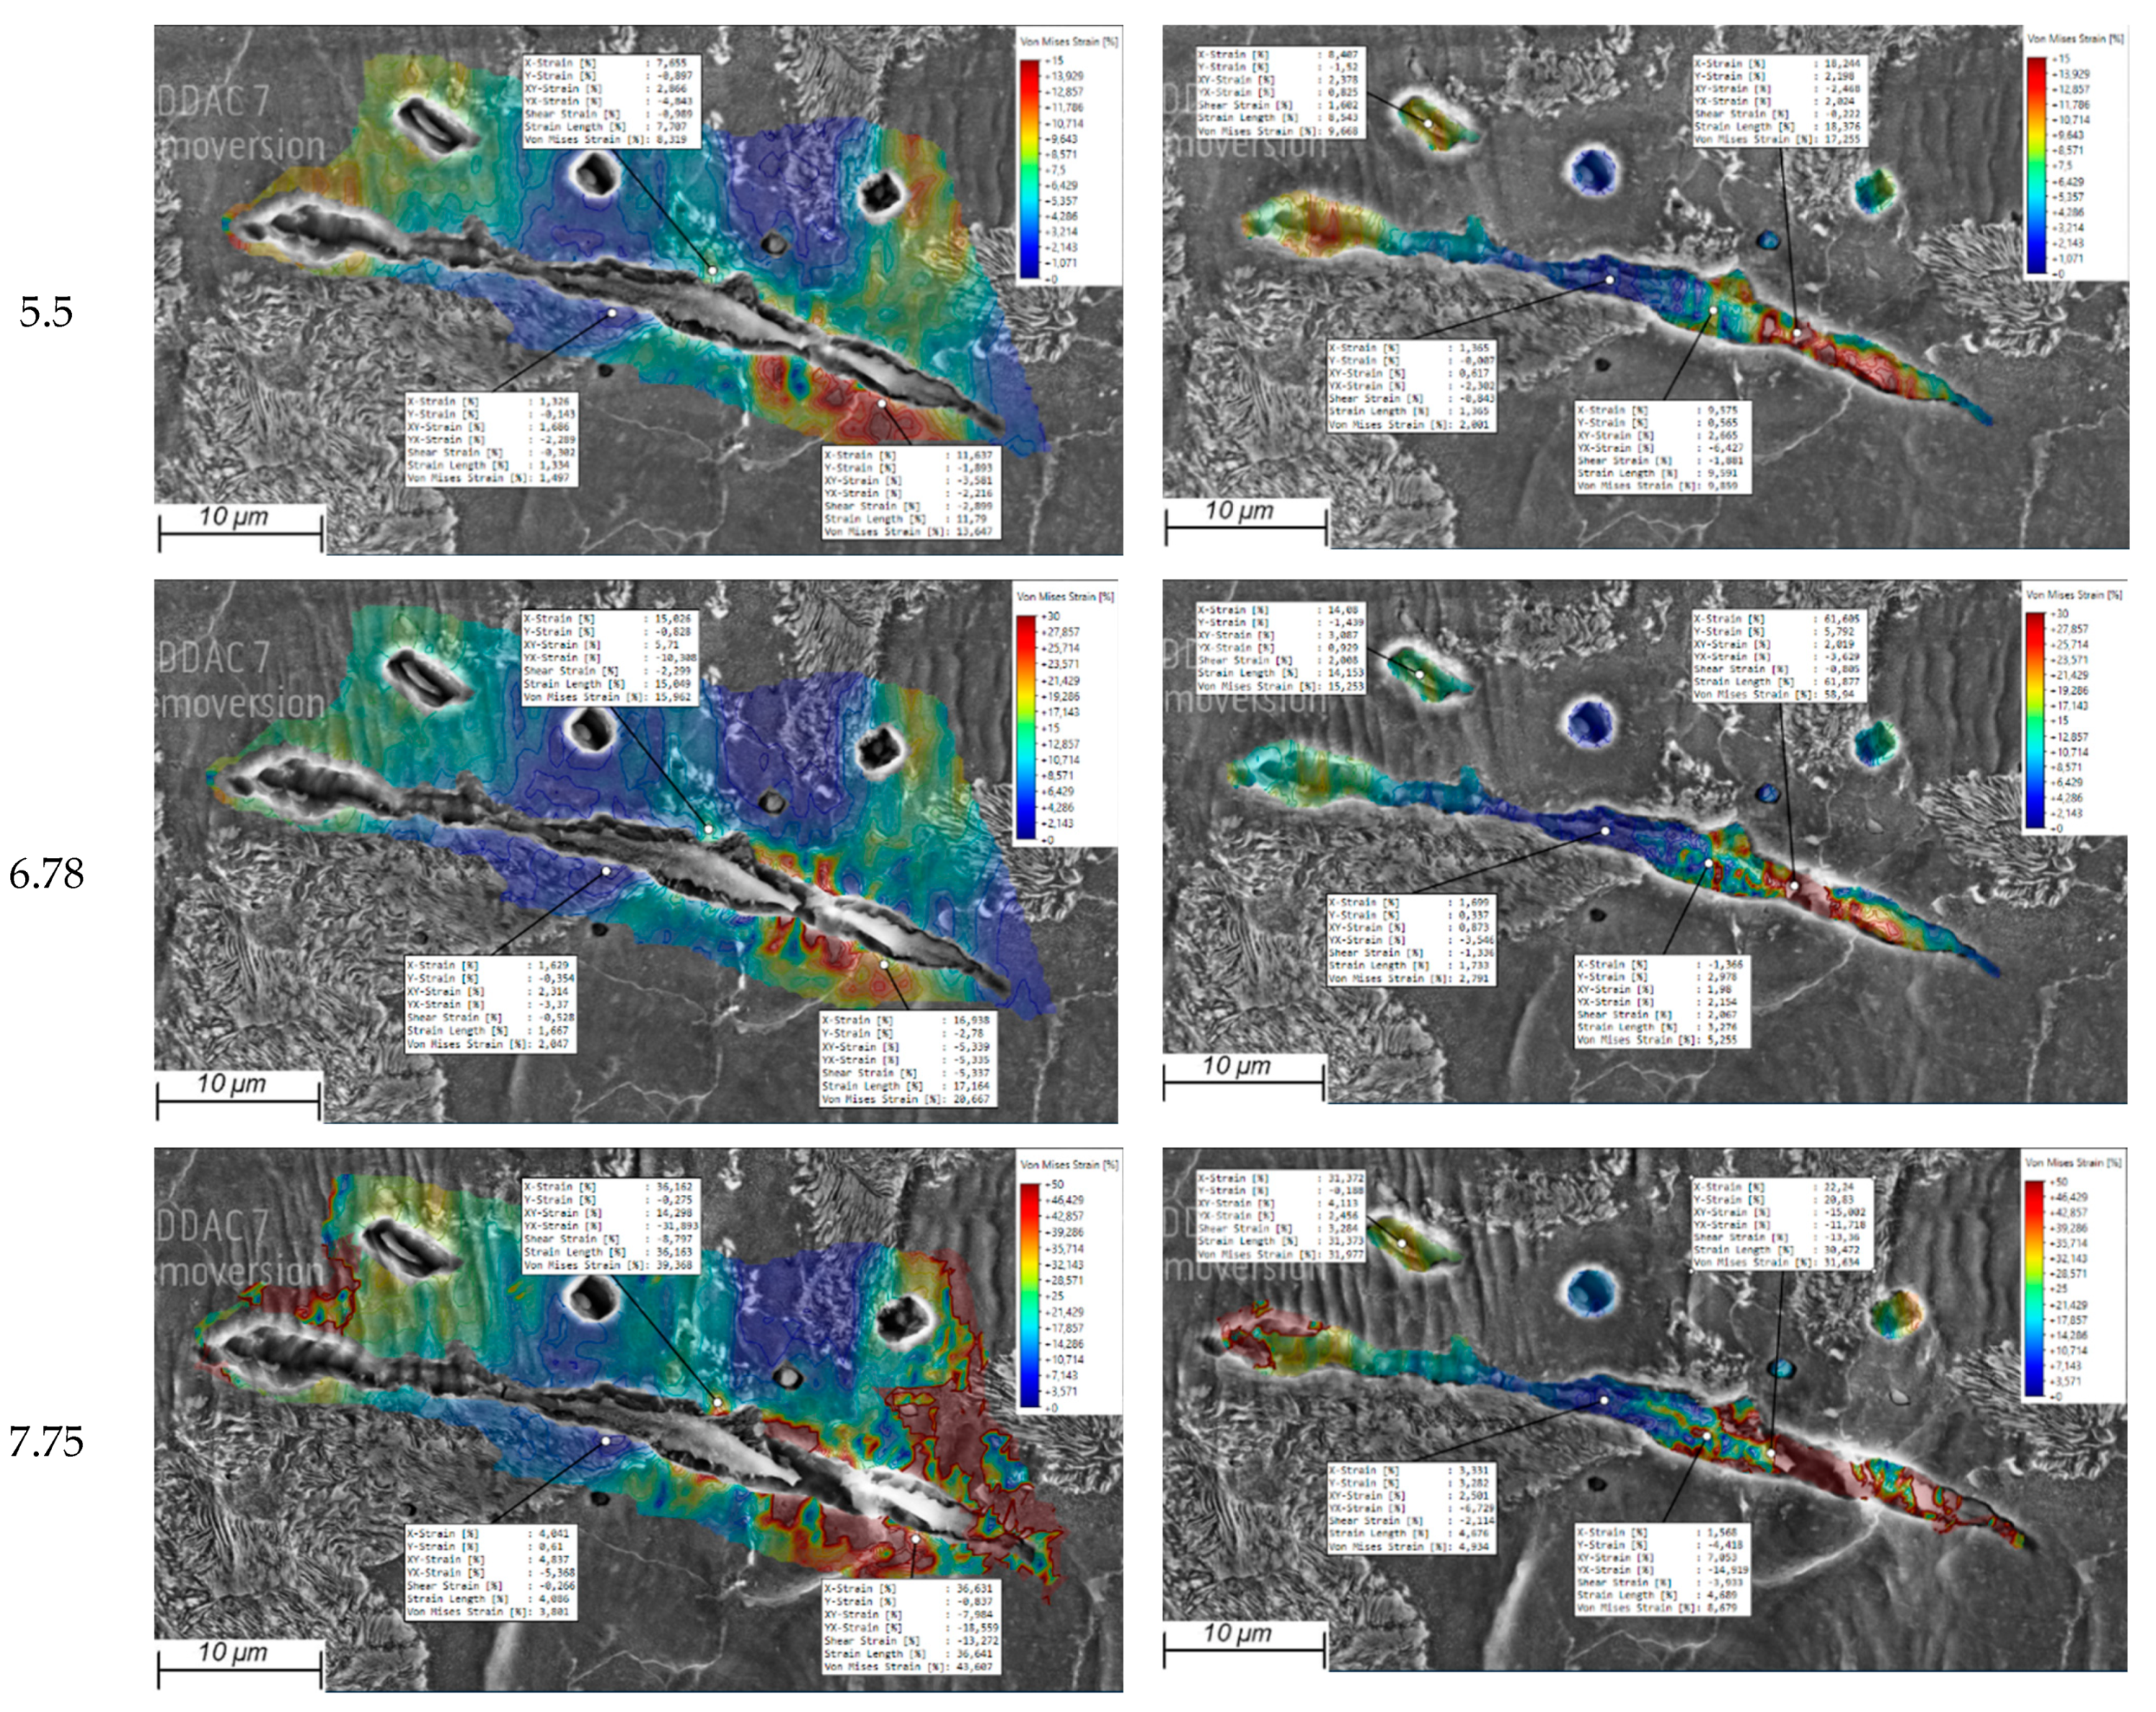
Appendix C. Local Strain Measurement Overlaid on SEM Micrographs
References
- Krauss, G. Steels: Processing, Structure, and Performance; ASM International: Materials Park, OH, USA, 2015. [Google Scholar]
- Wang, J.; Shen, Y.; Liu, Y.; Wang, F.; Jia, N. Tailoring Strength and Ductility of a Cr-Containing High Carbon Steel by Cold-Working and Annealing. Materials 2019, 12, 4136. [Google Scholar] [CrossRef] [PubMed] [Green Version]
- Das, T.; Li, J.; Painter, M.; Summerville, E. Evaluation of two AISI 4037 cold heading quality steel wires for improved tool life and product quality. J. Mater. Eng. Perform. 2002, 11, 86–91. [Google Scholar] [CrossRef]
- Shen, P.; Fu, J. Morphology study on inclusion modifications using Mg–Ca treatment in resulfurized special steel. Materials 2019, 12, 197. [Google Scholar] [CrossRef] [PubMed] [Green Version]
- Mohammed, B.; Park, T.; Pourboghrat, F.; Hu, J.; Esmaeilpour, R.; Abu-Farha, F. Multiscale crystal plasticity modeling of multi-phase advanced high strength steel. Int. J. Solids Struct. 2018, 151, 57–75. [Google Scholar] [CrossRef]
- Hosseini, S.; Temmel, C.; Karlsson, B.; Ingesten, N.-G. An in-situ scanning electron microscopy study of the bonding between MnS inclusions and the matrix during tensile deformation of hot-rolled steels. Metall. Mater. Trans. A 2007, 38, 982–989. [Google Scholar] [CrossRef]
- Mukhtar, F.; Qayyum, F.; Shah, M. Studying the effect of thermal fatigue on multiple cracks propagating in an SS316L thin flange on a shaft specimen using a multi-physics numerical simulation model. Strojniški Vestnik-J. Mech. Eng. 2019, 65, 565–573. [Google Scholar] [CrossRef]
- Qayyum, F.; Shah, M.; Muqeet, A.; Afzal, J. The effect of anisotropy on the intermediate and final form in deep drawing of SS304L, with high draw ratios: Experimentation and numerical simulation. IOP Conf. Ser. Mater. Sci. Eng. 2016, 146, 012031. [Google Scholar] [CrossRef] [Green Version]
- Miyamoto, G.; Usuki, H.; Li, Z.-D.; Furuhara, T. Effects of Mn, Si and Cr addition on reverse transformation at 1073 K from spheroidized cementite structure in Fe–0.6 mass% C alloy. Acta Mater. 2010, 58, 4492–4502. [Google Scholar] [CrossRef]
- Khan, U.; Hussain, A.; Shah, M.; Shuaib, M.; Qayyum, F. Investigation of mechanical properties based on grain growth and microstructure evolution of alumina ceramics during two step sintering process. IOP Conf. Ser. Mater. Sci. Eng. 2016, 146, 012046. [Google Scholar] [CrossRef] [Green Version]
- Qayyum, F.; Guk, S.; Kawalla, R.; Prahl, U. Experimental Investigations and Multiscale Modeling to Study the Effect of Sulfur Content on Formability of 16MnCr5 Alloy Steel. Steel Res. Int. 2018, 90, 1800369. [Google Scholar] [CrossRef]
- Chen, H.; Zhou, X. Research progress of gear steel for automobiles. J. Mater. Sci. Eng. 2011, 29, 478. [Google Scholar]
- Sheng, J.; La, P.; Su, J.; Ren, J.; Ma, J.; Shi, Y.; Li, Z.; Wang, J. In situ SEM analysis for deformation mechanism of micro/nanostructured 304 stainless steel with high strength and good plasticity. Mod. Phys. Lett. B 2018, 32, 1850182. [Google Scholar] [CrossRef]
- Salawu, E.Y.; Ajayi, O.O.; Inegbenebor, A.; Popoola, A.; Uyor, U. Effects of Heat Treatment Techniques on the Fatigue Behaviour of Steel Gears: A Review. J. Phys. Conf. Ser. 2019, 1378, 042001. [Google Scholar] [CrossRef]
- Umar, M.; Qayyum, F.; Farooq, M.U.; Khan, L.A.; Guk, S.; Prahl, U. Investigating the Effect of Cementite Particle Size and Distribution on Local Stress and Strain Evolution in Spheroidized Medium Carbon Steels using Crystal Plasticity-Based Numerical Simulations. Steel Res. Int. 2020, 92, 2000407. [Google Scholar] [CrossRef]
- Guk, S.; Hofmann, K.; Beyer, S.; Kawalla, R. Anordnung und Verfahren zur Prüfung des Umformvermögens von Proben aus plastisch umformbaren Werkstoffen und/oder zur Bestimmung der tribologischen Eigenschaften einer vorbehandelten Oberfläche einer Probe. Patent 2016, 10, 225–530. [Google Scholar]
- Kang, Y.-C.; Chan, S.L.-I. Tensile properties of nanometric Al2O3 particulate-reinforced aluminum matrix composites. Mater. Chem. Phys. 2004, 85, 438–443. [Google Scholar] [CrossRef]
- Moehring, K.; Walther, F. Load Direction-Dependent Influence of Forming-Induced Initial Damage on the Fatigue Performance of 16MnCrS5 Steel. Materials 2020, 13, 2680. [Google Scholar] [CrossRef]
- Kusche, C.F.; Gibson, J.S.-L.; Wollenweber, M.A.; Korte-Kerzel, S. On the mechanical properties and deformation mechanisms of manganese sulphide inclusions. Mater. Des. 2020, 193, 108801. [Google Scholar] [CrossRef]
- Schowtjak, A.; Wang, S.; Hering, O.; Clausmeyer, T.; Lohmar, J.; Schulte, R.; Ostwald, R.; Hirt, G.; Tekkaya, A.E. Prediction and analysis of damage evolution during caliber rolling and subsequent cold forward extrusion. Prod. Eng. 2020, 14, 33–41. [Google Scholar] [CrossRef]
- Diehl, M.; Groeber, M.; Haase, C.; Molodov, D.A.; Roters, F.; Raabe, D. Identifying Structure–Property Relationships Through DREAM.3D Representative Volume Elements and DAMASK Crystal Plasticity Simulations: An Integrated Computational Materials Engineering Approach. JOM 2017, 69, 848–855. [Google Scholar] [CrossRef] [Green Version]
- Sedighiani, K.; Traka, K.; Roters, F.; Raabe, D.; Sietsma, J.; Diehl, M. Determination and analysis of the constitutive parameters of temperature-dependent dislocation-density-based crystal plasticity models. Mech. Mater. 2022, 164, 104117. [Google Scholar] [CrossRef]
- Hussein, T.; Umar, M.; Qayyum, F.; Guk, S.; Prahl, U. Micromechanical Effect of Martensite Attributes on Forming Limits of Dual-Phase Steels Investigated by Crystal Plasticity-Based Numerical Simulations. Crystals 2022, 12, 155. [Google Scholar] [CrossRef]
- Qayyum, F.; Guk, S.; Kawalla, R.; Prahl, U. On Attempting to Create a Virtual Laboratory for Application-Oriented Microstructural Optimization of Multi-Phase Materials. Appl. Sci. 2021, 11, 1506. [Google Scholar] [CrossRef]
- Zhang, H.; Diehl, M.; Roters, F.; Raabe, D. A virtual laboratory using high resolution crystal plasticity simulations to determine the initial yield surface for sheet metal forming operations. Int. J. Plast. 2016, 80, 111–138. [Google Scholar] [CrossRef]
- Diehl, M.; An, D.; Shanthraj, P.; Zaefferer, S.; Roters, F.; Raabe, D. Crystal plasticity study on stress and strain partitioning in a measured 3D dual phase steel microstructure. Phys. Mesomech. 2017, 20, 311–323. [Google Scholar] [CrossRef]
- Diehl, M.; Wicke, M.; Shanthraj, P.; Roters, F.; Brueckner-Foit, A.; Raabe, D. Coupled Crystal Plasticity–Phase Field Fracture Simulation Study on Damage Evolution Around a Void: Pore Shape Versus Crystallographic Orientation. JOM 2017, 69, 872–878. [Google Scholar] [CrossRef] [Green Version]
- Tasan, C.C.; Hoefnagels, J.P.M.; Diehl, M.; Yan, D.; Roters, F.; Raabe, D. Strain localization and damage in dual phase steels investigated by coupled in-situ deformation experiments and crystal plasticity simulations. Int. J. Plast. 2014, 63, 198–210. [Google Scholar] [CrossRef] [Green Version]
- Wang, D.; Diehl, M.; Roters, F.; Raabe, D. On the role of the collinear dislocation interaction in deformation patterning and laminate formation in single crystal plasticity. Mech. Mater. 2018, 125, 70–79. [Google Scholar] [CrossRef]
- Liu, C.; Shanthraj, P.; Diehl, M.; Roters, F.; Dong, S.; Dong, J.; Ding, W.; Raabe, D. An integrated crystal plasticity–phase field model for spatially resolved twin nucleation, propagation, and growth in hexagonal materials. Int. J. Plast. 2018, 106, 203–227. [Google Scholar] [CrossRef]
- Cereceda, D.; Diehl, M.; Roters, F.; Raabe, D.; Perlado, J.M.; Marian, J. Unraveling the temperature dependence of the yield strength in single-crystal tungsten using atomistically-informed crystal plasticity calculations. Int. J. Plast. 2016, 78, 242–265. [Google Scholar] [CrossRef] [Green Version]
- Shanthraj, P.; Eisenlohr, P.; Diehl, M.; Roters, F. Numerically robust spectral methods for crystal plasticity simulations of heterogeneous materials. Int. J. Plast. 2015, 66, 31–45. [Google Scholar] [CrossRef]
- Roters, F.; Diehl, M.; Shanthraj, P.; Eisenlohr, P.; Reuber, C.; Wong, S.L.; Maiti, T.; Ebrahimi, A.; Hochrainer, T.; Fabritius, H.O.; et al. DAMASK—The Düsseldorf Advanced Material Simulation Kit for modeling multi-physics crystal plasticity, thermal, and damage phenomena from the single crystal up to the component scale. Comput. Mater. Sci. 2019, 158, 420–478. [Google Scholar] [CrossRef]
- Roters, F.; Eisenlohr, P.; Kords, C.; Tjahjanto, D.; Diehl, M.; Raabe, D. DAMASK: The Düsseldorf Advanced MAterial Simulation Kit for studying crystal plasticity using an FE based or a spectral numerical solver. Procedia IUTAM 2012, 3, 3–10. [Google Scholar] [CrossRef] [Green Version]
- Weidner, A.; Yanina, A.; Guk, S.; Kawalla, R.; Biermann, H. Microstructure and Local Strain Fields in a High-Alloyed Austenitic Cast Steel and a Steel-Matrix Composite Material after in situ Tensile and Cyclic Deformation. Steel Res. Int. 2011, 82, 990–997. [Google Scholar] [CrossRef]
- Weidner, A.; Biermann, H. Combination of different in situ characterization techniques and scanning electron microscopy investigations for a comprehensive description of the tensile deformation behavior of a CrMnNi TRIP/TWIP steel. JOM 2015, 67, 1729–1747. [Google Scholar] [CrossRef]
- Weidner, A.; Berek, H.; Segel, C.; Aneziris, C.G.; Biermann, H. In situ tensile deformation of TRIP steel/Mg-PSZ composites. Mater. Sci. Forum 2013, 738–739, 77–81. [Google Scholar] [CrossRef]
- Agnew, S.R.; Brown, D.W.; Tomé, C.N. Validating a polycrystal model for the elastoplastic response of magnesium alloy AZ31 using in situ neutron diffraction. Acta Mater. 2006, 54, 4841–4852. [Google Scholar] [CrossRef]
- Lu, W.; Zhang, D.; Zhang, X.; Wu, R.; Sakata, T.; Mori, H. Microstructural characterization of TiB in in situ synthesized titanium matrix composites prepared by common casting technique. J. Alloys Compd. 2001, 327, 240–247. [Google Scholar] [CrossRef]
- Bachmann, F.; Hielscher, R.; Schaeben, H. Texture analysis with MTEX–free and open source software toolbox. Solid State Phenom. 2010, 160, 63–68. [Google Scholar] [CrossRef] [Green Version]
- Umar, M.; Qayyum, F.; Farooq, M.U.; Guk, S.; Kirschner, M.; Korpala, G.; Prahl, U. Exploring the Structure–Property Relationship in Spheroidized C45EC Steel Using Full Phase Crystal Plasticity Numerical Simulations. Steel Res. Int. 2022, 93, 2100452. [Google Scholar] [CrossRef]
- Pütz, F.; Henrich, M.; Roth, A.; Könemann, M.; Münstermann, S. Reconstruction of Microstructural and Morphological Parameters for RVE Simulations with Machine Learning. Procedia Manuf. 2020, 47, 629–635. [Google Scholar] [CrossRef]
- Huang, Y.; Froyen, L. Quantitative analysis of microstructure in metals with computer assistance. NDT Net 2001, 6, 5. [Google Scholar]
- Lipiński, T.; Wach, A. Dimensional structure of non-metallic inclusions in high-grade medium carbon steel melted in an electric furnace and subjected to desulfurization. Solid State Phenom. 2014, 223, 46–53. [Google Scholar] [CrossRef]
- Ghadbeigi, H.; Pinna, C.; Celotto, S. Quantitative strain analysis of the large deformation at the scale of microstructure: Comparison between digital image correlation and microgrid techniques. Exp. Mech. 2012, 52, 1483–1492. [Google Scholar] [CrossRef] [Green Version]
- Hutchinson, J.W. Bounds and self-consistent estimates for creep of polycrystalline materials. Proc. R. Soc. Lond. A Math. Phys. Sci. 1976, 348, 101–127. [Google Scholar]
- Kalidindi, S.R. Incorporation of deformation twinning in crystal plasticity models. J. Mech. Phys. Solids 1998, 46, 267–290. [Google Scholar] [CrossRef]
- Roters, F.; Eisenlohr, P.; Hantcherli, L.; Tjahjanto, D.D.; Bieler, T.R.; Raabe, D. Overview of constitutive laws, kinematics, homogenization and multiscale methods in crystal plasticity finite-element modeling: Theory, experiments, applications. Acta Mater. 2010, 58, 1152–1211. [Google Scholar] [CrossRef]
- Eisenlohr, P.; Diehl, M.; Lebensohn, R.A.; Roters, F. A spectral method solution to crystal elasto-viscoplasticity at finite strains. Int. J. Plast. 2013, 46, 37–53. [Google Scholar] [CrossRef]
- Qayyum, F.; Guk, S.; Prüger, S.; Schmidtchen, M.; Saenko, I.; Kiefer, B.; Kawalla, R.; Prahl, U. Investigating the local deformation and transformation behavior of sintered X3CrMnNi16-7-6 TRIP steel using a calibrated crystal plasticity-based numerical simulation model. Int. J. Mater. Res. 2020, 111, 392–404. [Google Scholar] [CrossRef]
- Matsuno, F.; Nishikida, S.-i.; Ikesaki, H. Mechanical Properties of Manganese Sulphides in the Temperature Range between Room Temperature and 1000 deg. C. Trans. Iron Steel Inst. Jpn. 1985, 25, 989–998. [Google Scholar] [CrossRef]
- Qayyum, F.; Umar, M.; Guk, S.; Schmidtchen, M.; Kawalla, R.; Prahl, U. Effect of the 3rd Dimension within the Representative Volume Element (RVE) on Damage Initiation and Propagation during Full-Phase Numerical Simulations of Single and Multi-Phase Steels. Materials 2021, 14, 42. [Google Scholar] [CrossRef]
- Gussev, M.; Edmondson, P.; Leonard, K. Beam current effect as a potential challenge in SEM-EBSD in situ tensile testing. Mater. Charact. 2018, 146, 25–34. [Google Scholar] [CrossRef]
- Tasan, C.; Hoefnagels, J.; Geers, M. Microstructural banding effects clarified through micrographic digital image correlation. Scr. Mater. 2010, 62, 835–838. [Google Scholar] [CrossRef]
- Umar, M.; Qayyum, F.; Farooq, M.U.; Khan, L.A.; Guk, S.; Prahl, U. Analyzing the cementite particle size and distribution in heterogeneous microstructure of C45EC steel using crystal plasticity based DAMASK code. In Proceedings of the 2021 International Bhurban Conference on Applied Sciences and Technologies (IBCAST), Islamabad, Pakistan, 12–16 January 2021; pp. 15–20. [Google Scholar]
- Needleman, A. A continuum model for void nucleation by inclusion debonding. J. Appl. Mech. 1987, 54, 525–531. [Google Scholar] [CrossRef]
- Diehl, M.; Naunheim, Y.; Yan, D.; Morsdorf, L.; An, D.; Tasan, C.; Zaefferer, S.; Roters, F.; Raabe, D. Coupled Experimental-Numerical Analysis of Strain Partitioning in Metallic Microstructures: The Importance of Considering the 3D Morphology. In Proceedings of the BSSM 12th International Conference on Advances in Experimental Mechanics, Sheffield, UK, 29–31 August 2017; pp. 29–31. [Google Scholar]
- Qayyum, F.; Guk, S.; Prahl, U. Studying the Damage Evolution and the Micro-Mechanical Response of X8CrMnNi16-6-6 TRIP Steel Matrix and 10% Zirconia Particle Composite Using a Calibrated Physics and Crystal-Plasticity-Based Numerical Simulation Model. Crystals 2021, 11, 759. [Google Scholar] [CrossRef]


| Element | C | Si | Mn | P | S | Cr | Al | Cu | |
|---|---|---|---|---|---|---|---|---|---|
| % Wt. | non-modified | 0.16 | 0.25 | 1.15 | <0.01 | 0.035 | 1.00 | <0.01 | 0.03 |
| modified | 0.081 | 0.038 | 1.07 | <0.01 | 0.131 | 1.06 | <0.01 | 0.03 |
 | ||||
|---|---|---|---|---|
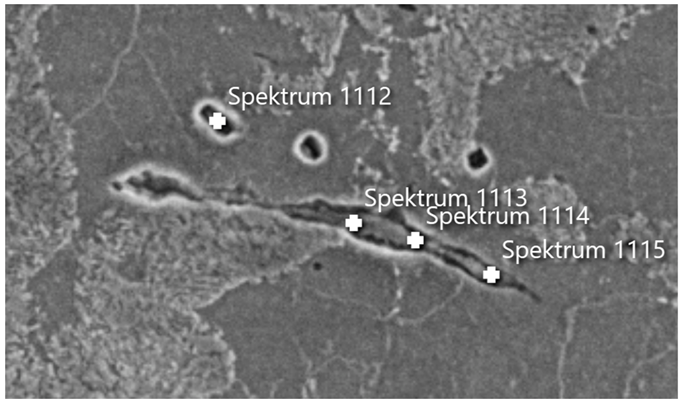
| Element | Spectrum 1112 | Spectrum 1113 | Spectrum 1114 | Spectrum 1115 |
| S | 10.50 | 6.46 | 10.34 | 14.65 |
| Cr | 1.19 | 1.70 | 0.95 | 0.95 |
| Mn | 17.06 | 11.61 | 17.24 | 23.48 |
| Fe | 69.56 | 75.98 | 70.66 | 60.16 |
| Others | 1.69 | 4.25 | 0.81 | 0.76 |
| Total | 100.00 | 100.00 | 100.00 | 100.00 |
Publisher’s Note: MDPI stays neutral with regard to jurisdictional claims in published maps and institutional affiliations. |
© 2022 by the authors. Licensee MDPI, Basel, Switzerland. This article is an open access article distributed under the terms and conditions of the Creative Commons Attribution (CC BY) license (https://creativecommons.org/licenses/by/4.0/).
Share and Cite
Qayyum, F.; Umar, M.; Elagin, V.; Kirschner, M.; Hoffmann, F.; Guk, S.; Prahl, U. Influence of Non-Metallic Inclusions on Local Deformation and Damage Behavior of Modified 16MnCrS5 Steel. Crystals 2022, 12, 281. https://doi.org/10.3390/cryst12020281
Qayyum F, Umar M, Elagin V, Kirschner M, Hoffmann F, Guk S, Prahl U. Influence of Non-Metallic Inclusions on Local Deformation and Damage Behavior of Modified 16MnCrS5 Steel. Crystals. 2022; 12(2):281. https://doi.org/10.3390/cryst12020281
Chicago/Turabian StyleQayyum, Faisal, Muhammad Umar, Vladislav Elagin, Markus Kirschner, Frank Hoffmann, Sergey Guk, and Ulrich Prahl. 2022. "Influence of Non-Metallic Inclusions on Local Deformation and Damage Behavior of Modified 16MnCrS5 Steel" Crystals 12, no. 2: 281. https://doi.org/10.3390/cryst12020281
APA StyleQayyum, F., Umar, M., Elagin, V., Kirschner, M., Hoffmann, F., Guk, S., & Prahl, U. (2022). Influence of Non-Metallic Inclusions on Local Deformation and Damage Behavior of Modified 16MnCrS5 Steel. Crystals, 12(2), 281. https://doi.org/10.3390/cryst12020281