Abstract
Yellow jadeite is a kind of jadeite caused by secondary leaches. With a certain degree of transparency, its color is usually influenced by the objective conditions including light source and background. In this paper, 19 Munsell neutral value scales were selected to study the impact caused by background under the standard light source D65, where we found that the N9.5 Value Scale is suitable for color grading. All 33 yellow jadeites were tested by UV-VIS spectrophotometer and colorimetric analysis, and the colors were graded by the affinity propagation (AP) and K-means clustering methods. According to the result, the yellow jadeite color was classified into Fancy, Fancy Intense, Fancy Deep, and Fancy Light. It is also concluded that AP is more feasible to provide the color grading scheme, while K-means can be applied to the optimization of choosing clustering center.
1. Introduction
Jadeite is a beautiful polycrystalline jade, of which those of gem-quality are mostly produced in Burma and Guatemala [1,2,3,4]. It is loved by the Chinese for its versatile color. Jadeite is usually colorless, opaque to subtransparent in the absence of other impurities, and cracks, boundaries, and inclusions that scatter light and give it a white appearance. The color genesis of jadeite can be divided into two kinds, primary color and secondary color. The green color of jadeite belongs to the primary color, mainly due to the enrichment of Cr and Fe ions caused by metamorphic differentiation and ductile deformation [5,6]. The secondary color in jadeite is the color produced by exogenous geological activities that generally occur in the jadeite along the cracks and grain boundaries by leaching. Depending on the degree of weathering received, the secondary color of jadeite shows continuous changes. The least weathered part is grayish-green, and its color-causing mineral is thought to be chlorite, while yellow and red jadeite receive a higher degree of weathering, the main crack filler is limonite colloid (hematite, goethite), and the most intense weathering of the surface layer showing black [7,8].
The physical source and chemical analysis of the secondary color is not the only topic for investigation. The color itself can be affected by the objective circumstance, including the properties of the background [9,10], the illuminance [11,12], and the temperature of the light source [13,14,15,16,17,18]. The yellow jadeite can be a gradual series that is worthwhile in the study of colorimetry. According to the China national standard GB/T 23885-2009 “Jadeite Grading”, jadeite should be graded on non-fluorescent, no obvious directional reflection, neutral white/light gray-color chips or board. The continuous change of lightness from black (N0.5) to white (N9.5) in the Munsell neutral value scale can help us to study the influence of background on the evaluation of jadeite color in a more precise way [19].
Color is a very important quality evaluation factor of jadeite that, to a large extent, determines the value of jadeite. The Chinese national standard GB/T23885-2009 “Jadeite Grading” uses the colorimetric method to classify jadeite in the standard environment, which is a good improvement to the situation of using subjective vocabulary to describe the color of jadeite commonly used in the market. However, purple and red-yellow jadeites apply the same grading standards as green, without an exclusive standard.
With the proposal of a color classification method for colored diamonds and the application of the Munsell color chips by King et al., the Gemological Institute of America (GIA) Gem Trade Laboratory (GTL) color ring was created, and the description method was defined [20]. The standard D65 (Temperature: 6504 K) light source and a standard illumination box were applied for grading, which was accepted and has been widely used. In recent years, GIA introduced exclusive classification methods for blue [21], pink [22], yellow [23], and colorless diamonds [24]. To better ensure the accuracy of grading the colored gemstones, it is necessary to determine the objective grading environment. The CIE1931 color space system was first introduced to the color quantification study in gemology, however, to solve the problem that this system is inconsistent with the human visual perception [25], the CIE1976 uniform color space was born and applied to the quantitative characterization of gems which have been used extensively, such as sapphire [26], peridot [14], jadeite [13,27,28,29], tourmaline [30,31], alexandrite [32], amethyst [33], turquoise [34], chrysoprase [35], garnet [36], beryl [37], etc. Based on the CIE1976 color space, Tang et al. and Jiang et al. analyzed the influence of Munsell neutral grey backgrounds on peridot and chrysoprase, respectively, and concluded that the background with high lightness was highly applicable to help distinguish the color of gems [38,39].
The principle of clustering is to group the data within a collection and maximize the differentiation between groups and minimize the differentiation within groups [40], so a clustering algorithm is often used to objectively and precisely describe the gem color classification. In our previous study, the application of K-means clustering analysis in color grading was favored, but there are still some problems with it, one of which is that K-means requires a predetermined number of groupings. Jiang et al. and Tang et al. divided peridot and chrysoprase colors into three grades; Pan et al. divided red jadeite into five grades but did not explain why [38,39,41]. In addition, K-means is sensitive to the choice of initial clustering center. Once it changes, the classification result changes accordingly. Compared with that, the Affinity propagation (AP) clustering method does not need the initial number of groups. The rule of AP is to take every sample datum into consideration as potential exemplars, and the process continues to iterate until the best results are obtained [42].
In this paper, we use a UV-VIS spectrophotometer to investigate the color mechanism of yellow jadeite and an X-Rite SP62 spectrophotometer r (X-Rite, Grand Rapids, MI, USA) and CIE1976 uniform color space to study the influence of Munsell neutral grey backgrounds on the color to determine the best background for classification. The clustering results of AP and K-means are compared to recommend a more suitable clustering method to be applied to gems.
2. Materials and Methods
2.1. Samples
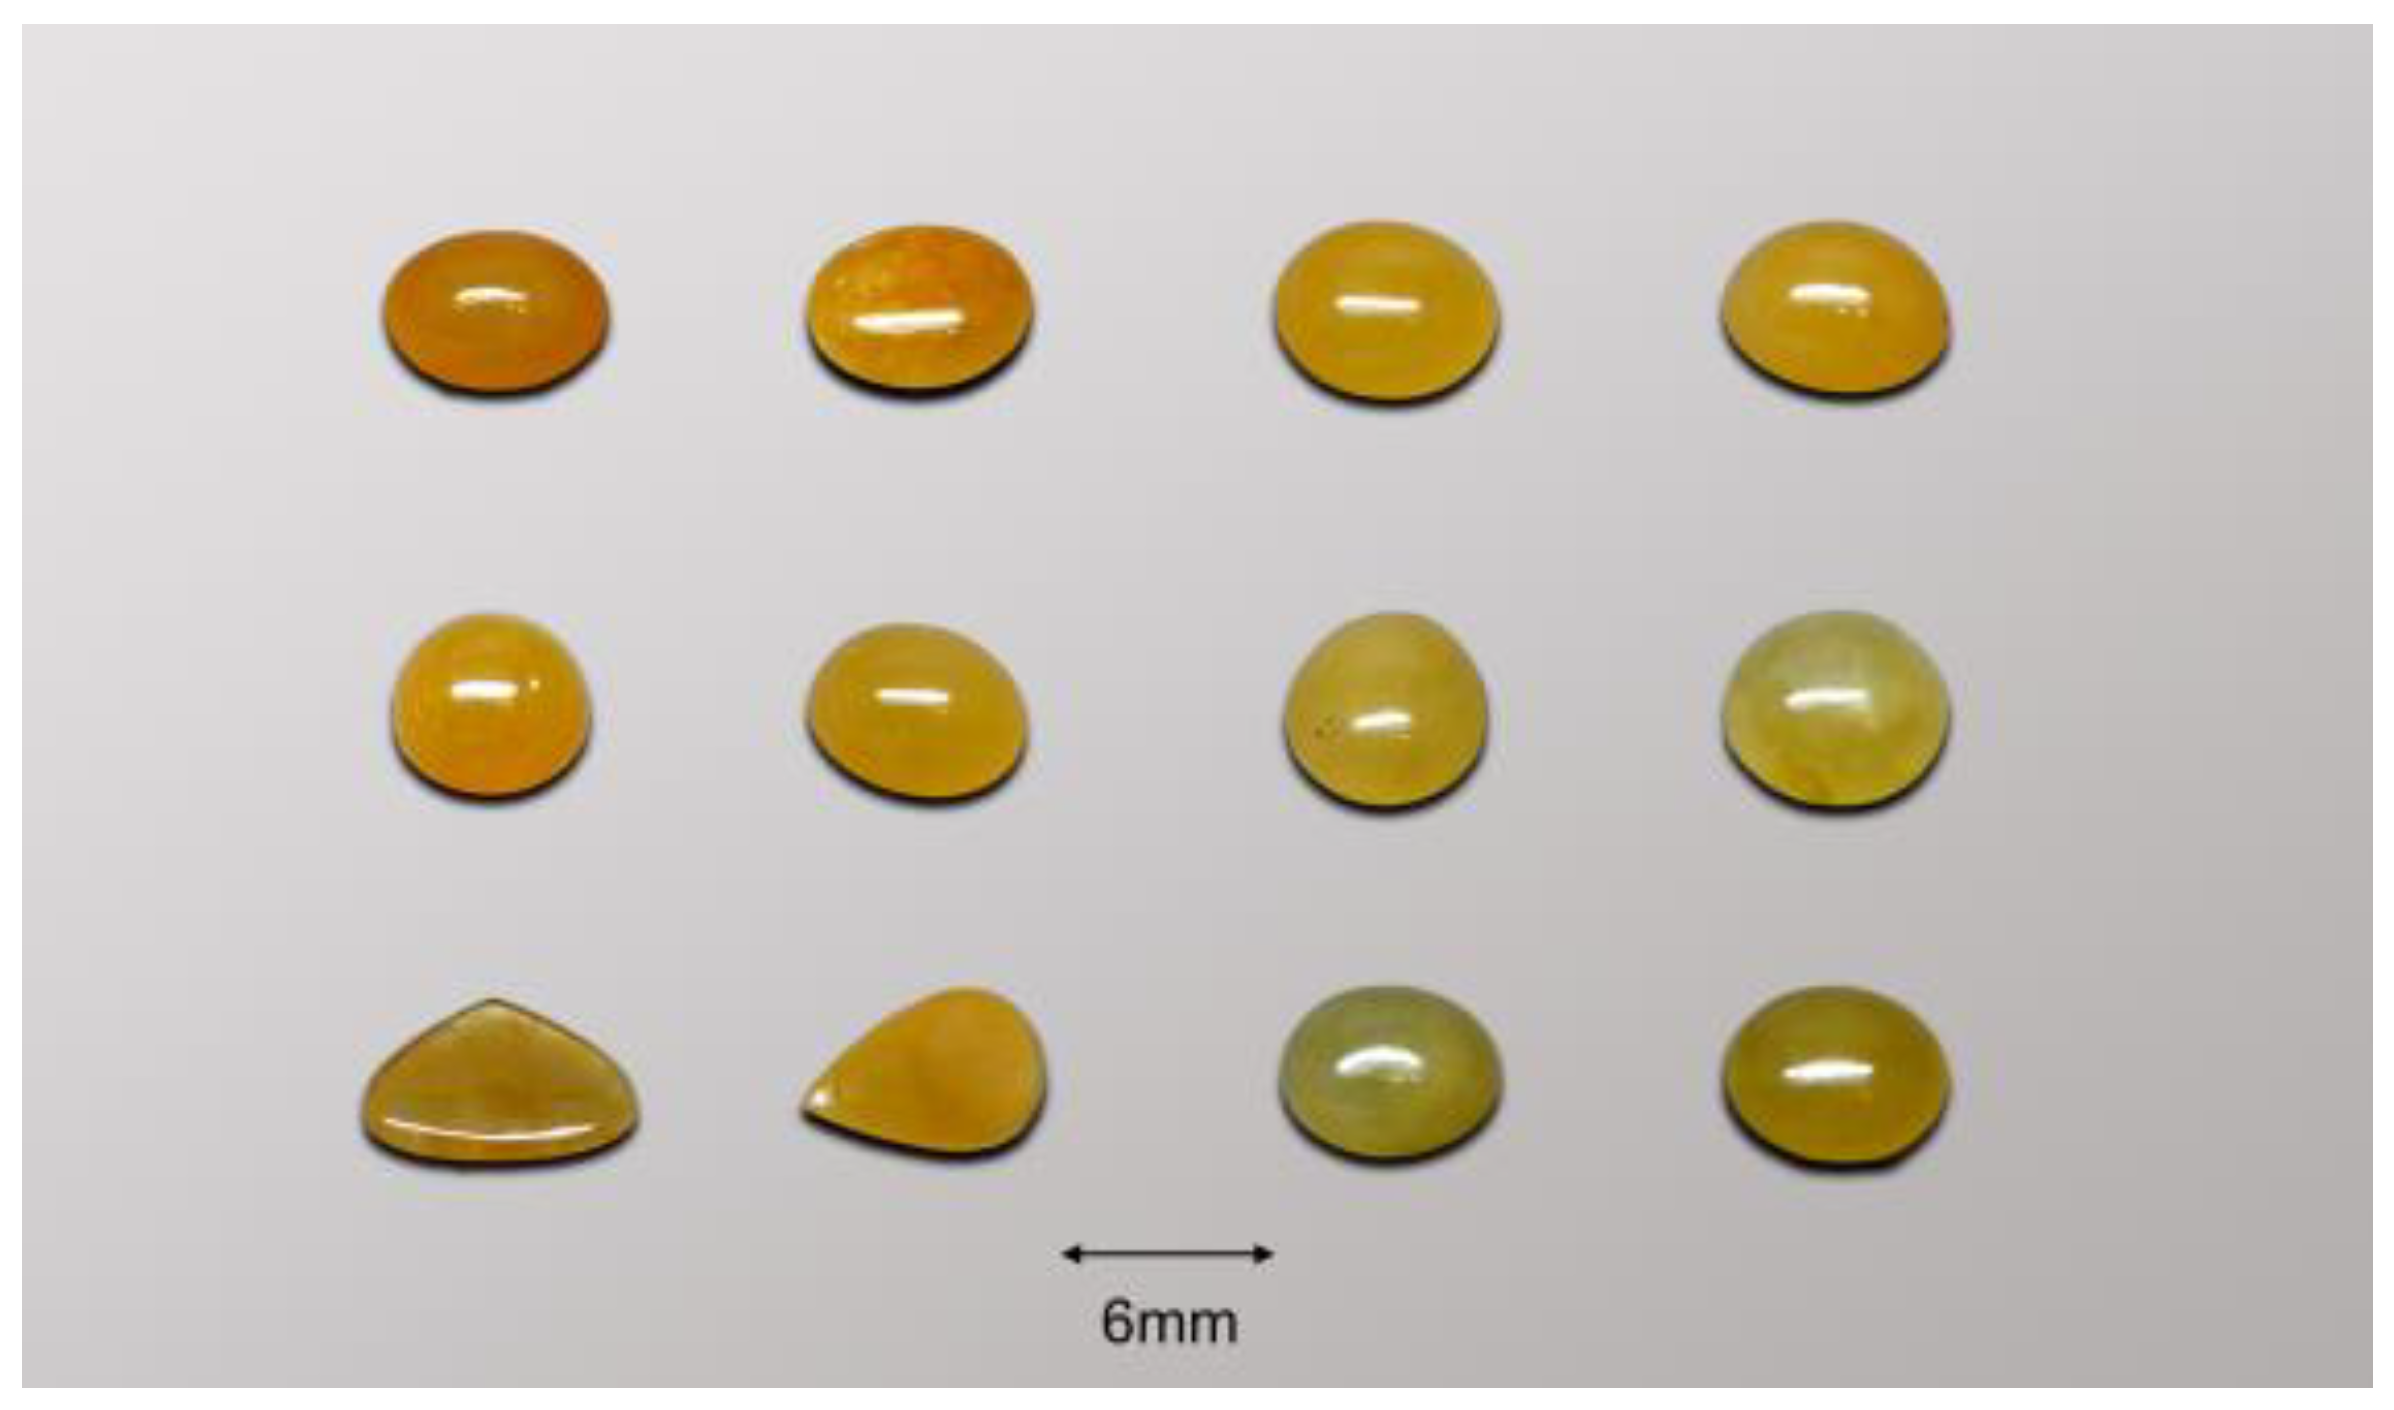
A total of 33 natural yellow jadeite samples from Burma were tested in this study, with colors ranging from orange-yellow to yellow. All the samples were cut into oval shapes and well-polished with the size from 4 mm × 4 mm × 2 mm to 7 mm × 8 mm × 5 mm. Part of the samples are shown in Figure 1.

Figure 1.
Part of the samples used in this study.
2.2. UV-VIS Spectrum
The absorption spectrum in the ultraviolet to visible (UV-Vis) range was tested with a Gem-3000 fiber optic spectrometer (Biaoqi Optoelectronics Technology Development Co., LTD., Guangzhou, China). The test conditions are as follows: Integral time, 220; Scans to average, 12; Boxcar width, 2; Range of wavelength, 220–1000 nm.
2.3. Backgrounds
The Munsell neutral value scale (glossy collection) was used as background for the research (Figure 2). A total of 19 color chips with different lightness from N0.5 to N9.5 (interval = 0.5) were selected. The color measurement of yellow jadeite on different neutral backgrounds was conducted in a standard illumination box with a fluorescent lamp (CCT 6504 K, Philips Master TL-D90 DeLuxe18W/965, Amsterdam, The Netherlands).
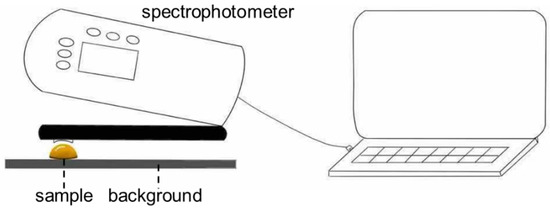
Figure 2.
The colorimetric device of this experiment. The background was placed under the sample so that the spectrophotometer can collect the color signals.
2.4. Color Quantification
An X-Rite SP62 spectrophotometer (X-Rite, Grand Rapids, MI, USA) was used to collect reflective signals from the yellow jadeite surface via the integrating sphere (Figure 2). The test conditions can be summarized as follows: CIE standard illumination, D65; illuminance of the test height, 1500 lux (based on the China national standard GB/T 26189-2010 “Lighting of Indoor Workplaces” (It is also believed that high illuminance would help lower color cast of yellow [12], tested by Konica Minolta CL-200 Color Illuminometer)); reflection, Specular Excluded; observer view, 2°; measurement range, 400–700 nm; measurement time, less than 2.5 s; voltage, 220 V; frequency, 50–60 Hz. The final color data were averaged three times for testing.
2.5. Color Space
The CIE (International Commission de l’Éclairage) 1976 uniform color space is chosen in this study, which comprises color coordinates , and Lightness . Chroma and Hue angle can be calculated based on and :
2.6. Color Difference Formula
To compare the feasibility and reliability of the AP and K-means clustering methods, this paper chooses the CIE DE2000 formula to analyze the results of the measured samples. The DE2000 formula is experimentally obtained based on the color difference formulas such as CIE LAB and CIE 94 [43], which is more accurate and more computational:
where represent the difference in lightness, chroma, and hue angle, respectively. The weight functions SL, SC, and SH are used to calibrate the uniformity of the color space, and the function is used to correct the deflection of the color tolerance ellipse in the blue area; the parameters are to correct the experimental conditions in gemology, where the parameter combination is usually set as (1:1:1) to provide better perceptibility [44].
2.7. Clustering Methods
The core idea of K-means cluster analysis (processed by IBM SPSS Statistics 25) is to divide a given sample set into K clusters according to the distance between the samples. The samples are as tight as possible within the clusters, and the distance between the clusters is as large as possible.
The process of K-means is as follows: (1) Select the initial number K (2 as example here) of centers for the clusters; (2) For every data point, to calculate its distance to the center of 2 clusters, categorize the sample point into the cluster with the smallest distance to the center; (3) Update the center of each cluster during each iteration by using methods such as the mean method; (4) For 2 clustering centers, after repeating the iteration of steps 2 and 3, if the center changes very little, it is considered to reach a stable state.
The AP clustering method (processed by Pycharm 2021.2.3) is to take all data points as potential exemplars. Messages are exchanged between the data points until a high-quality set of exemplars and corresponding clusters gradually emerge.
The similarity indicates how well the data point k is suited to be the exemplar for data point , where and indicate the different data point indices. The similarity is calculated by Equation (4):
The messages sent between the points contribute to two kinds of categories: The first is responsibility , which is assigned to decide whether the sample should be the exemplar for sample ; the second is the availability , which is the evidence pf whether the sample should be an exemplar for sample and all other samples, two of them can be calculated by:
During the iteration, the and can be updated by:
where is the number of iteration times. The damping factor is set in the AP algorithm for updating in the case of numerical oscillations.
The decision matrix is used to decide whether point is selected as the exemplar of point . It can be calculated by:
after every update process.
The clustering process will continue to iterate until the results are stable several times.
3. Results
3.1. UV-Vis Spectra
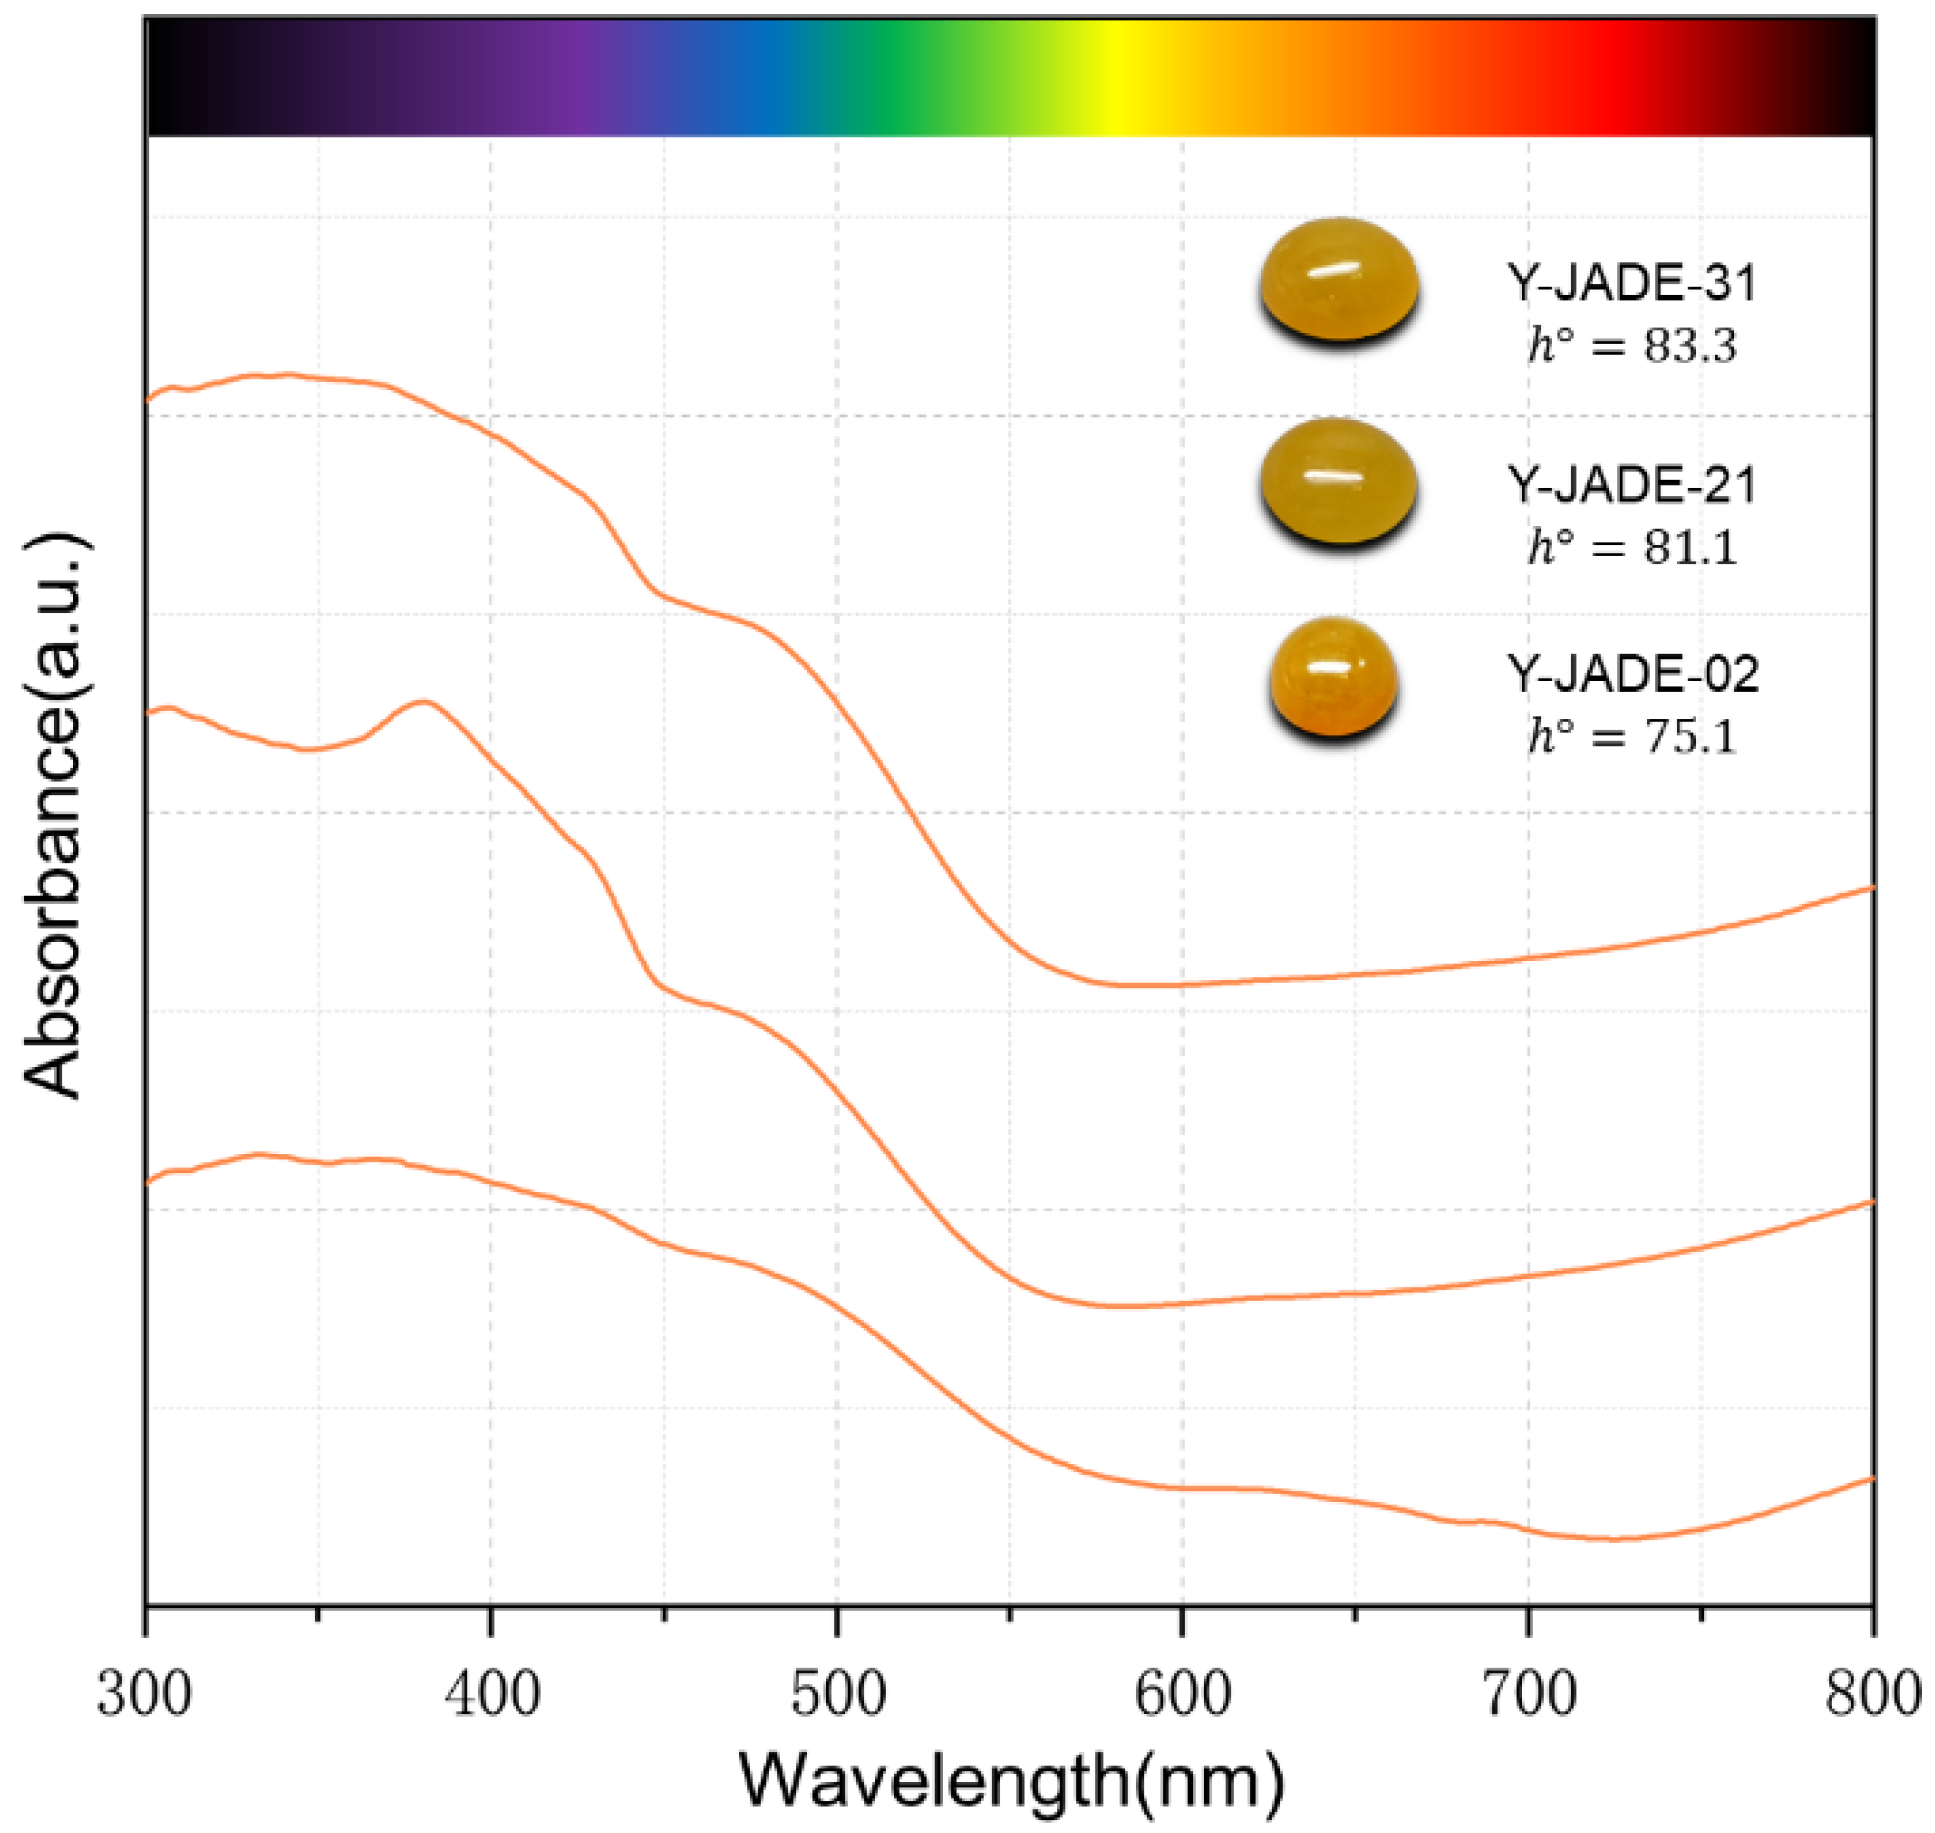
As shown in Figure 3, Y-JADE-31 and 21 show characteristic shoulder peaks near 430 nm that is attributed to 6A1 − 4E1,4A1 ligand field transition of Fe3+ ion. The strong peak at 380 nm of Y-JADE-21 is assigned to the transition mode 6A1 − 4E of Fe3+ in hematite. The weak bands near 500 nm of all three shown samples are assigned to the 6A1 + 6A1 − 4T1(4G) + 4T1(4G) double exciton process [7,45,46]. In addition, the results agree that Fe3+ oxides and hydroxides are responsible for the color appearance in previous literature [47], the strong absorption in the blue-violet region within the visible light area makes the jadeites appear yellow.
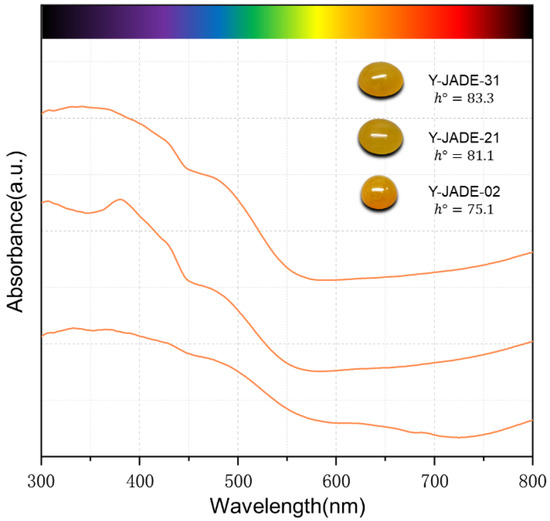
Figure 3.
The UV-Vis spectrum conforms to the absorption of Fe3+ oxides and hydroxides.
3.2. The Effect of 19 Munsell Neutral Value Scales on Yellow Jadeite
Due to the transparency and characteristic absorption of the yellow jadeite, the testing backgrounds and light source would make a significant influence on the color. In our previous study, we have discussed the impact of the different light sources on jadeite and concluded that the standard D65 light source is suitable for color grading compared with A and CWF [8]. So, in this paper, the Munsell neutral value scales (N0.5, N1, N1.5, N2, N2.5, N3, N3.5, N4, N4.5, N5, N5.5, N6, N6.5, N7, N7.5, N8, N8.5, N9, N9.5) were used as the backgrounds for 33 yellow jadeite color measurements. According to the Chinese national standard GB/T 20146-2006 CIE standard illuminants for colorimetry, the standard D65 light source, which represents the average sunlight of the northern hemisphere, can be used as the exclusive light source.
The lightness values of Munsell neutral value scales are graded into 19 levels from 0 to 100 (range from N0.5 to N9, with an interval = 0.5), as the luminance of the background has significant effects on yellow jadeite. In addition, the lightness of each scale ) corresponds to its luminance factor (). The relationship between and is as follows:
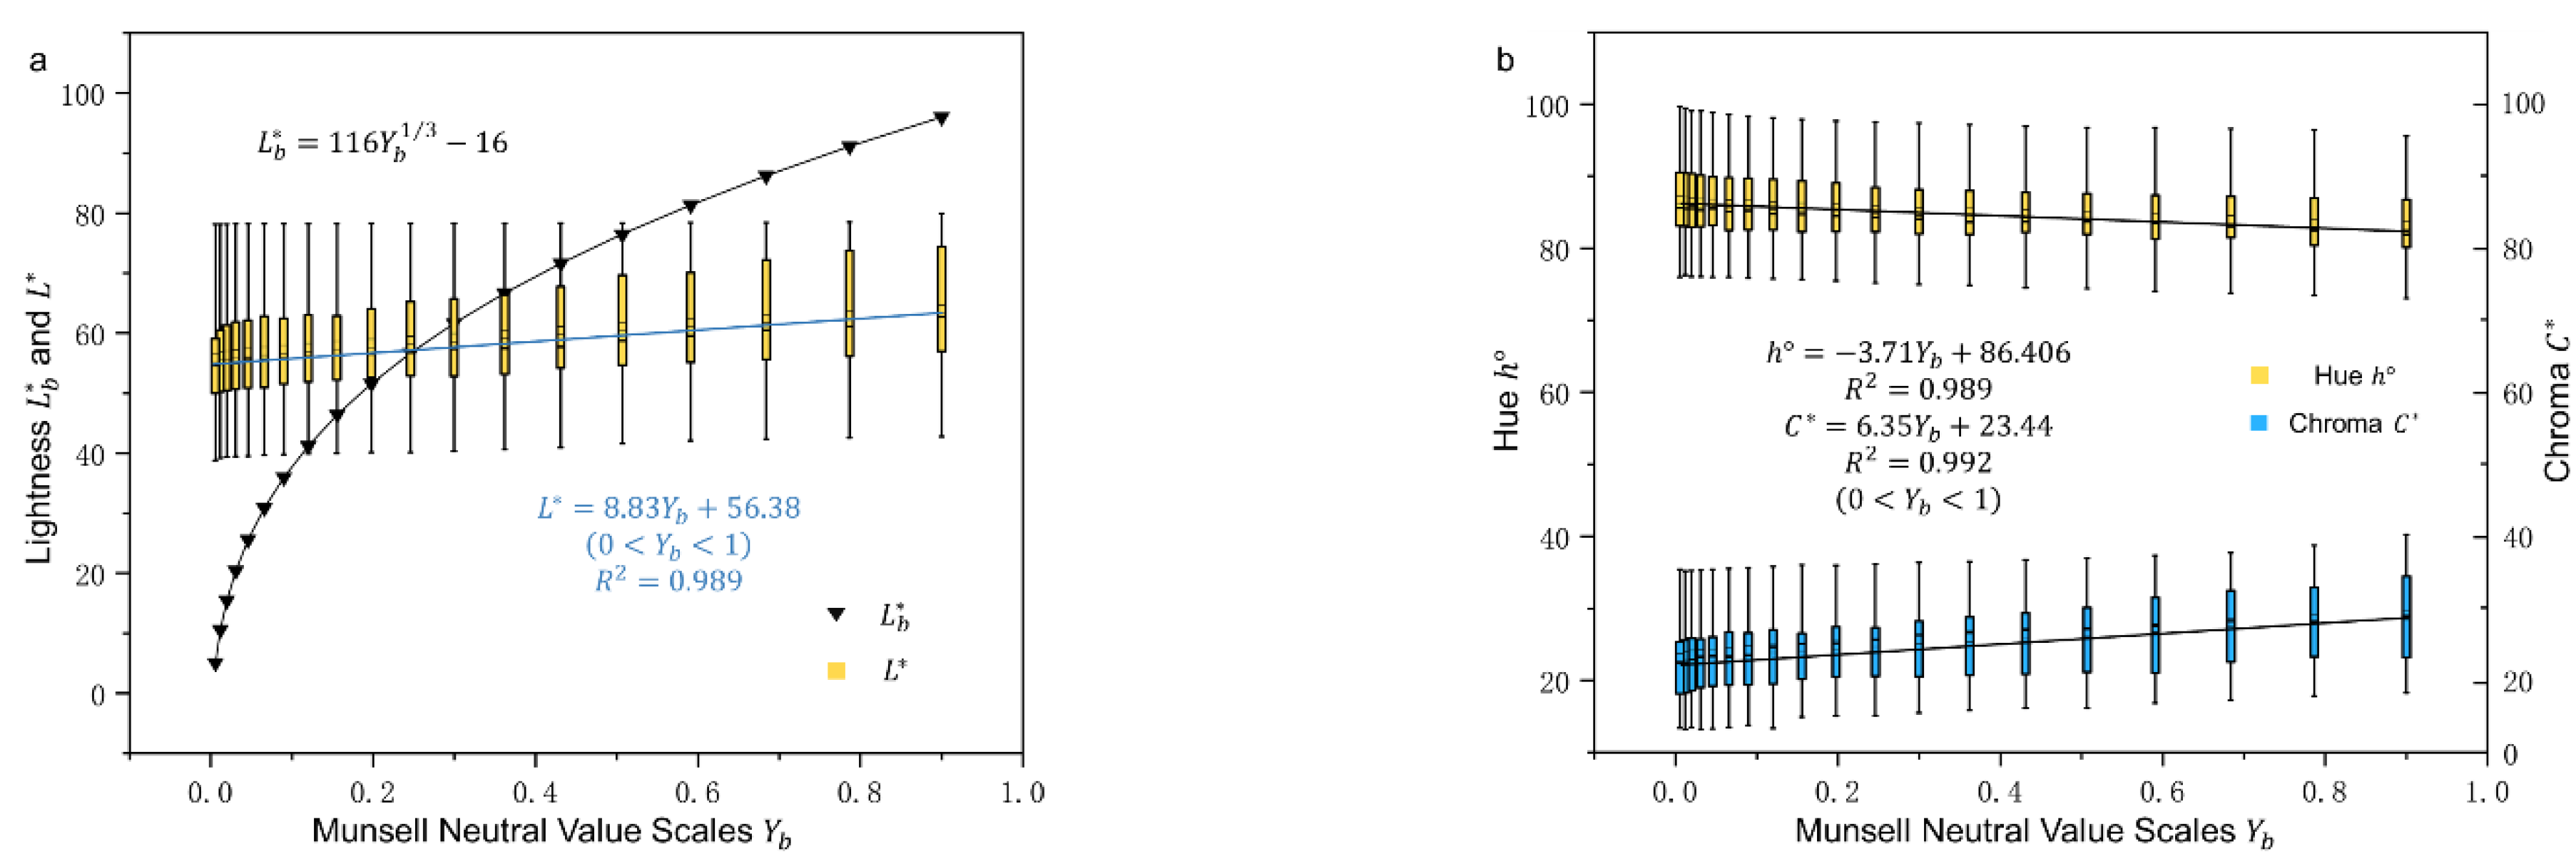
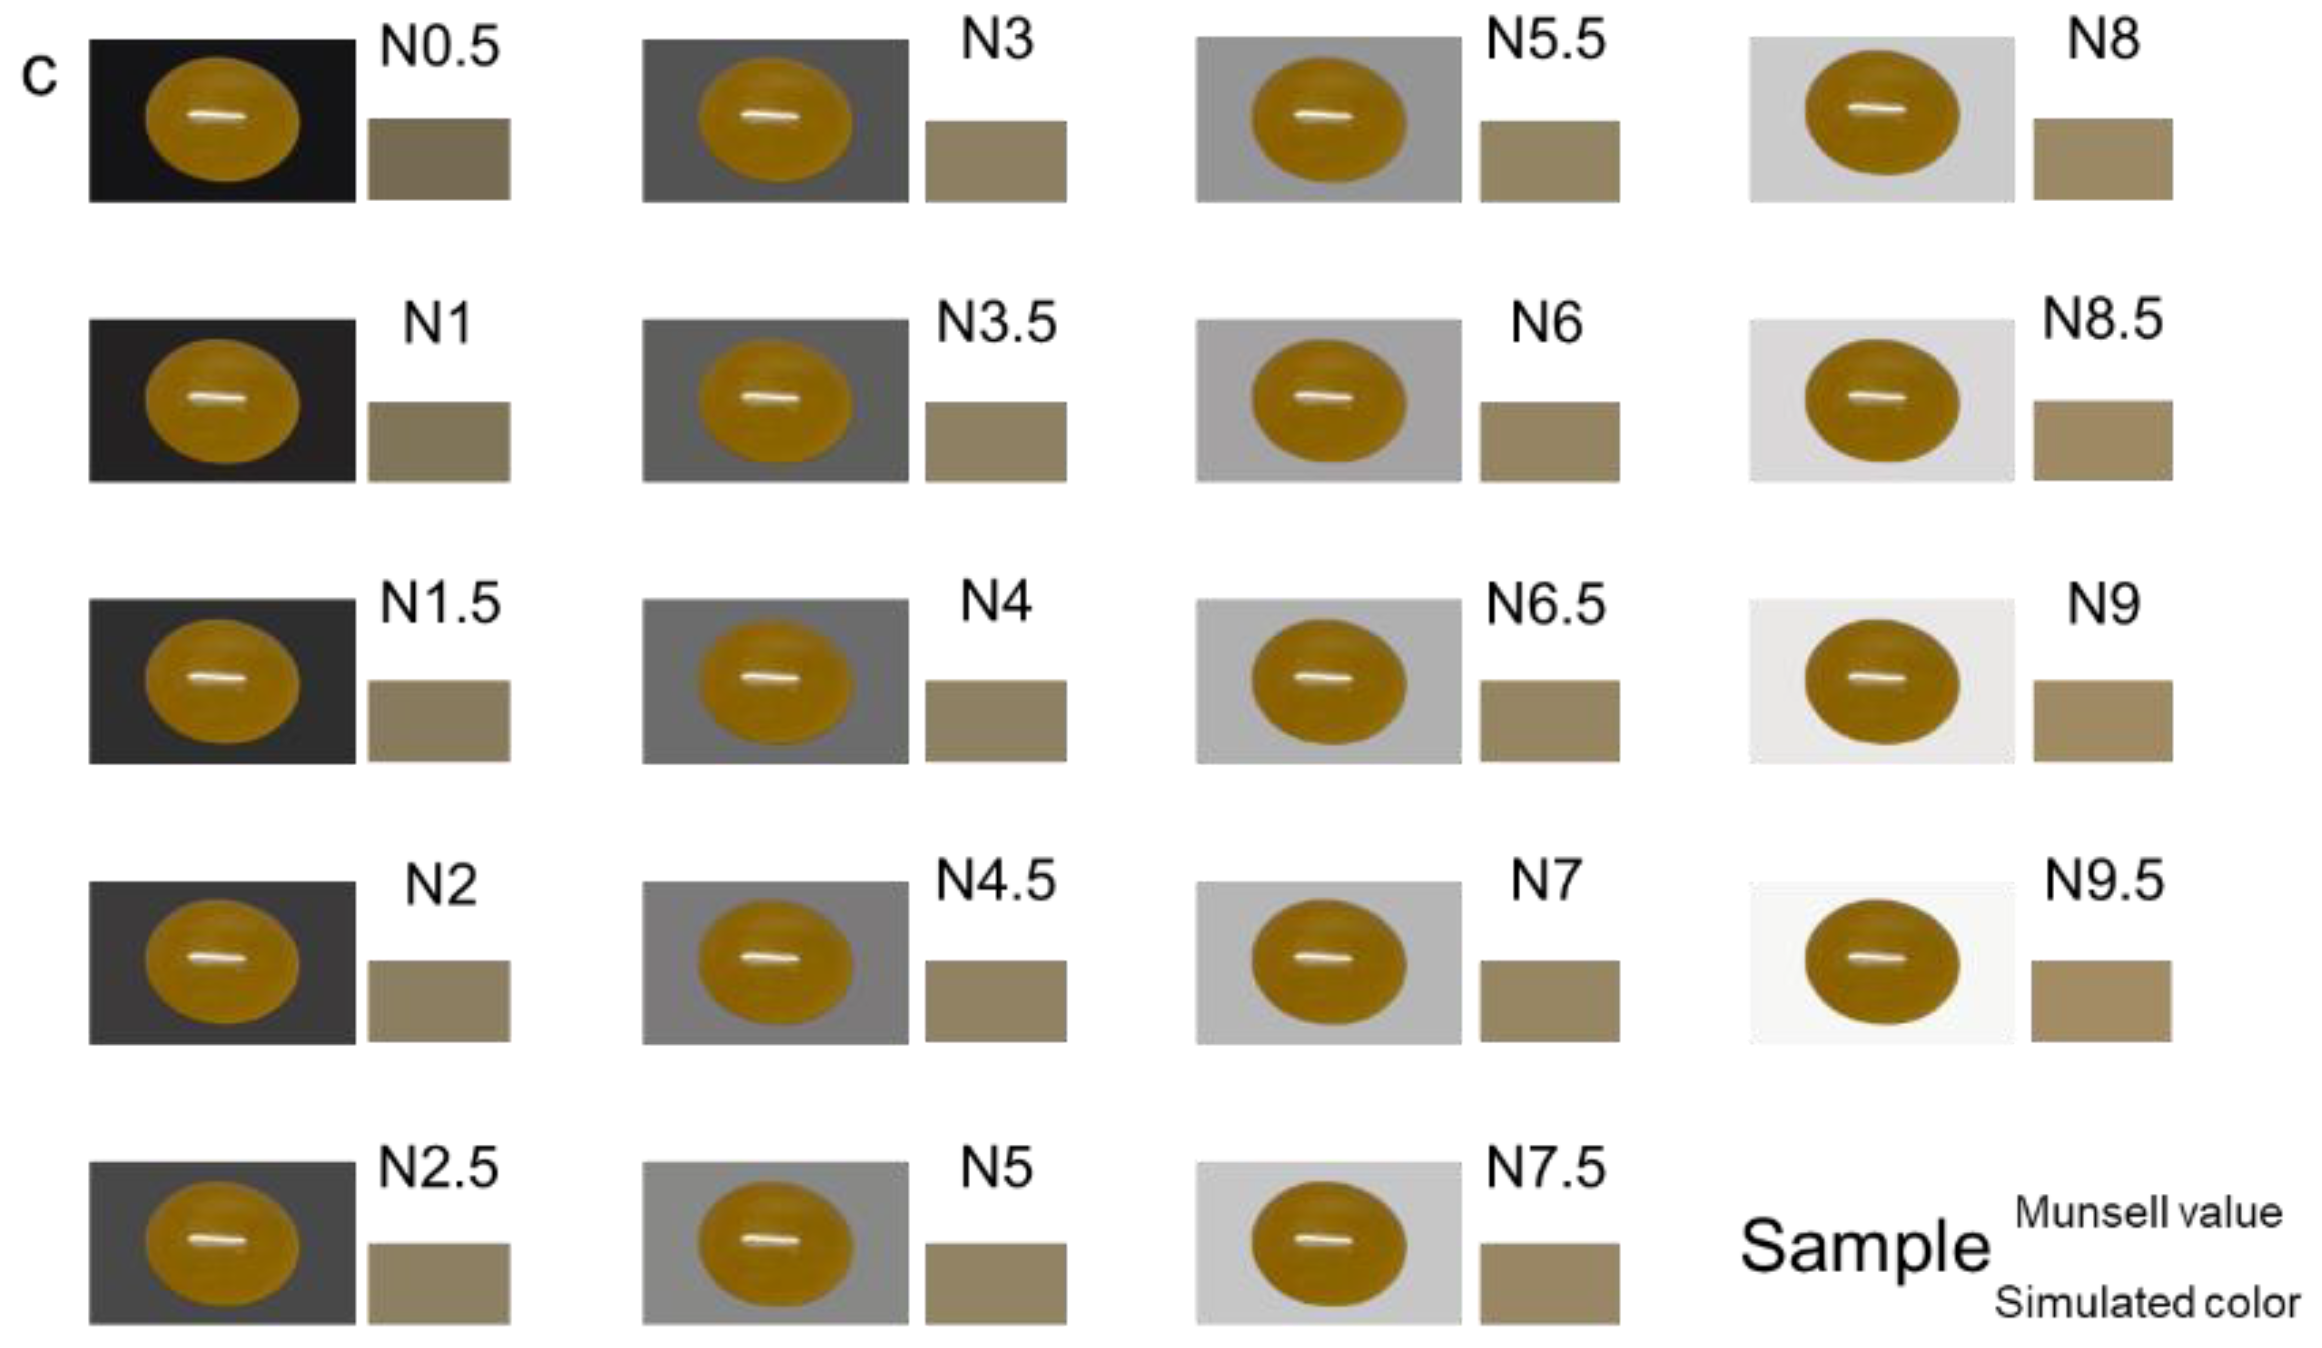
As shown in Figure 4a, the lightness of the background has a significant impact on the light of yellow jadeite. As the lightness of the background increases, the lightness increases. To fit the curves of yellow jadeites’ color parameters with Munsell neutral value scales luminance factor , a highly positive correlation between them was obtained:
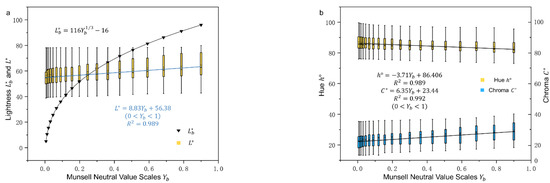
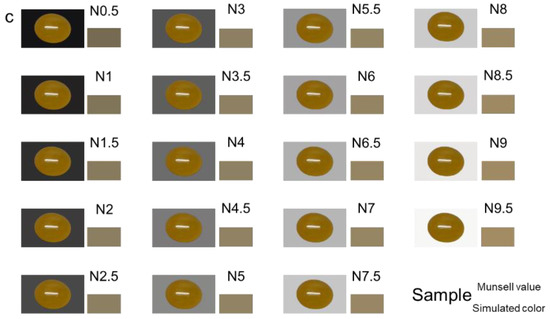
Figure 4.
The variation of color is caused by the luminance factor. (a) Relation between the lightness of sample L* and background lightness L_b*. Data are shown in Supplementary Materials Table S1. (b) Correlation between Y_b and Hue h°, Chroma C*. Data are shown in Supplementary Materials Tables S2 and S3. (c) The picture of Y-Jade-421 on different backgrounds, associated with the value of background and simulated color.
The Figure 4b shows the relationship between the luminance factor and the Hue and Chroma . The hue angle of yellow jadeite decreases as the background becomes lighter, which means the samples shift greenish-yellow to yellow. On the contrary, the chroma of the samples becomes higher with the increasing lightness of the background, which indicates that the samples show a more vivid color under the lighter background. The fitting curves are as follows:
3.3. Effect of Transparency of the Yellow Jadeite on Different Backgrounds
The overall trend is that the Lightness increases as the luminance of the Munsell neutral value scale increases; however, due to the different thicknesses and textures of the 33 samples, the transparency would make a significant difference to the result. Therefore, it is necessary to discuss the effect of transparency on the color measurement of jadeite.
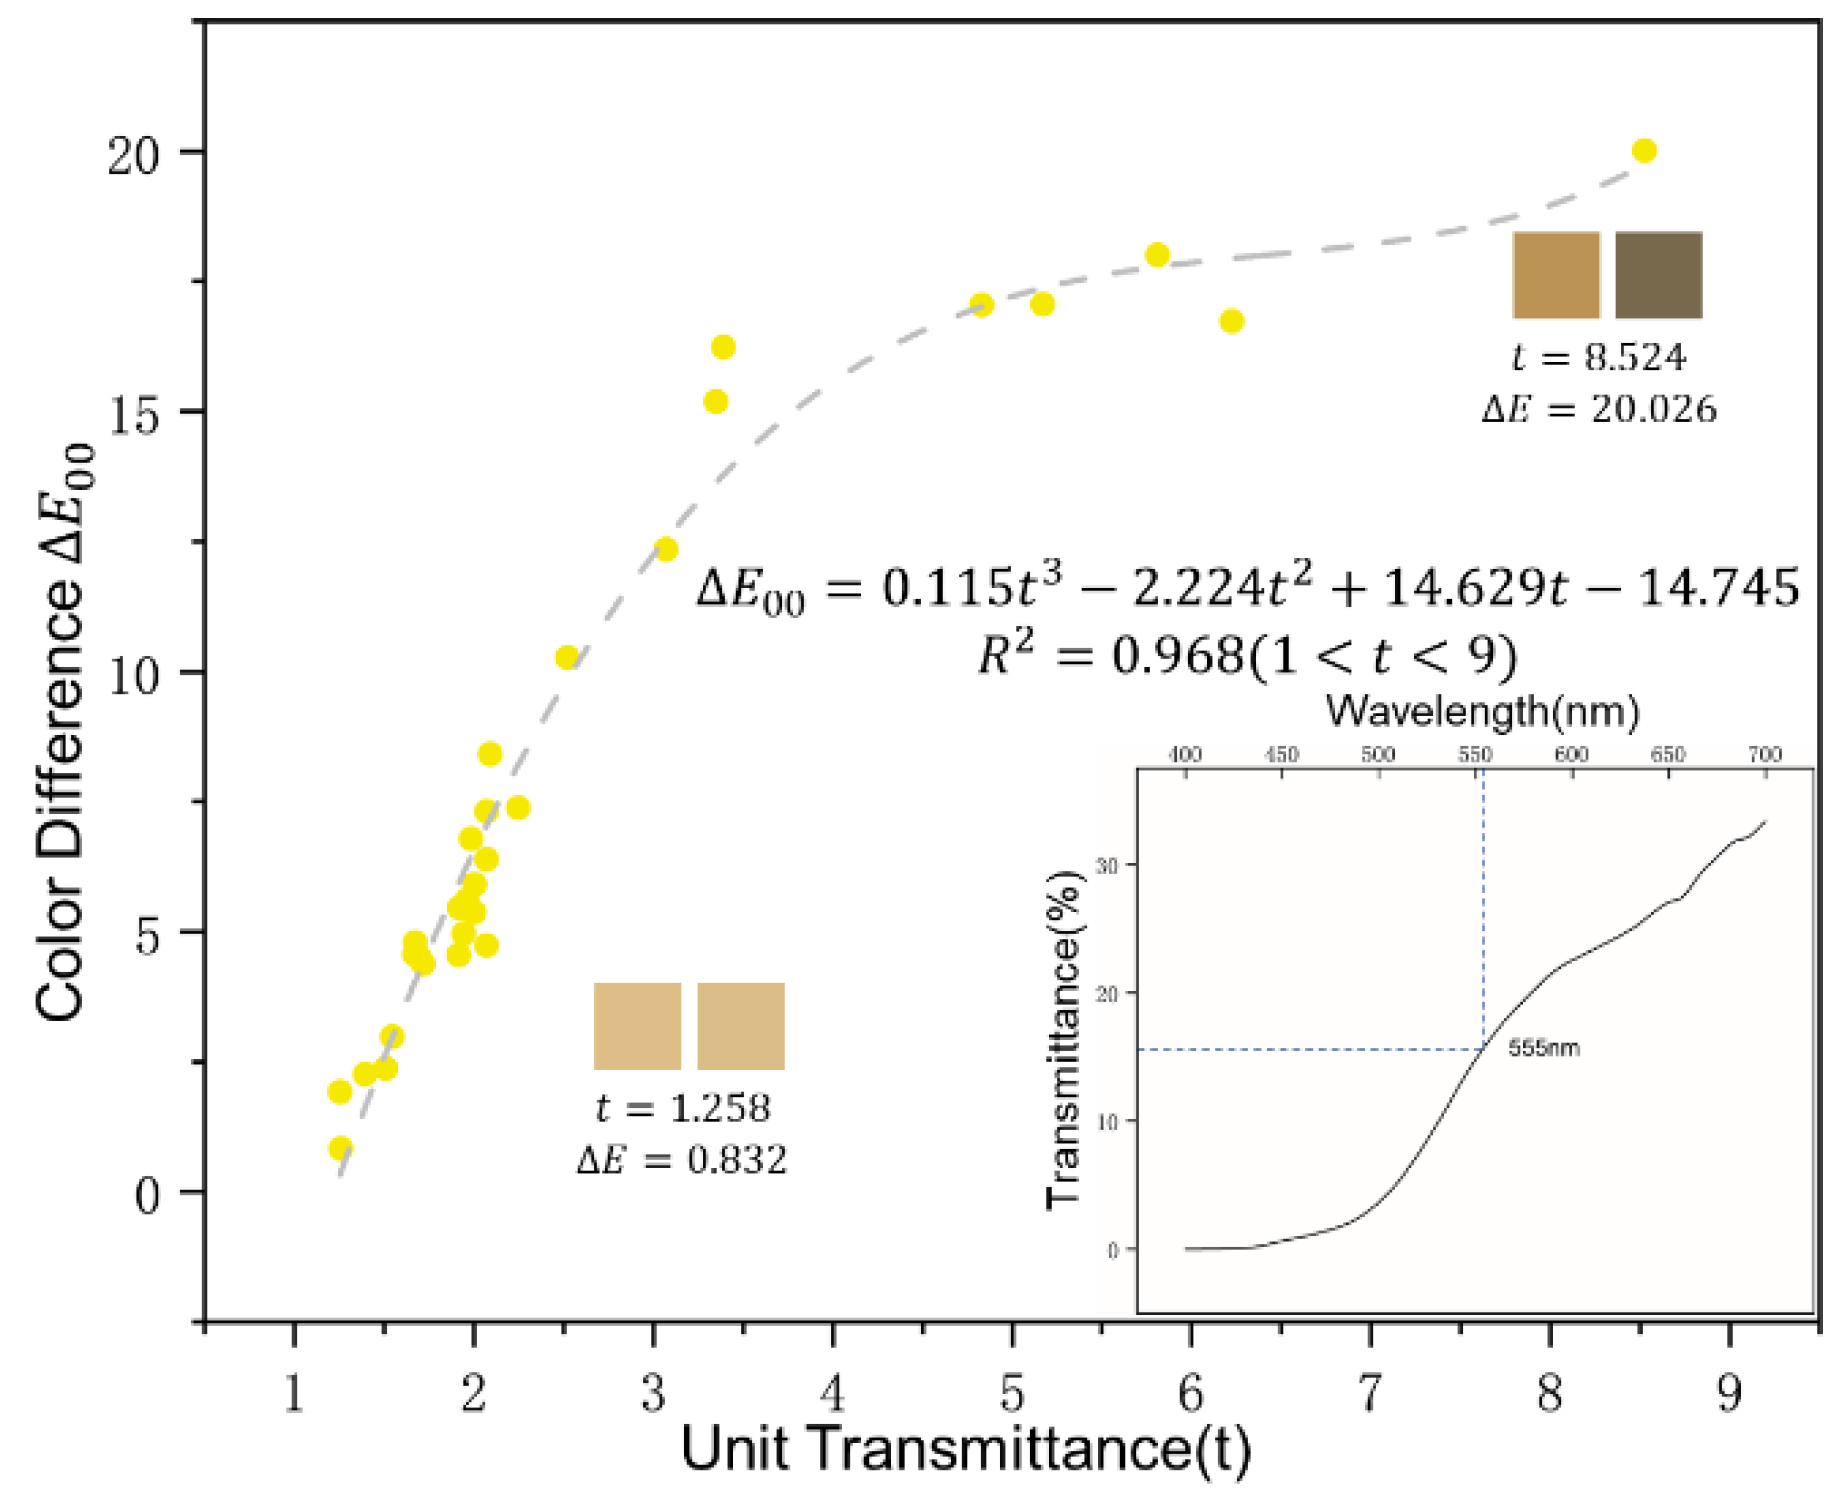
It is a well-known fact that the human eye is sensitive to visible light at a wavelength of 555 nm under daylight conditions. Liu et al. and Chang et al. used the transmittance at a single wavelength to represent human perception [48,49], so it is feasible to quantify the transparency of jadeite by testing the transmission of the sample at 555 nm. According to the Chinese national standard GB/T 23885-2009 “Jadeite Grading”, transparency refers to the ability of an object to transmit visible light. Different objects have different transmittance to visible light, and their transparency is not the same. The comparison of transparency differences between objects can only be made under the same thickness conditions. So, the transparency of jadeite samples can be quantified by calculating the unit transmittance (t) under 555 nm:
where is the thickness of jadeite, is the transmittance of light through jadeite of a thickness , and the RI (refractive index) of jadeite is 1.66.
We calculated the color difference between N9.5 and N0.5 by the CIE DE2000 Equation (3). The correlation between unit transmittance and color difference is shown in Figure 5, which illustrates that the higher the unit transmittance of a sample is, the greater changes are shown under different backgrounds of the sample. In addition, the unit transmittance can be used as a reference for studying the influence of the transparency of jadeite.
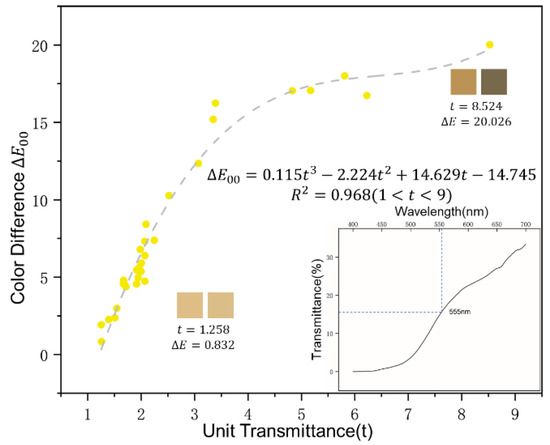
Figure 5.
The highly positive correlation between the unit transmittance of sample and the color difference on different backgrounds. Data are shown in Supplementary Materials Table S4.
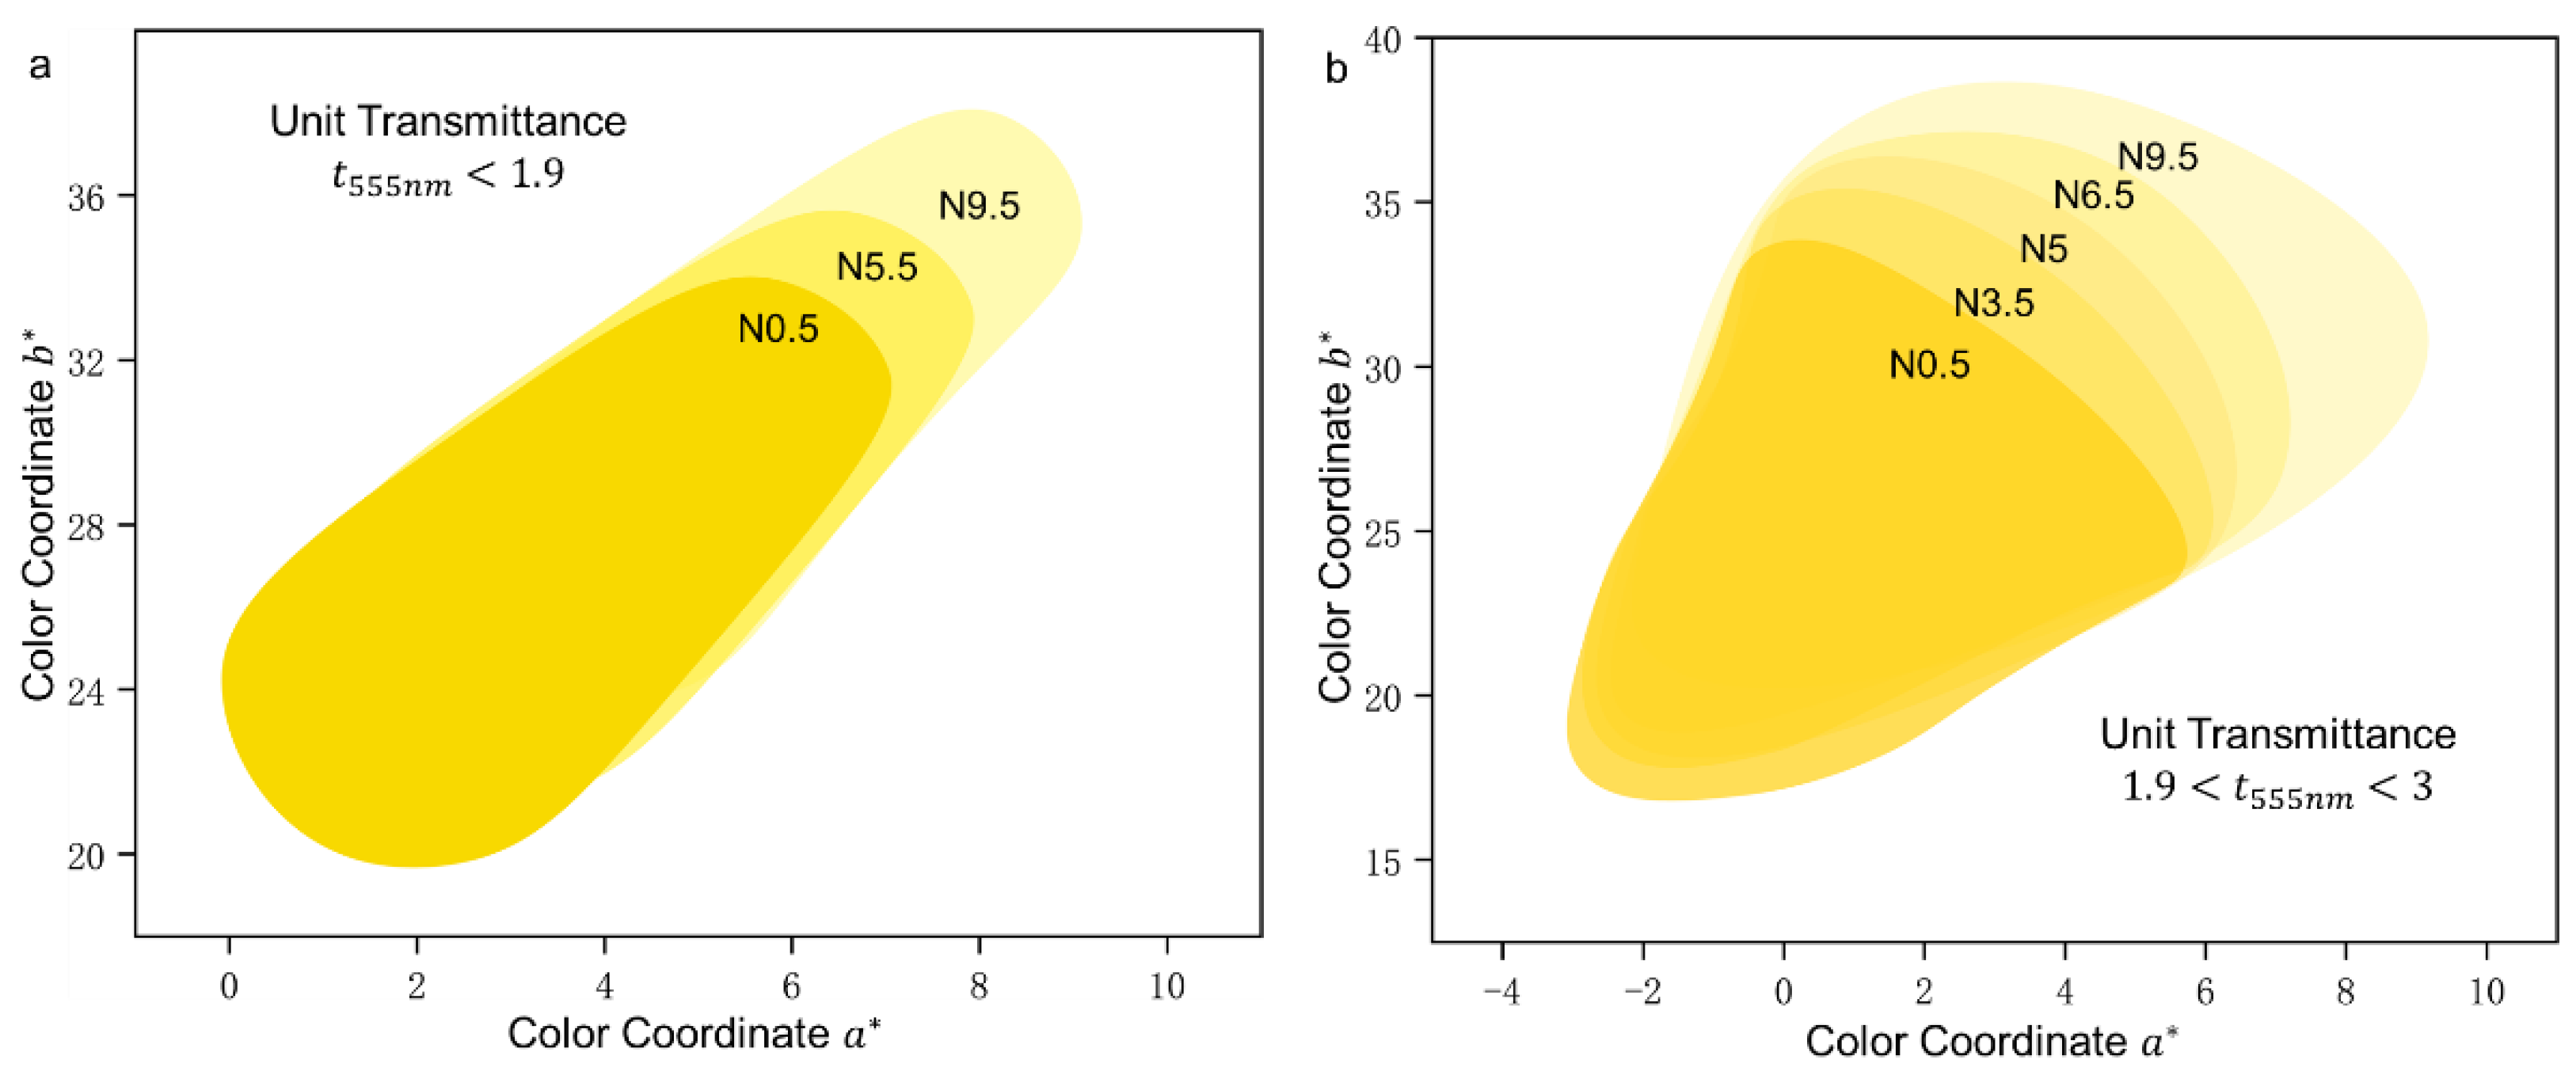
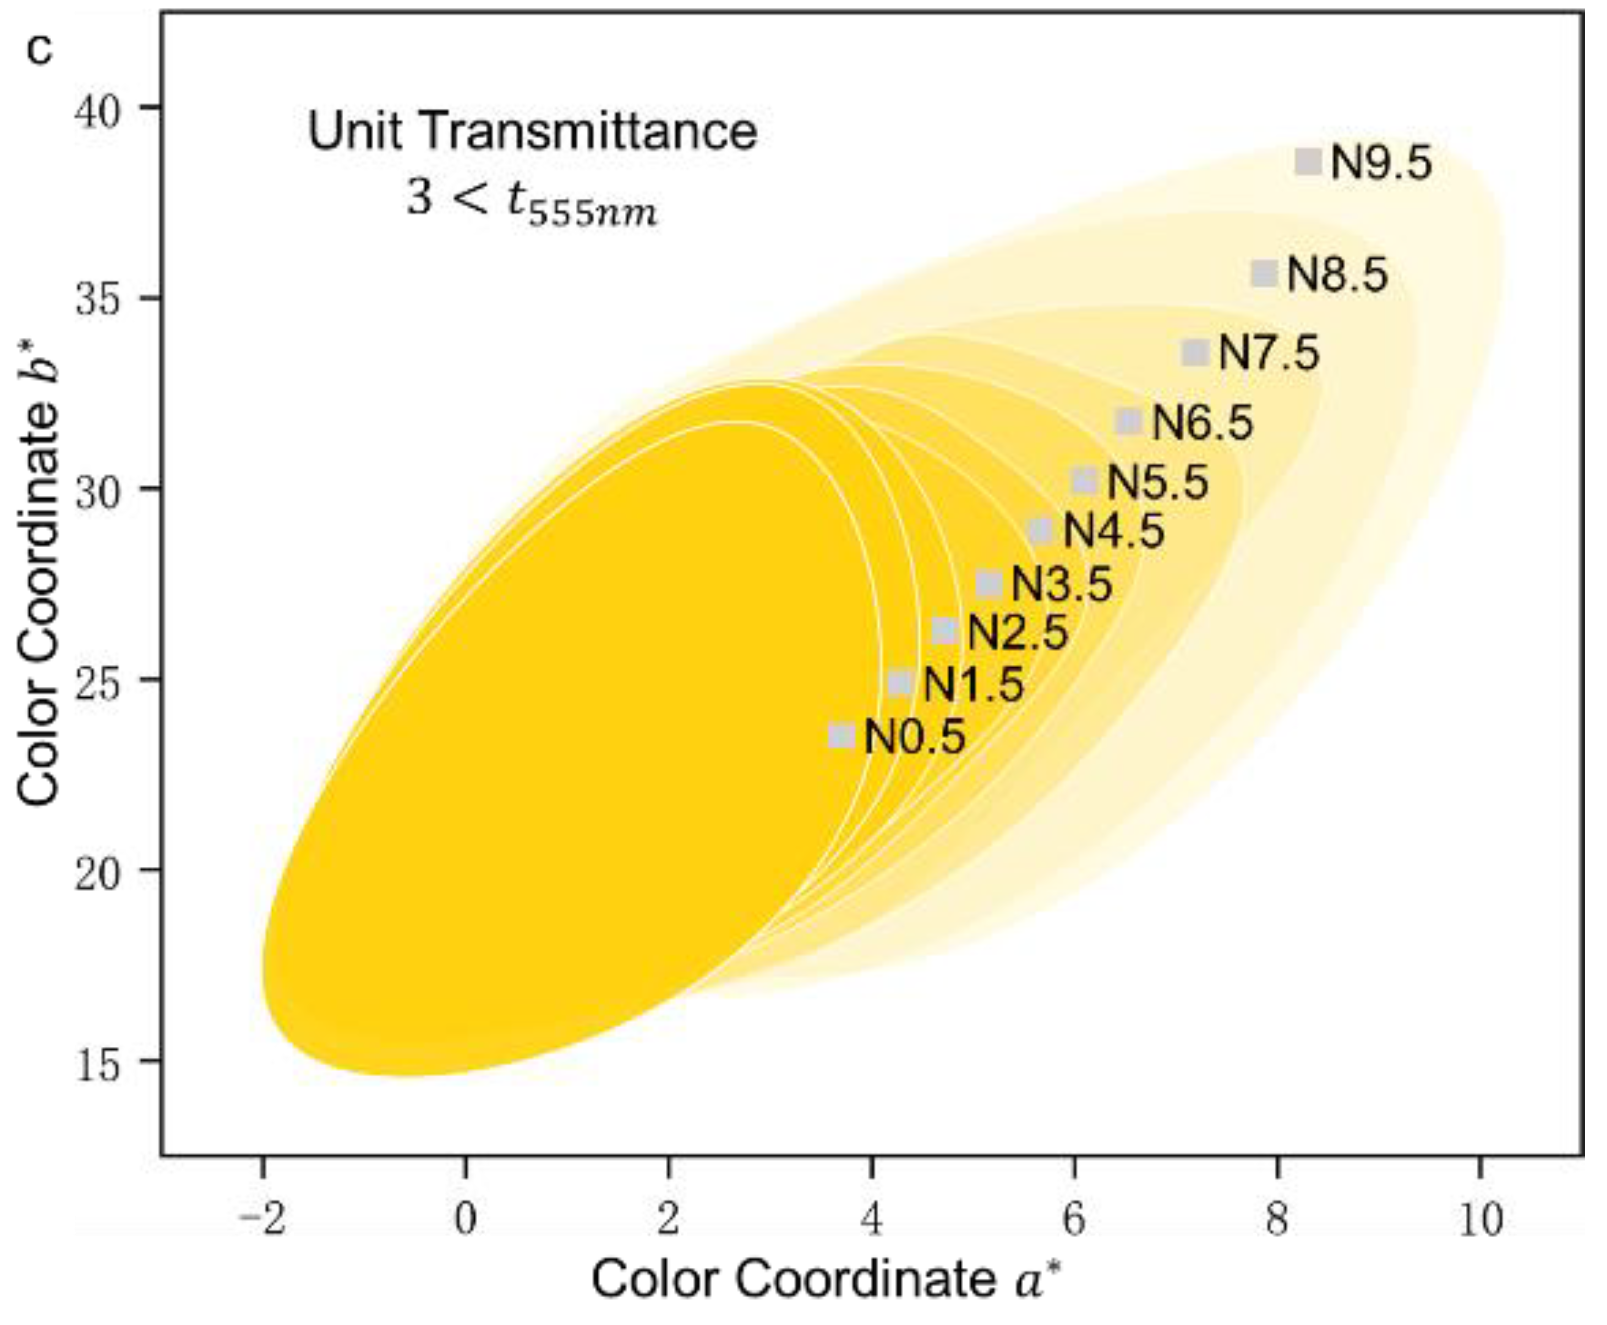
We divided the samples into three groups according to the unit transmittance. The first group is , the second is , and the third is , which were cast in a CIE1976 uniform color space. As shown in Figure 6a, the samples of the first group show a little sensitivity to the change of backgrounds, and with the increasing lightness of background (N0.5-N5.5-N9.5), the casting range has not become wider. In the second and third groups, the colorimetric coordinate and range was expanded as the background lightness increased, which means the higher the transparency of samples is, the greater the change caused by different backgrounds it shows. To compare the cast range of yellow jadeites with high transparency (Figure 6b,c) under different backgrounds, the dispersion of cast point would be the symbol to judge the size of color difference between each sample, which also illustrates that the lighter background would help us distinguish the color of yellow jadeite more easily.
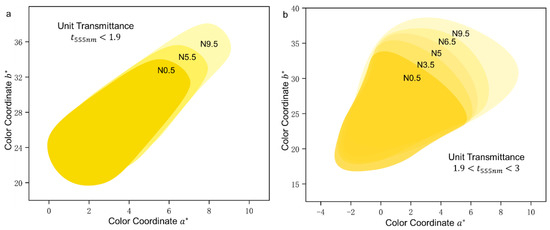

Figure 6.
The casting point diagrams of every sample within a group under different background. The color block represents the state of sample distribution in this background. (a) For sample with t less than 1.9, the range of does not expend. For samples within the groups (b) 1.9 < t < 3 and (c) 3 < t, the range of gets wilder as the lightness of background increases.
According to the conclusion above, the background has a significant effect on the color measurement, so it is crucial to select a neutral background during the measurement process. The Munsell N9.5 neutral value scale is a neutral background, while its high brightness allows for greater differentiation when measuring different samples. So, in this paper, we choose the N9.5 Value Scale as the color grading background for higher accuracy.
3.4. The Color Grading Result of Yellow Jadeite on the N9.5 Background
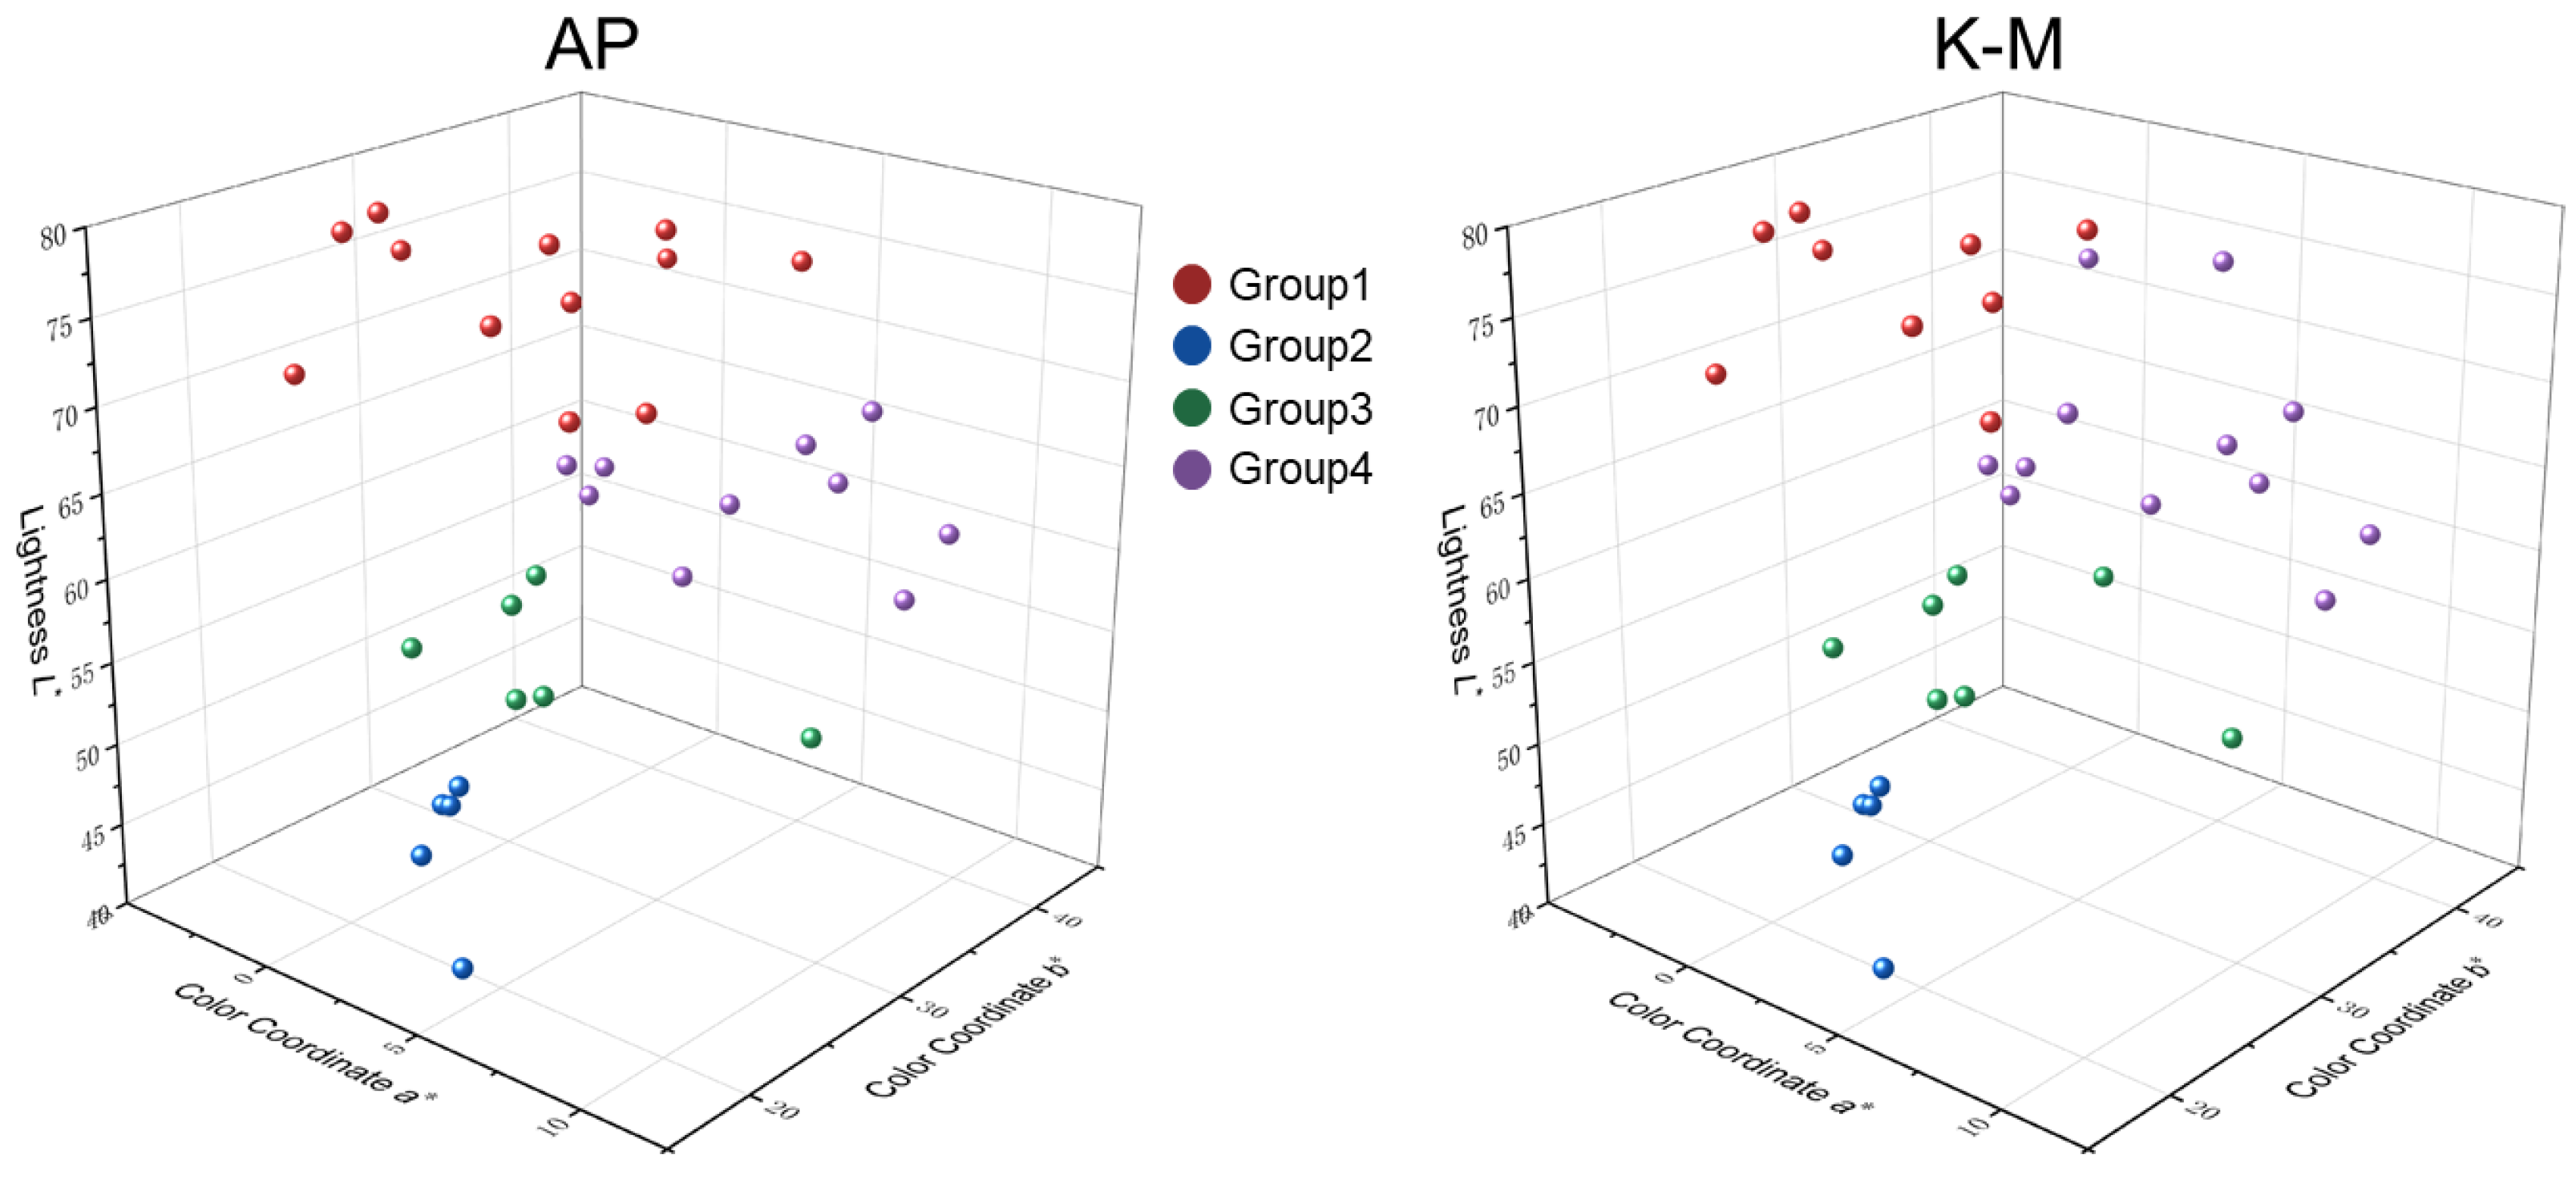
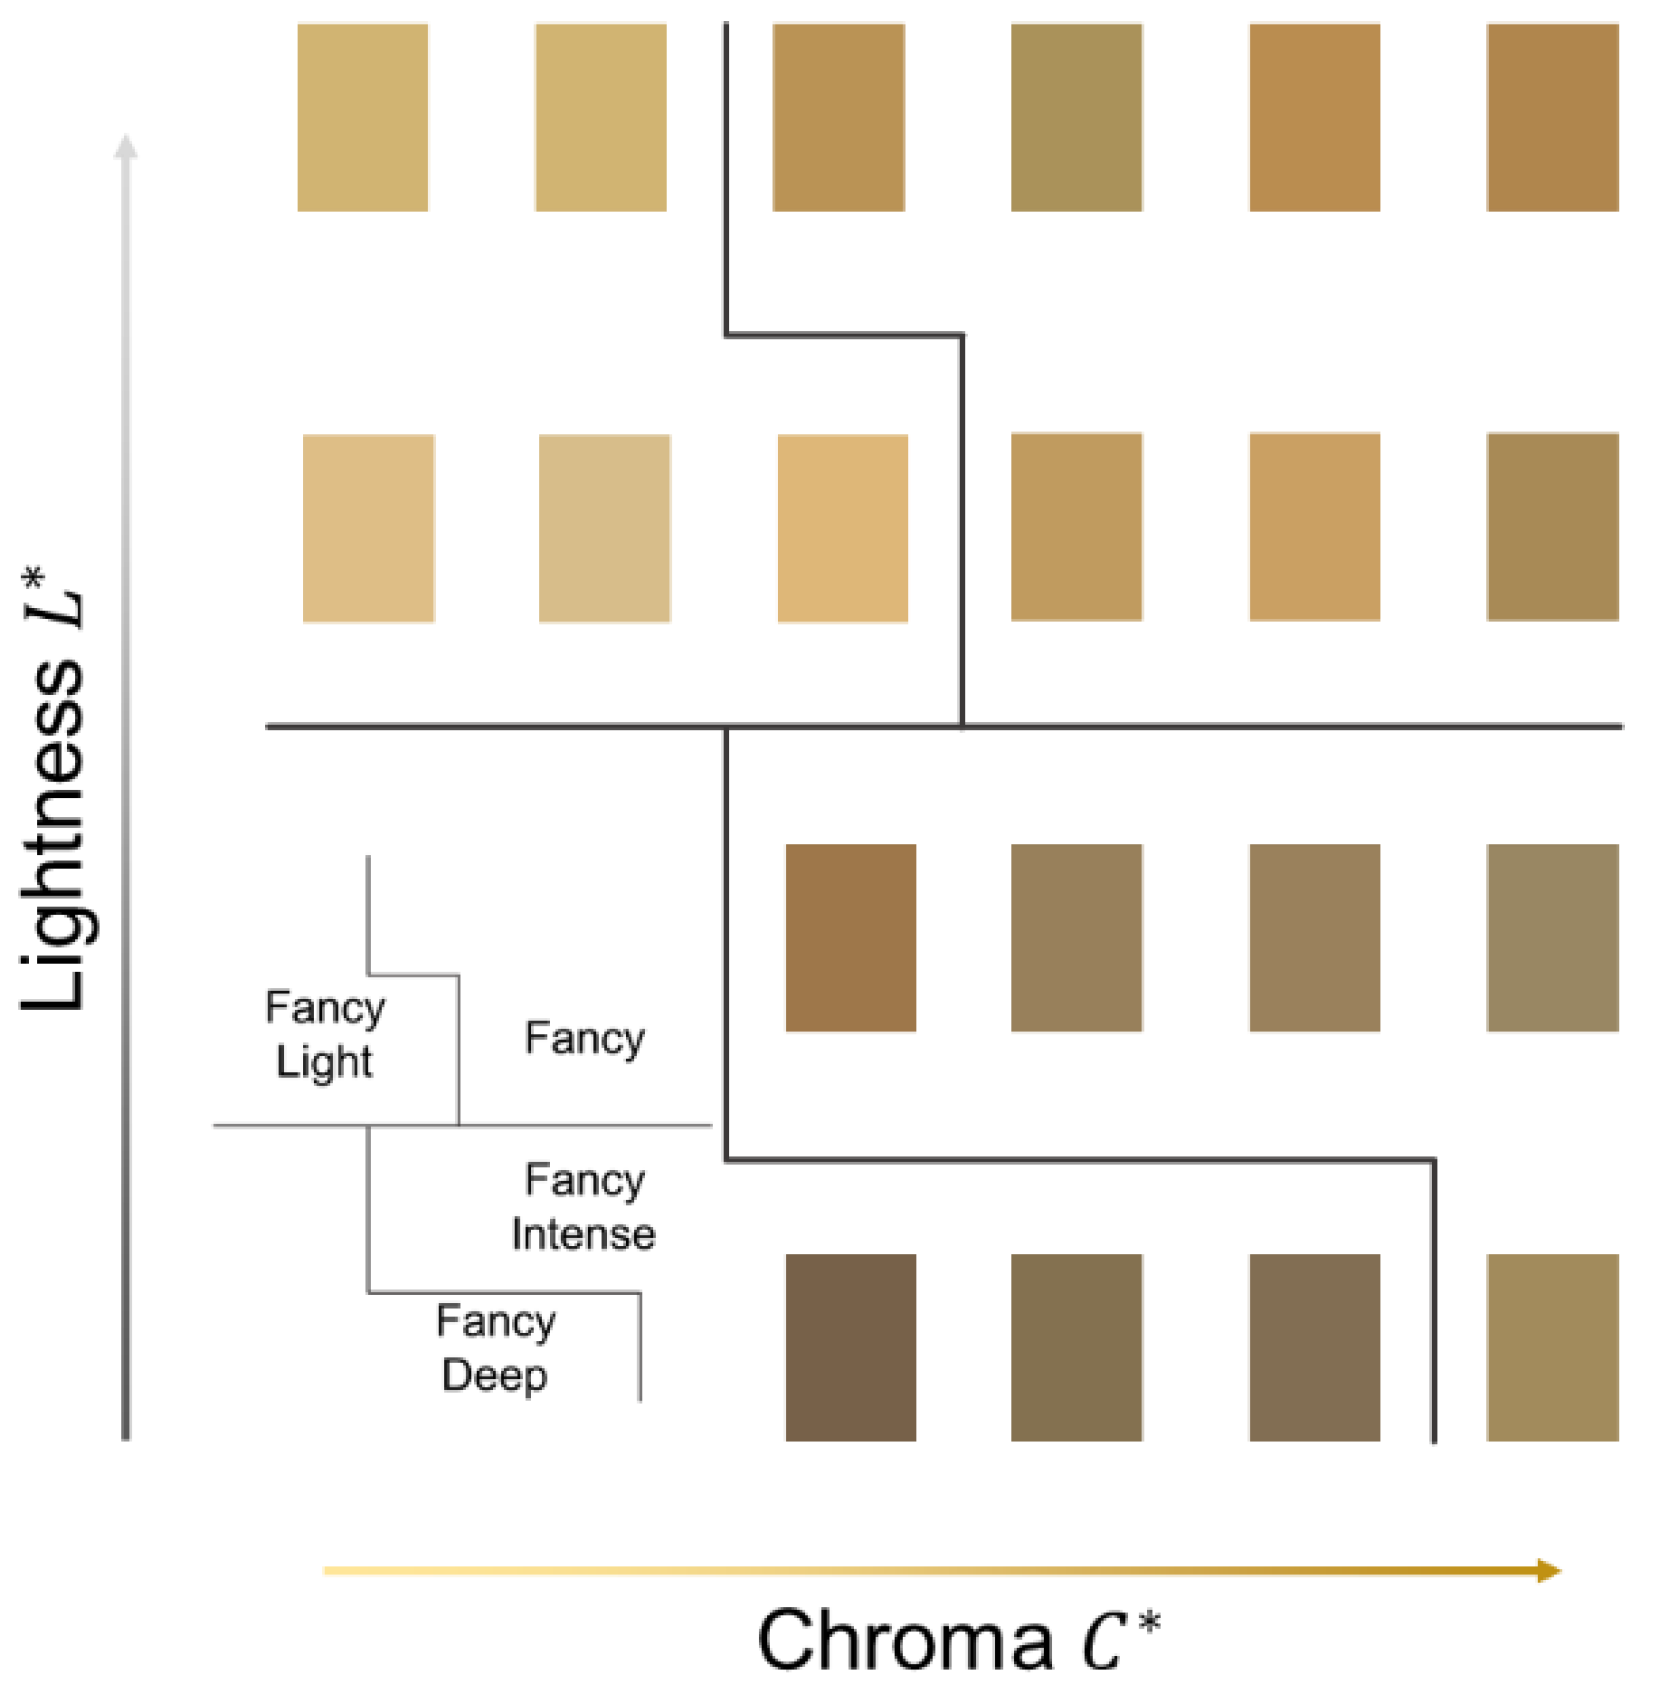
The 33 yellow jadeites’ quantification was obtained on the Munsell N9.5 Value Scale, and the grading result was analyzed by AP and K-means, which is shown in Figure 7 with Lightness and Colorimetric Coordinate . The 33 samples were graded into 4 groups, and the cluster centers are shown in Table 1. Based on testing results, we imitated the GIA GTL grading description: Looking at two of the three attributes of color at one time, that is, tone (Lightness) and saturation (Chroma), there is a constant hue (Figure 8). The color of yellow jadeites was divided into Fancy, Fancy Intense, Fancy Deep, and Fancy Light.
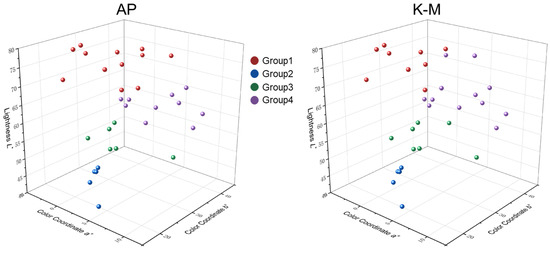
Figure 7.
The three-dimensional casting diagram (Lightness , Colorimetric Coordinate ) of yellow jadeite based on the CIE1976 uniform color space by AP and K-means cluster methods.

Table 1.
The cluster results of AP and K-means.
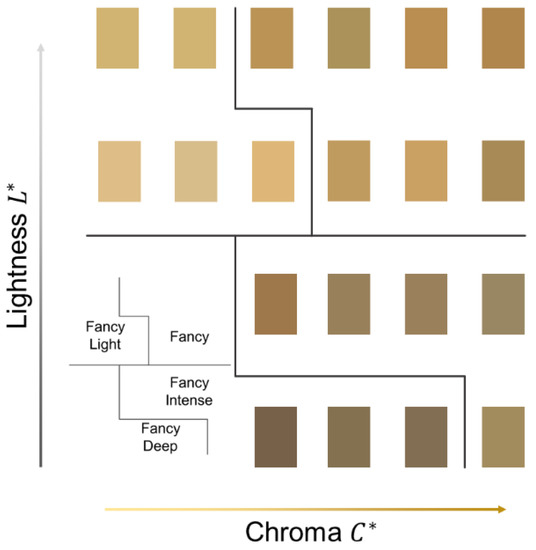
Figure 8.
The four groups of yellow jadeite color: Fancy, Fancy Intense, Fancy Deep, and Fancy Light.
4. Discussion
4.1. The Reason for the Variations in the of the Yellow Jadeite on Different Backgrounds
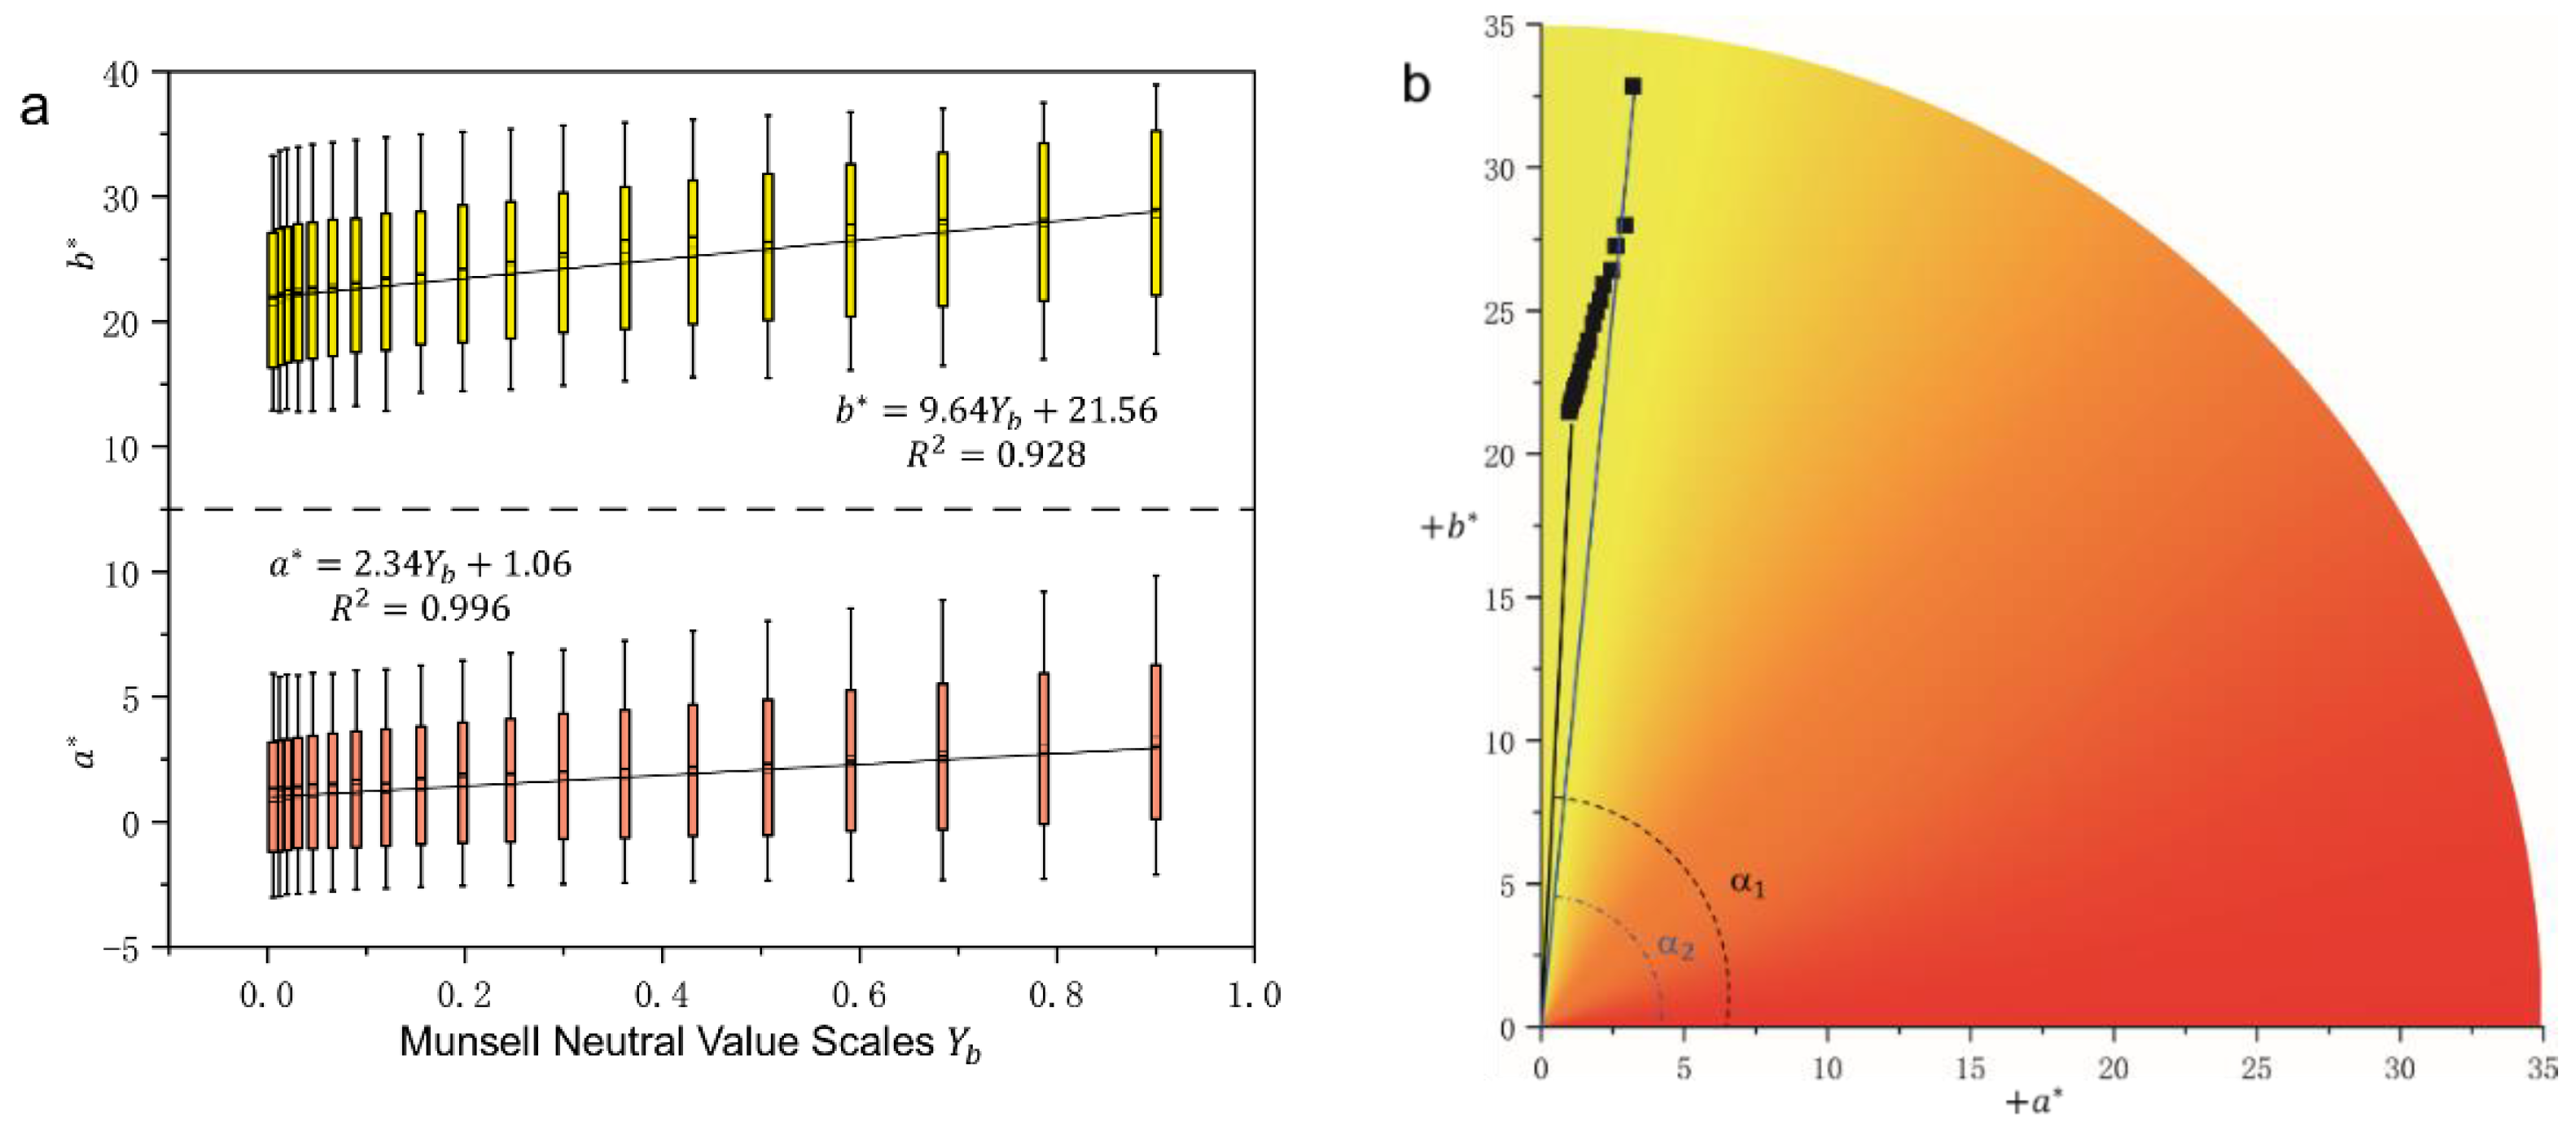
As we conclude in Section 3.2, the change in background would have a significant influence on the color of jadeite. With the increasing luminance factor of the background, the Lightness and Chroma of the samples increased, and the Hue decreased. The effect of the background is transmitted through the sample to the human eye as well as to the instrument so that an increase in the brightness of the background enhances the lightness of the sample. To combine with the results from Section 3.3, the more transparent samples are more significantly affected by the background, so when testing the more transparent samples, the N9.5 color card is chosen to help us distinguish the differences between similar colors. As is shown in Figure 9a, the colorimetric and increase as increases (The increase in here is not only an increase in absolute value, but some of the samples with larger Hues have their value varying from the −a axis to +a axis), according to Equation (1), which can explain the variations of Chroma. Although the trends of and are the same, according to the fitting results, the increment in is much larger than that of . In conjunction with Equation (2), the Hue can be described as the angle between the line connecting the point to the origin of the diagram and the +a axis (Figure 9b). That is the reason for the decline of Hue.

Figure 9.
(a) Changes in colorimetric coordinates and with different backgrounds. Data are shown in Supplementary Materials Tables S5 and S6. (b) The and cast-point that can explain the decreasing Hue. is the mean angle of all the sample on N0.5 while represents the N9.5.
4.2. The Comparison between AP and K-Means Cluster Methods
In data preprocessing, the K-means clustering method is extremely sensitive to the input order of sample parameters, and the random arrangement makes the results very unreasonable. However, the AP method can take all data points as potential exemplars; therefore, we first imported the samples for AP clustering and ranked the clustering results from high to low, based on which K-means clustering was performed.
In order to obtain the feasibility of the clustering method, the CIE DE2000 formula was used for the color difference calculation, i.e., the samples belong to the group with the cluster center that has the least difference from its color. As shown in Table 1, the coincidence rate of AP is higher than that of K-means, and AP only showed the minimum color difference not matching the grouping on sample Y-Jade-415, while K-means made it three times (Y-Jade-447, 454, OY-Jade-425). The sensitivity of K-means to ranking order makes it a hindrance to the addition of new samples, and the lower classification accuracy compared to AP does not provide better quality for grading. Therefore, we believe that the AP clustering analysis method will provide a better pretreatment for the sample incorporation of the original system and the construction of the new classification system. However, given the difference between the K-means and AP clustering center selection methods, AP takes a point within the group as the center, while K-means selects the point with the smallest sum of the distance from each point in the group. So, we think that under the condition that the number of samples is large and concentrated, the K-means would better help to select the center that is more representative of the whole group.
5. Conclusions
In the visible range, the strong blue-violet absorption is the main reason for the yellow color of jadeite, with characteristic peaks at 380 nm, a shoulder peak at 400 nm, and a weak absorption band at 500 nm. Under the standard D65 light source, the background has a significant impact on the color of yellow jadeite. As the luminance factor of the Munsell neutral value scale increased, the Lightness and colorimetric coordinate increased, which can explain the increase in Chroma and the decrease in Hue .
For those yellow jadeite with unit transparency >1.9, the background with different lightness will produce a great color difference in the gems. The N9.5 Munsell Value Scale expands the range of distribution, which can better help improve the accuracy of color grading.
By comparing the results of AP and K-means clustering methods for yellow jadeite grading on the Munsell N9.5 Value Scale, AP shows better inclusiveness as well as accuracy, which can serve the renewal or construction of a color grading system of gems, and the K-means method can be used for the optimization of clustering center selection. According to the results of clustering, the grading of yellow jadeite can be divided into four categories: Fancy, Fancy Intense, Fancy Deep, and Fancy Light.
Jadeite, as one of the most important components of precious gemstones loved by the Chinese, the green color of jadeite has been studied in depth, so studying the color of yellow jadeite can complete the whole system. However, because the number of samples used in this paper is limited and the effect of its cutting shape on color is not discussed, in the future, we will select more yellow jadeites with different cutting shapes to improve the generalizability of the study.
Supplementary Materials
The following supporting information can be downloaded at: https://www.mdpi.com/article/10.3390/cryst12020241/s1, Table S1: Relation between Yb and Lightness L*; Table S2: Relation between Yb and Chroma C*; Table S3: Relation between Yb and Hue h°; Table S4: Relation between unit transmittance t and color differences ΔE00; Table S5: Relation between Yb and Color Coordinate a*; Table S6: Relation between Yb and Color Coordinate b*.
Author Contributions
Conceptualization, Z.L. and Y.G.; methodology, Z.L.; software, Z.L.; validation, Z.L., Y.G.; formal analysis, Z.L.; investigation, Z.L.; resources, Z.L.; data curation, Z.L.; writing—original draft preparation, Z.L.; writing—review and editing, Y.G.; visualization, Z.L.; supervision, Y.G.; project administration, Z.L. All authors have read and agreed to the published version of the manuscript.
Funding
This research received no external funding.
Data Availability Statement
Data are contained within the article and Supplementary Materials.
Acknowledgments
The experiments in this article were conducted in the laboratory of the Gemological Institute, China University of Geoscience, Beijing. We would like to thank Shang Yanran for providing a part of the samples and Jiang Yuansheng and Tang Jun for their kind help in completing this study.
Conflicts of Interest
The authors declare no conflict of interest.
References
- Hughes, R.; Galibert, O.; Bosshart, G.; Ward, F.; Oo, T.; Smith, M.; Tay, T.; Harlow, G. Burmese Jade: The Inscrutable Gem. Gems Gemol. 2000, 36, 2–25. [Google Scholar] [CrossRef] [Green Version]
- Harlow, G.; Sorensen, S. Jadeitite from Guatemala: Distinctions among multiple occurrences. Geol. Acta 2011, 9, 363–387. [Google Scholar] [CrossRef]
- Shi, G.; Harlow, G.; Wang, J.; Wang, J.; Enoch, N.G.; Wang, X.; Cao, S.; Enyuancui, W. Mineralogy of jadeitite and related rocks from Myanmar: A review with new data. Eur. J. Mineral. 2012, 24, 345–370. [Google Scholar] [CrossRef]
- Yui, T.-F.; Maki, K.; Usuki, T.; Lan, C.-Y.; Martens, U.; Wu, C.-M.; Wu, T.-W.; Liou, J.G. Genesis of Guatemala jadeitite and related fluid characteristics: Insight from zircon. Chem. Geol. 2010, 270, 45–55. [Google Scholar] [CrossRef]
- Tsujimori, T.; Harlow, G. Petrogenetic relationships between jadeitite and associated high-pressure and low-temperature metamorphic rocks in worldwide jadeitite localities: A review. Eur. J. Mineral. 2012, 24, 371–390. [Google Scholar] [CrossRef] [Green Version]
- Wang, H.; Ying, G.; Zhang, Y. Difference Analysis of Different Standard Illuminants on Yellow-Green to Green Jadeite-Jade. Key. Eng. Mater. 2011, 492, 374–378. [Google Scholar] [CrossRef]
- Yan, W.W.; Yuan, X.Q. Study on the secondary colour of myanmar jade by first order derivative UV spectrophotometry. Kuangwu Yanshi J. Mineral. Petrol. 2012, 32, 1–5. [Google Scholar] [CrossRef]
- Pan, X.; Guo, Y.; Liu, Z.Y.; Zhang, Z.K.; Shi, Y.X. Impact of different standard lighting sources on red jadeite and color quality grading. Earth Sci. Res. J. 2019, 23, 371–378. [Google Scholar] [CrossRef] [Green Version]
- Xiao, Y.; Ying, G.; Chen, D. The Influences of Lightness Variation of the Non-Color Background on the Color of the Blood Amber. Key. Eng. Mater. 2014, 633, 524–535. [Google Scholar] [CrossRef]
- Ma, L.; Ying, G.; Tang, W. The Influence of Variety Lightness of Neutral Background on Peridot’s Color Appearance. Key. Eng. Mater. 2013, 591, 281–284. [Google Scholar] [CrossRef]
- Tang, J.; Guo, Y.; Xu, C. Light Pollution Effects of Illuminance on Yellowish Green Forsterite Color under CIE Standard Light Source D-65. Ekoloji 2018, 27, 1181–1190. [Google Scholar]
- Liou, J.-J. A Novel Color Recognition Model for Improvement on Color Differences in Products via Grey Relational Grade. Axioms 2021, 10, 266. [Google Scholar] [CrossRef]
- Ying, G.; Wang, H.; Xiang, L.; Dong, S. Metamerism Appreciation of Jadeite-Jade Green under the Standard Light Sources D 65, A and CWF. Acta Geol. Sin. Engl. Ed. 2016, 90, 2097–2103. [Google Scholar] [CrossRef]
- Tang, J.; Guo, Y.; Xu, C. Color effect of light sources on peridot based on CIE1976 L*a*b* color system and round RGB diagram system. Color Res. Appl. 2019, 44, 932–940. [Google Scholar] [CrossRef]
- Mangkuto, R.A.; Enge, A.; Munir, F.; Soelami, F.N. The effects of illuminance, colour temperature, and colour rendering of various existing light-emitting diode lamps on subjective preference and performance in Indonesia. J. Build. Eng. 2018, 19, 334–341. [Google Scholar] [CrossRef]
- Tantanatewin, W.; Inkarojrit, V. Effects of color and lighting on retail impression and identity. J. Environ. Psychol. 2016, 46. [Google Scholar] [CrossRef]
- Zhao, Z.; Ying, G. Colour Quality Evaluation of Bluish-Green Serpentinite Based on the CIECAM16 Model. Minerals 2021, 12, 38. [Google Scholar] [CrossRef]
- Xu, C.; Wu, C.-F.; Xu, D.-D.; Lai, Y.-S. Have the Display Illumination Design Misled Customers on Color Perception? A Study on Differences of Color Caused by LED Lighting on Leather Products; Springer: Berlin/Heidelberg, Germany, 2020; pp. 346–353. [Google Scholar]
- Munsell, A.; Sloan, L.; Godlove, I. Neutral Value Scales. I. Munsell Neutral Value Scale. JOSA 1933, 23, 394–402. [Google Scholar] [CrossRef]
- Liu, Y.; Shigley, J.E.; Moses, T.M.; King, J.M. Color Grading of Colored Diamonds in the GIA Gem Trade Laboratory. Gems Gemol. 1994, 30, 220–242. [Google Scholar] [CrossRef]
- King, J.; Moses, T.; Shigley, J.; Welbourn, C.; Lawson, S.; Cooper, M. Characterizing Natural-Color Type IIb Blue Diamonds. Gems Gemol. 1998, 34, 246–268. [Google Scholar] [CrossRef]
- Eaton-Magaña, S.; Ardon, T.; Smit, K.; Breeding, C.; Shigley, J. Natural-Color Pink, Purple, Red, and Brown Diamonds: Band of Many Colors. Gems Gemol. 2019, 54, 352–377. [Google Scholar] [CrossRef]
- King, J.; Shigley, J.; Gelb, T.; Guhin, S.; Hall, M.; Wang, W. Characterization and Grading of Natural-Color Yellow Diamonds. Gems Gemol. 2005, 41, 88–115. [Google Scholar] [CrossRef]
- King, J.; Geurts, R.; Gilbertson, A.; Shigley, J. Color Grading “D-to-Z” Diamonds at the GIA Laboratory. Gems Gemol. 2008, 44, 296–321. [Google Scholar] [CrossRef]
- McLaren, K. The Development of the CIE 1976 (L*a*b*) Uniform Colour-Space and Colour-Difference Formula. J. Soc. Dye. Colour 2008, 92, 338–341. [Google Scholar] [CrossRef]
- Han, J.; Ying, G.; Liu, S. Environmental Issues on Color Quality Evaluation of Blue Sapphire based on Gemdialogue TM Color Comparison Charts. Ekoloji 2018, 27, 1365–1376. [Google Scholar]
- Guo, Y.; Zong, X.; Qi, M. Feasibility study on quality evaluation of Jadeite-jade color green based on GemDialogue color chip. Multimed. Tools Appl. 2019, 78, 841–856. [Google Scholar] [CrossRef]
- Ying, G.; Zhang, J.; Mo, T. Contribution of Green Jadeite-Jade’s Chroma Difference Based on CIE 1976 L*a*b* Uniform Color Space. Adv. Mater. Res. 2010, 177, 620–623. [Google Scholar] [CrossRef]
- Zhang, S.F.; Guo, Y. Measurement of Gem Colour Using a Computer Vision System: A Case Study with Jadeite-Jade. Minerals 2021, 11, 791. [Google Scholar] [CrossRef]
- Ying, G. Quality evaluation of tourmaline red based on uniform color space. Clust. Comput. 2017, 20. [Google Scholar] [CrossRef]
- Liu, Y. Colour hue change of a gem tourmaline from the Umba Valley, Tanzania. J. Gemmol. 1999, 26, 386–396. [Google Scholar] [CrossRef]
- Liu, Y.; Shigley, J.; Fritsch, E.; Hemphill, S. The “alexandrite effect” in gemstones. Color Res. Appl. 1994, 19, 186–191. [Google Scholar] [CrossRef]
- Cheng, R.P.; Guo, Y. Study on the effect of heat treatment on amethyst color and the cause of coloration. Sci. Rep. 2020, 10. [Google Scholar] [CrossRef] [PubMed]
- Wang, X.D.; Guo, Y. The impact of trace metal cations and absorbed water on colour transition of turquoise. R. Soc. Open Sci. 2021, 8, 201110. [Google Scholar] [CrossRef] [PubMed]
- Jiang, Y.S.; Guo, Y. Genesis and influencing factors of the colour of chrysoprase. Sci. Rep. 2021, 11. [Google Scholar] [CrossRef]
- Qiu, Y.; Guo, Y. Explaining Colour Change in Pyrope-Spessartine Garnets. Minerals 2021, 11, 865. [Google Scholar] [CrossRef]
- Wang, H.; Guan, Q.; Liu, Y.; Guo, Y. Effects of Transition Metal Ions on the Colour of Blue-Green Beryl. Minerals 2022, 12, 86. [Google Scholar] [CrossRef]
- Tang, J.; Guo, Y.; Xu, C. Metameric effects on peridot by changing background color. J. Opt. Soc. Am. A-Opt. Image Sci. Vis. 2019, 36, 2030–2039. [Google Scholar] [CrossRef]
- Jiang, Y.S.; Guo, Y.; Zhou, Y.F.; Li, X.; Liu, S.M. The Effects of Munsell Neutral Grey Backgrounds on the Colour of Chrysoprase and the Application of AP Clustering to Chrysoprase Colour Grading. Minerals 2021, 11, 1092. [Google Scholar] [CrossRef]
- Han, J.; Kamber, M.; Pei, J. Data Mining: Concepts and Techniques third edition. Morgan Kaufmann Ser. Data Manag. Syst 2011, 5, 83–124. [Google Scholar]
- Pan, X.; Guo, Y.; Liu, Z.; Zhang, Z.; Shi, Y. Application of cluster analysis and discriminant analysis in quality grading of jadeite red. J. Phys. Conf. Ser. 2019, 1324, 012101. [Google Scholar] [CrossRef] [Green Version]
- Frey, B.; Dueck, D. Clustering by Passing Messages Between Data Points. Science 2007, 315, 972–976. [Google Scholar] [CrossRef] [PubMed] [Green Version]
- Pecho, O.; Ghinea, R.I.; Alessandretti, R.; Gómez, M.d.M.P.; della Bona, A. Visual and instrumental shade matching using CIELAB and CIEDE2000 color difference formulas. Dent. Mater. 2015, 32, 82–92. [Google Scholar] [CrossRef] [PubMed]
- Liu, F.; Ying, G.; Lv, S.; Chen, G. Application of the Entropy Method and Color Difference Formula to the Evaluation of Round Brilliant Cut Diamond Scintillation. Mathematics 2020, 8, 1489. [Google Scholar] [CrossRef]
- Lu, Z.; He, X.; Lin, C.; Jin, X.; Pan, Y. Identification of Beihong Agate and Nanhong Agate from China Based on Chromaticity and Raman Spectra. Guang Pu Xue Yu Guang Pu Fen Xi Guang Pu 2019, 39, 2153–2159. [Google Scholar] [CrossRef]
- Sherman, D.; Waite, T. Electronic Spectra of Fe3+ Oxides and Oxide Hydroxides in the Near IR to Near UV. Am. Mineral. AMER MINERAL 1985, 70, 1262–1269. [Google Scholar]
- Yuan, X.; Qi, L.; Du, G.; Chen, X. UV-VIS-NIR Spectrum of Jadeite Jade from Burma. J. Gems Gemmol. 2003, 11–16. [Google Scholar] [CrossRef]
- Liu, M.; Zhang, Y.; Wu, C.; Xiong, S.; Zhou, C. Chitosan/halloysite nanotubes bionanocomposites: Structure, mechanical properties and biocompatibility. Int. J. Biol. Macromol. 2012, 51, 566–575. [Google Scholar] [CrossRef]
- Chang, C.-W.; Hon, M.-H.; Leu, I.-C. The transmittance and sheet resistance of chemically and heat reduced graphene oxide film. Opt. Quantum Electron. 2018, 51, 1–7. [Google Scholar] [CrossRef]

Publisher’s Note: MDPI stays neutral with regard to jurisdictional claims in published maps and institutional affiliations. |
© 2022 by the authors. Licensee MDPI, Basel, Switzerland. This article is an open access article distributed under the terms and conditions of the Creative Commons Attribution (CC BY) license (https://creativecommons.org/licenses/by/4.0/).