

Mechanosynthesis of Mesoporous Bi-Doped TiO2: The Effect of Bismuth Doping and Ball Milling on the Crystal Structure, Optical Properties, and Photocatalytic Activity

 , , and
Abstract
:1. Introduction
2. Materials and Methods
2.1. Chemicals
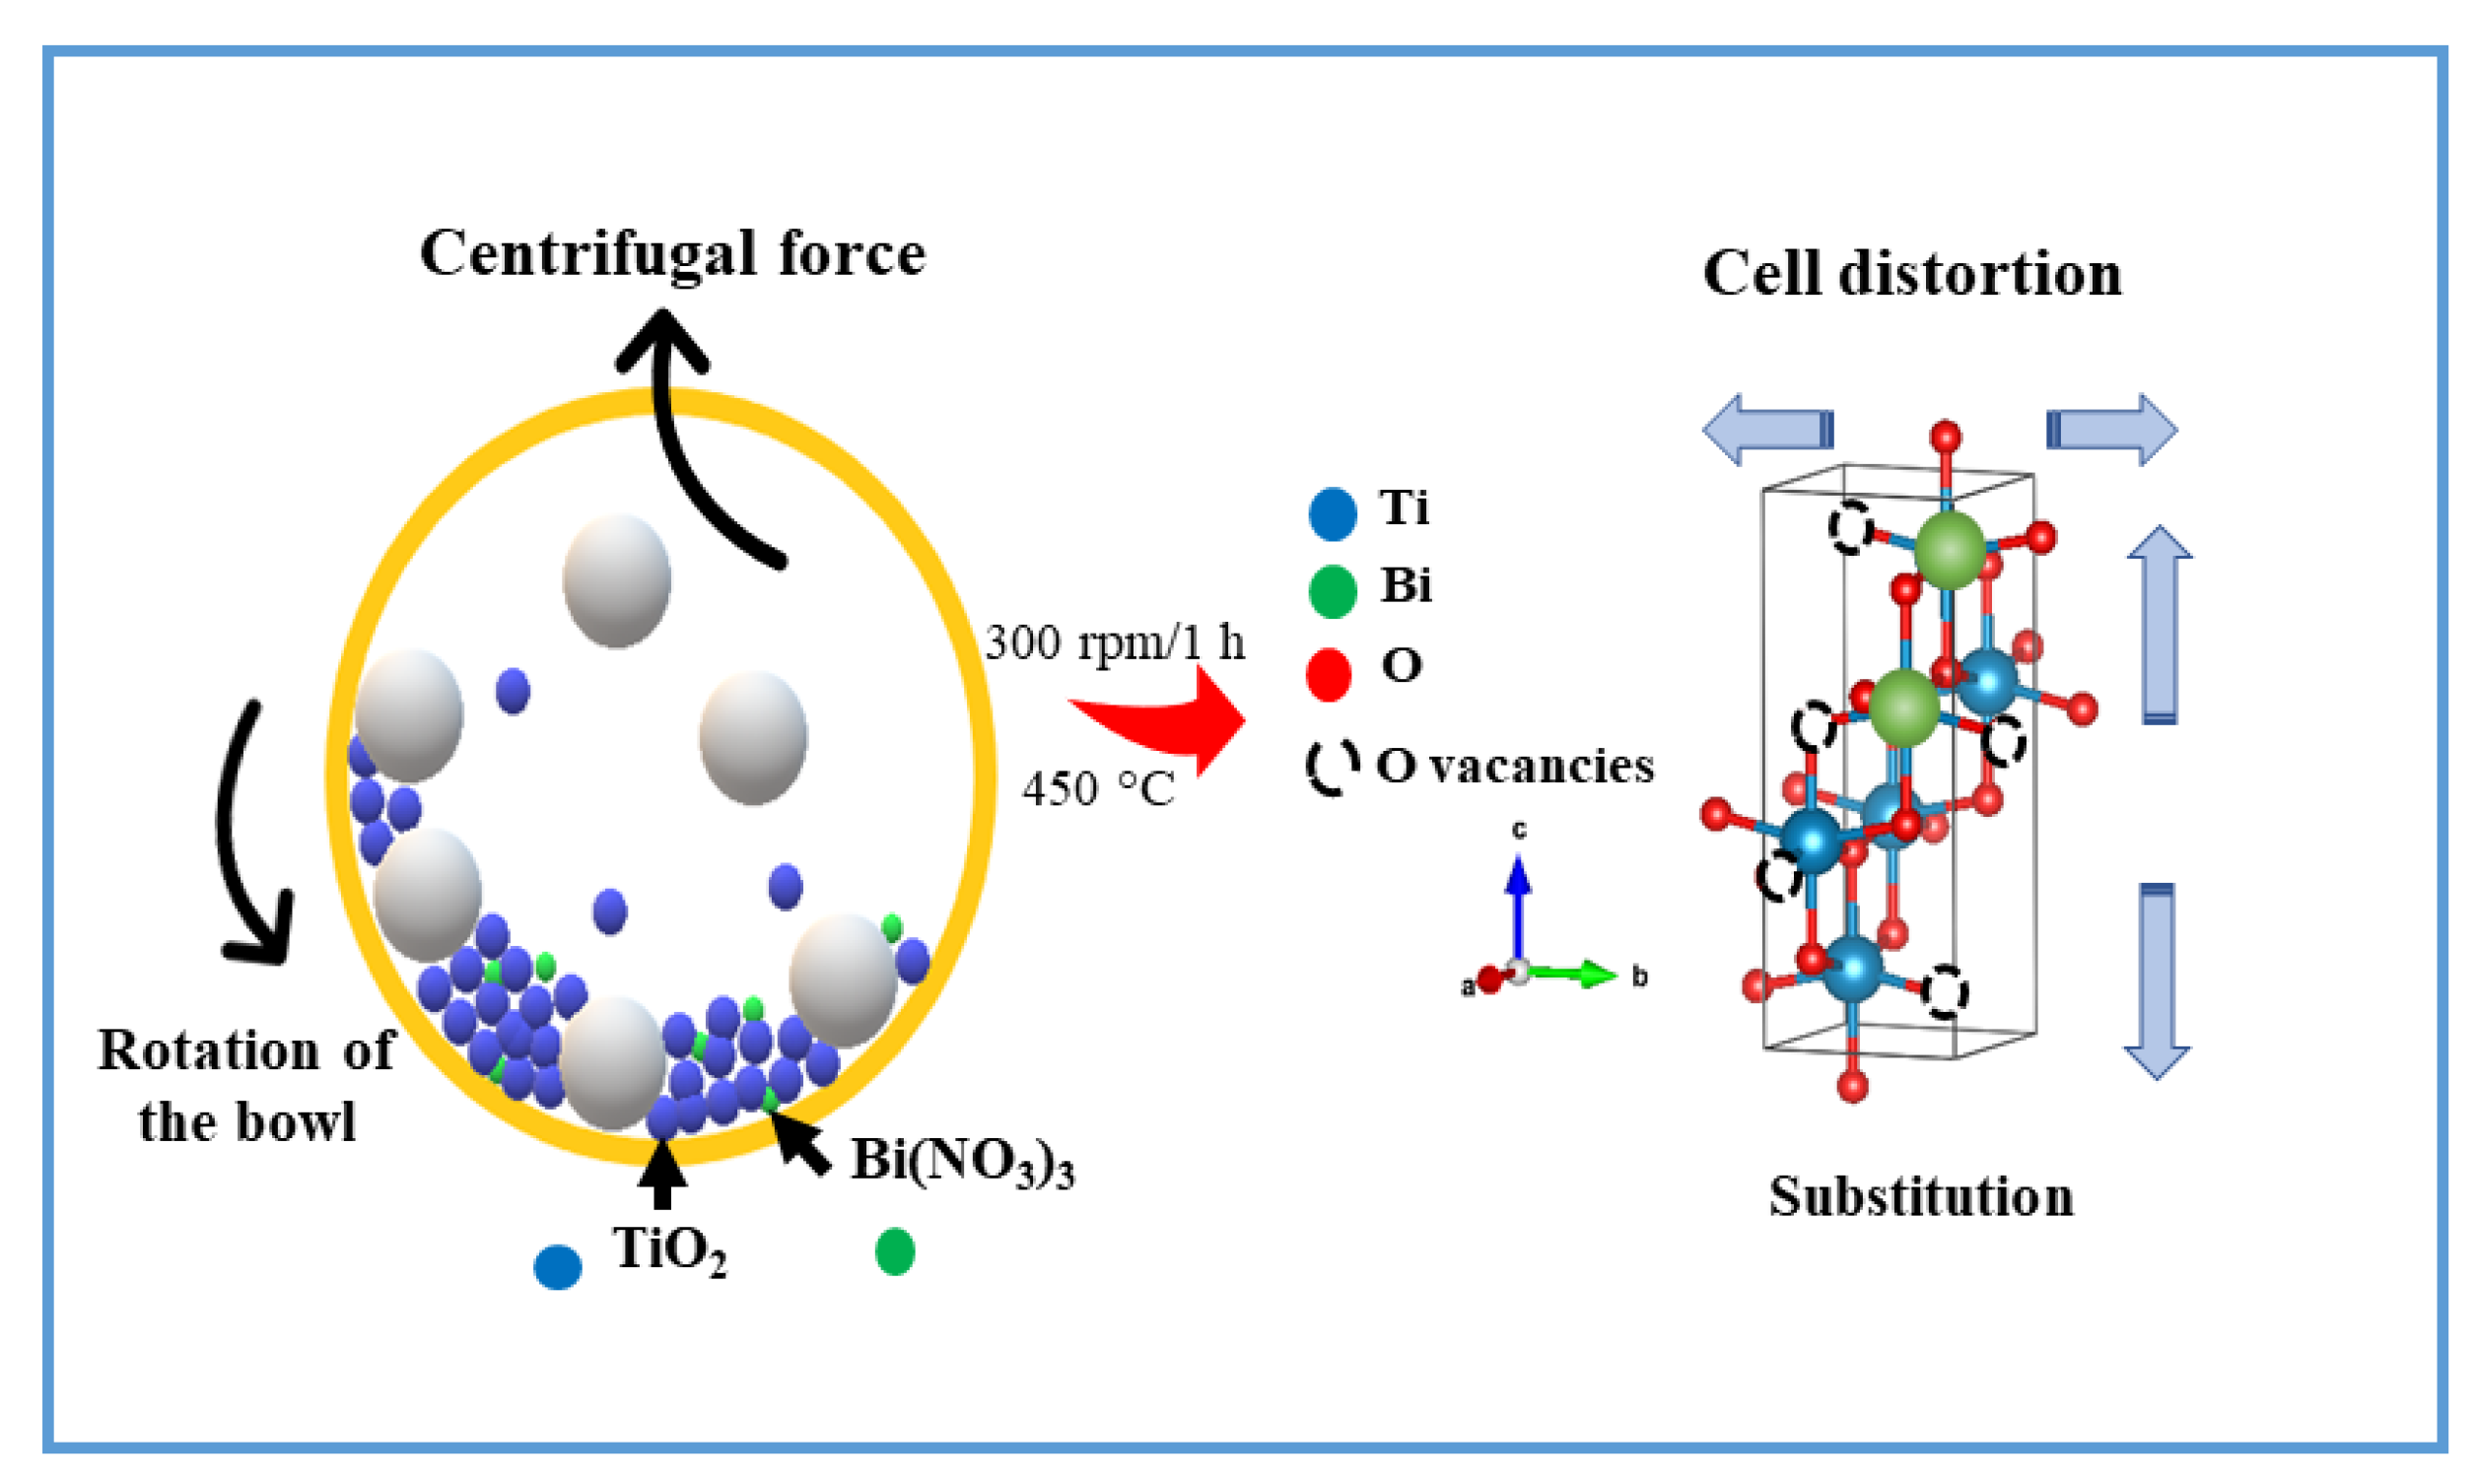
2.2. Synthesis of Bi-Doped TiO2
2.3. Photocatalytic Activity Evaluation
2.4. Characterization
3. Results
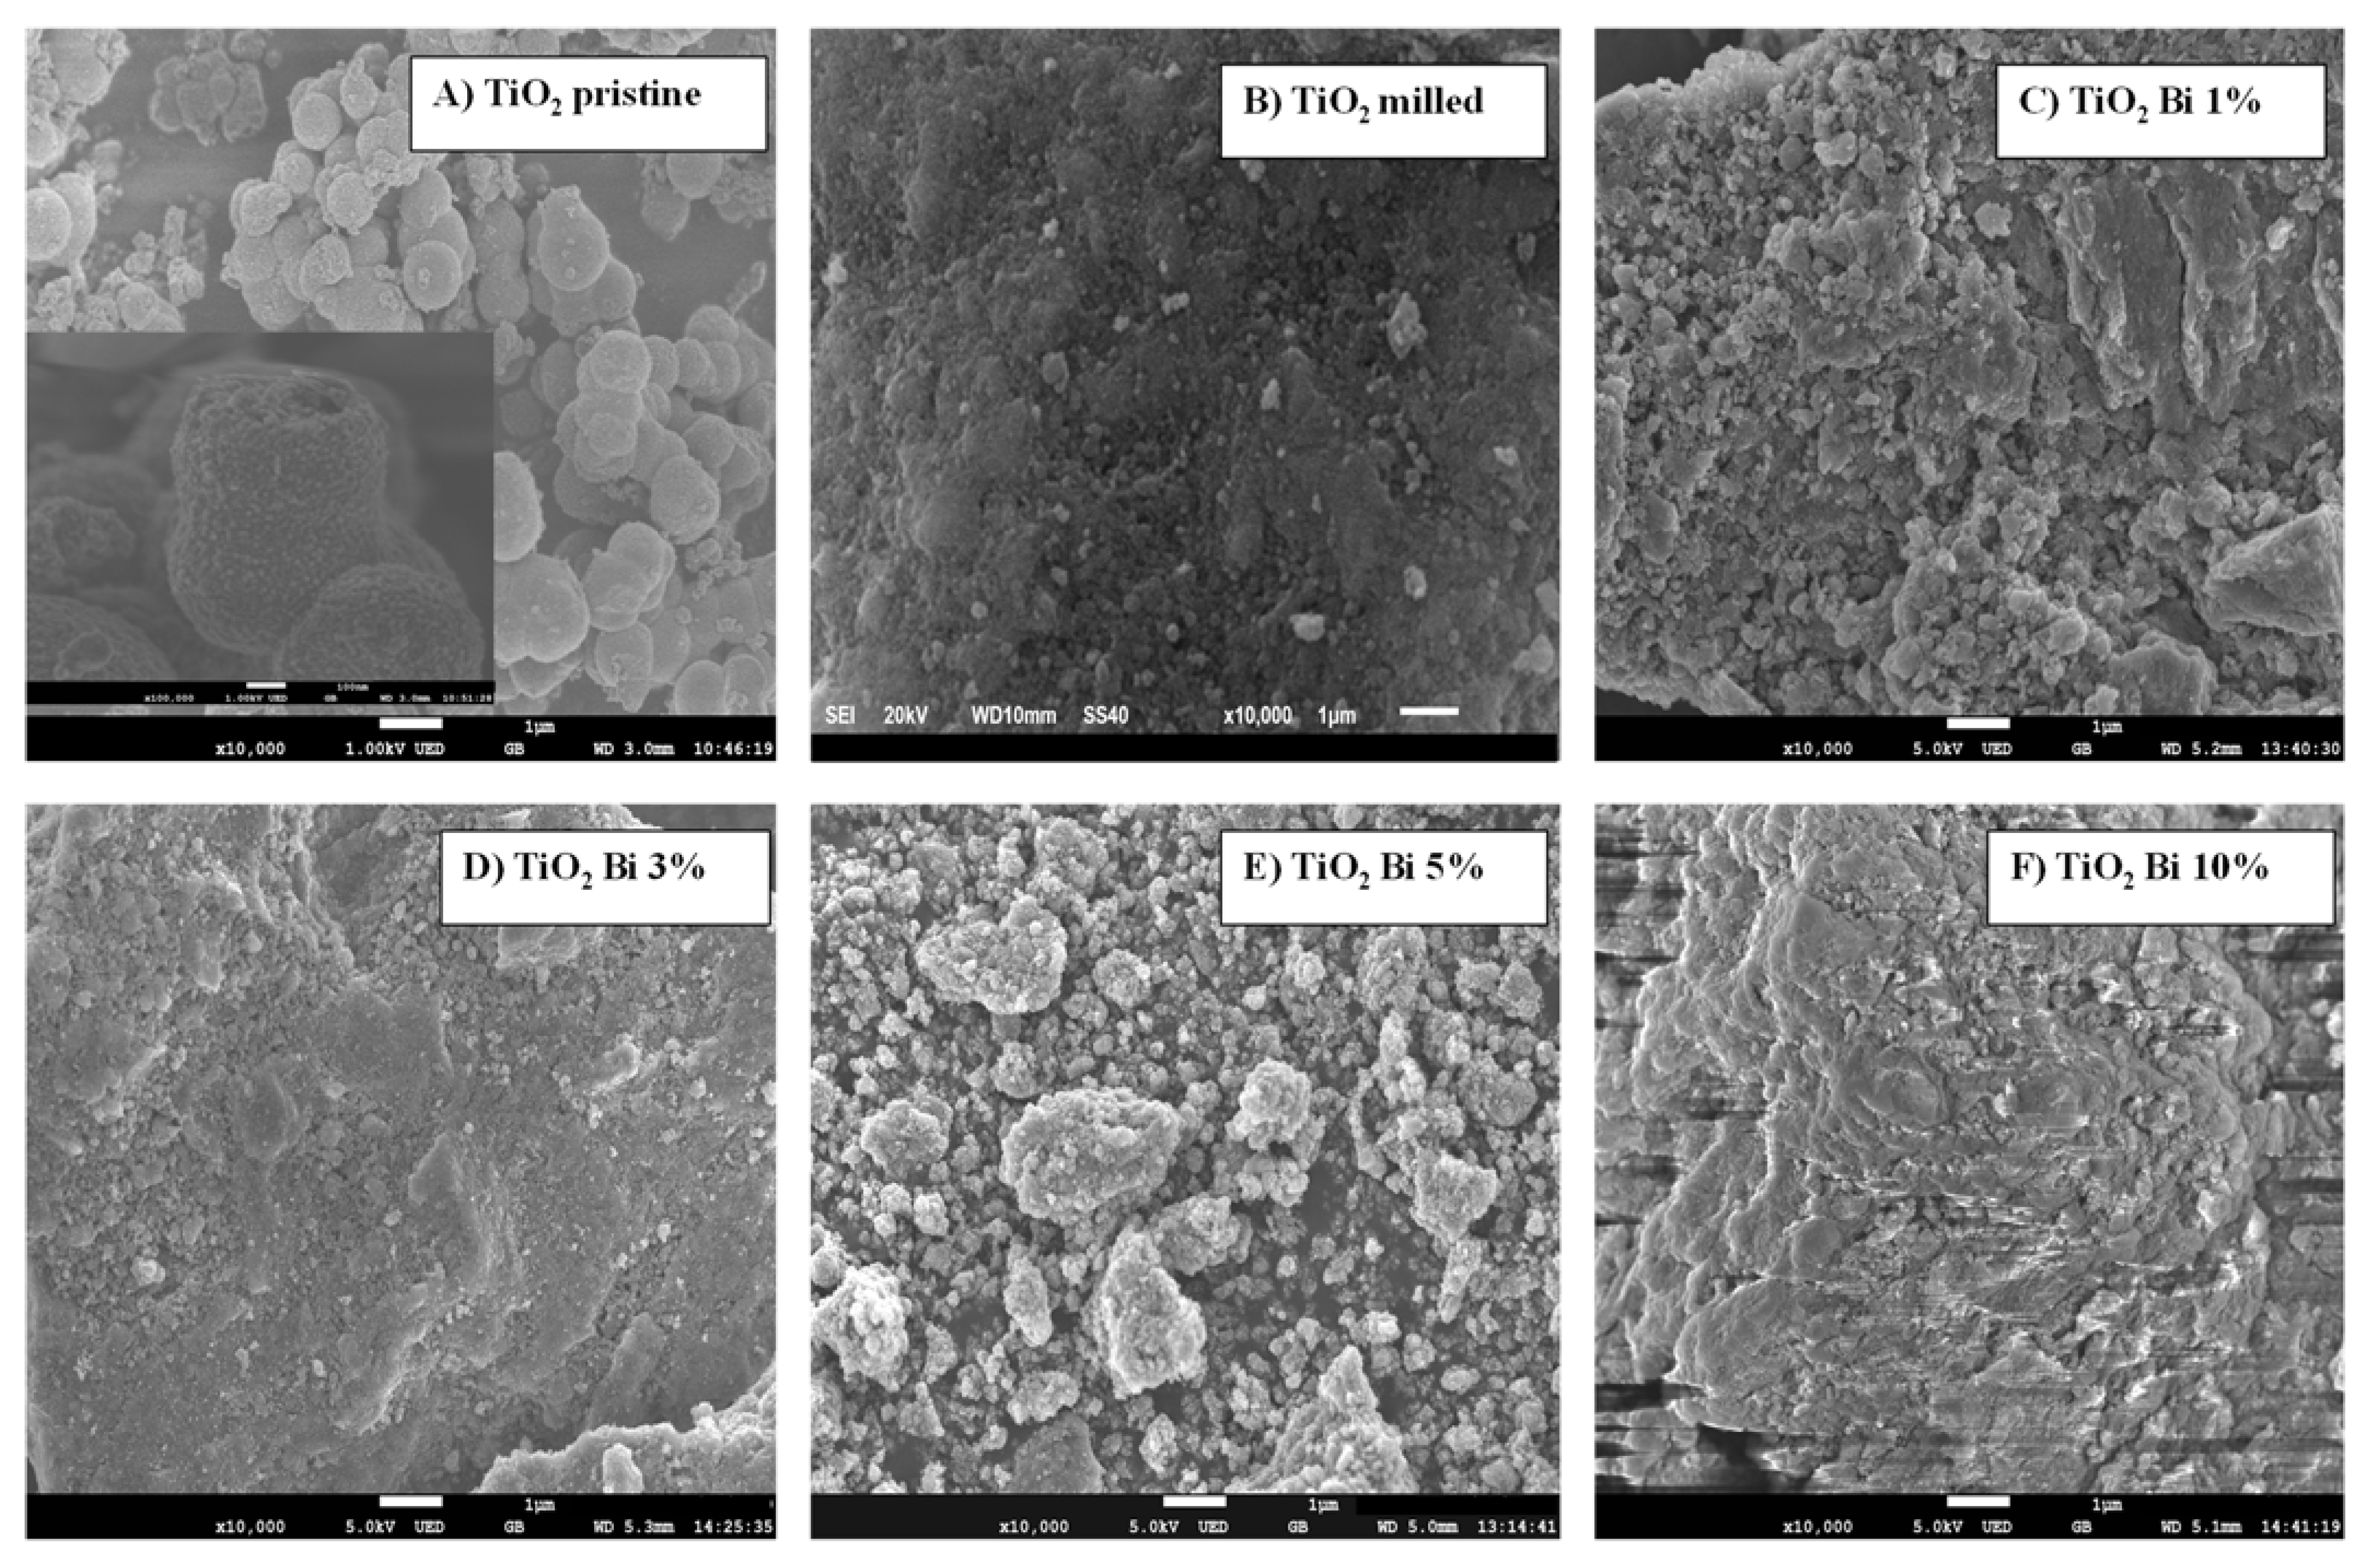
3.1. Synthesis and Characterization

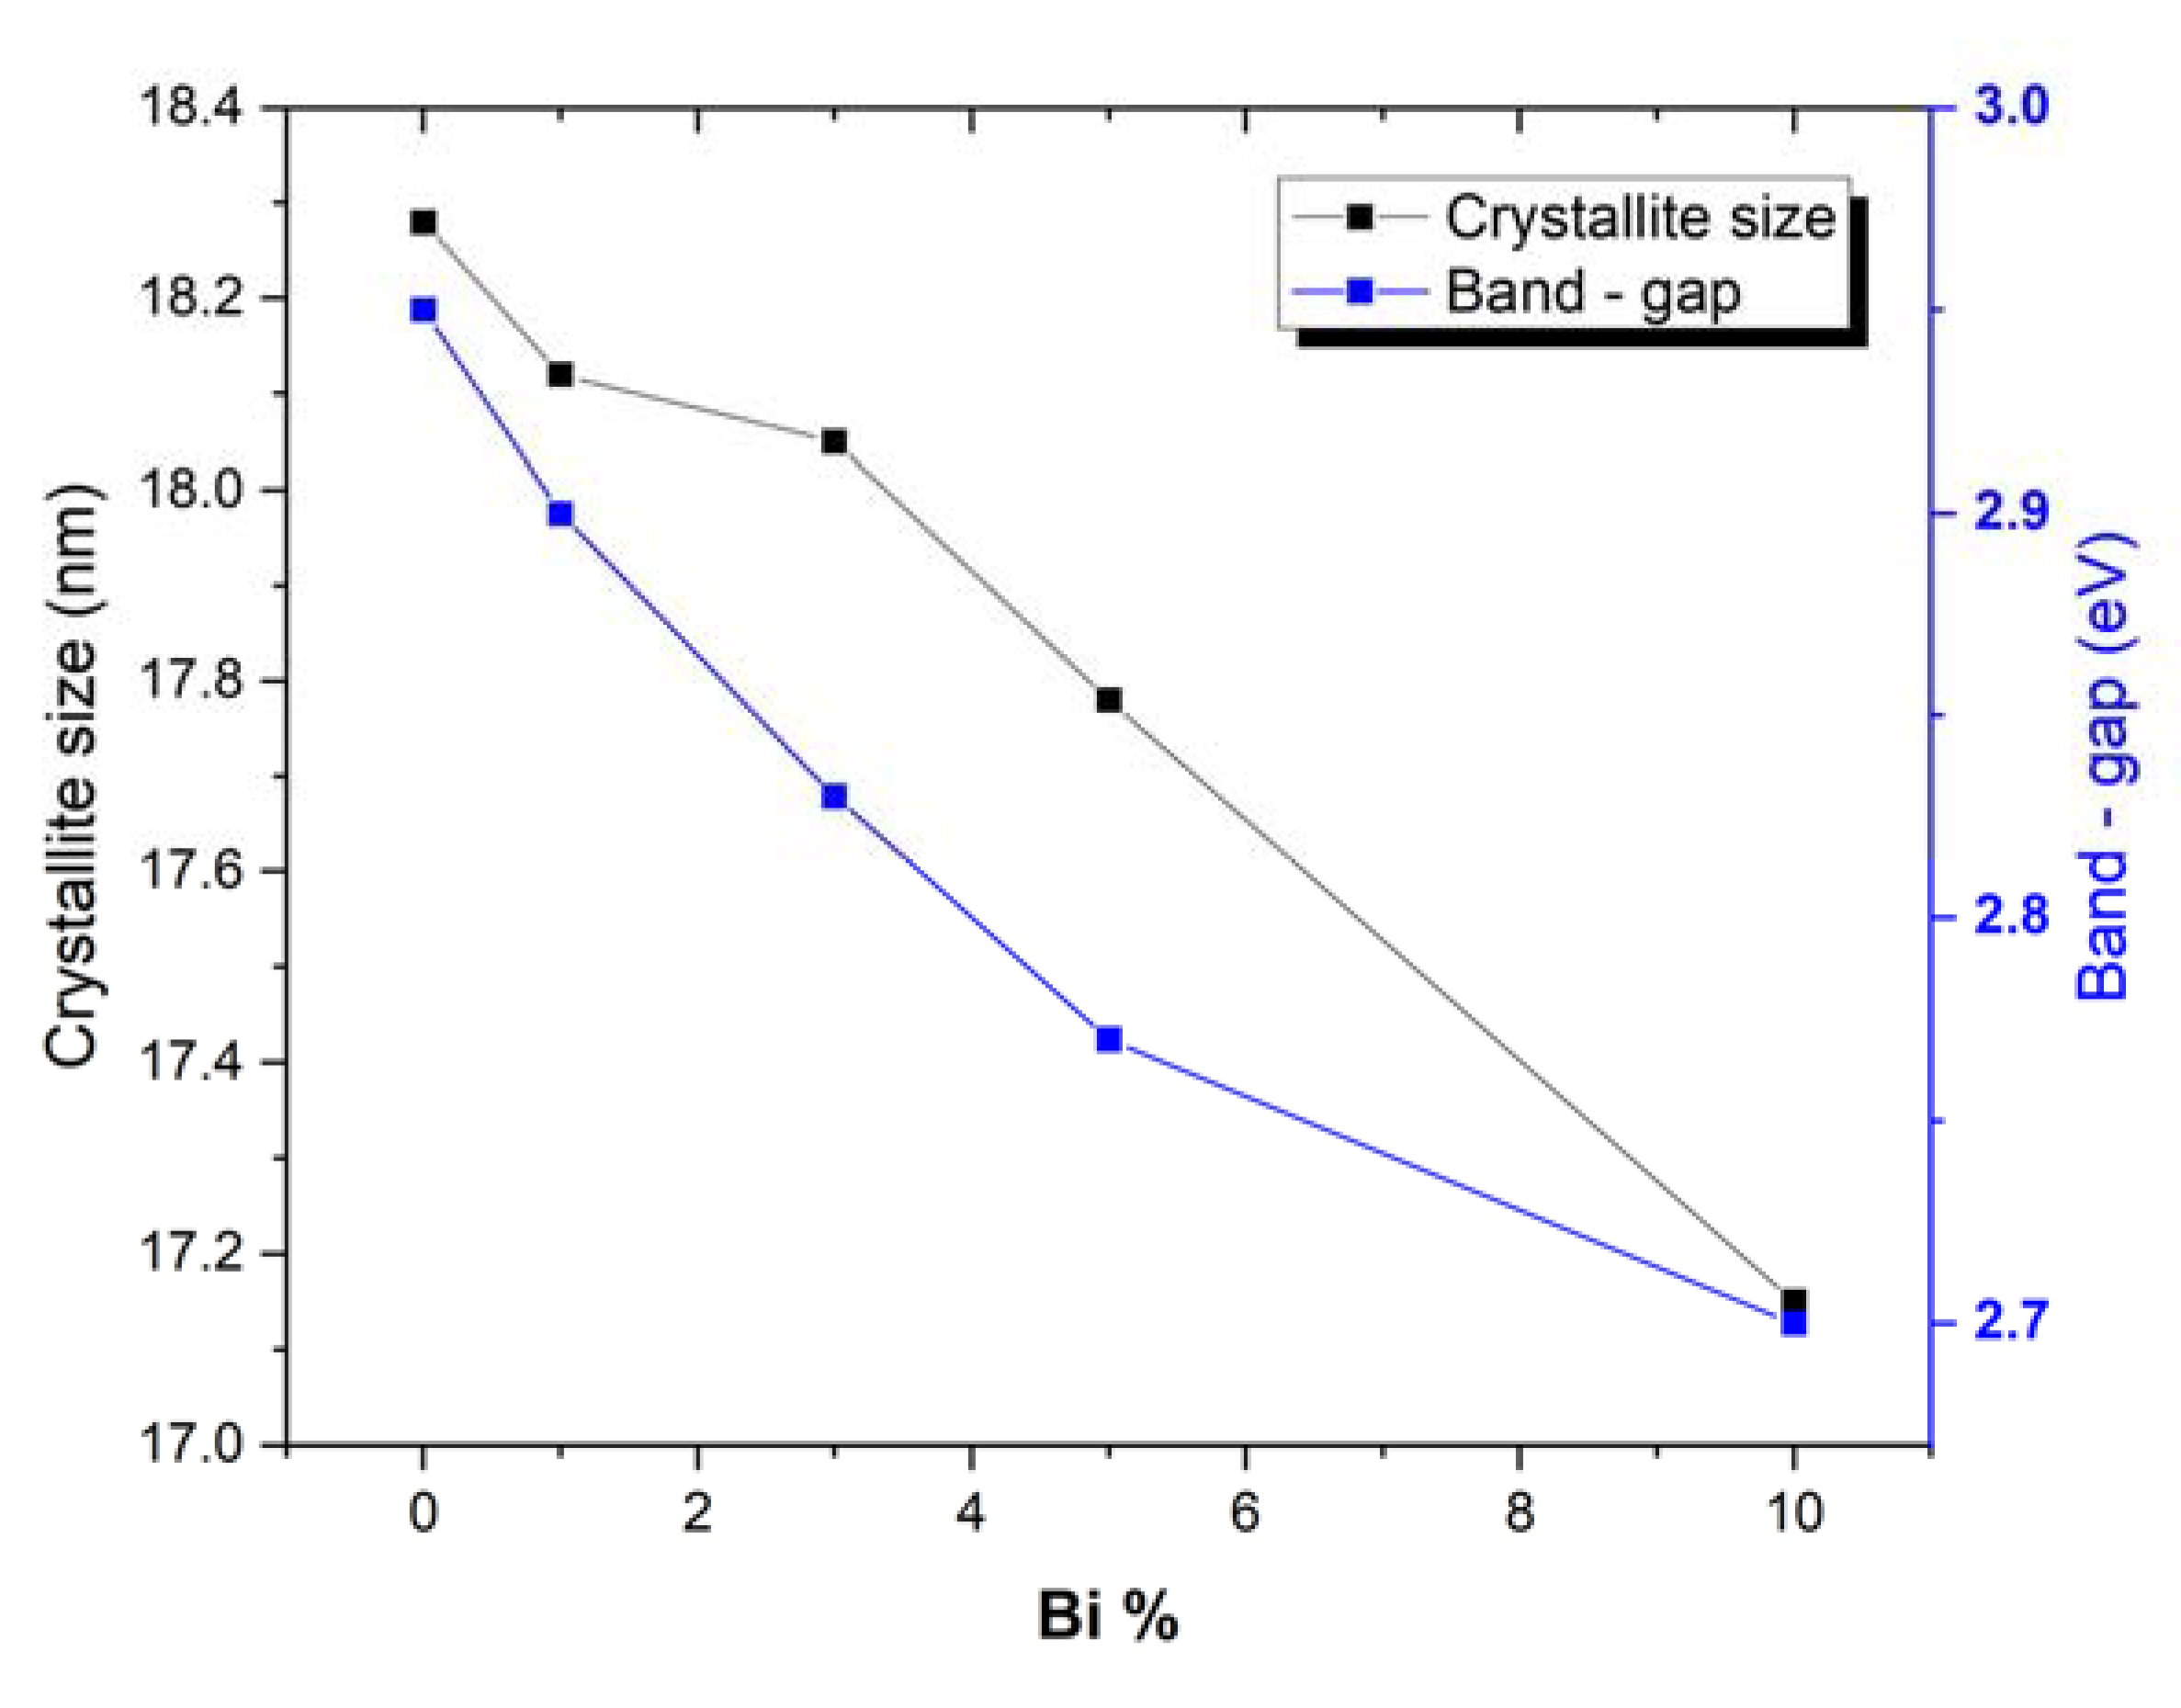
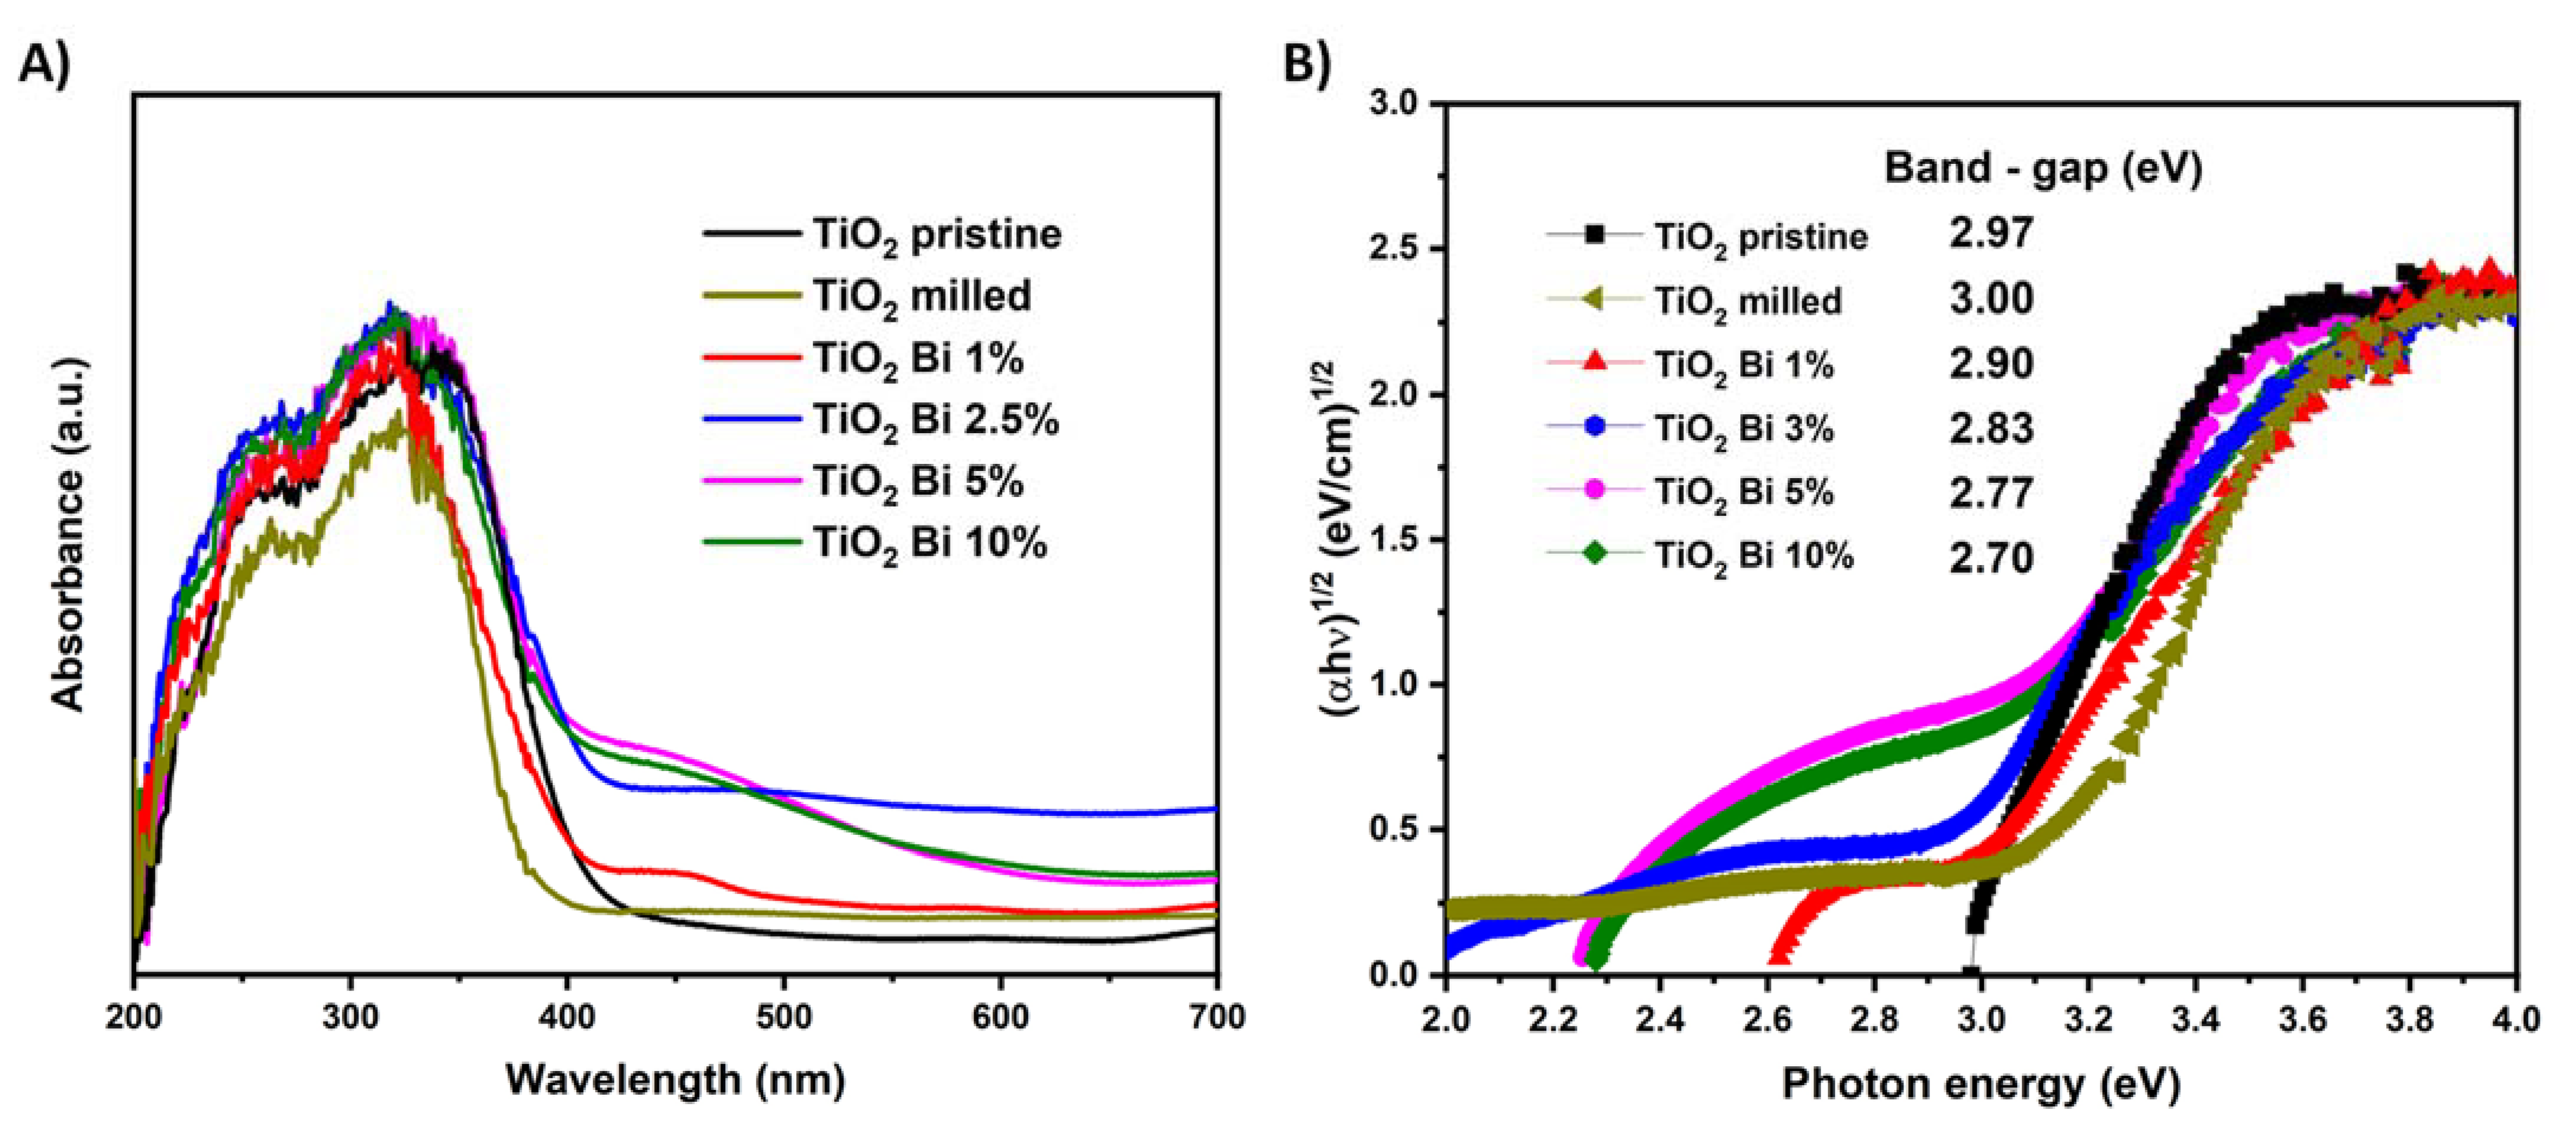
| Sample | Eg (eV) | Synthesis Method |
|---|---|---|
| TiO2 Bi 1% (This work) | 2.90 | Mechanosynthesis |
| TiO2 Bi 3% (This work) | 2.83 | Mechanosynthesis |
| TiO2 Bi 5% (This work) | 2.77 | Mechanosynthesis |
| TiO2 Bi 10% (This work) | 2.70 | Mechanosynthesis |
| Bi-doped TiO2: 0.6–1.7% [23] | 3.16–2.97 | Hydrothermal |
| Bi/Ti: 0.25–1 [42] | 3.04–2.90 | Sol gel/supercritical drying |
| Bi-doped TiO2: 0.25–5% [47] | 3.19–2.97 | Sol gel/Ultrasound assisted |
| Bi-doped TiO2: 0–10% [48] | 3.08–2.80 | Sol gel/assisted with propylene oxide |
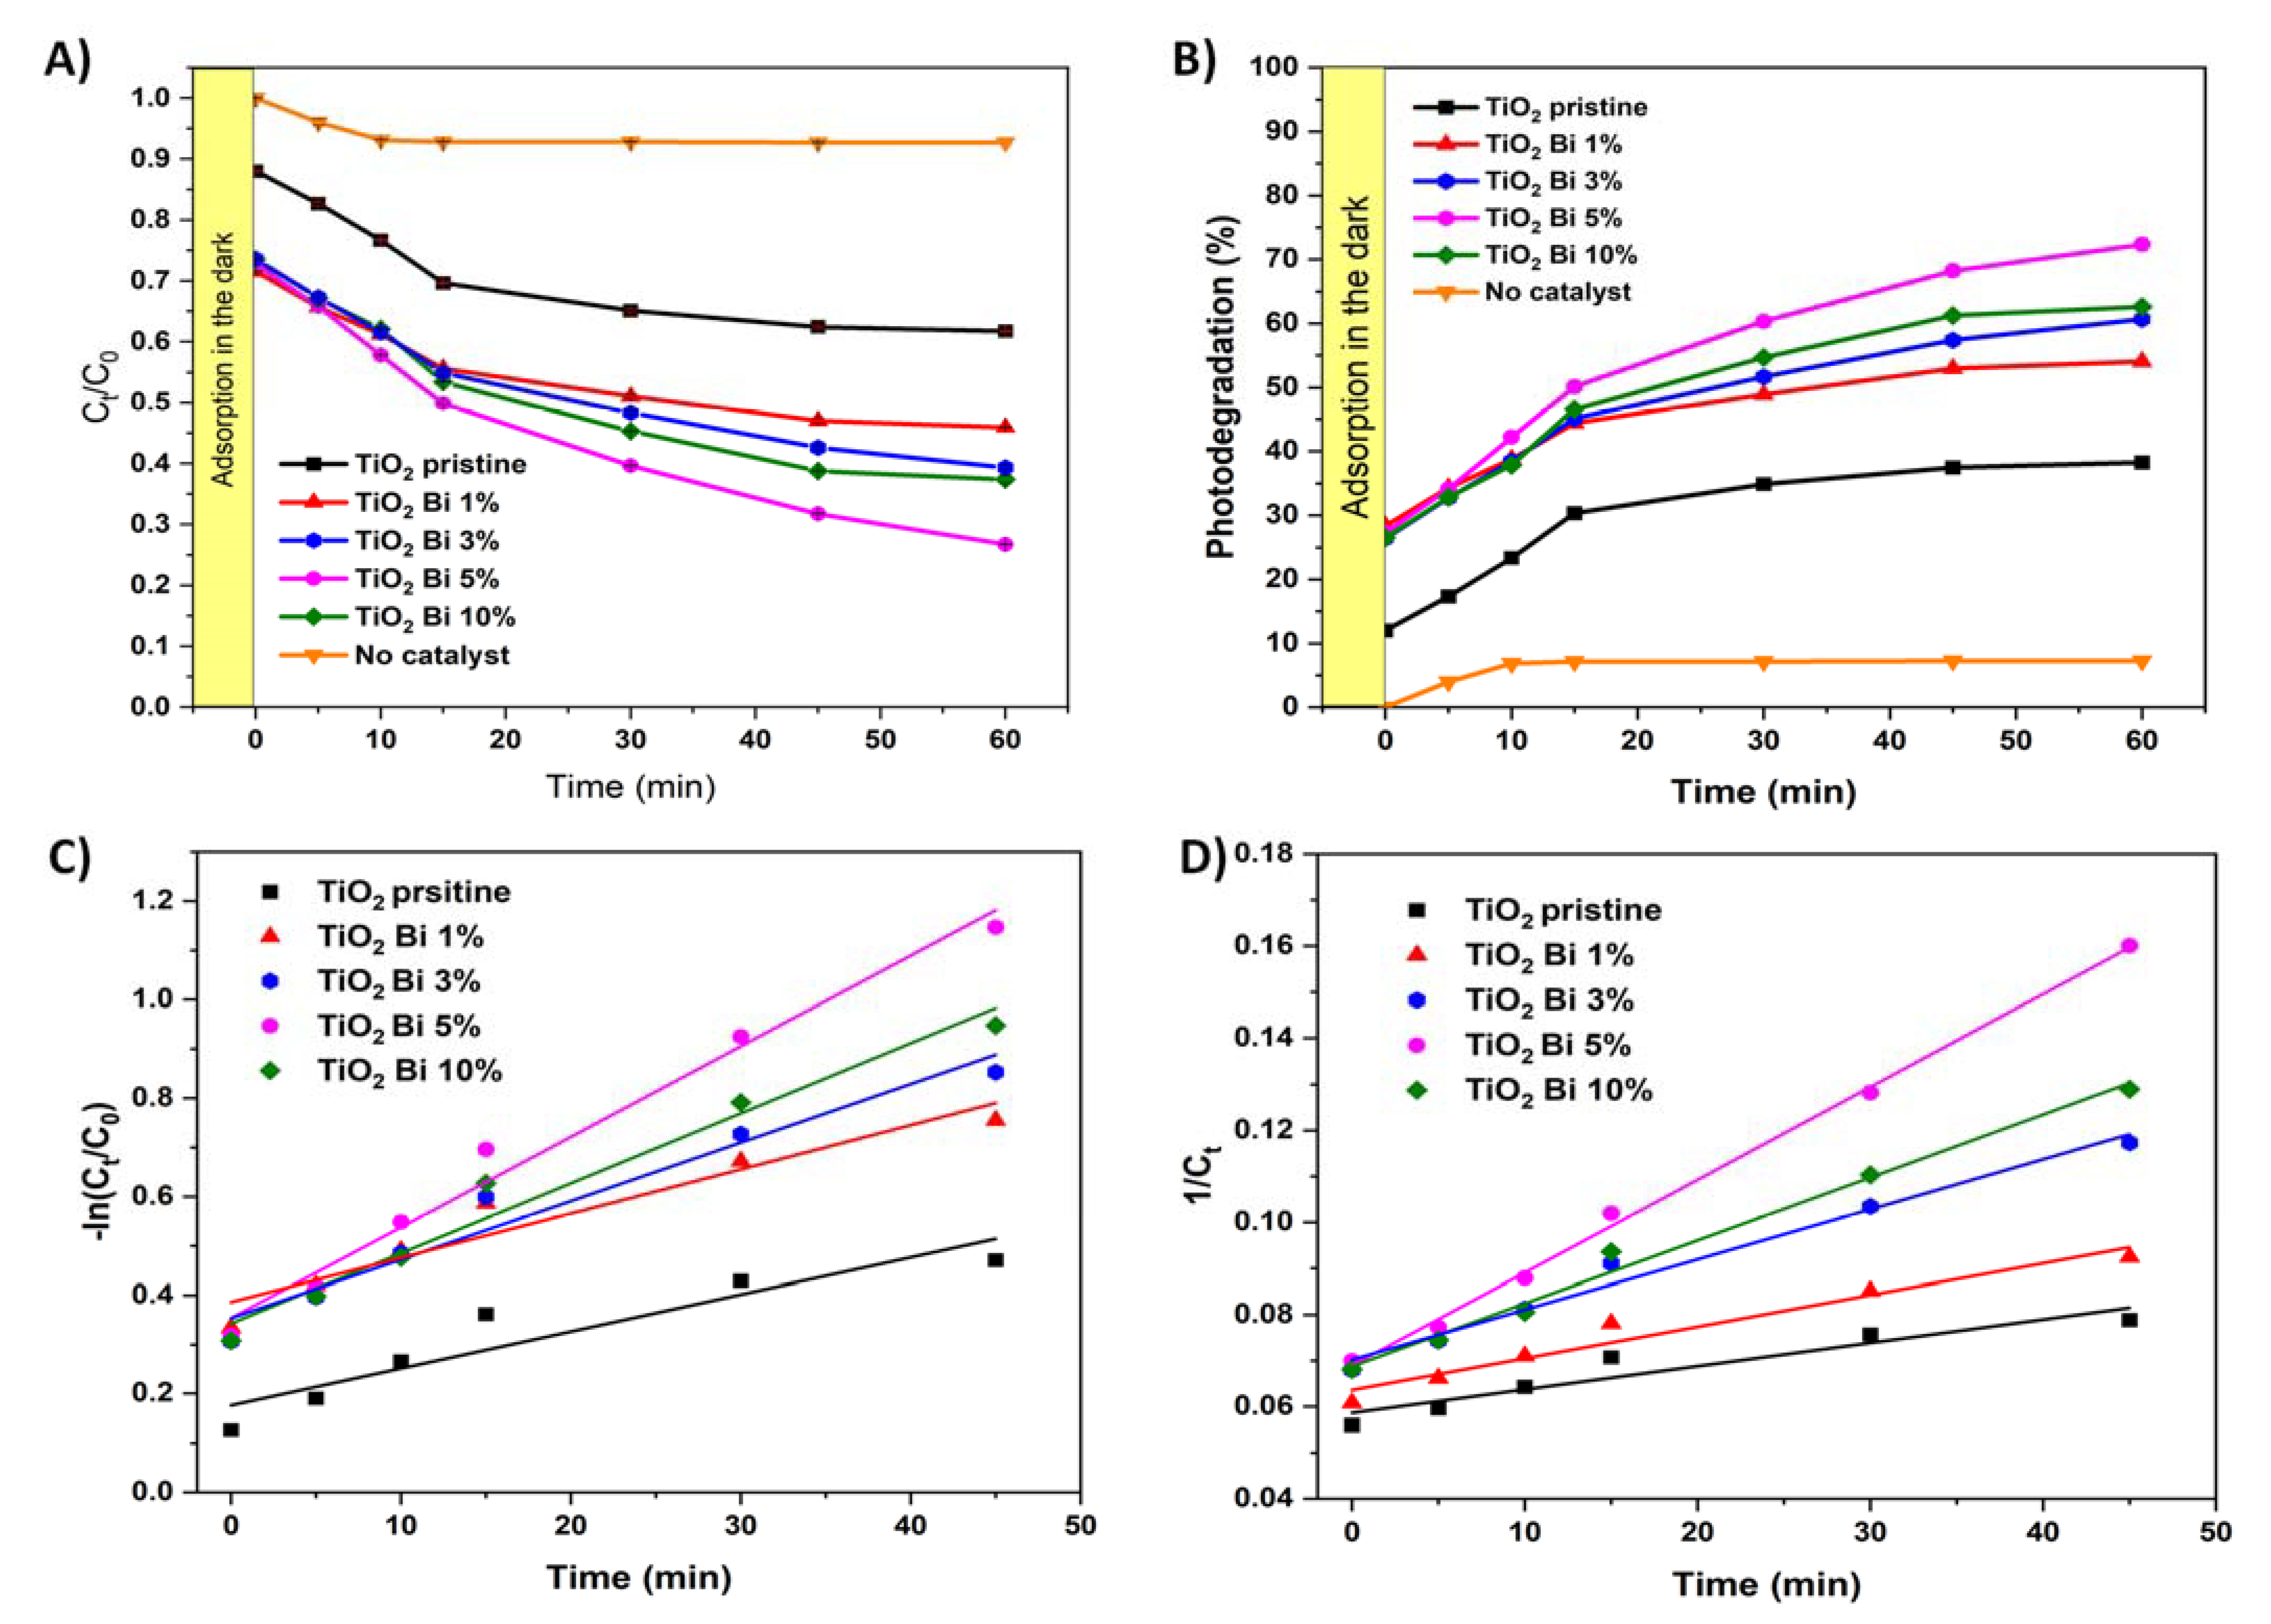
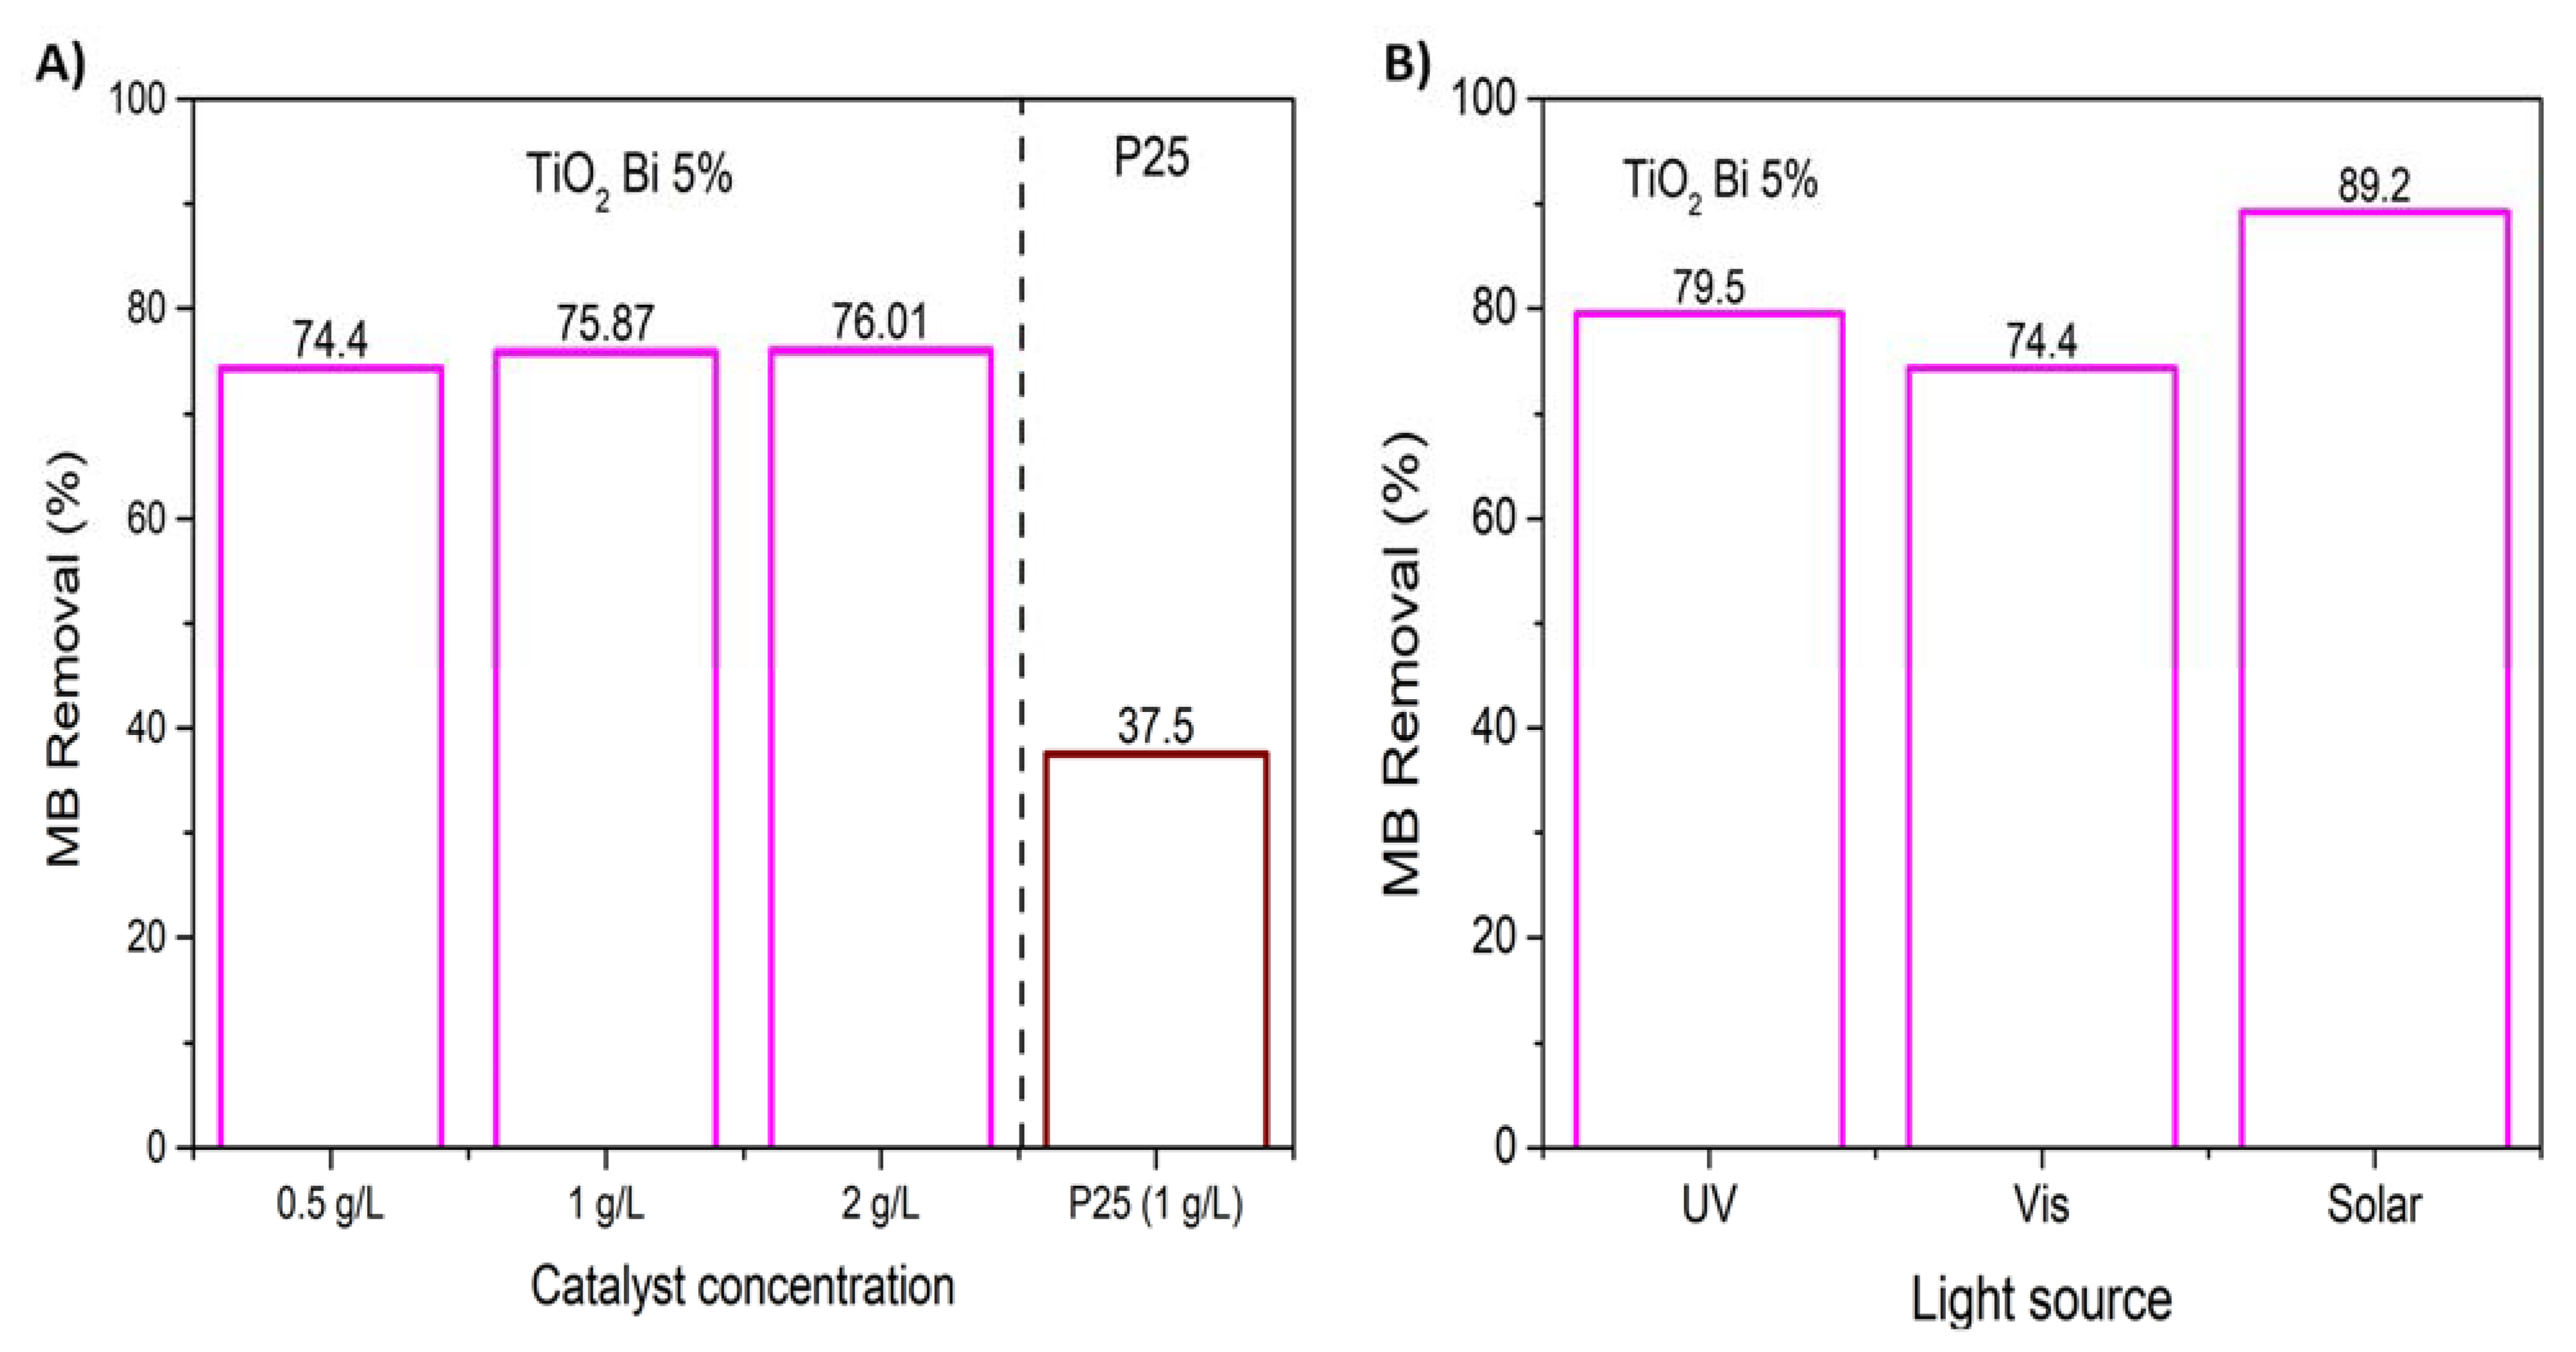
3.2. Photocatalytic Activity
4. Conclusions
Author Contributions
Funding
Data Availability Statement
Acknowledgments
Conflicts of Interest
References
- Narayan, M.R. Review: Dye sensitized solar cells based on natural photosensitizers. Renew. Sustain. Energy Rev. 2012, 16, 208–215. [Google Scholar] [CrossRef]
- Bilgin Simsek, E. Solvothermal synthesized boron doped TiO2 catalysts: Photocatalytic degradation of endocrine disrupting compounds and pharmaceuticals under visible light irradiation. Appl. Catal. B Environ. 2017, 200, 309–322. [Google Scholar] [CrossRef]
- Kumaravel, V.; Mathew, S.; Bartlett, J.; Pillai, S.C. Environmental Photocatalytic hydrogen production using metal doped TiO2: A review of recent advances. Appl. Catal. B Environ. 2019, 244, 1021–1064. [Google Scholar] [CrossRef]
- Yang, Z.; Choi, D.; Kerisit, S.; Rosso, K.M.; Wang, D.; Zhang, J.; Graff, G.; Liu, J. Nanostructures and lithium electrochemical reactivity of lithium titanites and titanium oxides: A review. J. Power Sources 2009, 192, 588–598. [Google Scholar] [CrossRef]
- Coronado, J.M.; Hernández-Alonso, M.D. The Keys of Success: TiO2 as a Benchmark Photocatalyst. In Design of Advanced Photocatalytic Materials for Energy and Environmental Applications; Coronado, J.M., Fresno, F., Hernández-alonso, M.D., Portela, R., Eds.; Springer: London, UK, 2013; pp. 85–101. ISBN 1865-3537. [Google Scholar]
- Ajmal, A.; Majeed, I.; Malik, R.N.; Idriss, H.; Nadeem, M.A. Principles and mechanisms of photocatalytic dye degradation on TiO2 based photocatalysts: A comparative overview. RSC Adv. 2014, 4, 37003–37026. [Google Scholar] [CrossRef]
- Bian, Y.; Zheng, G.; Ding, W.; Hu, L.; Sheng, Z. Magnetic field effect on the photocatalytic degradation of methyl orange by commercial TiO2 powder. RSC Adv. 2021, 11, 6284–6291. [Google Scholar] [CrossRef] [PubMed]
- De Araujo Scharnberg, A.R.; Carvalho de Loreto, A.; Bender Wermuth, T.; Kopp Alves, A.; Arcaro, S.; Mantey dos Santos, P.A.; Lawisch Rodriguez, A.A. Porous ceramic supported TiO2 nanoparticles: Enhanced photocatalytic activity for Rhodamine B degradation. Bol. Soc. Esp. Ceram. Vidr. 2020, 59, 230–238. [Google Scholar] [CrossRef]
- Miao, J.; Zhang, R.; Zhang, L. Photocatalytic degradations of three dyes with different chemical structures using ball-milled TiO2. Mater. Res. Bull. 2018, 97, 109–114. [Google Scholar] [CrossRef]
- Prabhudesai, V.S.; Meshram, A.A.; Vinu, R.; Sontakke, S.M. Superior photocatalytic removal of metamitron and its mixture with Rhodamine B dye using combustion synthesized TiO2 nanomaterial. Chem. Eng. J. Adv. 2021, 5, 100084. [Google Scholar] [CrossRef]
- Zhang, G.; Zhang, S.; Wang, L.; Liu, R.; Zeng, Y.; Xia, X.; Liu, Y.; Luo, S. Facile synthesis of bird’s nest-like TiO2 microstructure with exposed (001) facets for photocatalytic degradation of methylene blue. Appl. Surf. Sci. 2017, 391, 228–235. [Google Scholar] [CrossRef]
- Bagheri, S.; Termehyousefi, A.; Do, T.O. Photocatalytic pathway toward degradation of environmental pharmaceutical pollutants: Structure, kinetics and mechanism approach. Catal. Sci. Technol. 2017, 7, 4548–4569. [Google Scholar] [CrossRef]
- Lin, C.-J.; Yang, W.-T. Ordered mesostructured Cu-doped TiO2 spheres as active visible-light-driven photocatalysts for degradation of paracetamol. Chem. Eng. J. 2013, 237, 131–137. [Google Scholar] [CrossRef]
- Meroni, D.; Jiménez-Salcedo, M.; Falletta, E.; Bresolin, B.M.; Kait, C.F.; Boffito, D.C.; Bianchi, C.L.; Pirola, C. Sonophotocatalytic degradation of sodium diclofenac using low power ultrasound and micro sized TiO2. Ultrason. Sonochem. 2020, 67, 105123. [Google Scholar] [CrossRef] [PubMed]
- Wang, P.; Zhou, T.; Wang, R.; Lim, T.-T. Carbon-sensitized and nitrogen-doped TiO2 for photocatalytic degradation of sulfanilamide under visible-light irradiation. Water Res. 2011, 45, 5015–5026. [Google Scholar] [CrossRef] [PubMed]
- Aznar-Cervantes, S.; Aliste, M.; Garrido, I.; Yañez-Gascón, M.J.; Vela, N.; Cenis, J.L.; Navarro, S.; Fenoll, J. Electrospun silk fibroin/TiO2 mats. Preparation, characterization and efficiency for the photocatalytic solar treatment of pesticide polluted water. RSC Adv. 2020, 10, 1917–1924. [Google Scholar] [CrossRef] [PubMed] [Green Version]
- Ilina, S.M.; Ollivier, P.; Slomberg, D.; Baran, N.; Pariat, A.; Devau, N.; Sani-Kast, N.; Scheringer, M.; Labille, J. Investigations into titanium dioxide nanoparticle and pesticide interactions in aqueous environments. Environ. Sci. Nano 2017, 4, 2055–2065. [Google Scholar] [CrossRef]
- Mirmasoomi, S.R.; Ghazi, M.M.; Galedari, M. Photocatalytic degradation of diazinon under visible light using TiO2/Fe2O3 nanocomposite synthesized by ultrasonic-assisted impregnation method. Sep. Purif. Technol. 2016, 175, 418–427. [Google Scholar] [CrossRef]
- Le, T.T.T.; Tran, D.T.; Danh, T.H. Remarkable enhancement of visible light driven photocatalytic performance of TiO2 by simultaneously doping with C, N, and S. Chem. Phys. 2021, 545, 111144. [Google Scholar] [CrossRef]
- Lin, C.J.; Liou, Y.H.; Zhang, Y.; Chen, C.L.; Dong, C.L.; Chen, S.Y.; Stucky, G.D. Mesoporous Fe-doped TiO2 sub-microspheres with enhanced photocatalytic activity under visible light illumination. Appl. Catal. B Environ. 2012, 127, 175–181. [Google Scholar] [CrossRef]
- Sun, Z.; Pichugin, V.F.; Evdokimov, K.E.; Konishchev, M.E.; Syrtanov, M.S.; Kudiiarov, V.N.; Li, K.; Tverdokhlebov, S.I. Effect of nitrogen-doping and post annealing on wettability and band gap energy of TiO2 thin film. Appl. Surf. Sci. 2020, 500, 144048. [Google Scholar] [CrossRef]
- Zhou, M.; Yu, J.; Cheng, B. Effects of Fe-doping on the photocatalytic activity of mesoporous TiO2 powders prepared by an ultrasonic method. J. Hazard. Mater. 2006, 137, 1838–1847. [Google Scholar] [CrossRef] [PubMed]
- Wang, W.; Zhu, D.; Shen, Z.; Peng, J.; Luo, J.; Liu, X. One-Pot hydrothermal route to synthesize the Bi-doped anatase TiO2 hollow thin sheets with prior facet exposed for enhanced visible-light-driven photocatalytic activity. Ind. Eng. Chem. Res. 2016, 55, 6373–6383. [Google Scholar] [CrossRef]
- Xu, J.; Chen, M.; Fu, D. Study on highly visible light active Bi-doped TiO2 composite hollow sphere. Appl. Surf. Sci. 2011, 257, 7381–7386. [Google Scholar] [CrossRef]
- Baláž, P. Mechanochemistry in Nanoscience and Minerals Enginnering, 1st ed.; Springer: Berlin/Heidelberg, Germany, 2008; ISBN 978-3-540-74855-7. [Google Scholar]
- Estrada-Flores, S.; Martínez-Luévanos, A.; Perez-Berumen, C.M.; García-Cerda, L.A.; Flores-Guia, T.E. Relationship between morphology, porosity, and the photocatalytic activity of TiO2 obtained by sol–gel method assisted with ionic and nonionic surfactants. Bol. Soc. Esp. Ceram. Vidr. 2020, 59, 209–218. [Google Scholar] [CrossRef]
- Primet, M.; Pichat, P.; Mathieu, M.-V. Infrared study of the surface of titanium dioxides. J. Phys. Chem. 1971, 75, 1216–1220. [Google Scholar] [CrossRef]
- Li, J.-J.; Cai, S.-C.; Xu, Z.; Chen, X.; Chen, J.; Jia, H.-P.; Chen, J. Solvothermal syntheses of Bi and Zn co-doped TiO2 with enhanced electron-hole separation and efficient photodegradation of gaseous toluene under visible-light. J. Hazard. Mater. 2017, 325, 261–270. [Google Scholar] [CrossRef]
- Li, H.; Wang, D.; Wang, P.; Fan, H.; Xie, T. Synthesis and studies of the visible-light photocatalytic properties of near-monodisperse Bi-doped TiO2 nanospheres. Chem. A Eur. J. 2009, 15, 12521–12527. [Google Scholar] [CrossRef]
- Wu, Y.; Lu, G.; Li, S. The Doping Effect of Bi on TiO2 for Photocatalytic Hydrogen Generation and Photodecolorization of Rhodamine B. J. Phys. Chem. C 2009, 113, 9950–9955. [Google Scholar] [CrossRef]
- An’amt, M.N.; Radiman, S.; Huang, N.M.; Yarmo, M.A.; Ariyanto, N.P.; Lim, H.N.; Muhamad, M.R. Sol-gel hydrothermal synthesis of bismuth-TiO2 nanocubes for dye-sensitized solar cell. Ceram. Int. 2010, 36, 2215–2220. [Google Scholar] [CrossRef]
- Hao, W.; Teng, F.; Liu, Z.; Yang, Z.; Liu, Z.; Gu, W. Synergistic effect of Mott-Schottky junction with oxygen defect and dramatically improved charge transfer and separation of Bi@Bi-doped TiO2. Sol. Energy Mater. Sol. Cells 2019, 203, 110198. [Google Scholar] [CrossRef]
- Ma, J.; Chu, J.; Qiang, L.; Xue, J. Synthesis and structural characterization of novel visible photocatalyst Bi-TiO2/SBA-15 and its photocatalytic performance. RSC Adv. 2012, 2, 3753–3758. [Google Scholar] [CrossRef]
- Li, H.; Liu, J.; Qian, J.; Li, Q.; Yang, J. Preparation of Bi-doped TiO2 nanoparticles and their visible light photocatalytic performance. Chin. J. Catal. 2014, 35, 1578–1589. [Google Scholar] [CrossRef]
- Henych, J.; Štengl, V.; Kormunda, M.; Mattsson, A.; Österlund, L. Role of bismuth in nano-structured doped TiO2 photocatalyst prepared by environmentally benign soft synthesis. J. Mater. Sci. 2014, 49, 3560–3571. [Google Scholar] [CrossRef]
- Subramonian, W.; Wu, T.Y.; Chai, S. Using one-step facile and solvent-free mechanochemical process to synthesize photoactive Fe2O3 -TiO2 for treating industrial wastewater. J. Alloys Compd. 2017, 695, 496–507. [Google Scholar] [CrossRef] [Green Version]
- Garza-Arévalo, J.I.; García-Montes, I.; Hinojosa-Reyes, M.; Guzmán-Mar, J.L.; Rodríguez-González, V.; Hinojosa-Reyes, L. Fe doped TiO2 photocatalyst for the removal of As(III) under visible radiation and its potential application on the treatment of As-contaminated groundwater. Mater. Res. Bull. 2016, 73, 145–152. [Google Scholar] [CrossRef]
- Štengl, V.; Grygar, T.M.; Henych, J.; Kormunda, M. Hydrogen peroxide route to Sn-doped titania photocatalysts. Chem. Cent. J. 2012, 6, 113. [Google Scholar] [CrossRef] [Green Version]
- Cassaignon, S.; Koelsch, M.; Jolivet, J.P. Selective synthesis of brookite, anatase and rutile nanoparticles: Thermolysis of TiCl4 in aqueous nitric acid. J. Mater. Sci. 2007, 42, 6689–6695. [Google Scholar] [CrossRef]
- Delekar, S.D.; Yadav, H.M.; Achary, S.N.; Meena, S.S.; Pawar, S.H. Structural refinement and photocatalytic activity of Fe-doped anatase TiO2 nanoparticles. Appl. Surf. Sci. 2012, 263, 536–545. [Google Scholar] [CrossRef]
- Zhang, L.; Ma, F.; Guan, Q.; Wang, C.; Bai, C.; Sheng, L. Fluorescence enhanced ultrathin nano-plate Gd2O2SO4:Bi3+, Eu3+ transformed from layered gadolinium hydroxide. J. Alloys Compd. 2019, 802, 173–180. [Google Scholar] [CrossRef]
- Ma, Y.; Yang, X.; Gao, G.; Yan, Z.; Su, H.; Zhang, B.; Lei, Y.; Zhang, Y. Photocatalytic partial oxidation of methanol to methyl formate under visible light irradiation on Bi-doped TiO2: Via tuning band structure and surface hydroxyls. RSC Adv. 2020, 10, 31442–31452. [Google Scholar] [CrossRef]
- Henderson, M.A. A surface science perspective on TiO2 photocatalysis. Surf. Sci. Rep. 2011, 66, 185–297. [Google Scholar] [CrossRef]
- Ali, T.; Ahmed, A.; Siddique, M.N.; Alam, U.; Muneer, M.; Tripathi, P. Influence of Mg2+ ion on the optical and magnetic properties of TiO2 nanostructures: A key role of oxygen vacancy. Optik 2020, 223, 165340. [Google Scholar] [CrossRef]
- Murcia-López, S.; Hidalgo, M.C.; Navío, J.A. Synthesis, characterization and photocatalytic activity of Bi-doped TiO2 photocatalysts under simulated solar irradiation. Appl. Catal. A Gen. 2011, 404, 59–67. [Google Scholar] [CrossRef]
- Zuo, F.; Wang, L.; Wu, T.; Zhang, Z.; Borchardt, D.; Feng, P. Self-doped Ti3+ enhanced photocatalyst for hydrogen production under visible light. J. Am. Chem. Soc. 2010, 132, 11856–11857. [Google Scholar] [CrossRef] [PubMed]
- Sood, S.; Mehta, S.K.; Umar, A.; Kansal, S.K. The visible light-driven photocatalytic degradation of Alizarin red S using Bi-doped TiO2 nanoparticles. New J. Chem. 2014, 38, 3127–3136. [Google Scholar] [CrossRef]
- Alzamly, A.; Hamed, F.; Ramachandran, T.; Bakiro, M.; Ahmed, S.H.; Mansour, S.; Salem, S.; Abdul al, K.; Al Kaabi, N.S.; Meetani, M.; et al. Tunable band gap of Bi3+—doped anatase TiO2 for enhanced photocatalytic removal of acetaminophen under UV-visible light irradiation. J. Water Reuse Desalin. 2019, 9, 31–46. [Google Scholar] [CrossRef] [Green Version]
- Ji, T.; Yang, F.; Lv, Y.; Zhou, J.; Sun, J. Synthesis and visible-light photocatalytic activity of Bi-doped TiO2 nanobelts. Mater. Lett. 2009, 63, 2044–2046. [Google Scholar] [CrossRef]
- Ellouzi, I.; Bouddouch, A.; Bakiz, B.; Benlhachemi, A.; Abou Oualid, H. Glucose-assisted ball milling preparation of silver-doped biphasic TiO2 for efficient photodegradation of Rhodamine B: Effect of silver-dopant loading. Chem. Phys. Lett. 2021, 770, 138456. [Google Scholar] [CrossRef]


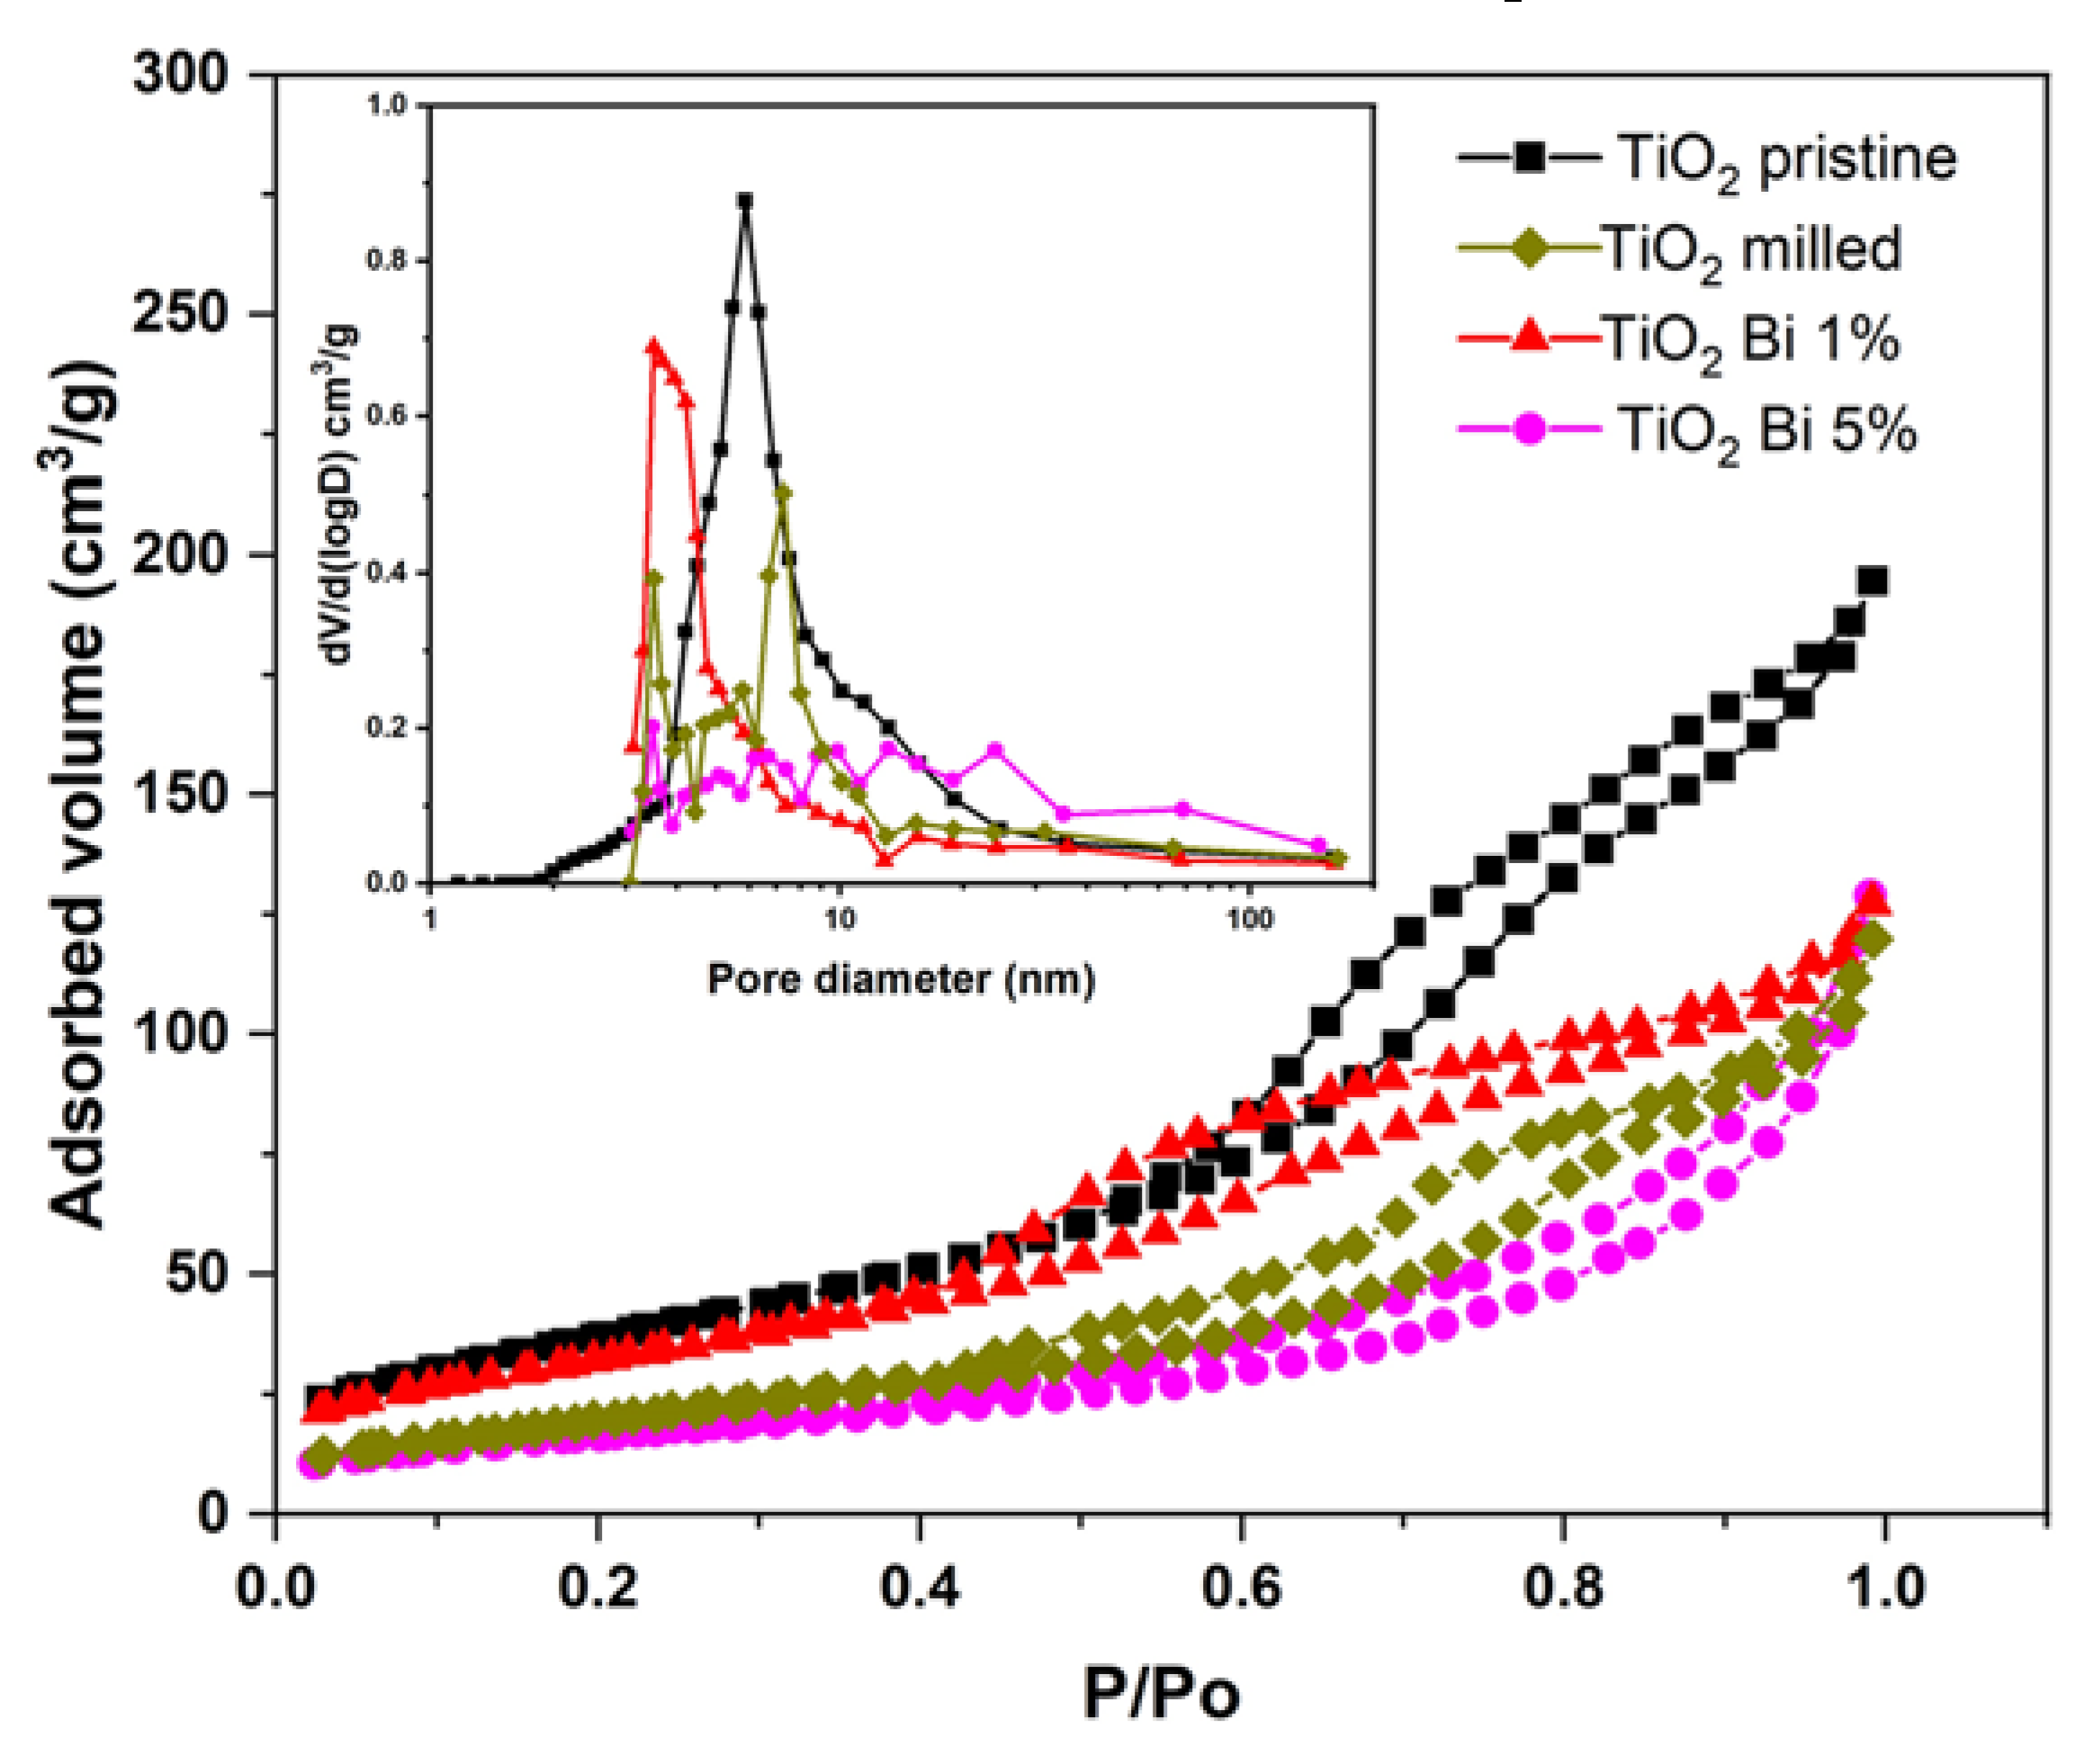


| Sample | SBET (m2/g) | Dp (nm) | Vp (cm3/g) |
|---|---|---|---|
| pristine TiO2 | 138.7 | 5.86 | 0.300 |
| milled TiO2 | 74.0 | 3.50 | 0.191 |
| TiO2 Bi 1% | 116.7 | 3.40 | 0.196 |
| TiO2 Bi 5% | 59.1 | 3.48 | 0.201 |
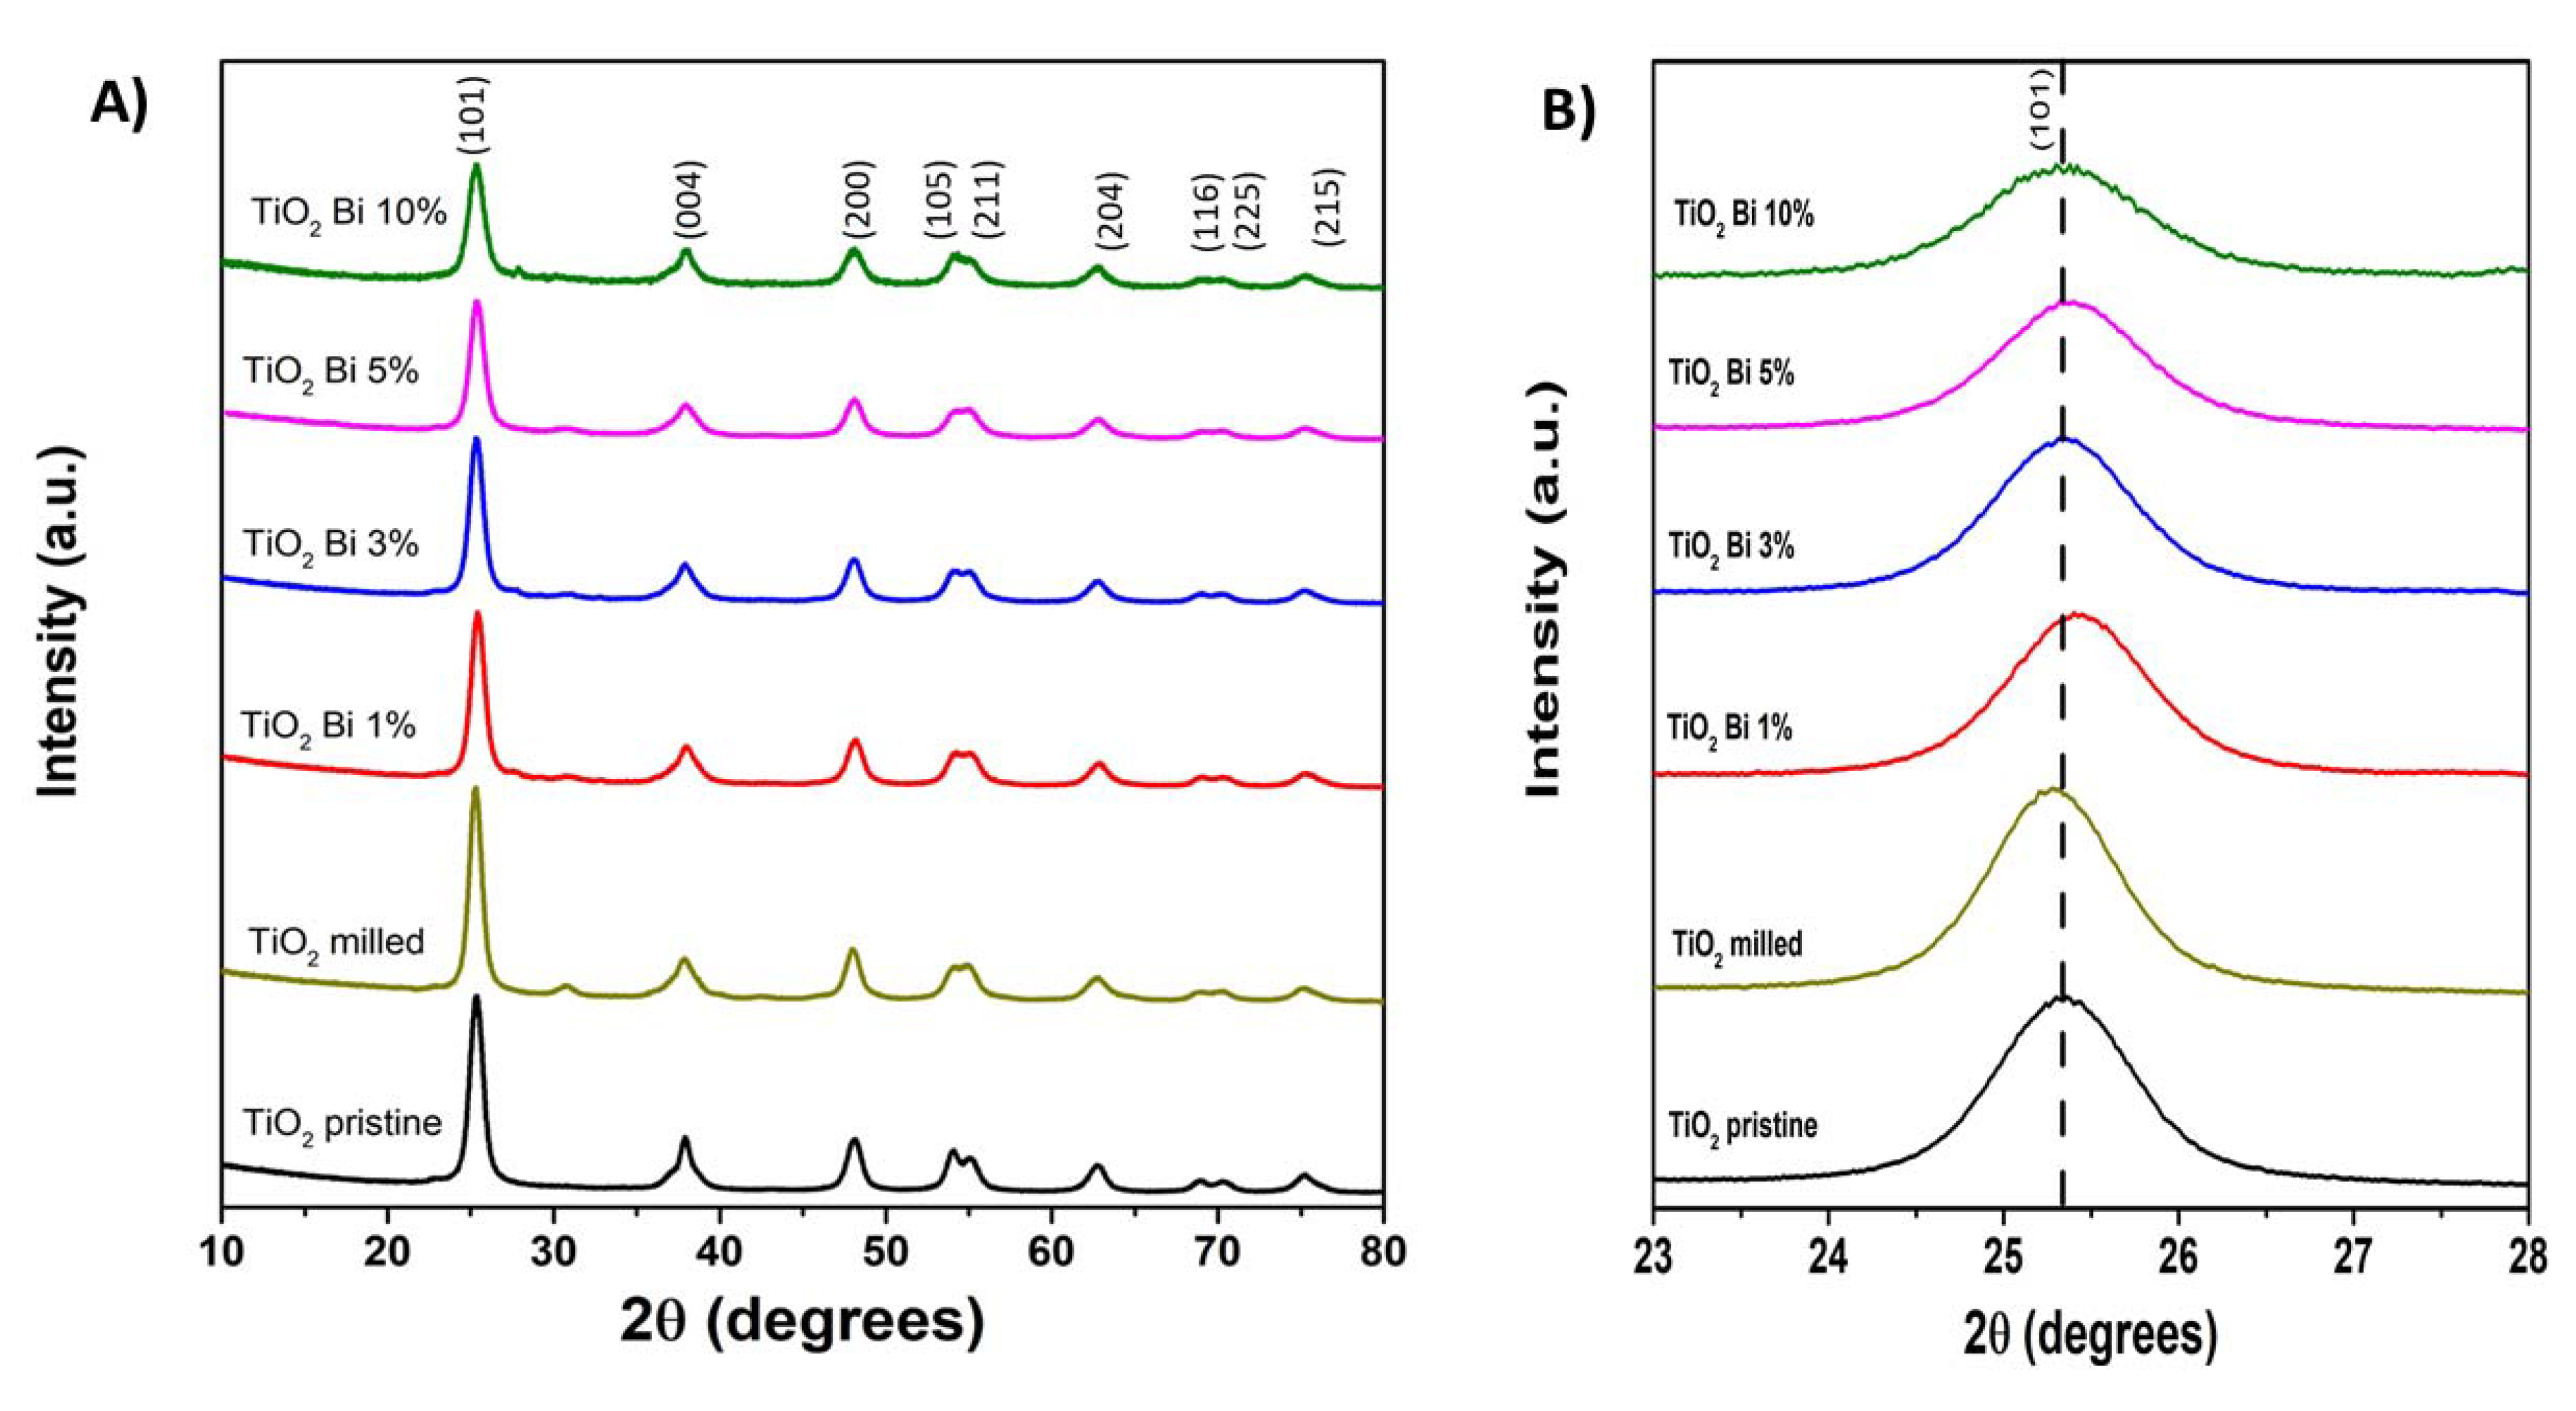
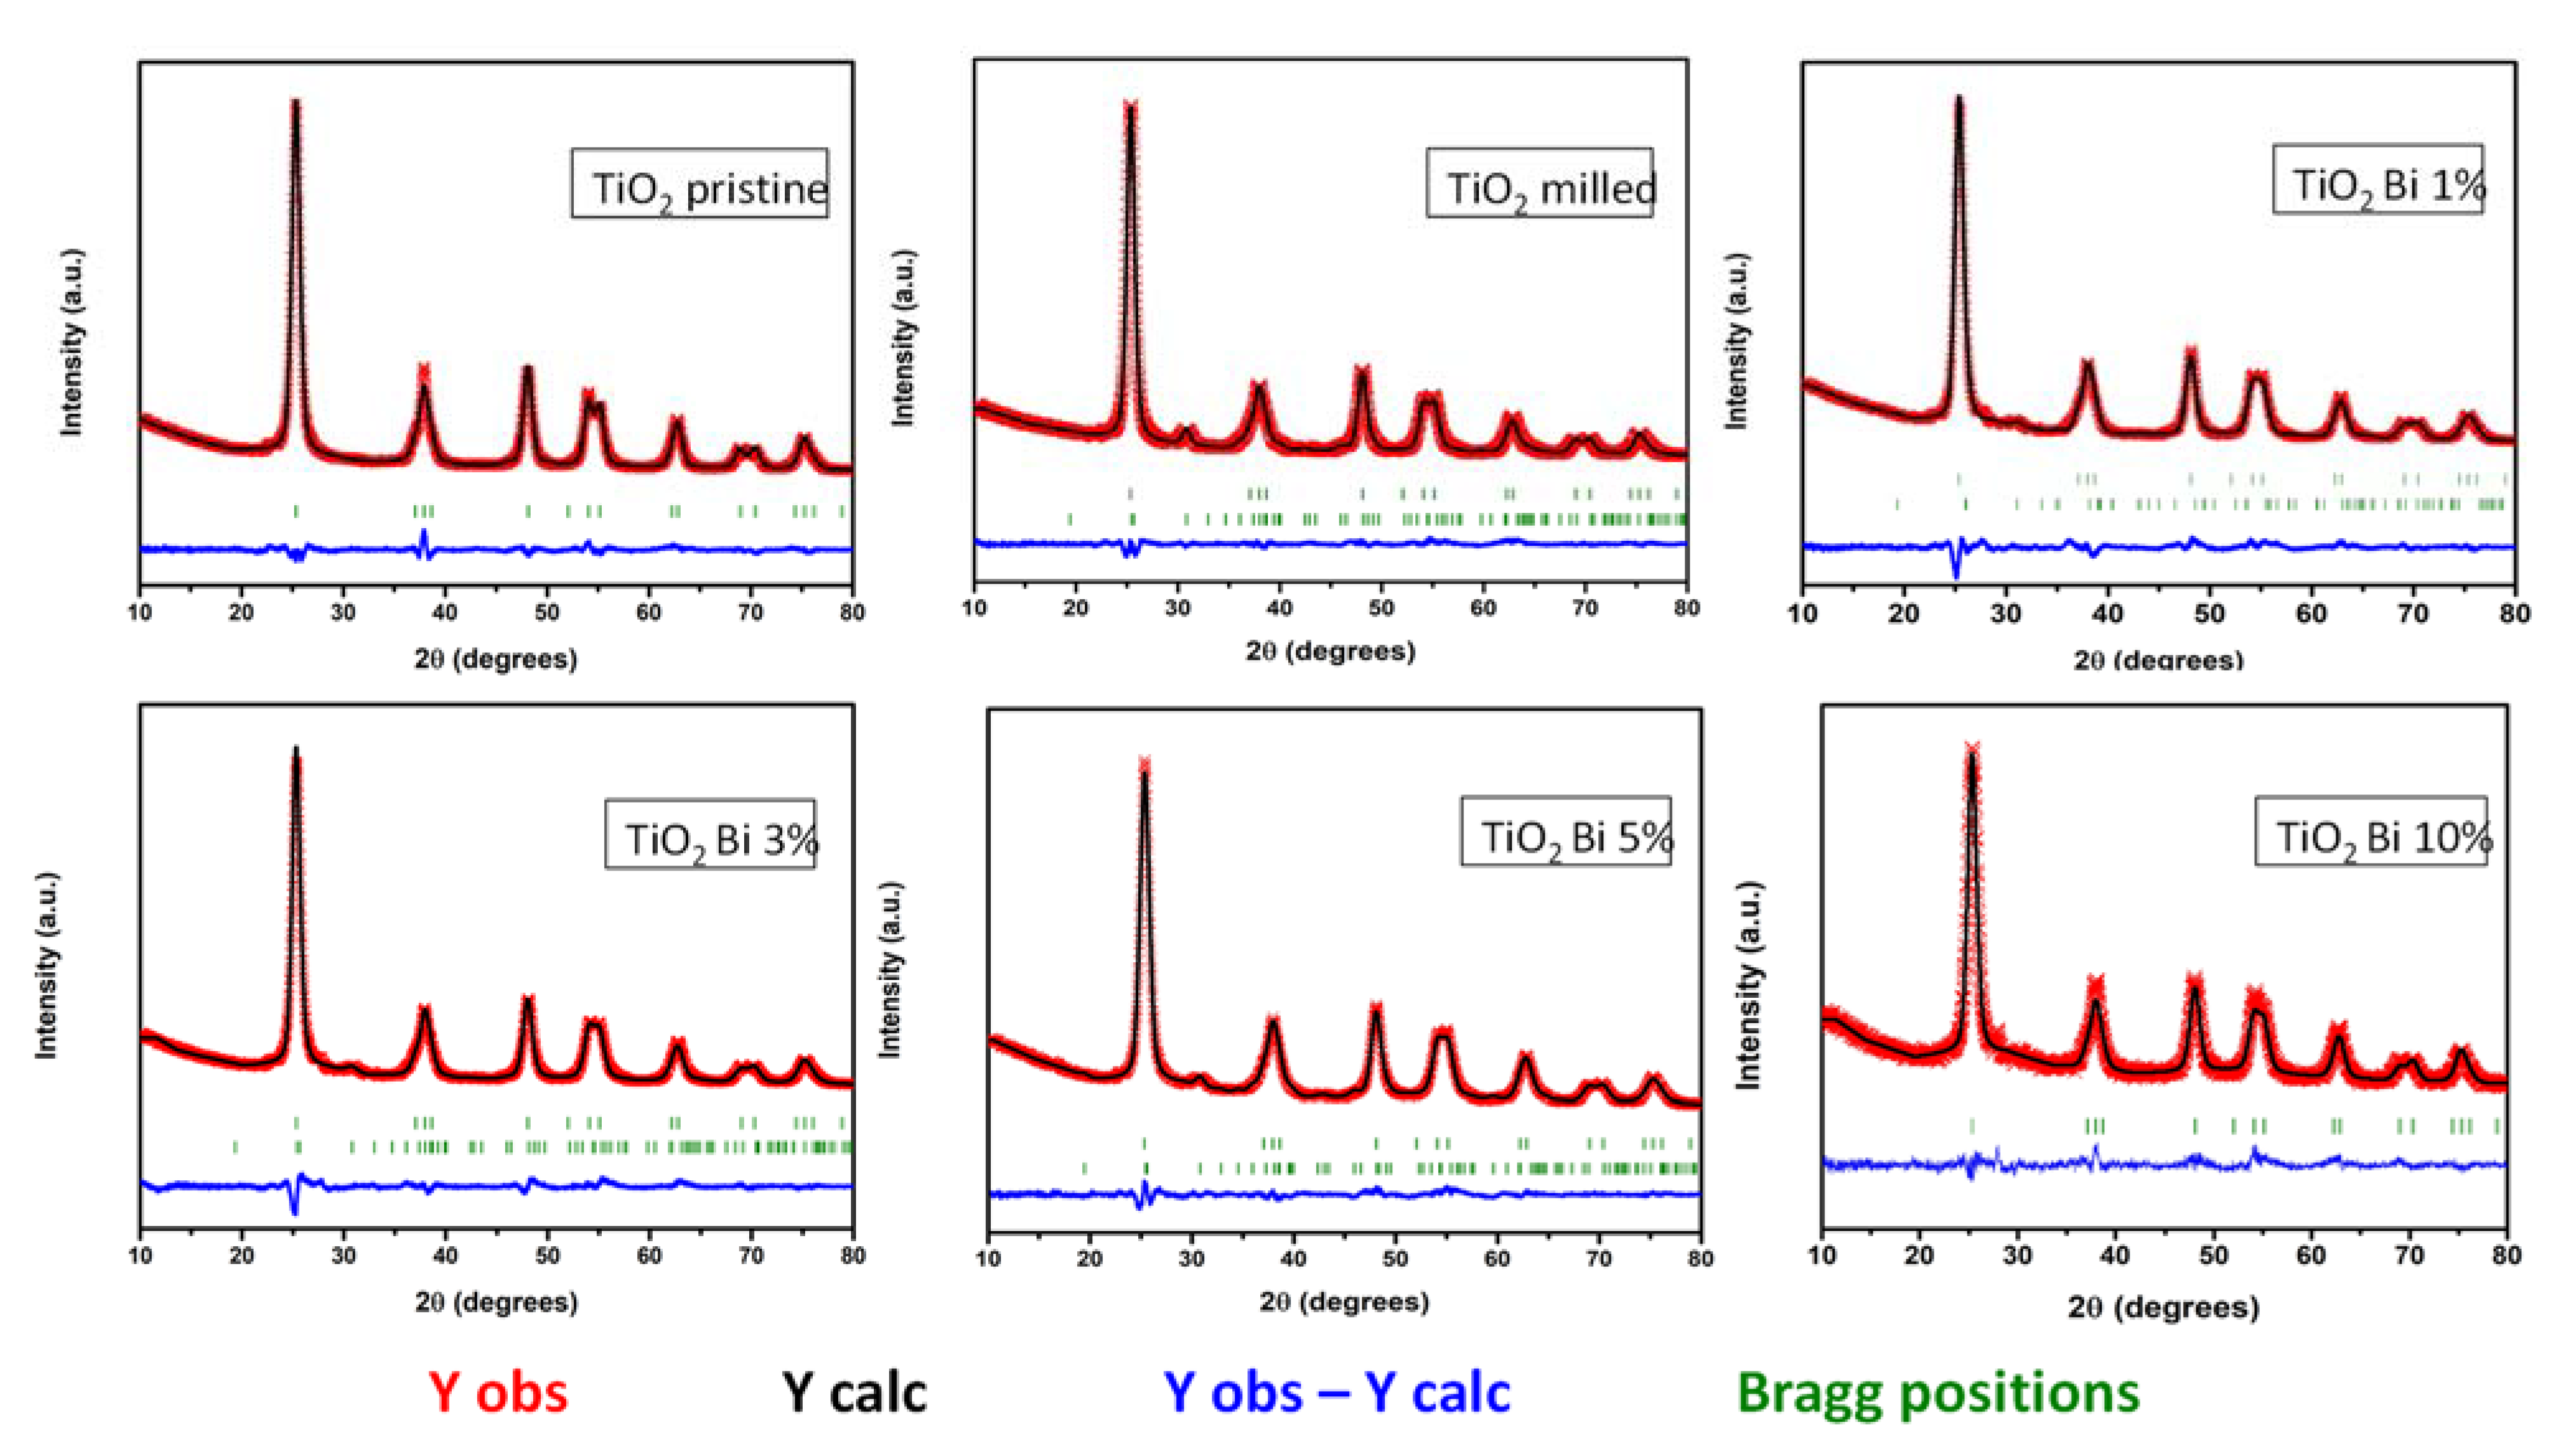
| Pristine TiO2 | Milled TiO2 | TiO2 Bi 1% | TiO2 Bi 3% | TiO2 Bi 5% | TiO2 Bi 10% | |
|---|---|---|---|---|---|---|
| Space group | I41/amd | I41/amd | I41/amd | I41/amd | I41/amd | I41/amd |
| a (Å) | 3.7829 (3) | 3.7837 (16) | 3.7765 (2) | 3.7858 (1) | 3.7853 (10) | 3.7842 (3) |
| c (Å) | 9.4930 (9) | 9.4834 (6) | 9.4715 (3) | 9.4910 (6) | 9.4868 (10) | 9.482 (13) |
| V (Å3) | 135.847 | 135.768 | 135.08 | 136.02 | 135.915 | 135.783 |
| Formula | TiO2 | TiO2 | Ti0.99Bi0.01O2 | Ti0.97Bi0.03O2 | Ti0.96Bi0.04O2 | Ti0.91Bi0.09O2 |
| Rp, Rwp, Rexp | 8.30, 9.13, 4.34 | 7.60, 8.35, 4.56 | 11.5, 11.3, 4.90 | 9.05, 9.44, 4.70 | 3.78, 4.94, 2.68 | 18.4, 16.5, 13.1 |
| X2 | 4.43 | 3.40 | 5.29 | 4.03 | 3.40 | 1.59 |
| % Brookite | 0 | 17 | 11.85 | 7 | 19.05 | 0 |
| Sample | First-Order | Second-Order | ||
|---|---|---|---|---|
| K1 (min−1) | R2 | K2 (mg−1·L·min−1) | R2 | |
| pristine TiO2 | 7.51 × 10⁻³ | 0.8502 | 5.08 × 10⁻⁴ | 0.8796 |
| TiO2 Bi 1% | 8.98 × 10⁻³ | 0.9116 | 6.88 × 10⁻⁴ | 0.9437 |
| TiO2 Bi 3% | 1.1910−2 | 0.9482 | 1.09 × 10⁻³ | 0.9777 |
| TiO2 Bi 5% | 1.84 × 10⁻² | 0.9796 | 2.02 × 10⁻³ | 0.9968 |
| TiO2 Bi 10% | 1.4210−2 | 0.9652 | 1.37 × 10⁻³ | 0.9877 |
Publisher’s Note: MDPI stays neutral with regard to jurisdictional claims in published maps and institutional affiliations. |
© 2022 by the authors. Licensee MDPI, Basel, Switzerland. This article is an open access article distributed under the terms and conditions of the Creative Commons Attribution (CC BY) license (https://creativecommons.org/licenses/by/4.0/).
Share and Cite
Estrada-Flores, S.; Pérez-Berumen, C.M.; Flores-Guia, T.E.; García-Cerda, L.A.; Rodríguez-Hernández, J.; Esquivel-Castro, T.A.; Martínez-Luévanos, A. Mechanosynthesis of Mesoporous Bi-Doped TiO2: The Effect of Bismuth Doping and Ball Milling on the Crystal Structure, Optical Properties, and Photocatalytic Activity. Crystals 2022, 12, 1750. https://doi.org/10.3390/cryst12121750
Estrada-Flores S, Pérez-Berumen CM, Flores-Guia TE, García-Cerda LA, Rodríguez-Hernández J, Esquivel-Castro TA, Martínez-Luévanos A. Mechanosynthesis of Mesoporous Bi-Doped TiO2: The Effect of Bismuth Doping and Ball Milling on the Crystal Structure, Optical Properties, and Photocatalytic Activity. Crystals. 2022; 12(12):1750. https://doi.org/10.3390/cryst12121750
Chicago/Turabian StyleEstrada-Flores, Sofía, Catalina M. Pérez-Berumen, Tirso E. Flores-Guia, Luis A. García-Cerda, Joelis Rodríguez-Hernández, Tzipatly A. Esquivel-Castro, and Antonia Martínez-Luévanos. 2022. "Mechanosynthesis of Mesoporous Bi-Doped TiO2: The Effect of Bismuth Doping and Ball Milling on the Crystal Structure, Optical Properties, and Photocatalytic Activity" Crystals 12, no. 12: 1750. https://doi.org/10.3390/cryst12121750
APA StyleEstrada-Flores, S., Pérez-Berumen, C. M., Flores-Guia, T. E., García-Cerda, L. A., Rodríguez-Hernández, J., Esquivel-Castro, T. A., & Martínez-Luévanos, A. (2022). Mechanosynthesis of Mesoporous Bi-Doped TiO2: The Effect of Bismuth Doping and Ball Milling on the Crystal Structure, Optical Properties, and Photocatalytic Activity. Crystals, 12(12), 1750. https://doi.org/10.3390/cryst12121750