Article

Structure Determination and Analysis of the Ceramic Material La0.987Ti1.627Nb3.307O13 by Synchrotron and Neutron Powder Diffraction and DFT Calculations

1
Faculty of Chemistry and Chemical Technology, University of Ljubljana, Večna pot 113, SI-1000 Ljubljana, Slovenia
2
National Institute of Chemistry, Hajdrihova 19, SI-1000 Ljubljana, Slovenia
3
Jozef Stefan Institute, Jamova 39, SI-1000 Ljubljana, Slovenia
*
Author to whom correspondence should be addressed.
Crystals 2023, 13(3), 439; https://doi.org/10.3390/cryst13030439
Submission received: 8 February 2023 / Revised: 23 February 2023 / Accepted: 1 March 2023 / Published: 3 March 2023
(This article belongs to the Special Issue Structural Investigation of Ceramic Materials)

Abstract

:
In this paper, the ternary system La2O3-TiO2-Nb2O5 is studied to find new ternary phases with useful electrical properties. The solid solution La3−xTi5−3xNb10−2xO39.5−12.5x was recently identified, and this study focuses on the structural characterization of this solid solution with x = 0.04. The crystal structure, representing a new structural type, was determined from synchrotron and neutron powder diffraction data. The unit cell parameters are a = 7.332 Å, b = 7.421 Å, c = 10.673 Å, α = 84.15°, ß = 80.16°, γ = 60.37°, and space group P 1 ¯ . The titanium and niobium atoms are disordered in five different crystallographic sites coordinated octahedrally by oxygen atoms. The eight-coordinated La atoms are embedded in the octahedral framework. Ti and Nb preferentially occupy different sites, and this feature was studied using periodic density functional theory methods. Energies of possible Ti/Nb distributions were calculated and the results agree well with the site occupancies obtained by combined Rietveld refinement of synchrotron and neutron powder diffraction patterns. The geometries optimized by DFT also agree well with the structural parameters determined by diffraction. The general agreement between the theoretical calculations and the experimental data justifies the quantum chemical methods as reliable complementary tools for the structural investigation of ceramic materials.

1. Introduction

The phase relations in the La2O3-Nb2O5 and La2O3-TiO2 systems have been intensively studied because some compounds in these binary systems exhibit very useful electrical properties [1,2].
In the system La2O3-Nb2O5, a stable perovskite A-site-deficient La1/3NbO3 doped with Li has been intensively studied as a solid electrolyte because it exhibits high electrical conductivity in the range of 10−5 to 10−3 Ω−1 cm−1 [3,4,5], although the stoichiometric La1/3NbO3 has very low electronic conductivity (less than 10−10 Ω−1 cm−1 at 20 °C) [4,6].
In the La2O3-TiO2 system, there are the compounds La2Ti2O7 and La4Ti9O24, which have been reported to have interesting dielectric properties [6]. However, in the binary system, the perovskite La2/3TiO3 compound was not found [2,7]. It can be stabilized with a small amount of Al2O3 and exhibits excellent microwave dielectric properties [8,9]. On the other hand, the same compound with small amounts of Fe2O3 (La(2+x)/3FexTi1−xO3) or Li2O (La2/3−xLi3xTiO3) shows high electronic [10] and ionic conductivity, respectively [11]. The stabilization mechanism of the perovskite La2/3TiO3 in the ternary system La2O3-TiO2-Nb2O5 and its crystal structure have been thoroughly studied by several authors using laboratory X-ray [12,13], synchrotron [14], and neutron [15] diffraction methods. Zhang et al. reported interesting, highly tunable microwave dielectric properties of ceramics based on the ternary compound LaTiNbO6, where the properties can be varied by thermal treatment conditions [16]. Crystal structure, phase composition, and electrical properties of some ceramic compositions along the composition line Ln1/3NbO3-Ln2/3TiO3 have been studied in detail due to their promising microwave dielectric properties [17,18]. Recently, we have reported other remarkable microwave dielectric properties of the ternary phases. Namely, the LaTiNbO6 and La0.462Ti0.386Nb0.614O3 phases exhibit an opposite temperature dependence of the resonant frequency in the microwave range, and their mixture in the molar ratio of 0.27 has thermally stable dielectric properties [12].
Some information is still lacking on the ternary compounds in the La2O3-TiO2-Nb2O5 system and their structures. Strahov et al. [19] identified a solid solution LaTi1−xNb3O11+2x (x = 0–1) lying on the proposed La1/3NbO3-TiO2 tie-line. However, our recent study of a ternary phase diagram of the La2O3-TiO2-Nb2O5 system (subsolidus isothermal section at 1290 °C) revealed several new phases and defined this solid solution with the formula La3−xTi5−3xNb10−2xO39.5−12.5x [12].
The aim of this work was to determine and analyze the structure of the endmember of the solid solution La3−xTi5−3xNb10−2xO39.5−12.5x with x close to zero. We intended to solve the structure by crystallographic powder diffraction techniques, using synchrotron and neutron powder diffraction patterns simultaneously. In addition to established protocols for structure solution based on powder diffraction techniques, we also intended to use quantum calculations based on periodic density functional theory (DFT). Theoretical calculations have become a powerful tool supporting the interpretation of experiments in a variety of chemical disciplines, and since the underlying numerical formalism supports periodicity, they have also been used to characterize crystalline solids, for example in [20]. However, due to the diversity of crystalline materials, there is little published experience with the computational treatment of the La2O3-TiO2-Nb2O5 system.

2. Materials and Methods

The ceramic specimens were prepared by the solid-state reaction technique using La2O3 (99.99% Alfa Aesar), TiO2 (99.8% Alfa Aesar), and Nb2O5 (99.5% Alfa Aesar). Since La2O3 has a strong tendency to form a hydroxide and a carbonate with moisture and CO2 in the air, the oxide was routinely checked by an annealing loss measurement at 1300 °C before weighing. Samples of the final mass of 3.6 g were weighed according to stoichiometry and homogenized in 70 mL of ethanol media for 0.5 h using a YTZ ball mill. Molar ratio of starting oxides was 1.48 La2O3: 4.88 TiO2: 4.96 Nb2O5. The dried powders were uniaxially pressed into pellets and calcined in a tube furnace in air at 1300 °C for 12 h. The calcination process was repeated several times with intermittent homogenization.
The prepared samples were polished and examined by scanning electron microscopy (FESEM, Ultra Plus, Carl Zeiss, Germany). Quantitative chemical analysis of the identified phases was performed by energy dispersive spectroscopy (EDS, INCA, Oxford Instruments).
High-resolution synchrotron powder X-ray diffraction data were collected at the Swiss-Norwegian Beamline (SNBL) BM01B at the European Synchrotron Radiation Facility (ESRF), Grenoble, France, using the Debye-Scherrer transmission geometry (0.05 mm diameter capillary) and a wavelength of 0.49998 Å. The usable data range was between 4 and 44° 2θ (d-spacing between 7.165 and 0.667 Å), and the step size was 0.003° 2θ. The neutron powder diffraction pattern was collected at the Swiss Spallation Neutron Source (SINQ) at the Paul Scherrer Institute (PSI) in Villigen, Switzerland. A constant wavelength of 1.494 Å was used, and the 2θ range between 7 and 147° 2θ (d-spacing between 12.236 and 0.779 Å) was scanned in steps of 0.05° 2θ.
Indexing was performed with the Treor [21] and Ito [22]. The Fox [23] software was used for structure solution, and structure refinement was done with the Rietveld method integrated in the software package Topas Academic [24].
All calculations reported in this study are based on the periodic DFT method with local atomic basis sets as implemented in the CRYSTAL06 [25] software package (note that the actual basis functions in this approach are periodic Bloch functions defined in terms of local atomic functions). For most of our calculations, we used the well-known B3LYP functional. In a small part, we also used the BLYP and PBE functionals to test the consistency of the results. For the titanium and oxygen atoms, all calculations used the 86-411d3G and 8-411G basis sets, respectively, which contain all electrons. In previous studies, the Ti basis set has been employed in various studies, including electric field gradient calculations on LixTiS2 [26], evaluation of properties of cubic and tetragonal ferroelectric phases of BaTiO3 with performance analysis of various functionals [27], and study of adsorption of CO on TiO2 [28]. The O basis set was used in studies of metal oxides, including CO adsorption on TiO2 [28], elucidation of electronic structure of crystalline NiO and MnO [29], and structural studies of epitaxial monolayer of NiO on Pd (100) [30]. Both basis sets were obtained from the online library maintained by the authors of the software [31]. For niobium, we used a Hay-Wadt pseudopotential approximating the 28 core electrons, while the 31 (31d) G basis set, developed and tuned for use together with the pseudopotential, was used to treat the valence electrons explicitly [32]. Alternatively, we also used the all-electron 986-31 (631d) G basis set for niobium [33]. For lanthanum, we used the Stuttgart-Dresden (SDD) pseudopotential representing the 46 core electrons along with the (7s6p5d)/[5s4p3d] valence basis set [34] modified for use under periodic boundary conditions. Alternatively, we have also used the Hay-Wadt pseudopotential for lanthanum in conjunction with the same basis set. Finally, we have tentatively used a lanthanum basis set for all electrons from Towler’s periodic basis set library [31,35].
The preferences of the Ti and Nb atoms for occupying five different crystallographic sites in the structure were investigated by comparing the energies of ten possible occupational isomers obtained by placing 2 Ti and 3 Nb atoms in the five sites. Geometry optimization of all isomers was performed under the constraint of a fixed unit cell; parameters determined from powder diffraction were used. Both the translational periodicity and the symmetry features of the P 1 ¯ space group were consistently considered in the calculation. A 2 × 2 × 2 mesh of k points was used for the integration into the reciprocal space according to the Monkhorst-Pack method [36], which gave satisfactory convergence of the energies. To improve the accuracy of the optimization, we strengthened the convergence check of the geometry by classifying the integrals based on the final geometry (option FINALRUN = 3). The same diffraction-determined geometry was used as the starting point for each optimization.

3. Results

3.1. Structure Determination and Analysis

3.1.1. Structure Solution and Refinement

A ceramic material representing the end member of the solid solution La3−xTi5−3xNb10−2xO39.5−12.5x, with x near zero, was prepared as described above. The FESEM analysis showed that the material consisted of a single phase, and the EDS analysis confirmed that x in the above formula is 0.04, i.e., the approximate formula of the material is La2.96Ti4.88Nb9.92O39 (Figure 1).
The diffraction pattern indicates that the material is well crystallized (sharp peaks) and has a rather complex crystal structure (many peaks with significant overlap even at low diffraction angles). The pattern could not be assigned to any known phase in this system or any other in the PDF-4 database.
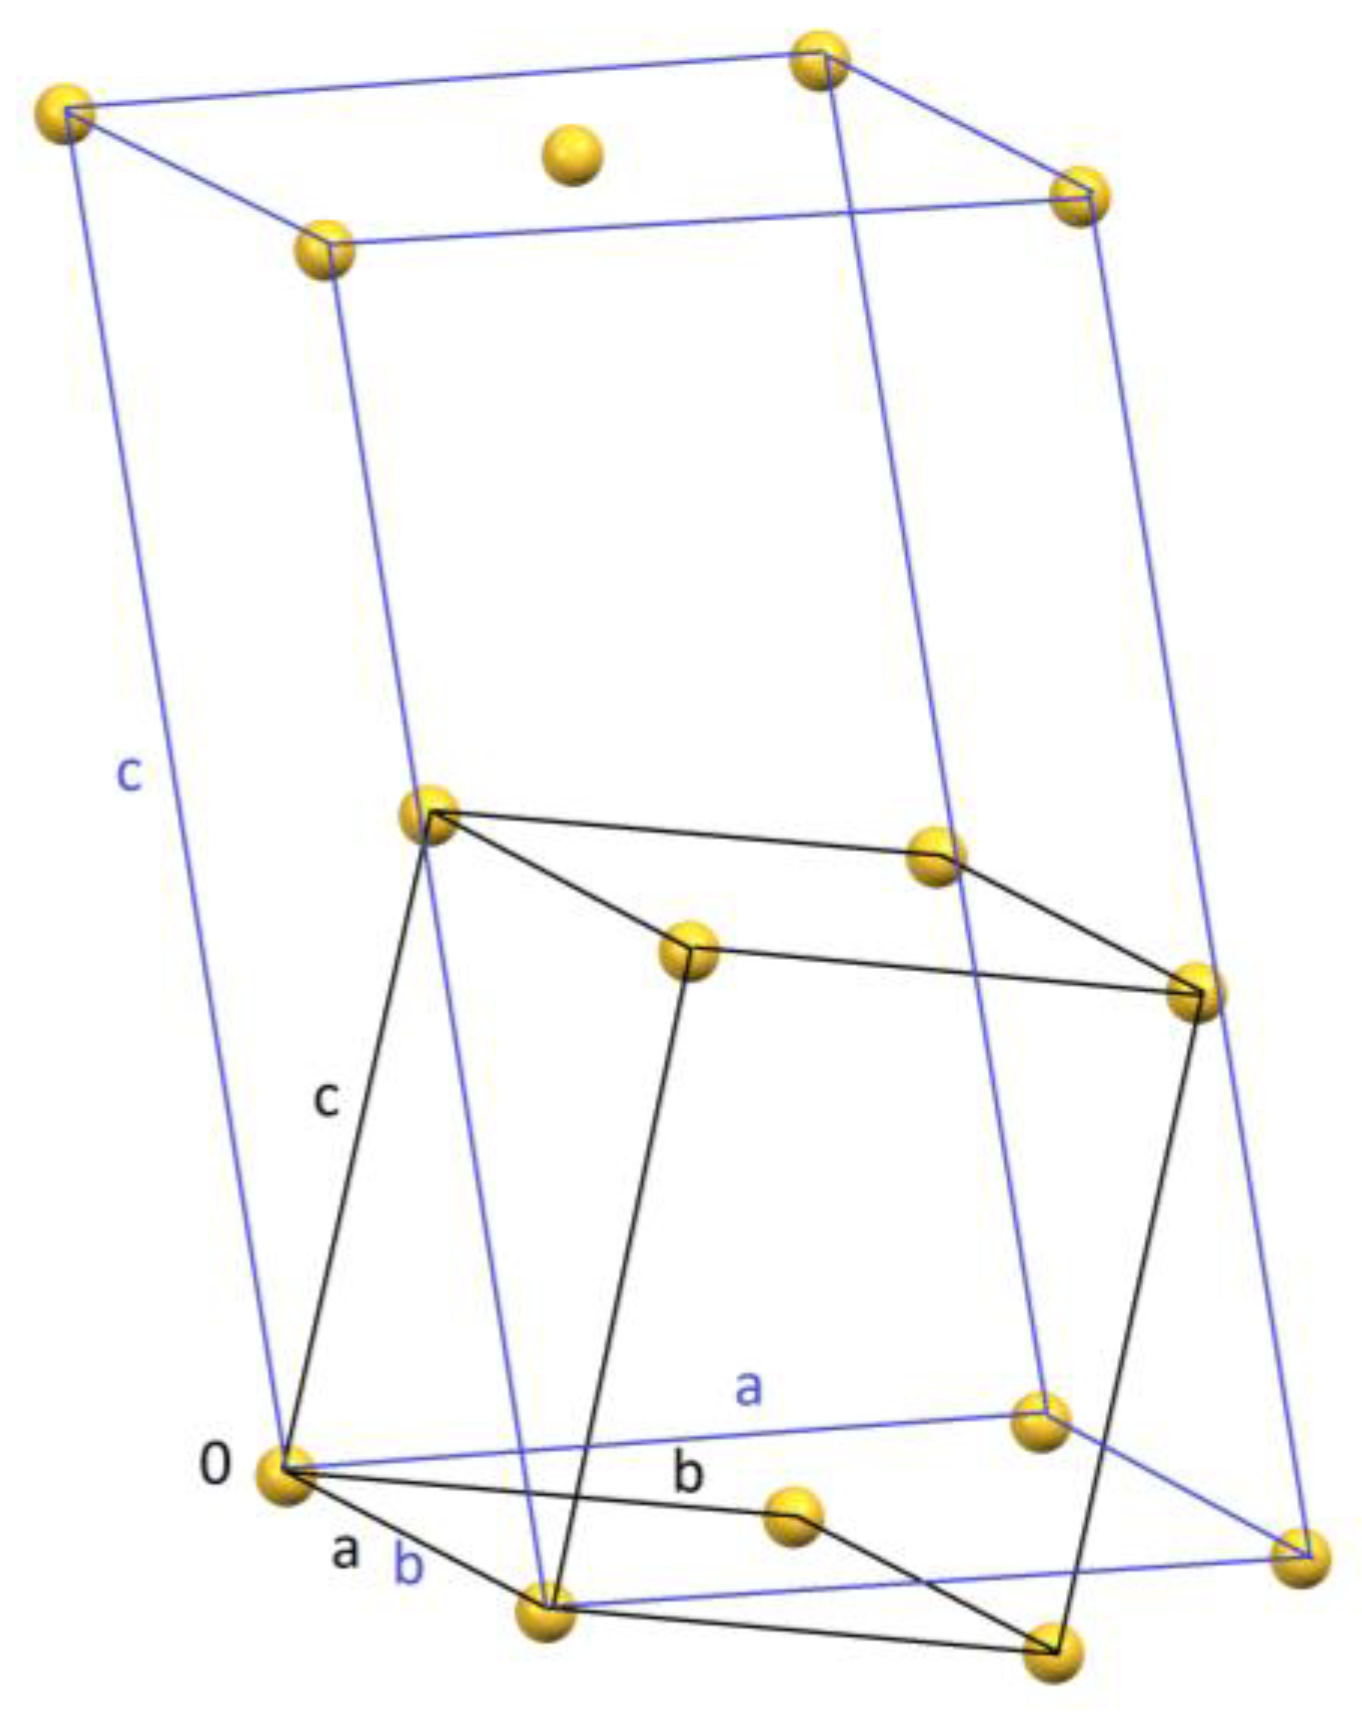
Indexing of the synchrotron X-ray diffraction pattern provided a solution with high figure of merit and indexing of all peaks. It was triclinic with the parameters in the standard setting (parameters increase from a to c and all angles are either acute or obtuse) a = 7.332, b = 7.421, c = 10.673 Å, α = 84.15, β = 80.16, γ = 60.37°, V = 497.24 Å3. The angle γ indicates a pseudo-hexagonal structure, but it is distorted. The lattice defined with the given triclinic cell was examined to identify possible higher symmetry and indeed several settings of a four times larger monoclinic C-centered unit cell were found. One example is defined by the parameters a = 12.901, b = 7.332, c = 21.873 Å, ß = 105.98°, V = 1989.06 Å3. It is evident that the triclinic a and b define the centered rectangular ab face of the monoclinic cell, and the monoclinic c ends in the second layer of the triclinic lattice, since it is not possible to form a rectangular bc face of the monoclinic cell with the lattice points in the first layer (Figure 2). Such monoclinic cells predict twice more reflections than the small triclinic cell, which is a disadvantage, nevertheless structure solution trials were performed in both specified unit cells.
The triclinic cell was first assumed to have space group P 1 ¯ , while the extinction conditions for the monoclinic cell corresponded to the three space groups C2, Cm, and C2/m. The highest symmetry was tried first and then the other two, since we did not find a feasible solution in C2/m. We assumed that the lanthanum ions are free in the structure and the oxygen ions form octahedra with either niobium or titanium ions in the center, and that niobium and titanium share crystallographic sites. Based on the volume of the asymmetric unit, approximate stoichiometry, and estimated density, one lanthanum and five (Ti,Nb) O6 octahedra were loaded into the Fox software in the case of the triclinic cell and the software was run for 16 h of CPU time on a single-processor personal computer. A similar procedure and the same number of atoms and polyhedra were required for the C2/m space group, while the number of atoms and polyhedra had to be doubled for the C2 and Cm space groups.
Feasible solutions were found in the triclinic cell and with space group C2 in the monoclinic. However, solution in the monoclinic cell was only possible when larger fragments found in the triclinic cell were loaded into Fox. Although the symmetry is different, the structures in the triclinic and monoclinic cells look similar. We attribute this to high pseudosymmetry. The distortions of the true structure can be only seen in details. The Ti/Nb octahedra form zigzag layers by sharing edges and corners. The lanthanum atoms are 8-fold coordinated and contained in one of the two types of layers. A more detailed description is given in the next subsection.
Although the monoclinic structure contained two times more atoms and had two times more predicted reflections, the final fit to synchrotron and neutron data was worse than for the small triclinic structure. This was the main reason why we chose the triclinic model, which is described below. In addition, Findsym [37] did not find higher symmetry when the triclinic structure was loaded. A side effect of choosing a smaller structure was a manageable number of occupational isomers that we investigated by DFT calculations.
The final refinement was performed simultaneously on synchrotron Y-ray and neutron diffraction patterns, with both patterns equally weighted. Atomic coordinates and population parameters were the same for both patterns, while unit cells were refined independently to account for possible temperature differences between neutron and synchrotron data collection. However, the difference was within standard deviations. All atomic coordinates, including oxygen coordinates, were refined without constraints or restraints, while atomic displacement parameters were refined in three groups—one for lanthanum, one for all Ti/Nb cations, and one for oxygen atoms.
Refinement of the population parameters of the cations was not so straightforward (all refinements assumed that the oxygen sites were fully occupied). After several trials, using various approaches (from a free, independent refinement to a restricted refinement in which the total occupancy of a given site is exactly one or less than or equal to one), it became clear that the refinement was not very sensitive to the occupation parameters (very similar R factors were obtained with different occupation parameters). Although both diffraction patterns (X-ray sensitive for the cation occupancy and neutron sensitive also for the oxygen atoms) were used simultaneously, this is understandable since all six cationic sites can be partially occupied (vacancies are possible for La and for Ti/Nb). At the end of the refinement, the occupation parameters were constrained to follow the cation ratios determined by EDS, to be consistent with the solid solution formula, and to maintain electroneutrality.
There are only 13 oxygen atoms in the asymmetric unit, and there is no room for more even if the symmetry is broken or a large monoclinic cell is used—the ratio of oxygen to cationic sites remains the same. Referring to the solid solution formula La3−xTi5−3xNb10−2xO39.5−12.5x, we can have 39 oxygen sites (three times the asymmetric unit), which means that x in the formula is 0.04 (which is close enough to zero) and the formula is La2.96Ti4.88Nb9.92O39 or La0.987Ti1.627Nb3.307O13 for the asymmetric unit. This is close enough to the formula obtained from the final occupancies (Table 1 and Table 2).
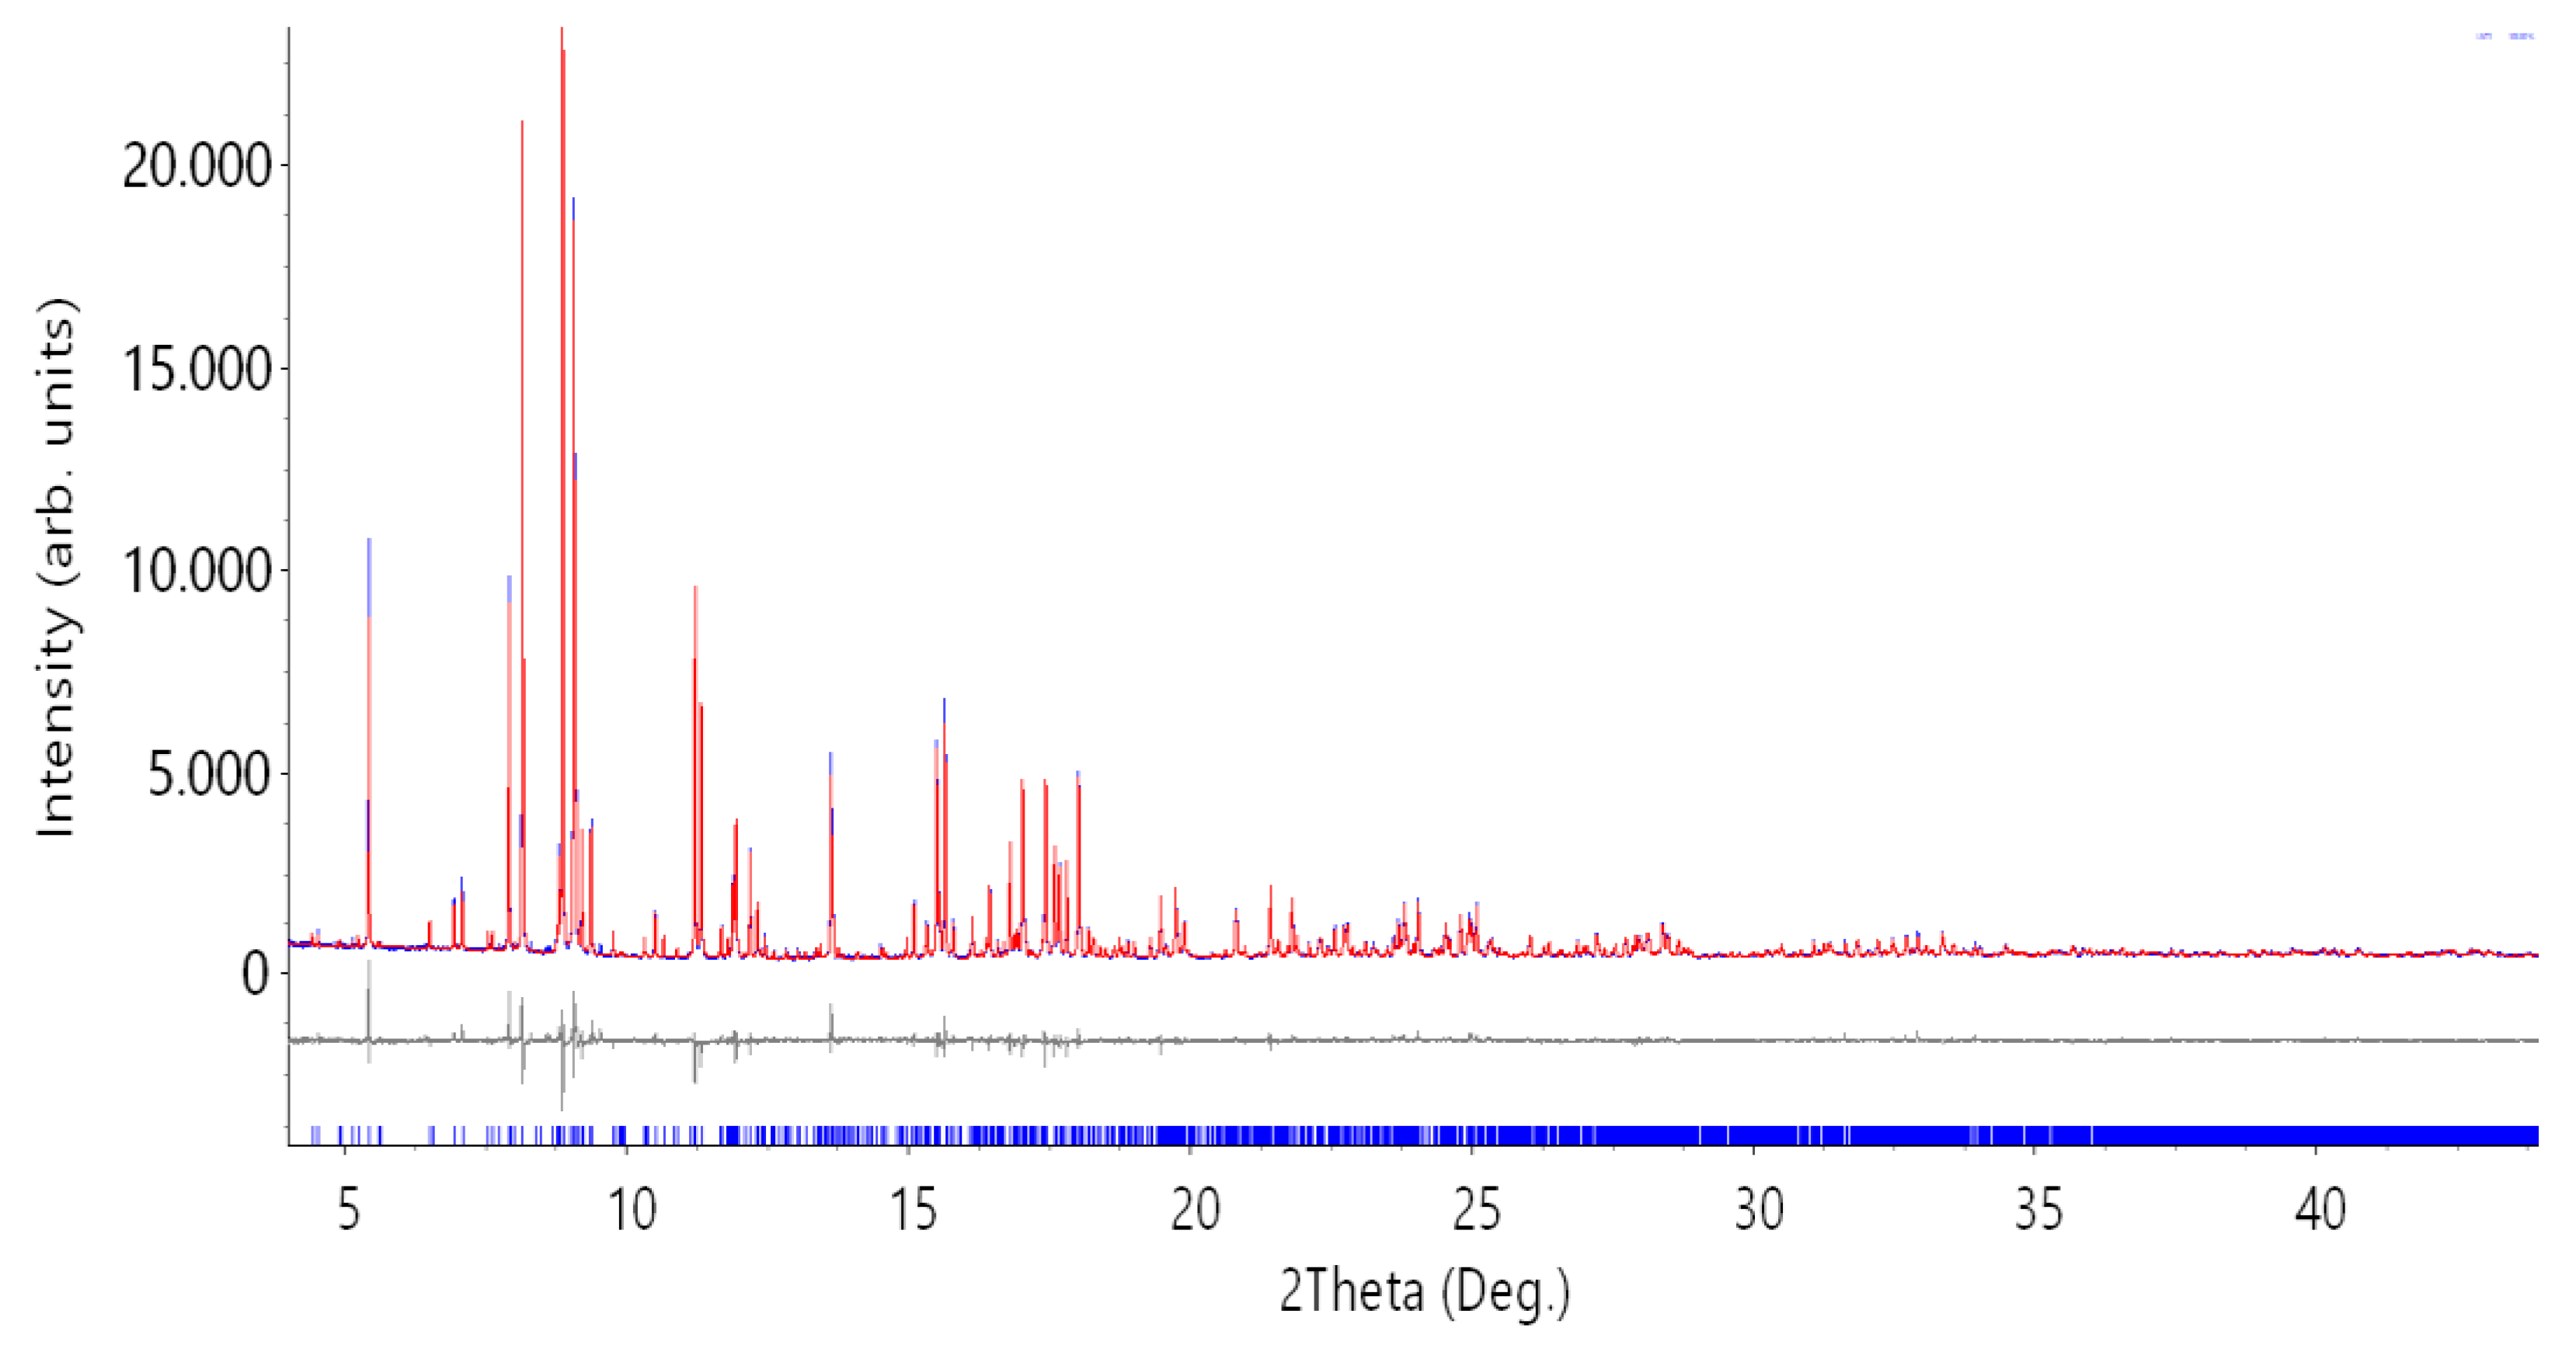
The final Rietveld refinement of the triclinic structure on both patterns simultaneously was stable and gave reasonable agreement between the calculated and observed patterns (Figure 3 and Figure 4), as reflected by acceptable R factors (Table 1). The final refined coordinates, population parameters, and atomic displacement parameters are listed in Table 2, while the structure is described in the following subsection.

3.1.2. Structure Description

The crystal structure of La0.987Ti1.627Nb3.307O13 can be described by two types of polyhedral layers parallel to the ab plane and stacked along the z direction.
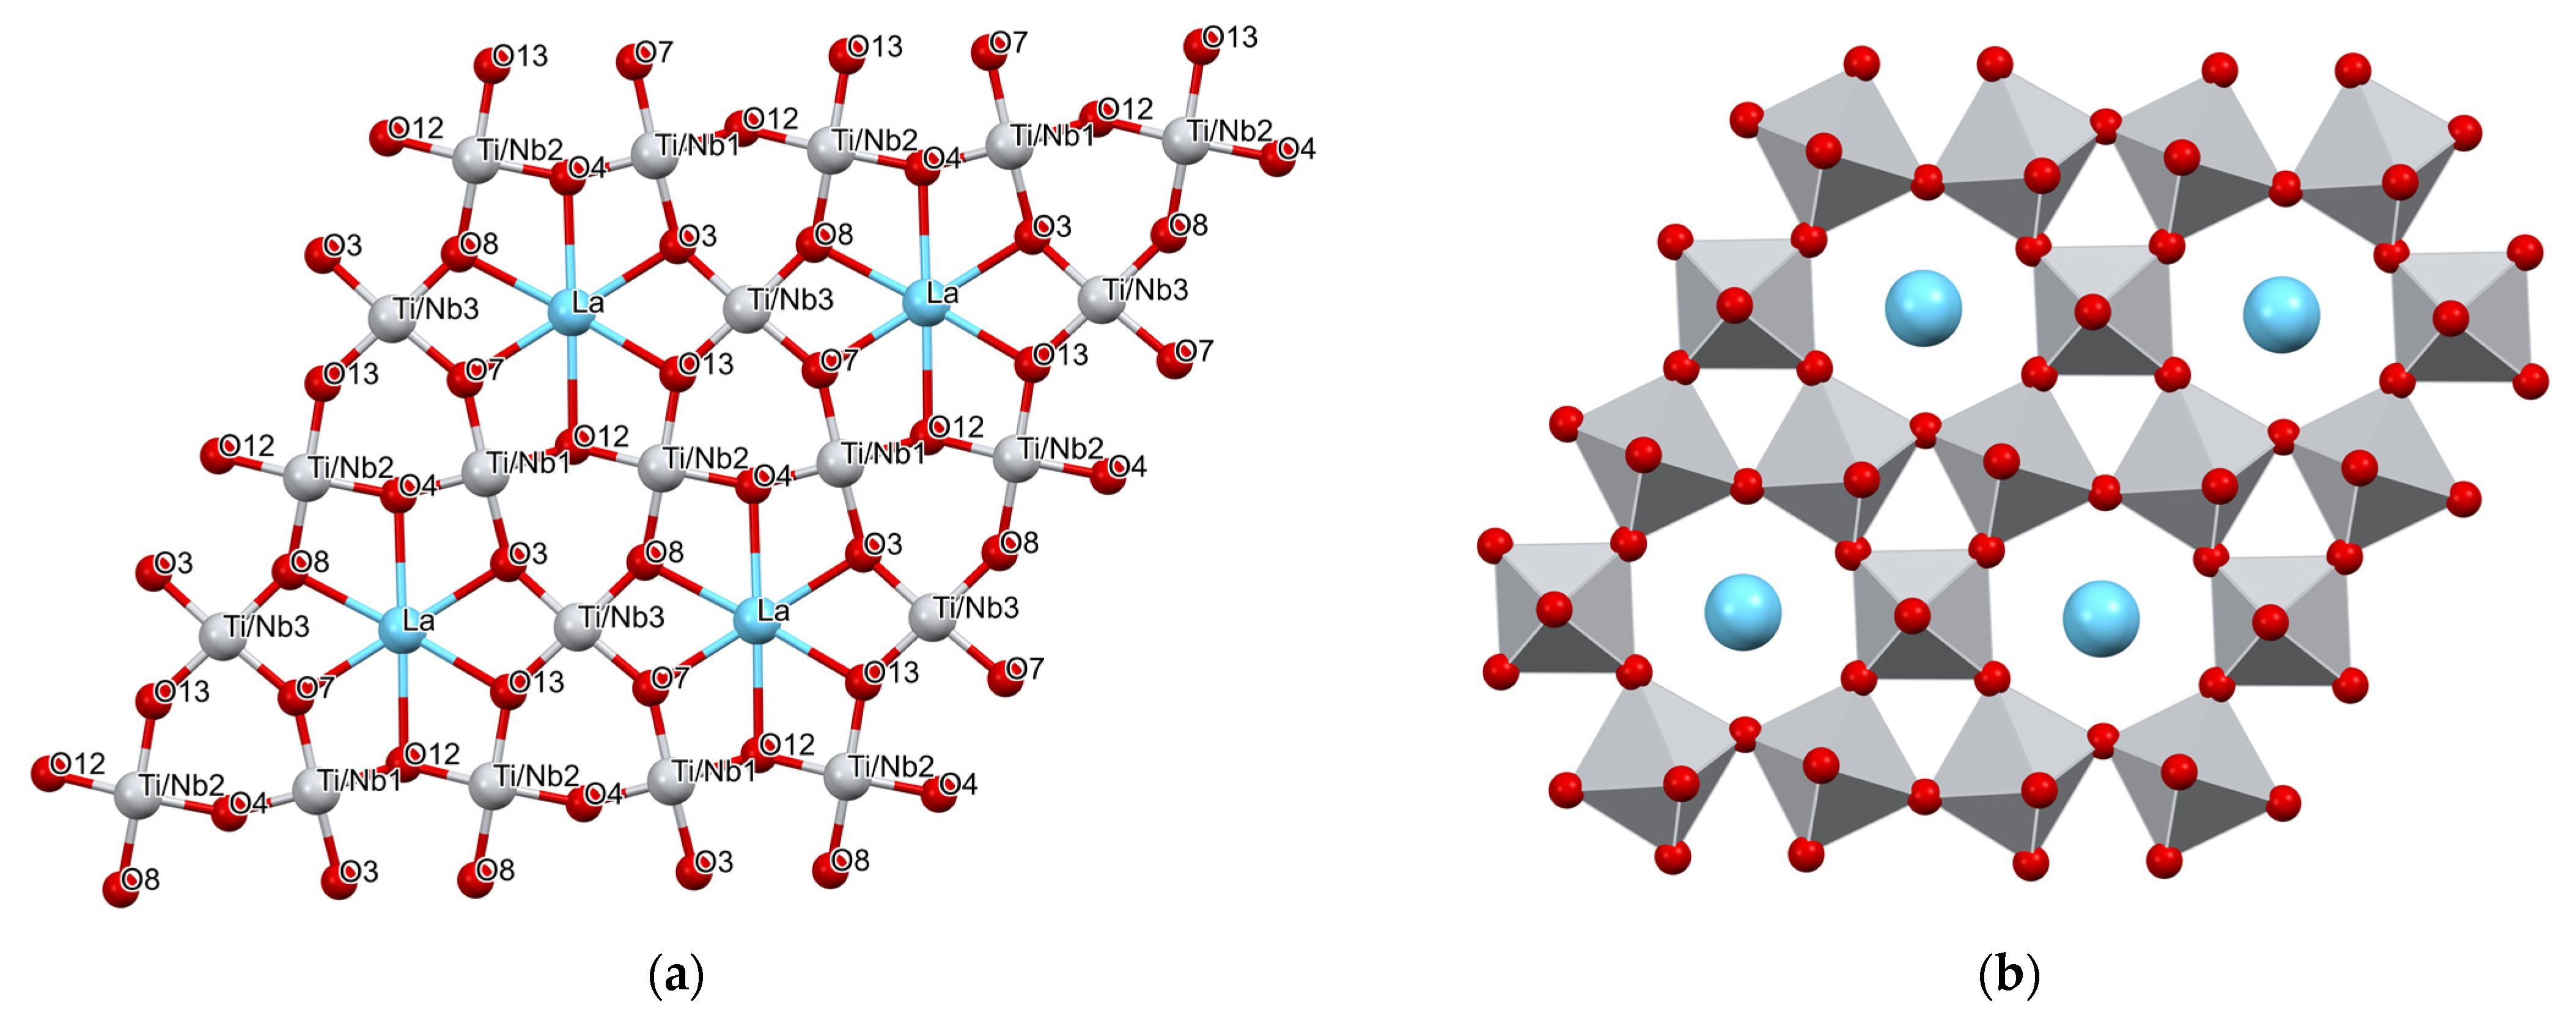
The first type of polyhedral layers consists of three nearly planar sublayers. The middle sublayer is shown in Figure 5 and contains lanthanum, three Ti/Nb shared sites (labelled 1, 2, and 3 in Table 2), and six oxygen sites (labelled O3, O4, O7, O8, O12, and O13).
Above and below the middle sublayer are two sublayers consisting only of oxygen atoms (the upper sublayer of O5, O6, O11, and O14 and the lower sublayer of O9 and O10). These oxygen atoms are above and below the cationic sites and complete the polyhedra around the cations in the middle sublayer. Lanthanum is eightfold coordinated. Six oxygen atoms in the plane with distances between 2.581 (9) and 2.779 (4) Å form an almost regular hexagon, and two more are located above and below lanthanum with distances of 0.356 (5) and 2.358 (5) Å, forming the tips of the hexagonal bipyramid. The Ti/Nb sites in this type of layer are octahedrally coordinated by oxygen atoms (four in the plane and two in the upper and lower sublayers). The Ti/Nb-O distances range from 1.732 (5) to 2.280 (5) Å and the O-Ti/Nb-O angles from 74.5 (3) to 105.3 (5)° for cis and 48.9 (2) to 178.8 (4)° for trans oxygen atoms. The distortions of the octahedra are considerable, but well understood from the point of view of the connections to the neighboring layers.
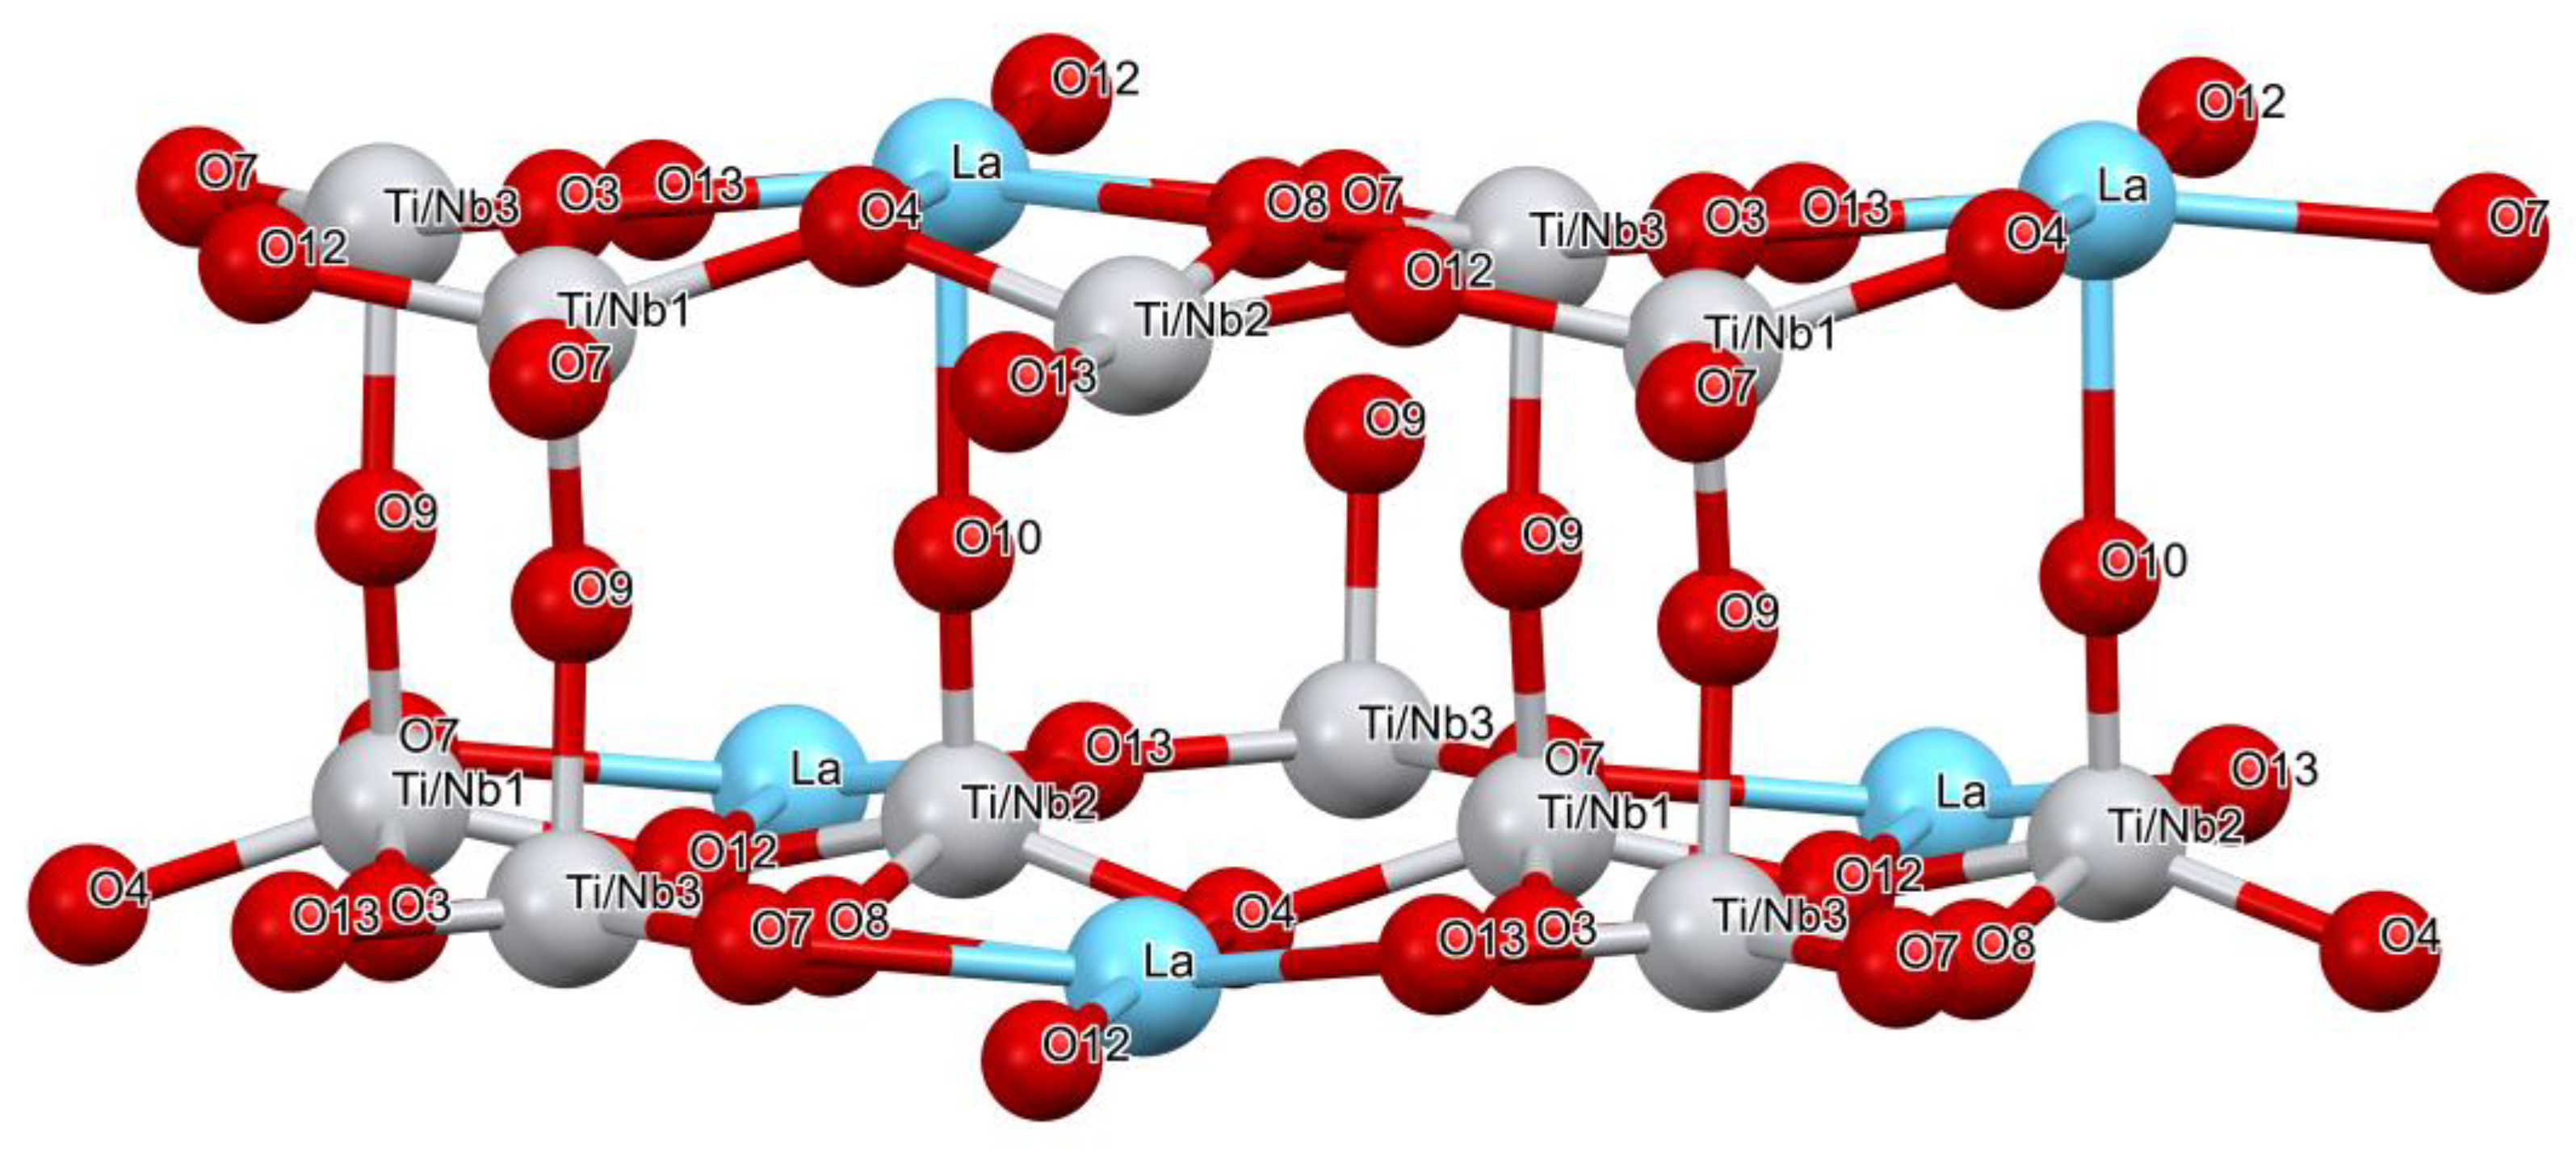
The layer of the first type is connected by the common corners O9 and O10 to the layer of the same type, which is shifted so that La and Ti/Nb2 are superposed, bridged by O10. The distances Ti/Nb2-O10 and La-O10 are relatively short (2.356 (5) and 1.732 (5) Å, respectively). Similarly, Ti/Nb1 and Ti/Nb3 are superposed in the adjacent layers of the first type, bridged by O9, the distances Ti/Nb1-O9 and Ti/Nb3-O9 are 1.823 (5) and 1.903 (6) Å, respectively (Figure 6).
The Ti/Nb-centred octahedra of the first layer type have only common corners, and their in-plane edges form a hexagon around lanthanum and an empty triangle between the three octahedra (Figure 5b).
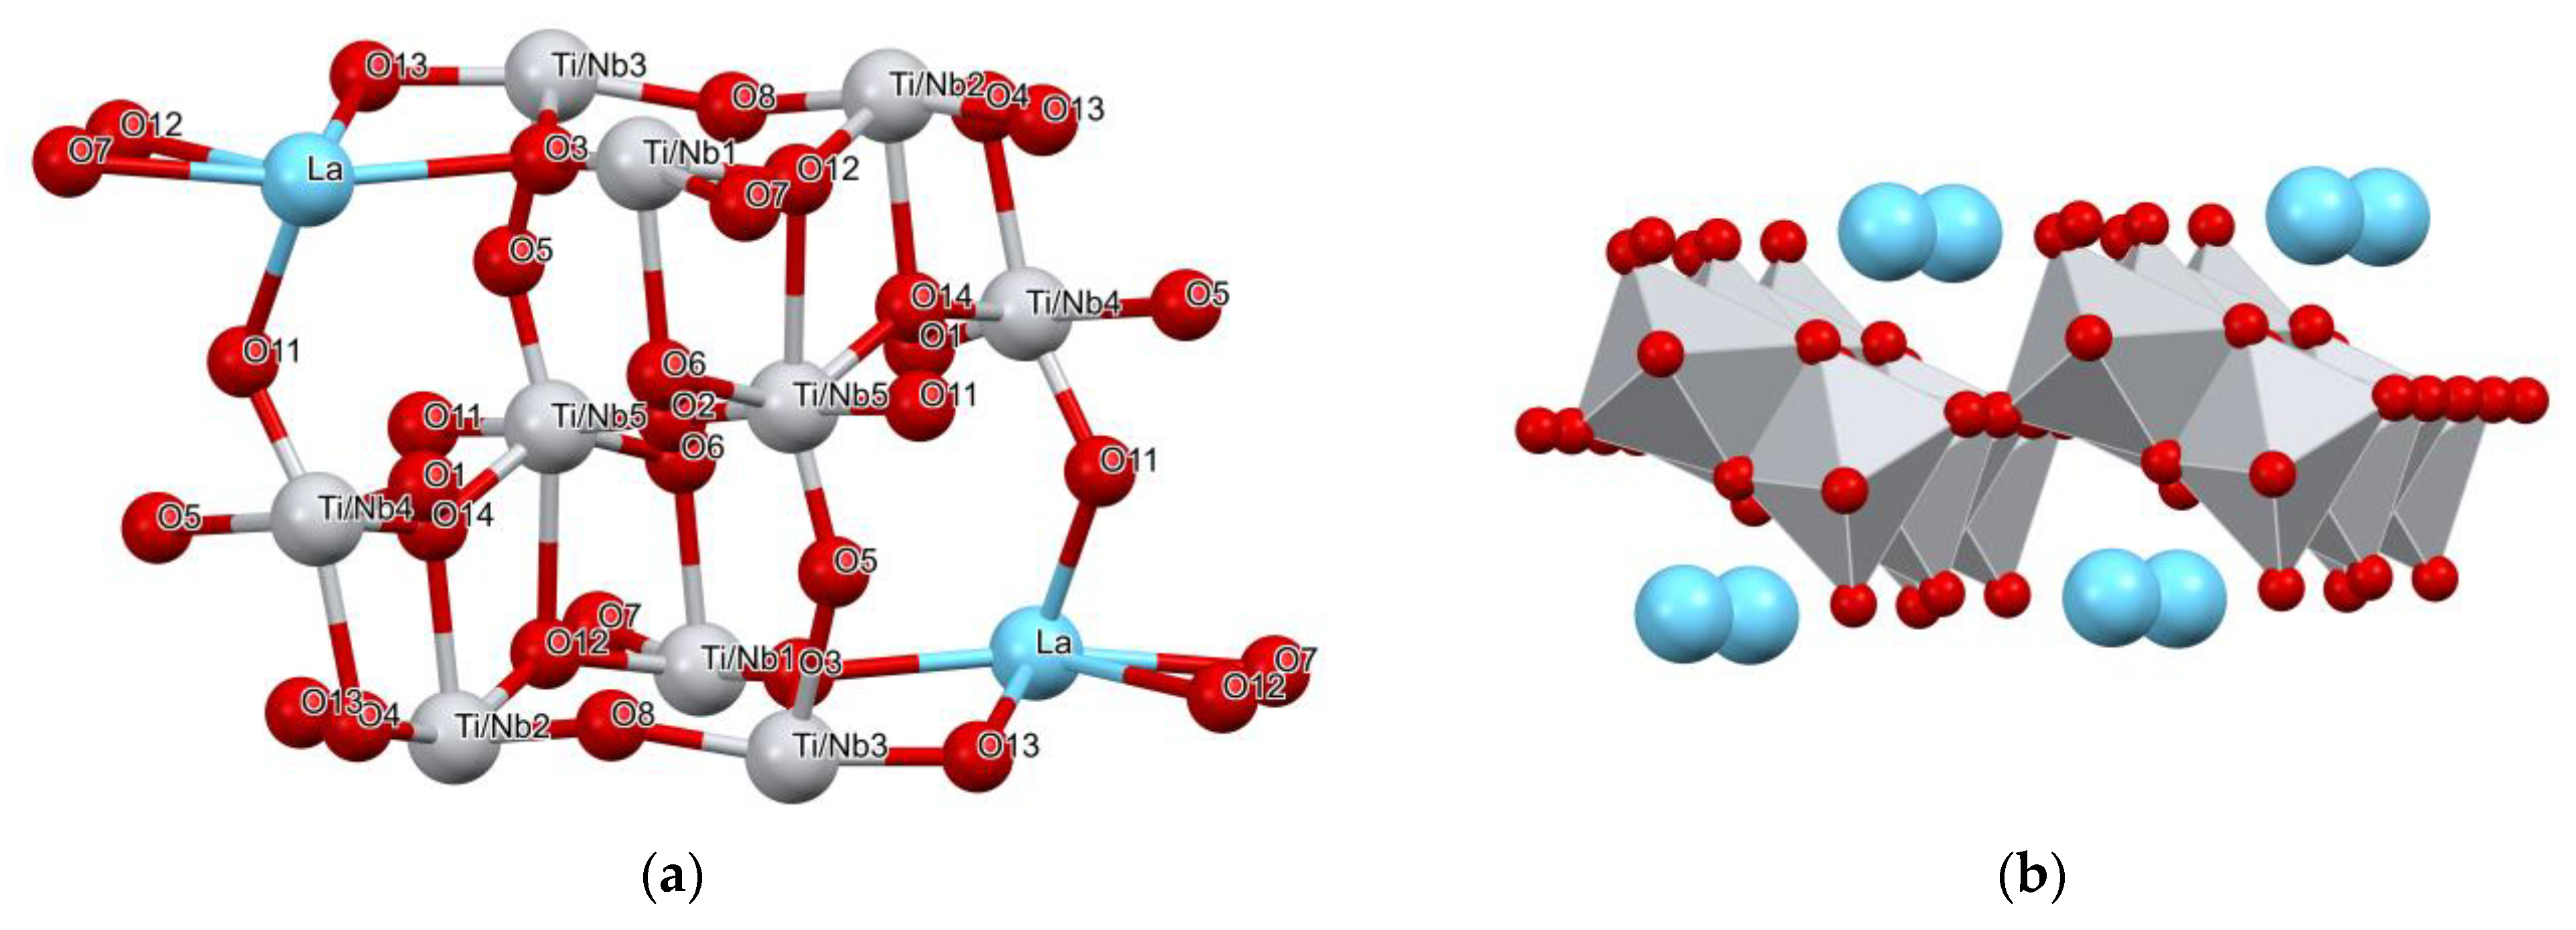
The layers of the second type are more complex. They consist of Ti/Nb-centered octahedra with common corners and edges and are sandwiched between pairs of layers of the first type. The cationic sites in this type of layer are Ti/Nb4 and Ti/Nb5, and the layer is not as planar as the first, but rather wrinkled. It can also be viewed as an interconnected set of zigzag chains of octahedra running in different directions. This type of layer contains two oxygen atoms in special positions. They are O1 and O2, which sit on the centers of inversion in the middle of the ac face and in the middle of the unit cell, respectively. O1 connects two symmetry related Ti/Nb4 sites in a corner-sharing manner and with a bond length of 1.740 (3) Å. Similarly, O2 connects two Ti/Nb5 sites with a bond length of 1.881 (2). The octahedra around Ti/Nb4 and Ti/Nb5 sites also include oxygen atoms O5, O6, O11, and O14 protruding from the first-type layer and atoms O4 and O12 from the middle of the first-type layer (Figure 7a).
Thus, the Ti/Nb4 octahedron shares four corners (O1, O4, O6, and O14 with Ti/Nb4, La, Ti/Nb5, and the second Ti/Nb5, respectively) and one edge (O5, O11 with the third Ti/Nb5). Similarly, Ti/Nb5 shares the aforementioned corners O2, O6, and O14, as well as O12 with La and the aforementioned edge O5, O11 (Figure 7b).
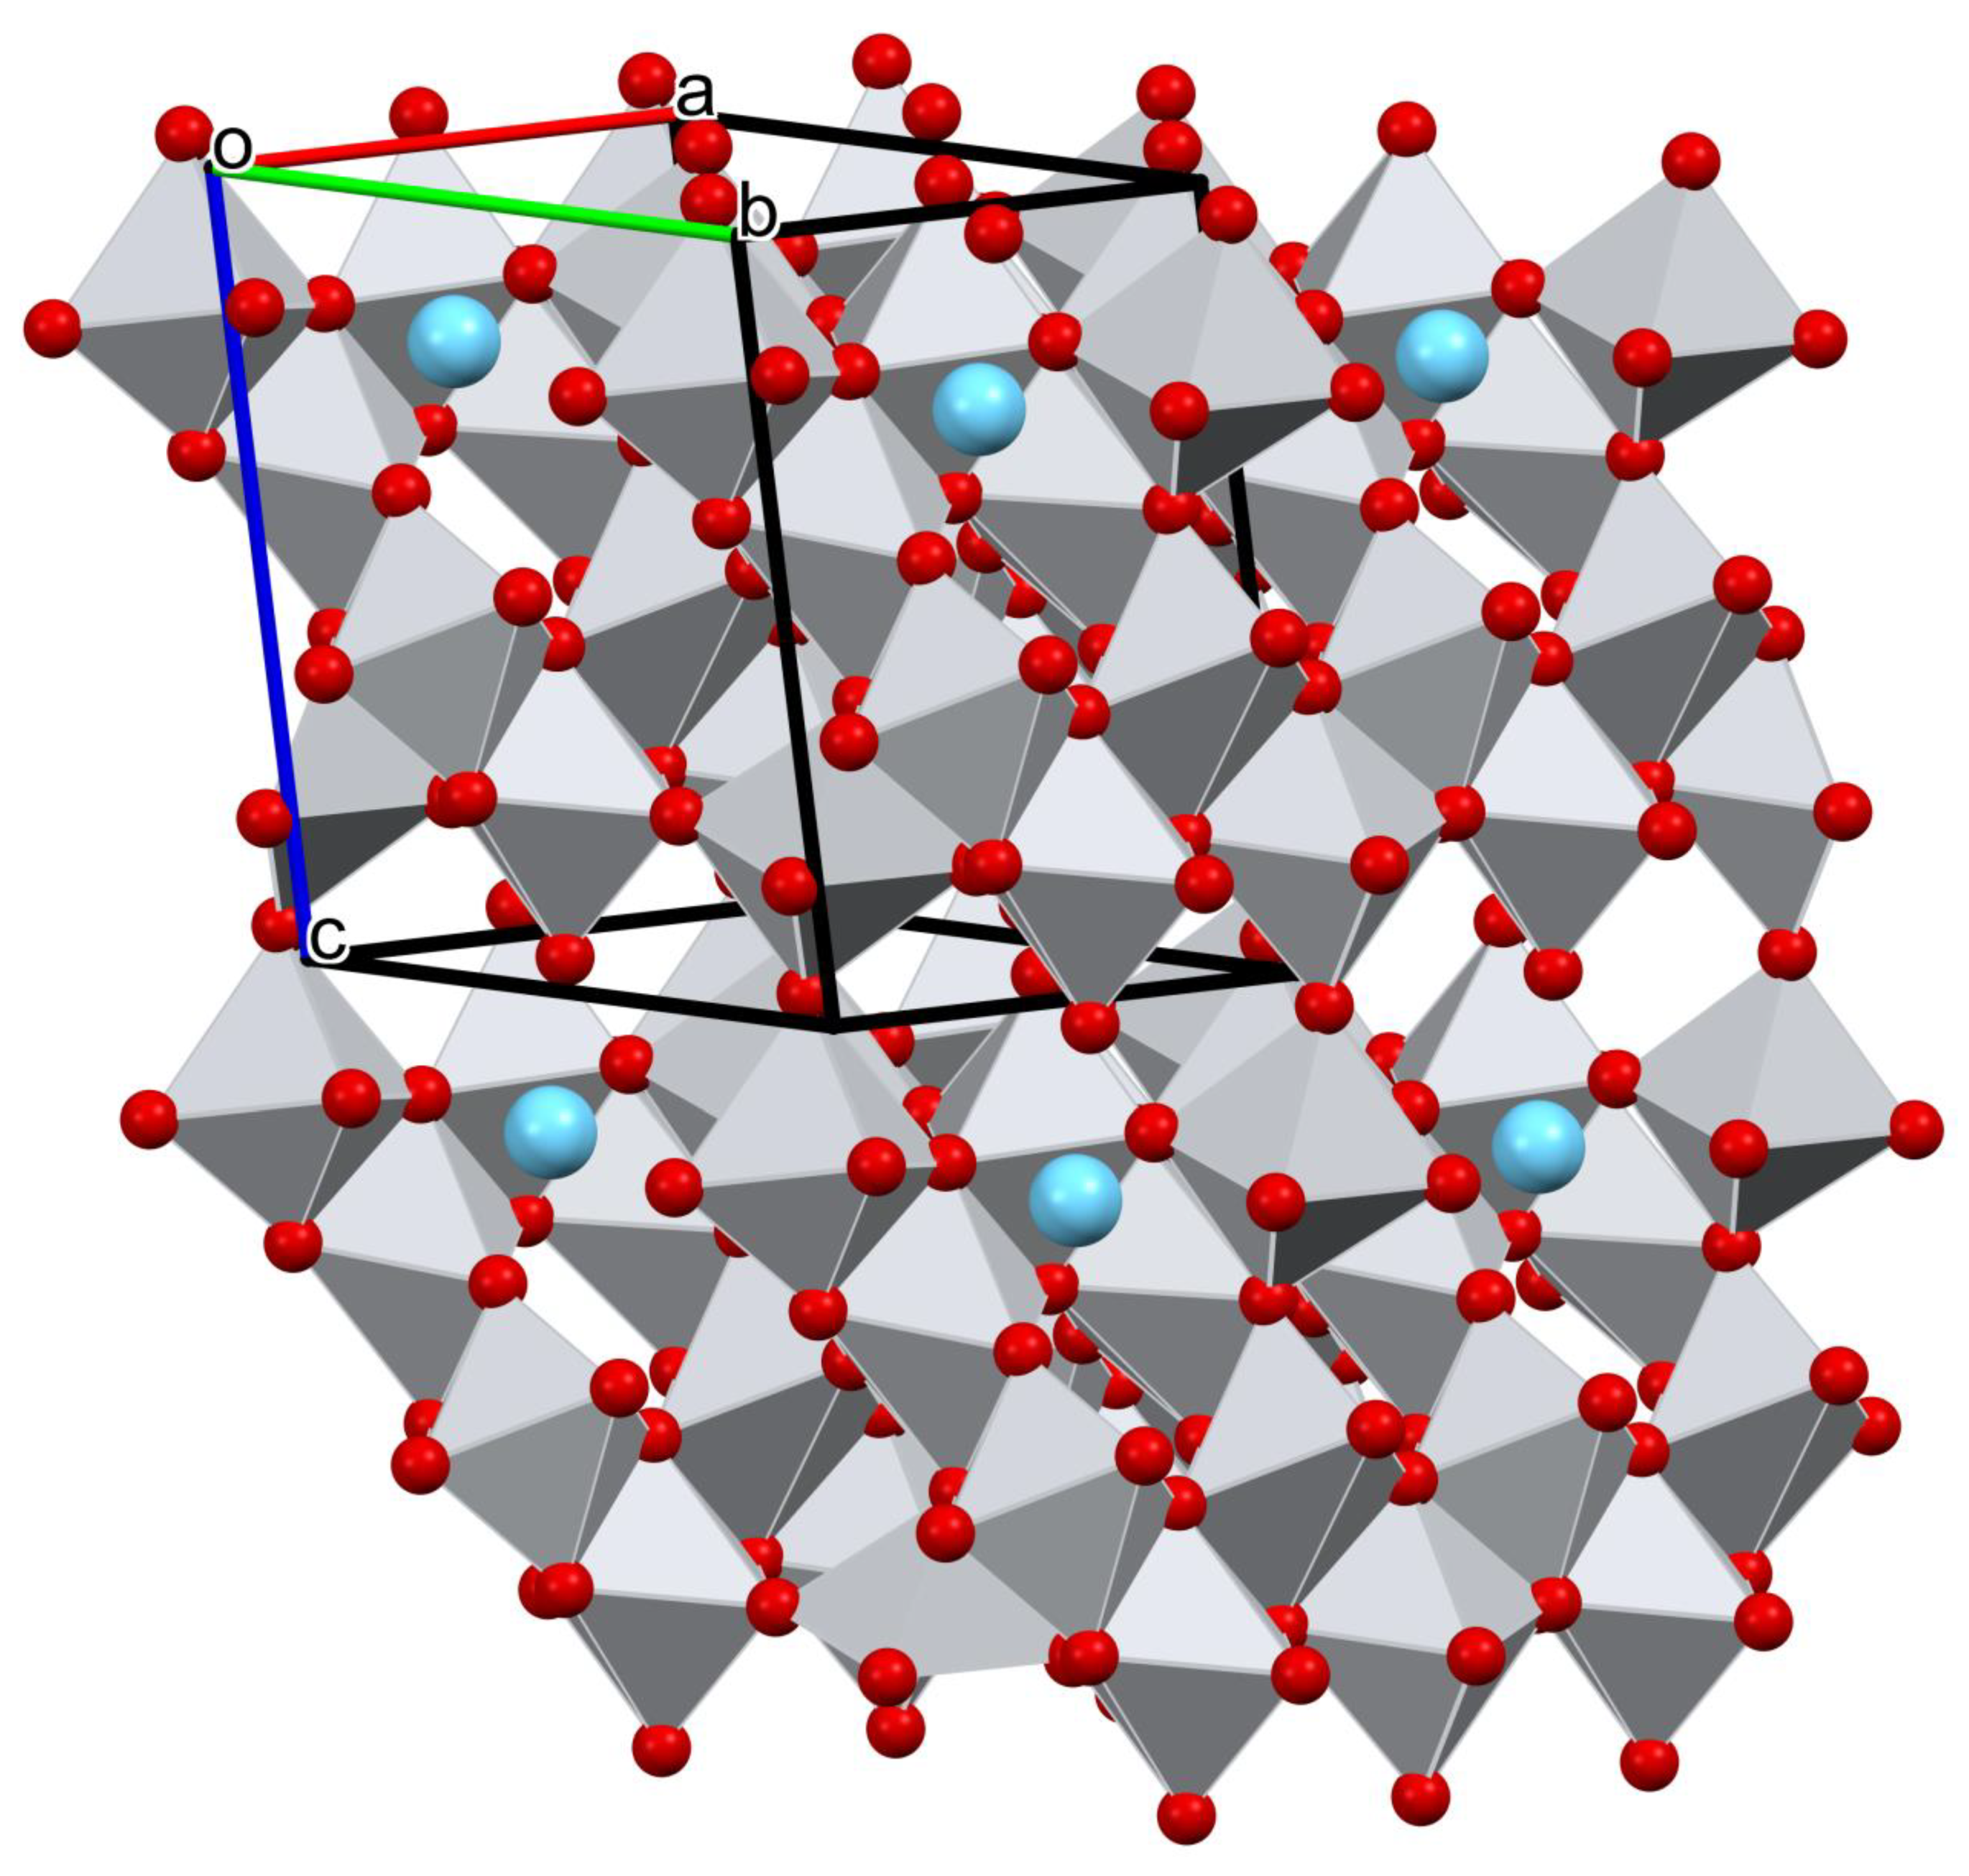
The resulting polyhedral framework is dense and tightly connected in all directions, as shown in Figure 8. As can be seen from the stoichiometry and the fact that it is an end member of a solid solution, the structure remains stable when the lanthanum sites as well as the octahedral sites are not fully occupied. This is necessary to balance the charge when the Ti/Nb ratio changes. During refinement, it was found that Ti and Nb are not evenly distributed among the available sites (Nb prefers sites 2 and 3 and avoids site 4). In addition, vacancies appear to be concentrated in one of the sites (4, see Table 2). This was further investigated by quantum chemical calculations. The preferred occupancy of the sites by Nb or Ti was calculated using DFT, and the results are presented in the following sections. However, vacancies were not part of this study because vacancies are not compatible with the DFT calculations—all crystallographic sites must be fully occupied and ordered for the calculation to be possible.

3.2. DFT Calculations

As described earlier, there are three types of crystallographic sites in the structure of La0.987Ti1.627Nb3.307O13. One partially occupied lanthanum site, five sites unevenly shared by Ti and Nb in the molar ratio of 1.627:3.307 and possibly containing (unevenly distributed) vacancies, and thirteen fully occupied oxygen sites. To make the DFT calculations possible all sites were assumed to be fully occupied, and the Ti:Nb molar ratio was rounded to 2:3. There are 10 ways to distribute 2 Ti and 3 Nb among 5 crystallographic sites, which are called occupational isomers and are referred to as occupational isomers of LNT. The abbreviation LNT is used to emphasize the difference between the experimentally determined structure of La0.987Ti1.627Nb3.307O13 and the simplified approximation used for DFT calculations. In the following, the isomers are presented in the following notation. The occupancy of the sites numbered 1–5 is given in regular order as a set of five designations, where the designation “1” means titanium and the designation “2” means niobium. For example, the notation 12212 means titanium on sites 1 and 4 and niobium on sites 2, 3 and 5.

3.2.1. Optimization of Occupational Isomers

A detailed quantitative comparison between optimized and experimental geometry is rather complicated and requires a complex set of data. The main reason is that in the experimental geometry the Ti/Nb sites are occupied by both atoms at the same time (non-integer occupancies), while in the computational model each site must be occupied by either titanium or niobium. For this reason, no single “optimized geometry” of LNT was obtained by optimization, but a set of ten structures (Table 3). Of course, the optimized structures of the isomers differ among themselves because the Ti and Nb atoms occupy different sites each time and the local environment of Ti is usually different from that of Nb, e.g., the Nb-O distances tend to be longer than those of Ti-O. Cross-comparison between the superimposed isomer pairs shows that the RMSD of the optimized atomic positions is usually about 0.15 Å.
Comparison of the ten optimized isomers with the experimental structure gives a comparable RMSD of equivalent atoms, so that the agreement between the experimental La0.987Ti1.627Nb3.307O13 structure and the optimized isomers is roughly equivalent to the “agreement” between the isomers themselves. This result is virtually independent of the employed functional, pseudopotentials, and basis sets. Importantly, while individual atoms change positions in the course of the optimization (always starting from the experimental structure), the general structural features remain intact, i.e., all the motifs of the diffraction-determined structure described in Section 3.1. are also preserved in the optimized structures of all isomers. In general, the individual computed metal-oxygen distances may differ from the corresponding experimental values by up to 0.1 Å or more, but much of the discrepancy can be attributed to the fact that the experimental structure contains partially occupied Ti/Nb sites, with the corresponding metal-oxygen distances belonging to a weighted average of the Ti-O and Nb-O distances. Nevertheless, no major structural shifts were detected during the optimization that would contradict the structural description presented in Section 3.1.2. Since the experimental and theoretical structural representations differ significantly at the fundamental level, further geometry analysis is neither useful nor practical, but it can be safely inferred that the agreement between the computed and experimental geometries is reasonable.

3.2.2. Thermodynamic Site Preferences

Since the choice of suitable pseudopotentials and basis sets for lanthanum and niobium atoms is rather limited—in contrast to titanium and oxygen, there is much less documented material for La and Nb—we first compared the influence of the choice of pseudopotential and atomic basis set of La and Nb on the computed preferred order of the isomers. We used various combinations of basis functions and pseudopotentials for La and Nb (the basis set for Ti and O was always the same, as described in Section 2) together with the B3LYP functional (rows 1–5 in Table 3). The graphical representation of the relative energies corresponding to these calculations is shown in Figure 9. The variations in the relative energies are very small regardless of the pseudopotential and basis set for La and Nb and are typically in the range of 1 to 2 kcal/mol for all isomers; the choice of pseudopotentials and basis sets has virtually no effect on the preferred order of the isomers. Even when an all-electron basis set is used for both La and Nb—in which case the nonrelativistic approximation becomes unreliable, especially for La—the computed energy pattern of the isomers is virtually the same as in other B3LYP calculations. It appears that the core electrons play virtually no role in the interactions that determine the LNT structure.
Similar to the variation of the basis sets and pseudopotentials, there are only minor changes in the pattern of relative energies when the B3LYP functional is replaced by PBE or BLYP (see rows 6 and 7 in Table 3). This results in the following order of decreasing preference of the isomers:
12212 > 21212 > 22112 > 12221 > 21221 22211 > 22121 > 11222 > 21122 > 12122.
Obviously, all the computational settings used are of comparable accuracy and validity. While no direct validation against experimental results is possible at the level of relative energies, we believe that the observed agreement between the different computational strategies indicates that the computational approach is sufficiently reliable. The good agreement between the experimental and calculated geometry parameters of LNT also supports this assumption. Further evidence of the reliability of the computational method used is presented below.
The total energy range of the isomers is about 35 kcal/mol, and the most favorable six isomers are within the lowest 10 kcal/mol. In contrast to the optimized isomers, the single-point calculations on the diffraction-determined structure yield a much larger energy span (nearly 60 kcal/mol) and much larger energy differences between the isomers. This is due to the fact that the experimental geometry contains partial occupancies of the Ti/Nb sites leading to the averaged geometry of their surroundings (e.g., the metal-oxygen distance in the Ti/NbO6 octahedra lies between the Ti-O and Nb-O distances); as DFT modeling cannot evaluate the concept of partial occupancies, the input structure contains geometric stresses that are significantly reduced by the optimization. In this sense, the optimized geometries and corresponding energies probably provide a more reliable description of the material.
Despite the neglect of the concept of partial occupancies, the calculations presented above can be used to evaluate and validate the relative occupancies of the five Ti/Nb sites obtained by Rietveld refinement. Based on the latter, the partial titanium occupancies of the five Ti/La sites are listed in Table 2. According to these data, the probability of finding a titanium atom is greatest at site 4, followed by sites 1, 5, 2, and 3. Since our LNT model includes ten combinations of two titanium (and three niobium) atoms at the five sites, one can determine the statistical titanium occupancy index for each of the ten isomers by simply calculating the product of the titanium occupancies at the two respective sites. This requires two assumptions: (i) that the titanium (niobium) distribution over the sites is governed thermodynamically, and (ii) that the inclusion of two titanium atoms represents two statistically independent events, such that the probability of finding two titanium atoms at given positions is equal to the product of the probabilities for the presence of titanium at the respective sites. In this way, an experimental sequence of preferred occupancies can be established for the ten isomers considered, as listed in Table 4.
Similar to the procedure described above for converting the experimental data on Ti occupancy at the five sites to the relative stability of the ten isomers, the computed relative energies of the isomers can be converted to the preference of Ti occupancy at the sites. For any given site, an average energy of the isomers can be calculated if that site is occupied by titanium. The average energy as a function of site is shown in Table 5.

4. Discussion

The Inorganic Crystal Structure Database (Release 2022-2) contains 10 structures belonging to the ternary system La2O3-TiO2-Nb2O5. The structural data come from 4 papers [14,15,18,38] and describe phases with 4 different stoichiometries and 6 different structure types. Five of the six structures are orthorhombic, and one is monoclinic. They are relatively simple (containing up to 9 atoms in the asymmetric unit) and in all cases Ti and Nb share crystallographic sites. Only two of the reported structure types are not perovskite-like. This means that the reported structure is by far the most complex among the known structures of the ternary system. Its complexity is probably due to the high niobium content. Structures with higher complexity are known in the binary system La2O3-Nb2O5 (e.g., LaNb7O12 with 21 atoms in the asymmetric unit). The coordination requirements and electroneutrality are obviously difficult to achieve when La and Nb predominate in the structure, and this is reflected in the distortions found in the reported structure, while the crystallochemical features of this material are generally consistent with existing knowledge.
Due to the complexity of the structure, the use of quantum chemical computational methods was important to confirm the reliability of the structural information obtained by diffraction. Although there are some discrepancies between the experimental and calculated order of site preferences presented in Table 4, similarities are evident, and the agreement between experimental results and calculations is reasonable. For example, isomers with titanium at position 4 are among the preferred isomers, and positions 1 and 5 are only slightly less preferred. On the other hand, isomers with Ti at positions 2 or 3 are among the least favored.
Also, the computed Ti site preference order (Table 5) is in very good agreement with the experimental order derived from the Ti site occupancies listed in Table 2; only the order of sites 1 and 5 is reversed. This confirms the reliability of the computational protocols used and validates the experimental results. Although a more quantitative assessment of the relative occupancies of the sites could be performed based on Boltzmann factors, we refrained from doing so because of the obvious overestimation of the energy differences between isomers (sites). For example, the range of average energies in Table 5 is nearly 15 kcal/mol, corresponding to a tentative occupancy ratio of about 1:10−11 between site 4 and site 3 (at room temperature), implying that the relative occupancies of the less favorable sites are largely underestimated. It should be noted, however, that the quantitative assessment of relative occupancies should be based on free energy, which requires the inclusion of thermal fluctuations that are only accessible through computationally intensive protocols and were not considered in the present study. Moreover, only thermodynamic preferences can be evaluated in this way, leaving the kinetic contribution completely unconsidered. All in all, despite the simplification and the limitation to qualitative results, the present computational treatment yields a good agreement with the experimental findings, thus providing valuable feedback and validation of the powder diffraction study of the structure of La0.987Ti1.627Nb3.307O13.

5. Conclusions

The reported structure of La0.987Ti1.627Nb3.307O13 is much more complex than any other previously known ternary structure in the La2O3-TiO2-Nb2O5 system. To determine such a complex structure, the use of complementary methods is essential. The synergy of synchrotron and neutron powder diffraction is well known and proved successful in solving the structure in this case as well. However, we found that the quantum chemical computational methods were very important for validating and confirming even relatively fine details, such as the occupation parameters.
The methodology used for the successful structure determination of La0.987Ti1.627Nb3.307O13 demonstrates the approach that should be used for the further elucidation of the solid solution La3−xTi5−3xNb10−2xO39.5−12.5x and the structure determination of other unknown phases in this ternary system. Although this approach is challenging and time consuming, the better structural insight it can provide will encourage further search for new materials in this interesting system.

Author Contributions

Conceptualization, S.D.Š., A.M. and J.S.; software, A.M. and J.S.; validation, M.S.; formal analysis, K.S., A.M. and J.S.; investigation, S.D.Š. and K.S.; resources, A.M. and M.S.; data curation, A.M.; writing—original draft preparation, K.S.; writing—review and editing, A.M., S.D.Š. and J.S.; visualization, K.S. and A.M.; supervision, M.S.; project administration, A.M. and M.S.; funding acquisition, A.M., J.S. and M.S. All authors have read and agreed to the published version of the manuscript.

Funding

This research was funded by the Slovenian Research Agency, grant numbers P1-0175, P2-0091 and P1-0012.

Institutional Review Board Statement

Not applicable.

Informed Consent Statement

Not applicable.

Data Availability Statement

Further details of the crystal structure investigations may be obtained from the joint CCDC/FIZ Karlsruhe online deposition service: https://www.ccdc.cam.ac.uk/structures/?, accessed on 2 March 2023 by quoting the deposition number CSD-2240262.

Acknowledgments

The authors thank Wouter van Beek, SNBL, ESRF, Grenoble, France, and Denis Sheptyakov, PSI Villingen, Switzerland, for collecting the synchrotron and neutron [39] diffraction patterns of the material described here. This work is partly based on experiments performed at the Swiss spallation neutron source SINQ, Paul Scherrer Institute, Villigen, Switzerland.

Conflicts of Interest

The authors declare no conflict of interest.

References

  1. Savchenko, E.P.; Godina, N.A.; Keler, É.K. Solid-Phase Reactions between Pentoxides of Niobium and Tantalum and Oxides of the Rare-Earth Elements. In Chemistry of High-Temperature Materials; Springer: Boston, MA, USA, 1969; pp. 108–113. [Google Scholar]
  2. MacChesney, J.B.; Sauer, H.A. The System La2O3—TiO5; Phase Equilibria and Electrical Properties. J. Am. Ceram. Soc. 1962, 45, 416–422. [Google Scholar] [CrossRef]
  3. Latie, L.; Villeneuve, G.; Conte, D.; le Flem, G. Ionic Conductivity of Oxides with General Formula LixLn1/3Nb1-XTixO3 (Ln = La, Nd). J. Solid State Chem. 1984, 51, 293–299. [Google Scholar] [CrossRef]
  4. Nadiri, A.; le Flem, G.; Delmas, C. Lithium Intercalation in Ln1/3NbO3 Perovskite-Type Phases (Ln = La, Nd). J. Solid State Chem. 1988, 73, 338–347. [Google Scholar] [CrossRef]
  5. Belous, A.; Pashkova, E.; Gavrilenko, O.; V’yunov, O.; Kovalenko, L. Solid Electrolytes Based on Lithium-Containing Lanthanum Metaniobates. J. Eur. Ceram. Soc. 2004, 24, 1301–1304. [Google Scholar] [CrossRef]
  6. Takahashi, J.; Kageyama, K.; Hayashi, T. Dielectric Properties of Double-Oxide Ceramics in the System Ln2O3-TiO2 (Ln = La, Nd and Sm). Jpn. J. Appl. Phys. 1991, 30, 2354–2358. [Google Scholar] [CrossRef]
  7. Škapin, S.D.; Kolar, D.; Suvorov, D. Phase Stability and Equilibria in the La2O3-TiO2 System. J. Eur. Ceram. Soc. 2000, 20, 1179–1185. [Google Scholar] [CrossRef]
  8. Škapin, S.; Kolar, D.; Suvorov, D. X-ray Diffraction and Microstructural Investigation of the Al2O3-La2O3-TiO2 System. J. Am. Ceram. Soc. 1993, 76, 2359–2362. [Google Scholar] [CrossRef]
  9. Suvorov, D.; Valant, M.; Škapin, S.; Kolar, D. Microwave Dielectric Properties of Ceramics with Compositions along the La2/3TiO3(STAB)-LaAlO3 Tie Line. J. Mater. Sci. 1998, 33, 85–89. [Google Scholar] [CrossRef]
  10. Škapin, S.D.; Škapin, A.S.; Suvorov, D.; Gaberšček, M. A Stabilization Mechanism for the Perovskite La2/3TiO3 Compound with Fe2O3: A Structural and Electrical Investigation. J. Eur. Ceram. Soc. 2008, 28, 2025–2032. [Google Scholar] [CrossRef]
  11. Inaguma, Y.; Katsumata, T.; Itoh, M.; Morii, Y. Crystal Structure of a Lithium Ion-Conducting Perovskite La2/3-XLi3xTiO3 (x = 0.05). J. Solid State Chem. 2002, 166, 67–72. [Google Scholar] [CrossRef]
  12. Golobič, A.; Meden, A.; Spreitzer, M.; Škapin, S.D. Phase Equilibria and Microwave Dielectric Properties in the Ternary La2O3–TiO2–Nb2O5 System. J. Eur. Ceram. Soc. 2021, 41, 7035–7043. [Google Scholar] [CrossRef]
  13. Yoshioka, H. Structure and Electrical Properties of A-Site-Deficient Perovskite Compounds in the La2/3TiO3-La1/3NbO3 System. J. Am. Ceram. Soc. 2002, 85, 1339–1342. [Google Scholar] [CrossRef]
  14. Ali, R.; Yashima, M.; Tanaka, M.; Yoshioka, H.; Mori, T.; Sasaki, S. High-Temperature Synchrotron X-Ray Powder Diffraction Study of the Orthorhombic-Tetragonal Phase Transition in La0.63(Ti0.92, Nb0.08)O3. J. Solid State Chem. 2002, 164. [Google Scholar] [CrossRef]
  15. Yashima, M.; Mori, M.; Kamiyama, T.; Oikawa, K.I.; Hoshikawa, A.; Torii, S.; Saitoh, K.; Tsuda, K. High-Temperature Phase Transition in Lanthanum Titanate Perovskite La0.64(Ti0.92,Nb0.08)O3. Chem. Phys. Lett. 2003, 375, 240–246. [Google Scholar] [CrossRef]
  16. Zhang, J.; Zuo, R. A Novel Self-Composite Property-Tunable LaTiNbO6 Microwave Dielectric Ceramic. Mater. Res. Bull. 2016, 83, 568–572. [Google Scholar] [CrossRef]
  17. Bian, J.J.; Li, Y.Z.; Yuan, L.L. Structural Stability and Microwave Dielectric Properties of (1 − x)Ln1/3NbO3-XLn2/3TiO3 (Ln: La, Nd; 0 ≤ x ≤ 0.8). Mater. Chem. Phys. 2009, 116, 102–106. [Google Scholar] [CrossRef]
  18. Golobič, A.; Škapin, S.D.; Suvorov, D.; Meden, A. Solving Structural Problems of Ceramic Materials. Croat. Chem. Acta 2004, 77, 435–446. [Google Scholar]
  19. Strahov, V.I.; Meljnikova, O.V.; Dib, M.; Pivovarova, A.P.; Karpinskaja, O.V. LaNb3O9-TiO2-Politermiceskoe Secenie v Sisteme La2O3-TiO2-Nb2O5. Zh. Neorg. Khim. 1996, 41, 1373–1375. [Google Scholar]
  20. Schouwink, P.; Didelot, E.; Lee, Y.S.; Mazet, T.; Černý, R. Structural and Magnetocaloric Properties of Novel Gadolinium Borohydrides. J. Alloys Compd. 2016, 664, 378–384. [Google Scholar] [CrossRef]
  21. Werner, P.E.; Eriksson, L.; Westdahl, M. TREOR, a Semi-Exhaustive Trial-and-Error Powder Indexing Program for All Symmetries. J. Appl. Crystallogr. 1985, 18, 367–370. [Google Scholar] [CrossRef]
  22. Visser, J.W. Fully Automatic Program for Finding the Unit Cell from Powder Data. J. Appl. Crystallogr. 1969, 2, 367–370. [Google Scholar] [CrossRef]
  23. Favre-Nicolin, V.; Černý, R. FOX, “Free Objects for Crystallography”: A Modular Approach to Ab Initio Structure Determination from Powder Diffraction. J. Appl. Crystallogr. 2002, 35, 734–743. [Google Scholar] [CrossRef] [Green Version]
  24. Coelho, A.A. TOPAS and TOPAS-Academic: An Optimization Program Integrating Computer Algebra and Crystallographic Objects Written in C++. J. Appl. Crystallogr. 2018, 51, 210–218. [Google Scholar] [CrossRef] [Green Version]
  25. Dovesi, R.; Orlando, R.; Civalleri, B.; Roetti, C.; Saunders, V.R.; Zicovich-Wilson, C.M. CRYSTAL: A Computational Tool for the Ab Initio Study of the Electronic Properties of Crystals. Z. Krist. 2005, 220, 571–573. [Google Scholar] [CrossRef]
  26. Bredow, T.; Heitjans, P.; Wilkening, M. Electric Field Gradient Calculations for LixTiS2 and Comparison with 7Li NMR Results. Phys. Rev. B Condens. Matter. Mater. Phys. 2004, 70, 115111–115119. [Google Scholar] [CrossRef] [Green Version]
  27. Corà, F. The Performance of Hybrid Density Functionals in Solid State Chemistry: The Case of BaTiO3. Mol. Phys. 2005, 103, 2483–2496. [Google Scholar] [CrossRef]
  28. Scaranto, J.; Giorgianni, S. A Quantum-Mechanical Study of CO Adsorbed on TiO2: A Comparison of the Lewis Acidity of the Rutile (1 1 0) and the Anatase (1 0 1) Surfaces. J. Mol. Struct. THEOCHEM 2008, 858, 72–76. [Google Scholar] [CrossRef]
  29. Towler, M.D.; Allan, N.L.; Harrison, N.M.; Saunders, V.R.; MacKrodt, W.C.; Aprà, E. Ab Initio Study of MnO and NiO. Phys. Rev. B 1994, 50, 5041–5054. [Google Scholar] [CrossRef]
  30. Ferrari, A.M.; Pisani, C. An Ab Initio Periodic Study of NiO Supported at the Pd(100) Surface. Part 1: The Perfect Epitaxial Monolayer. J. Phys. Chem. B 2006, 110, 7909–7917. [Google Scholar] [CrossRef]
  31. CRYSTAL. Available online: https://www.crystal.unito.it/basis_sets.html (accessed on 23 February 2023).
  32. Dall’Olio, S.; Dovesi, R.; Resta, R. Spontaneous Polarization as a Berry Phase of the Hartree-Fock Wave Function: The Case of KNbO3. Phys. Rev. B Condens. Matter. Mater. Phys. 1997, 56, 10105–10114. [Google Scholar] [CrossRef]
  33. Nb_986-31(631d)G_dallolio_1996. Available online: https://www.crystal.unito.it/Basis_Sets/niobium.html#Nb_986-31%28631d%29G_dallolio_1996 (accessed on 23 February 2023).
  34. Yang, J.; Dolg, M. Valence Basis Sets for Lanthanide 4f-in-Core Pseudopotentials Adapted for Crystal Orbital Ab Initio Calculations. Theor. Chem. Acc. 2005, 113, 212–224. [Google Scholar] [CrossRef]
  35. Towler, M. CRYSTAL Resources Page. Available online: https://vallico.net/mike_towler/crystal.html (accessed on 23 February 2023).
  36. Monkhorst, H.J.; Pack, J.D. Special Points for Brillouin-Zone Integrations. Phys. Rev. B 1976, 13, 5188–5192. [Google Scholar] [CrossRef]
  37. Stokes, H.T.; Hatch, D.M. FINDSYM: Program for Identifying the Space-Group Symmetry of a Crystal. J. Appl. Crystallogr. 2005, 38, 237–238. [Google Scholar] [CrossRef] [Green Version]
  38. Fauquier, D.; Gasperin, M. Synthèse de Monocristaux et Étude Structurale de La Nb TiO6. Bull. Soc. franç. Min. Cristallogr. 1970, 93, 258–259. [Google Scholar] [CrossRef]
  39. Fischer, P.; Frey, G.; Koch, M.; Konnecke, M.; Pomjakushin, V.; Schefer, J.; Thut, R.; Schlumpf, N.; Burge, R.; Greuter, U.; et al. High-Resolution Powder Diffractometer HRPT for Thermal Neutrons at SINQ. Physica B Condens. Matter 2000, 276–278, 146–147. [Google Scholar] [CrossRef]
Figure 1. (a) FESEM micrograph of the single phase ceramic based on the composition corresponding to La2.96Ti4.88Nb9.92O39, sintered at 1300 °C, and (b) graph of the EDS analysis of the ceramic.
Crystals 13 00439 g001
Figure 2. The relation between triclinic (black lines and letters) and monoclinic (blue lines and letters) unit cells. Origin is the same, small yellow spheres are the lattice points.
Crystals 13 00439 g002
Figure 3. The final Rietveld diagram of La0.987Ti1.627Nb3.307O13 on the synchrotron diffraction pattern. The measured (blue) and calculated (red) lines are superimposed, while the gray line below represents the difference. Vertical bars at the bottom mark the reflection positions.
Crystals 13 00439 g003
Figure 4. The final Rietveld diagram of La0.987Ti1.627Nb3.307O13 on the neutron diffraction pattern. The measured (blue) and calculated (red) lines are superimposed, while the gray line below represents the difference. Vertical bars at the bottom mark the reflection positions.
Crystals 13 00439 g004
Figure 5. The structure of the sublayer containing La, Ti/Nb 1,2,3 and O3, O4, O7, O8, O12, O13 sites. The pseudo-hexagonal arrangement in this sublayer is clearly visible: (a) Ball and stick model with atom labelling; (b) Polyhedral representation.
Crystals 13 00439 g005
Figure 6. Connection of two adjacent layers of the first type by the oxygen bridges—ball and stick model with atom labelling.
Crystals 13 00439 g006
Figure 7. Layer of the second type (Ti/Nb4 and Ti/Nb5) embedded between layers of the first type (La, Ti/Nb1, Ti/Nb2 and Ti/Nb3): (a) Ball and stick model with atom labelling; (b) Polyhedral representation.
Crystals 13 00439 g007
Figure 8. Polyhedral representation of the structure La0.987Ti1.627Nb3.307O13. The octahedra have oxygen atoms in the corners and either titanium or niobium atoms in the center. The lanthanum atoms are drawn as small spheres. The unit cell is also outlined.
Crystals 13 00439 g008
Figure 9. Relative energies of the ten LNT occupational isomers calculated with the B3LYP functional and with various pseudopotentials and basis sets (Table 3, rows 1–5). For each set of calculations, the zero value corresponds to the energy average of all isomers in that set.
Crystals 13 00439 g009
Table 1. Crystal data and Rietveld refinement parameters of La0.987Ti1.627Nb3.307O13.
ParameterSynchrotron DataNeutron Data
Space group P 1 ¯ P 1 ¯
a [Å]7.3321 (3)7.331 (2)
b [Å]7.4214 (4)7.418 (3)
c [Å]10.6730 (5)10.672 (4)
α [°]84.153 (4)84.14 (2)
β [°]80.159 (5)80.16 (3)
γ [°]60.367 (5)60.37 (3)
V [Å3]497.28 (5) 1496.9 (4) 1
TemperatureAmbient 2Ambient 2
Wavelength [Å]0.499981.494
Used 2θmin, 2θmax [°]3.999, 44.0017.000, 147.000
Used dmax, dmin [Å]7.165, 0.66712.236, 0.779
No. of profile points133352801
No. of reflections36152220
No. of profile parameters25 324 3
No. of structural parameters6868
No. of restraints (occ.)55
Rexp [%]2.2711.717
Rp [%]3.9803.686
Rwp [%]4.9694.663
1 The unit cell was refined separately to account for possible temperature differences between data collections. 2 The temperature of the sample was not controlled. 3 Unit cell parameters were counted as profile parameters since they do not affect intensities.
Table 2. Fractional atomic coordinates, site occupation parameters and atomic displacement parameters of La0.987Ti1.627Nb3.307O13.
LabelxyzOcc.Biso
La0.7995 (4)0.7550 (2)0.78768 (10)0.9870.26 (2)
Ti10.2122 (6)0.7407 (4)0.1734 (2)0.4580.107 (12)
Nb10.2122 (6)0.7407 (4)0.1734 (2)0.5420.107 (12)
Ti20.2911 (5)0.2594 (3)0.82544 (17)0.1730.107 (12)
Nb20.2911 (5)0.2594 (3)0.82544 (17)0.8270.107 (12)
Ti30.7093 (5)0.2402 (3)0.1775 (4)0.1030.107 (12)
Nb30.7093 (5)0.2402 (3)0.1775 (4)0.8970.107 (12)
Ti40.1090 (7)0.2489 (4)0.5639 (2)0.5850.107 (12)
Nb40.1090 (7)0.2489 (4)0.5639 (2)0.3490.107 (12)
Ti50.3692 (5)0.7842 (3)0.45570 (18)0.3080.107 (12)
Nb50.3692 (5)0.7842 (3)0.45570 (18)0.6920.107 (12)
O10.00.50.51.00.77 (2)
O20.50.50.51.00.77 (2)
O30.4030 (10)0.4478 (10)0.2108 (6)1.00.77 (2)
O40.0223 (13)0.3255 (7)0.7700 (4)1.00.77 (2)
O50.2933 (12)0.8649 (7)0.6191 (4)1.00.77 (2)
O60.1443 (17)0.7719 (8)0.3890 (4)1.00.77 (2)
O70.0117 (10)0.0390 (10)0.1744 (5)1.00.77 (2)
O80.2104 (10)0.5593 (10)0.7863 (6)1.00.77 (2)
O90.7311 (16)0.2901 (7)0.9985 (5)1.00.77 (2)
O100.2333 (16)0.2847 (8)0.9891 (4)1.00.77 (2)
O110.7829 (11)0.9077 (6)0.5820 (4)1.00.77 (2)
O120.5924 (11)0.1835 (7)0.7838 (4)1.00.77 (2)
O130.3885 (10)0.9608 (10)0.8278 (6)1.00.77 (2)
O140.3637 (16)0.2213 (8)0.6106 (4)1.00.77 (2)
Table 3. Relative energies of the ten occupational isomers of LNT calculated with different functionals, pseudopotentials, and basis sets. Abbreviations of pseudopotentials: SDD—Stuttgart-Dresden type, HAY—Hay-Wadt type, None—no pseudopotential (all electron basis set). The “Opt?” field indicates whether atomic position optimization was performed or whether it is a single point calculation. Note that for each set of calculations in a given row, the zero value is defined as the energy average of all ten isomers.
Functional/PseudopotentialsOpt?Relative Energies of Isomers [kcal/mol]
DFTPP LaPP Nb11222121221221212221211222121221221221122212122211
B3LYPSDDHAYYes5.9518.65−13.30−4.3715.22−9.33−3.62−6.890.27−2.72
B3LYPHAYHAYYes6.5517.70−13.54−5.0515.95−8.42−3.03−7.030.17−2.89
B3LYPSDDNoneYes6.6120.72−12.87−4.3817.01−9.88−3.26−7.041.59−3.41
B3LYPHAYNoneYes6.3620.27−13.67−5.0116.94−10.49−3.68−7.811.00−4.05
B3LYPNoneNoneYes6.3120.64−13.66−5.3017.87−10.29−3.82−7.171.16−3.49
PBESDDHAYYes5.8516.84−11.77−3.8313.72−8.38−3.42−6.430.31−1.81
BLYPSDDHAYYes6.9017.30−12.02−4.3514.84−8.79−3.55−6.600.09−2.79
B3LYPSDDHAYNo22.7427.81−31.10−0.7131.03−22.905.78−25.207.02−12.61
Table 4. Experimental (based on Ti site occupancies) and calculated (based on energy) site preference orders of the ten LNT isomers. The statistical occupancy index is calculated as the product of the Ti occupancies of the two respective sites. The relative energies refer to the calculations listed in the first row of Table 3.
Site IsomerTitanium
on Sites
Statistical
Occupancy
Index (exp.)
Preference
Order
(exp.)
Relative
Energy
[kcal/mol]
Preference
Order
(calc.)
112221 and 20.0797.5.958.
121221 and 30.1035.18.6510.
122121 and 40.2681.−13.301.
122211 and 50.1413.−4.374.
211222 and 30.01810.15.229.
212122 and 40.1016.−9.332.
212212 and 50.0539.−3.625.
221123 and 40.0608.−6.893.
221213 and 50.0329.0.277.
222114 and 50.1802.−2.726.
112221 and 20.0797.5.958.
Table 5. Average energy of isomers with a given site occupied by titanium, together with the calculated and experimental order of Ti site preference. The isomers considered in the averaging are listed for each site. The relative energies refer to the calculations listed in the first row of Table 3. The experimental preference order is derived from Table 2.
Ti on SiteConsidered IsomersAverage Energy
of Isomers
Preference
Order
(calc.)
Preference
Order
(exp.)
111222, 12122, 12212, 122211.733.2.
211222, 21122, 21212, 212212.064.4.
312122, 21122, 22112, 221216,815.5.
412212, 21212, 22112, 22211−8.061.1.
512221, 21221, 22121, 22211−2.612.3.
Disclaimer/Publisher’s Note: The statements, opinions and data contained in all publications are solely those of the individual author(s) and contributor(s) and not of MDPI and/or the editor(s). MDPI and/or the editor(s) disclaim responsibility for any injury to people or property resulting from any ideas, methods, instructions or products referred to in the content.