1. Introduction
Welding-induced stress and deformation have remained major challenges in manufacturing. In the past decades, extensive experimental efforts have been made to deeply understand and effectively control residual stresses and welding distortions in welded joints or structures [
1,
2,
3,
4]. Concerning predicting residual stress and welding distortion using computational tools and assessing the performance of welded structures in service, tremendous work has also been reported in the recent two decades [
5,
6,
7,
8].With the improvement of computational welding mechanics and the rapid development of computer hardware, numerical simulation technology has begun to move from laboratories to engineering applications [
9,
10], and it is playing a more and more important role in product designs as well as manufacturing processes.
In recent years, complex aluminum alloy welded structures have been widely used for weight reduction in aviation, shipbuilding, rail vehicles, and automobile industries [
11]. Fusion welding is one of the most important joining processes for lightweight structure assembly due to its advantages such as flexibility in design, high production efficiency, and low cost. However, fusion welding has the characteristics of rapid local heating and fast cooling, which can produce thermal expansion and contraction, cause transient stress, and eventually generate uneven residual stress and deformation in the whole weldment. Transient stress during the welding process sometimes directly leads to cracking in welded joints or structures, while residual stress has a negative impact on fatigue strength, stress corrosion resistance, and even structural stability [
12,
13,
14,
15]. Therefore, how to regulate and mitigate the transient stress of a welded structure during the assembly process and the residual stress after welding have become highly valued topics in manufacturing.
Typically, there are two methods to obtain the residual stress distribution of welded structures. One method is the experimental method, and the other method is numerical simulation technology. So far, researchers have proposed more than a dozen experimental methods, including the X-ray diffraction method, neutron diffraction method, hole-drilling method, deep hole-drilling method, slice method, contour method, etc., to measure residual stress distribution [
16,
17]. Nevertheless, the existing experimental methods can only measure welding residual stress in a specific position, and most of the methods are limited to measuring residual stresses on and near the surface of the weldment. As compared with an experimental method, a numerical simulation method can obtain the residual stress at any position of the weldment, and can also capture the transient stress at any time and at any position during the welding process [
18,
19,
20]. Therefore stress information provided by numerical simulation technology can be directly used to optimize the structural design and the welding procedure during the manufacturing stage.
A welding simulation of a large-size and complex component requires tremendous computational resources. In many cases, the influence of welding sequence, external restraint (fixture), and welding parameters on mechanical behaviors should be carefully considered [
21]. Moreover, a welding simulation usually requires a transient analysis to capture the response of mechanical behavior during the welding process, which is highly nonlinear, and it makes a welding simulation very difficult to converge. In addition, a welding simulation requires quality finite element meshing with sufficient mesh density along welds and its heat-affected zone. This requires both time and expertise in mesh design, and usually results in a large number of degrees of freedom in the finite element model. Generally, the computing cost quadruples with the number of nodes. Despite fast-growing computer hardware, the complexity of an industrial problem can easily make it not feasible to complete a simulation mode in an acceptable turnaround time. Therefore, decisions must be made to balance the computing time and the computational accuracy in many cases.
If the object of a study is a complex welded structure with complicated shape and a large number of welds, it is difficult to obtain the residual stress of the structure by using the conventional thermo-elastic-plastic finite element method with a moving heat source model. In order to overcome this difficulty, a numerical simulation method which could significantly improve the computational efficiency by simplifying the welding heat source model was proposed in the current study. In the proposed method, an instantaneous heat source model is used to replace the traditional moving heat source model.
Unlike a traditional moving heat source model, an instantaneous heat source model exerts heat flux in the whole weld pass at the same time. Such a simplified model neglects the moving effect of the arc, while it reduces computing time to a large extent. Kasuya et al. [
22] used an instantaneous line heat source model to predict the welding thermal cycle. Applicable conditions and the calculation accuracy have been examined by Terasaki et al. [
23]. Regarding the use of an instantaneous volumetric heat source model and weld pass merging technology to simulate welding residual stress in multi-layer and multi-pass welded joints of thick plate, Hu and his co-workers [
24] reported on a method to effectively calculate residual stress distribution of an austenitic stainless steel butt-welded joint. The simulation results showed that the above two technologies could significantly shorten the computing time without excessive loss of calculation accuracy. For austenitic stainless steel, the speed of thermal conduction is far slower than the speed of torch moving due to its relatively low thermal conductivity. Thus, even if an instantaneous heat source model is used, an accurate result of temperature field can be obtained by using a finite element method. However, for an aluminum alloy weldment, because of its relatively high thermal conductivity, it is necessary to judge whether the above method is suitable or not.
External restraint has been widely used in industry to control welding distortion. It has been proven that external restraint can effectively control out-of-plane deformation [
25]. In addition, external restraint can alter welding-induced plastic strain [
21], and this can significantly affect the transient stress during welding.
In the current study, an A6061 aluminum alloy bead-on-plate model with a length of 300 mm, a width of 200 mm, and a thickness of 10 mm was established based on the software MSC Marc, which has superior calculation speed, and therefore, is more preferable for large-scale models than other software. The welding temperature field and residual stress were calculated using both a moving heat source model and an instantaneous heat source model. The effectiveness of the method with an instantaneous heat source model was verified by comparing its simulated results with the results obtained using the moving heat source model. After verification, a simplified method was employed to simulate welding stress including transient and stresses for the A6061 weldment. Moreover, the transient stress in a key location was examined based on the simulated results, and the reason for the cracking during the welding process was clarified. In addition, the influences of external restraint intensity on the transient stress at the key location were investigated numerically. Finally, based on the simulation results, measures to reduce transient stress and cracking risk were put forward by adjusting the locations of fixture.
2. Experimental Procedure
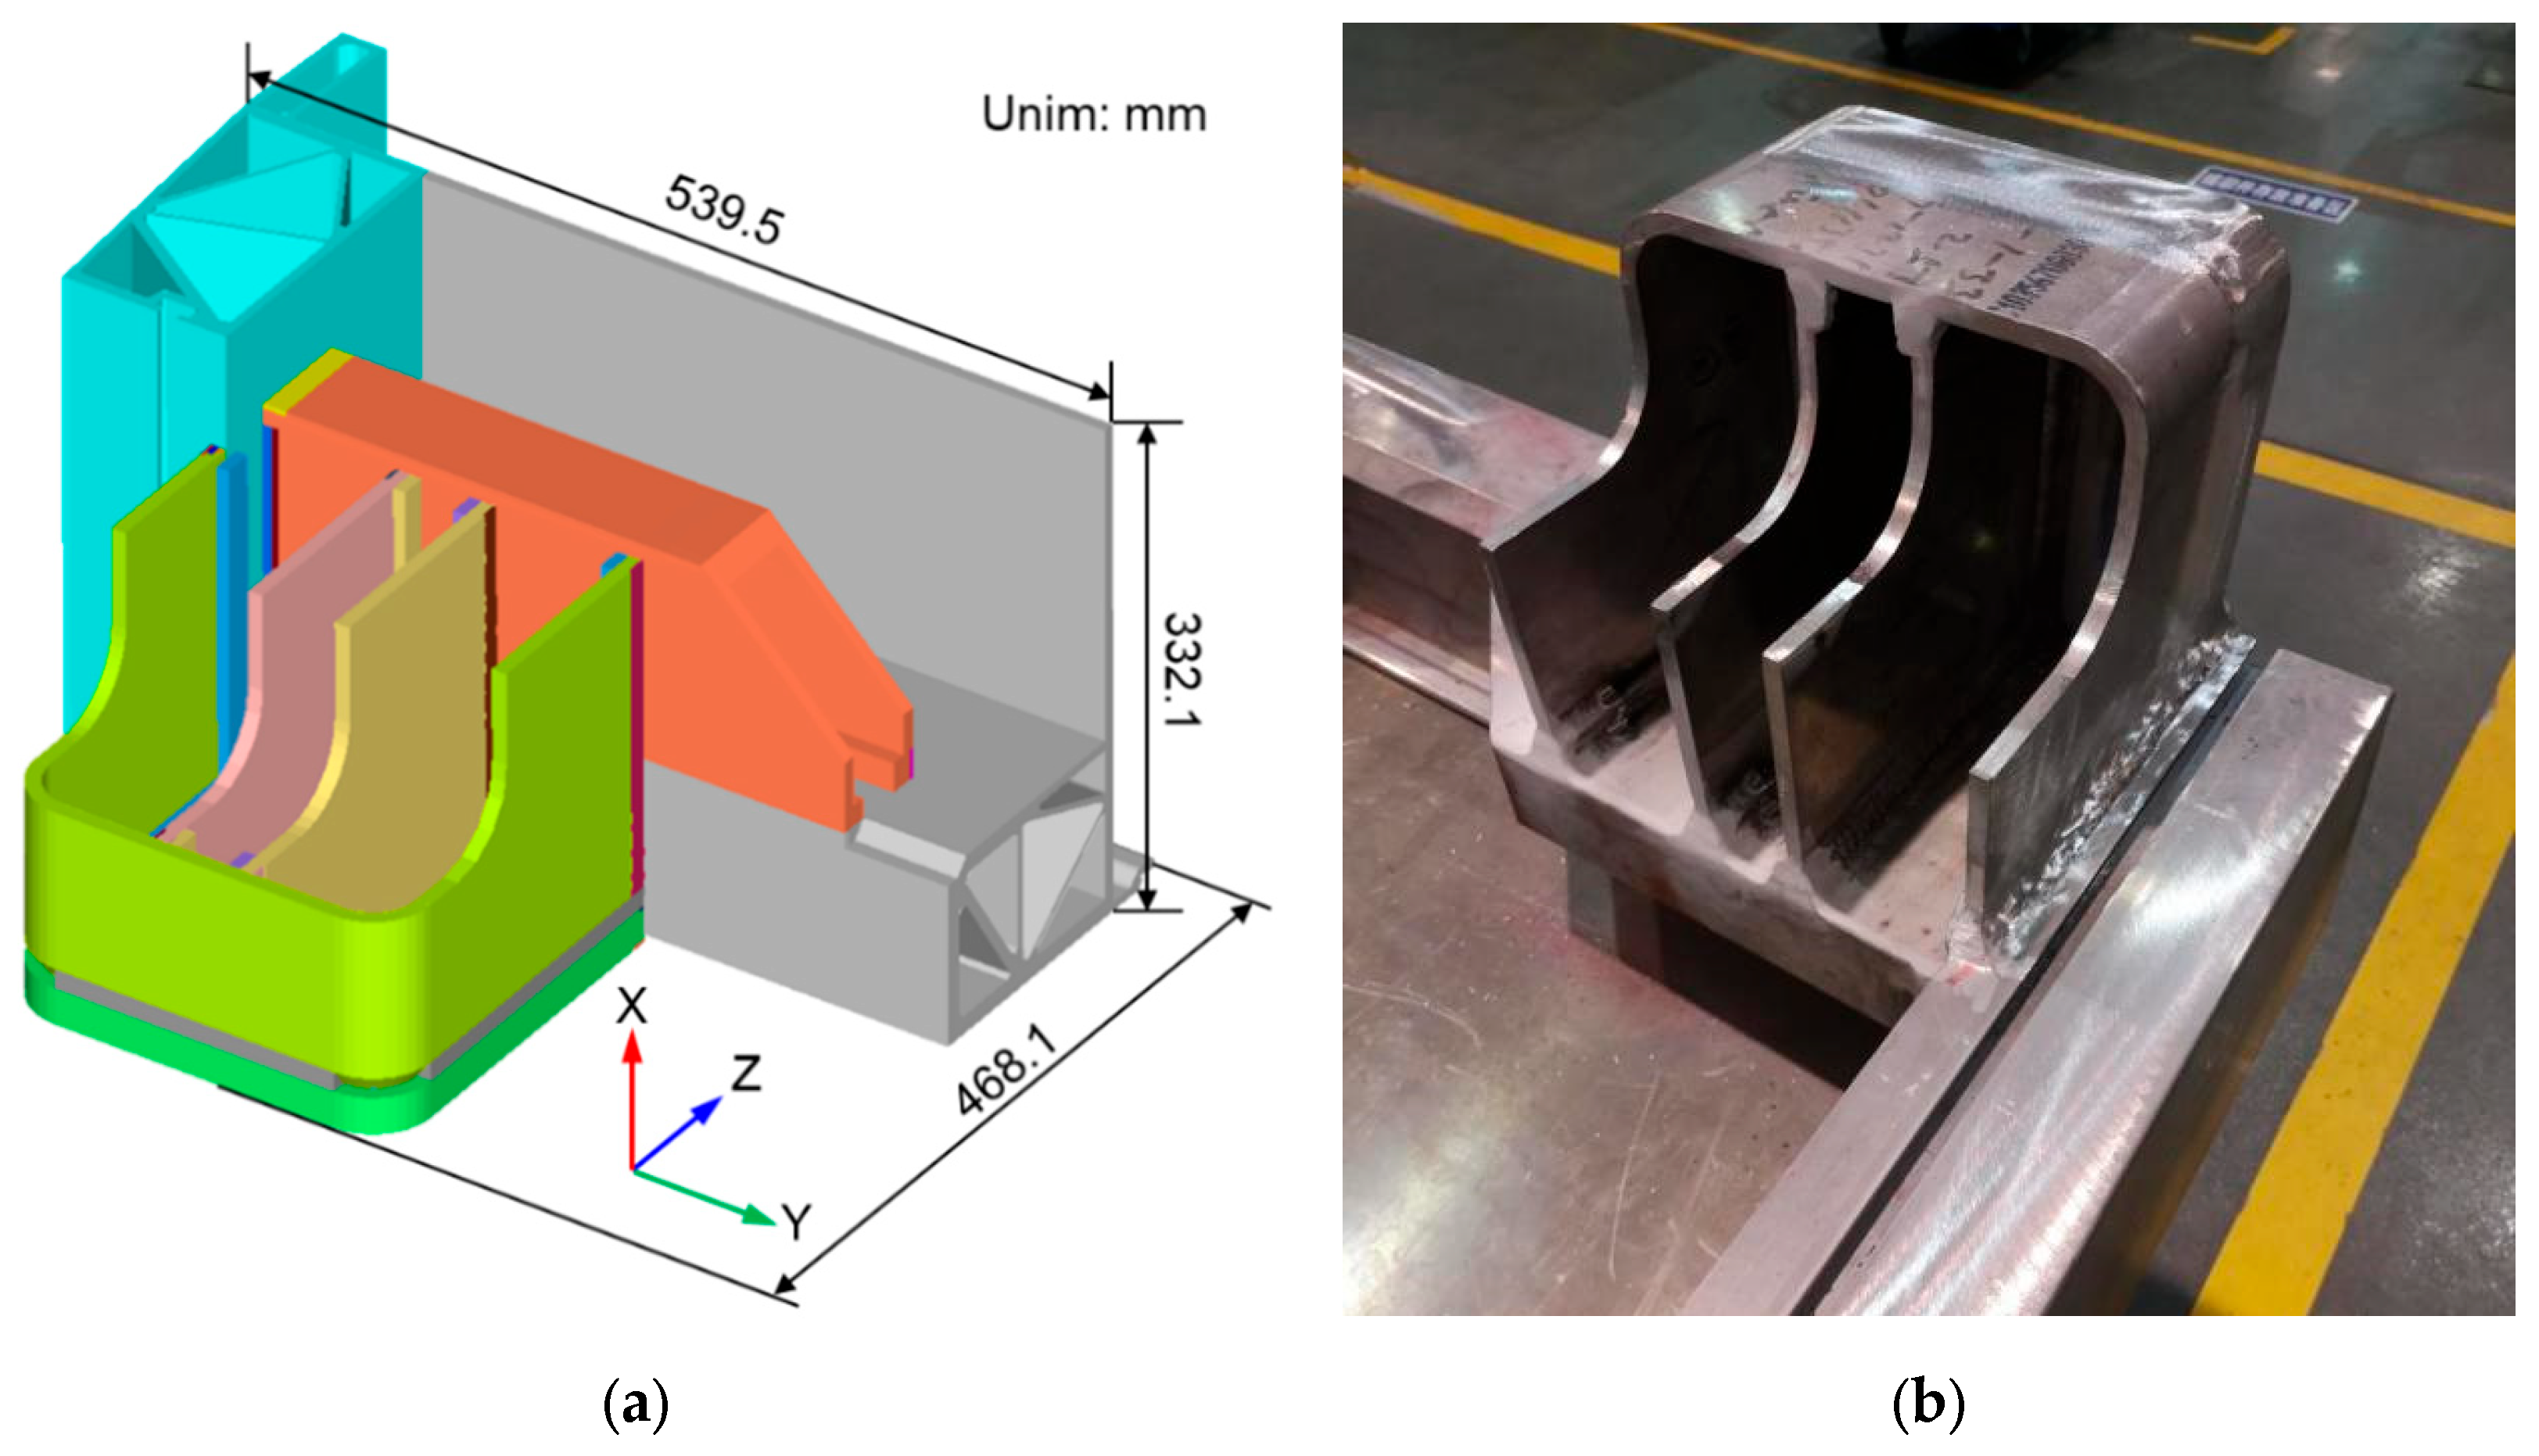
In this study, the main research object is the A6061 aluminum alloy welded structure shown in
Figure 1a, which is an important component of a train structure. The length, width, and height of the aluminum alloy structure are 539.5 mm, 468.1 mm, and 332.1 mm, respectively. In
Figure 1a, the part shown by sky blue is the extruded substructure. A picture of the aluminum alloy structure is shown in
Figure 1b. The structure was assembled using the MIG welding process, and the shielding gas was mixed using 70% Ar and 30% He. The filler wire was Al-5087, whose yield strength of deposited metal is similar to that of the base metal. As shown in
Figure 2, there were three types of welded joints, namely, butt-welded joint, fillet joint, and corner joint in this structure. The welding sequences of each joint are also presented as numbers in
Figure 2. The number of welding lines and total weld passes were 21 and 83, respectively, which meant that each welding line was performed by using a multi-pass welding process. The welding parameters for each weld pass used in these three joints are shown in
Table 1.
During the development of a new product, cracking might occur in the welded structure due to inappropriate structural design or the welding procedure. In the A6061 aluminum alloy complex structure, as shown in
Figure 1, cracking resulted from the welding process generated during the assembly process. The location of cracking is shown in
Figure 3, and the distance between the cracking location and the nearest welding line (the 18th welding line) is larger than 50 mm. This type of crack does not belong to high-temperature cracking, while the transient and residual stresses at the cracking location are naturally considered to be the main driving forces. For the current study, extra attention was also given to the influence of external restraint on welding-induced stress.
In order to prevent cracking during the welding manufacturing process, the mechanism of cracking should be clarified and corresponding measures must be taken. In this study, a thermal elastic plastic finite element method (FEM) was employed to simulate the transient and residual stress distribution in the whole aluminum alloy structure. Especially, the evolution of welding stress at the cracking location was tracked based on the simulated results.
3. Efficient Computational Approach and Its Verification
Although the dimension of the A6061 aluminum alloy structure shown in
Figure 1 is not too large, the total number of the weld passes is 83, as mentioned above. If a thermal elastic plastic FEM with moving heat source model is used to simulate welding stress, a very fine mesh should be designed for this structure [
26]. In addition, it can be inferred that a very long computing time is required for a thermal-mechanical coupling analysis. To overcome this difficulty, an efficient computational approach based on an instantaneous heat source model was proposed for balancing computing time and the computational accuracy.
The effectiveness of the proposed computational approach should be proved before it is used to simulate welding stress for the whole structure. Therefore, a small-scale bead-on-plate weld joint was established to verify the proposed computational approach first. Based on the same finite element model, two simulation cases with an instantaneous model and a moving heat source model were performed. The effectiveness of the simplified heat source model was verified by comparing its simulated result with that obtained by the case with a moving heat source model.
3.1. Bead-on-Plate Model
Due to the large dimensions of the complex aluminum alloy structure, a bead-on-plate model was established. The length, width, and thickness of this model are 300 mm, 200 mm and 10 mm, respectively. The mesh of the finite element model is shown in
Figure 4. The element type is hexahedral element. The total number of the elements is 47,200 and that of the nodes is 55,651. In order to balance the calculation accuracy and computing time, the mesh is relatively fine in the fusion zone and its vicinity, while it is relatively coarse in the areas far away from the fusion zone.
According to the welding conditions used in the complex A6061 aluminum alloy structure, it is assumed that the welding parameters, namely, welding current, arc voltage, and welding speed are 220 A, 18 V, and 5 mm/s, respectively. The arc efficiency of the MIG welding process is assumed to be 0.8.
3.2. Thermal Analysis and Heat Source Models
During the thermal analysis stage, the governing equation of thermal conduction was given as follows:
where
ρ is the density (g/mm
3) and
c is the specific heat capacity (J/(g °C)) of the A6061,
q is the heat flux vector (W/mm
2),
Q is the internal volume heat generation rate (W/mm
3),
t is the welding time (s),
T is the current temperature (°C), and ∇ is the spatial gradient operator.
The nonlinear isotropic Fourier heat flux constitutive equation is expressed by [
1]:
where
k is the temperature-dependent thermal conductivity (J/(mm s °C)). This means that the thermal conduction rate is in direct proportion to the gradient of temperature.
To accurately compute the welding temperature field, the temperature-dependent thermal physical properties should be carefully considered in the finite element model. In the current study, it was assumed that both the base metal and the weld metal had the same thermal physical properties. The temperature-dependent thermal physical properties are shown in
Figure 5 [
27].
The heat loss owing to convection (
qc) was considered by Equation (3):
where
hc is the heat transfer coefficient,
Ts is the surface temperature of the finite element model, and
T0 is the ambient temperature. In this study, the ambient temperature was set to 20 °C.
The heat loss duo to radiation was taken into account using the following equation [
1]:
where
ε is the emissivity factor and
σ is the Stefan–Boltzman constant.
As mentioned above, two heat source models, namely, moving heat source model and instantaneous heat source model, were employed to simulate the welding temperature and stress fields for the bead-on-plate welding model in the current study.
3.2.1. Moving Heat Source Model
For the moving heat source model, the volumetric heat source with a double ellipsoidal distribution proposed by Goldak [
28] was adopted to model the heat input produced by the moving arc. In this model, the front heat flux (
qf) and the rear heat flux (
qr) can be determined by Equations (5) and (6), respectively:
where
Qw is the power of arc, which can be calculated by
Qw =
ηUI (
U = arc voltage,
I = welding current, and
η = arc efficiency). Here, the efficiency of arc welding was assumed to be 0.8,
v is the welding speed,
ff is the distribution coefficient of heat deposited in the front part, and
fr is that of the rear part. In this thermal analysis,
ff and
fr were assumed to be 0.6 and 1.4, respectively. Parameters
af,
ar,
b, and c are the characteristic parameters of the heat source model.
3.2.2. Instantaneous Heat Source Model
The instantaneous heat source model simulates the welding heat input by applying the heat source with uniform density distribution covering the whole weld pass. In MSC.Marc code, the instantaneous heat source model has two key parameters, namely heat flux (
Hf) and artificial heating time (
th). By adjusting the parameters
Hf and
th, the peak temperature and shape of fusion zone can be controlled within a reasonable range. The heat flux (
Hf) of the instantaneous heat source model can be determined by the following formula:
where
L is the longitudinal length of weld pass,
V is the volume of the whole weld pass, and
v is the actual welding speed.
When using these heat source models in a thermo-mechanical analysis, the determination of the heat source parameters not only depends on the welding method and welding parameters, but also requires the experience of the engineer to some extent. When the focus of numerical simulation is on welding stress, an accurate calculation result can be obtained as long as the three temperature ranges, namely the fusion area, the range over mechanical melting point temperature, and the yield temperature [
1] are reasonable. Hence, even though relatively rough parameters of the heat source model are used, the computational accuracy of residual stress will not be significantly deteriorated.
3.3. Mechanical Analysis
The same mesh of the three-dimensional FEM used for the thermal analysis was employed in the mechanical analysis. The mechanical boundary conditions are presented in
Figure 4 by the arrows, and six degrees of freedom of three nodes were fixed to prevent rigid body motion. In the current simulation, a sequential thermal-mechanical coupling method was employed, which meant that the temperature history of each node was taken as thermal loading for the mechanical analysis.
When A6061 aluminum alloy is welded, the influence of solid-state phase transformation on welding residual stress is insignificant [
27]. Meanwhile, creep behavior also contributes little to the mechanical behavior due to the short time over a certain elevated temperature. Based on these two assumptions, it is clear that only if the elastic, plastic, and thermal strains are carefully considered in the mechanical analysis, can a reasonable result of welding stress be obtained. The total incremental strain (Δ
εtotal) at each material point can be expressed as the summation of the incremental elastic, plastic, and thermal strain:
where
,
and
is the elastic strain, plastic, and thermal strain, respectively.
In the mechanical simulation, the elastic behavior was considered using the isotropic Hooke’s rule with temperature-dependent Young’s modulus and Possion’s ratio. The thermal strain was modeled using the temperature-dependent thermal expansion coefficient. For the plastic behavior, a rate-independent plastic model was employed, and the yield criterion was the Von Mises yield surface. In the mechanical analysis, the effects of both strain hardening and annealing were neglected.
Similar to the thermal analysis, the temperature-dependent mechanical properties such as Young’s modulus, yield strength, and strain hardening coefficient were used in the mechanical analysis model. The temperature-dependent mechanical properties are shown in
Figure 6 [
29].
3.4. Simulation Results of Bead-on-Plate Model
3.4.1. Simulation Results of Welding Temperature Fields
Figure 7 shows the temperature fields of the bead-on plate weldment computed by using a moving heat source model and an instantaneous heat source model. It is clear that the moving heat source model can capture the main features of the moving arc, while the instantaneous heat source model heated the whole welding line simultaneously without the moving effect.
Figure 8 presents the fusion zones of the middle cross-section simulated by these two heat source models. Although the instantaneous heat source model cannot reflect the moving characteristics of welding arc, the shape and size of the fusion zones predicted by both heat source models are similar in general.
Figure 9 compares the temperature cycles at three typical locations calculated by the moving heat source model and the instantaneous heat source model. It should be addressed that in order to visually compare the results of temperature cycle calculated by the two heat source models, only the heating process and a small part of the cooling process are presented in this figure.
Figure 9 indicates that the peak temperatures and the cooling rates at the three typical locations calculated by the instantaneous heat source model are both very similar to those simulated by the moving heat source model. This information suggests that, although the instantaneous heat source model cannot capture the moving thermal behavior of welding arc on the whole joint, it can accurately reflect the temperature history of each material point.
3.4.2. Welding Residual Stress Distribution
Figure 10 shows the contours of longitudinal residual stress distribution simulated by a moving heat source model and an instantaneous heat source model. Even though there are some discrepancies in the residual stress distribution between these two models, especially in the two ends of the plate, the longitudinal residual stress distributions predicted by these two heat source models are very similar both in magnitude and in distribution shape.
Figure 11 compares the longitudinal residual stress distributions on the top surface of the middle cross-section computed by the moving heat source model and the instantaneous heat source model. It is clear that the longitudinal residual stress distribution calculated by the instantaneous heat source model is very similar to that computed by the moving heat source model, and the difference between them is small. This information indicates that the longitudinal residual stress distribution of the bead-on-plate model can be accurately predicted by an instantaneous heat source model.
Figure 12 shows the contours of transverse residual stress distribution simulated by the moving heat source model and instantaneous heat source model. It is clear that there are some discrepancies in the residual stress distribution between these two models. In theory, the constraint intensity in the transverse direction is relatively small. When the instantaneous heat source model is used, the whole welding line is heated at the same time. Thus, the constraint intensity in the transverse direction is further reduced due to the softened weld beam during the heat stage. Owing to the relatively small restraint in the transverse direction, it is not strange that the absolute v values of transverse residual stress computed by the instantaneous heat source model are smaller than those predicted by the moving heat source model. In addition, the transverse residual stress computed by the instantaneous heat source model shows a symmetric distribution with respect to the middle line, while that predicted by the moving heat source model presents an asymmetric distribution characteristic. Because the restraint intensity in the transverse direction is relatively small, the transverse residual stress is more sensitive to the moving speed of welding arc.
Figure 13 compares the transverse residual stress distributions on the top surface of the middle cross-section computed by the moving heat source model and the instantaneous heat source model. Compared with the longitudinal residual stress, the magnitude of transverse residual stress is much smaller. It is interesting that the transverse residual stress distribution calculated by the instantaneous heat source model is generally similar to that computed by the moving heat source model. This information implies that the utilized instantaneous heat source model is also effective when calculating transverse residual stress distribution of the bead-on plate.
Table 2 shows the computing time used by these two heat source models. This table indicates that the instantaneous heat source model can largely save computing time [
24].
4. Numerical Simulation of Welding Stress of A6061 Aluminum Alloy Structure
As mentioned in
Section 2, cracking induced by the welding process occurred in some products of A6061 aluminum alloy structure, as shown in
Figure 3. Since the cracking occurred in the part near the 18th welding line, transient stress during the welding process should be given more attention. The location of the 18th welding line is shown in
Figure 14.
Based on theoretical analysis, the welding stress, including transient and residual stress, might be the main factor resulting in cracking of the part near the 18th welding line. During the assembling process, a very strong external restraint, as shown in
Figure 15a, was applied on the A6061 aluminum alloy structure, and this could cause large welding stresses especially in the region around the fixtures. In order to investigate the real reason for the cracking, the efficient computational approach developed by the current study was employed to investigate welding stress including transient stress and residual stress at the key location. In addition, the influence of external restraint intensity on welding stress was examined numerically. For more accurately predicting welding stress at the cracking location, a moving heat source model was used to simulate the heat input of the 18th welding line in the current study. To balance the calculation accuracy and computing time, we employed an instantaneous heat source model to simulate the heat input for the other welding lines. In the thermal simulation, the heat input of each weld pass was identical to that used in the experimental mock-up.
4.1. Simulation Cases
In this study, three simulation cases with different restraint conditions were performed. To facilitate the description of constraint condition, three surfaces are defined in
Figure 15. Surfaces A, B, and C are shown in blue, red, and light red, respectively. In Case A, all nodes on surface A are fully fixed, and all nodes on surface C are fixed only in the vertical direction. This constraint is the closest to that used in actual production. In Case B, all nodes on surface B are fully fixed, and all nodes on surface C are fixed only in the vertical direction. For the cracking location, the restraint intensity of Case B is smaller than that of Case A. In Case C, only all nodes on surface C were fixed in the vertical direction. The restraint intensity of Case C is the smallest among these three cases.
4.2. Contour of Welding Residual Stress Distribution
Since the external restraint condition of Case A is almost the same as that used in the experimental mock-up, the simulated results of welding stress in Case A are highlighted here.
Figure 16 shows the Von Mises stress distribution calculated by Case A. Because the number of welding lines in this model is up to 21, the Von Mises stress distribution is very complex. From this figure, it can be seen that the magnitudes of Von Mises stress around each welding line are as high as the yield strength of A6061 alloy at room temperature.
Figure 17 shows the residual stress distributions of Case A. Since there are several welding lines parallel to the three axes in the A6061 aluminum alloy structure, the contours of residual stress distribution in the three directions are presented in
Figure 17.
The stress distribution in this welded structure with multiple welding lines is much more complicated than that in the bead-on plate joint. It is clear that the maximum values of longitudinal residual stress in the three directions are significantly larger than the yield strength of A6061 alloy at room temperature. This is because the structural restraint of the aluminum alloy structure is very strong, which leads to multi-axial stress states in each welding line and its adjacent region [
30].
Figure 17 indicates that the distribution of welding residual stress in the A6061 aluminum alloy structure is much more complicated than that in the welded joint with a single welding line, as shown in
Figure 10 and
Figure 12.
4.3. Influence of External Restraint Intensity on Welding Stress at Cracking Location
As mentioned above, cracks occurred in the part of extruded substructure as shown in
Figure 3. In this section, the welding stress distribution around the cracking location is carefully examined, and the influence of external restraint intensity on welding stress is also investigated.
Figure 18 shows the Von Mises stress distributions around the cracking location computed by these three simulation cases. Since the external restraint intensity in Case A is strong, large Von Mises stresses were generated around the cracking location. From
Figure 18, one can know that the peak value of Von Mises stress at the cracking location reached the yield strength before the external restraint was released. After the external restraint was removed, the magnitudes of Von Mises stresses were largely reduced. Because the external restraint intensity of Case B is weaker than that of Case A, the peak value of Von Mises stress at the cracking location in Case B is much smaller than that in Case A. Meanwhile, the region with large Von Mises stress in Case B is also smaller than that in Case A. Similar to Case A, after the external restraint was removed, the magnitudes of Von Mises stress in Case B were also reduced to some extent. However, the change of stress at the cracking location before and after releasing external restraint is very small.
Figure 19 shows the equivalent plastic strain distributions around the cracking locations simulated by Case A and Case B. Even though the distance between the cracking location and the 18th welding line is approximately 60 mm, an amount of equivalent plastic strain was observed at the cracking location in Case A. However, it is hard to see equivalent plastic strain at the same location in Case B.
The restraint intensity of Case C is the weakest among the three cases, therefore, the peak value of Von Mises stress at the cracking location is also the smallest one. It is interesting that there is almost no change in the stress distribution after the removal of external restraint in Case C. This information implies that the external restraint used in Case C has a very limited influence on the welding stress distribution around the cracking location.
Based on the comparison among the three simulation cases, we can conclude that the external restraint intensity has a significant effect on the magnitude of residual stress and equivalent plastic strain at the cracking location.
4.4. Discussion and Measures to Prevent Cracking
From the analysis of the simulation results, it is known that the direction of the first principal stress is almost perpendicular to the crack growth direction. Therefore, we focus on the evolution of the first principal stress at the cracking location during the welding process.
Figure 20 shows the evolution of the first principal stress at Point A during a three-pass welding process performed in the 18th welding line. It should be stressed that Point A corresponds to the cracking location. The 18th welding line was performed by a three-pass welding process. In Case A, the maximum value of the first principal stress is over 240 MPa during the third cooling stage under the external restraint condition, and the first principal stress decreased to a certain extent after the external restraint was released. Because the external restraints in Case B and Case C are relatively weak, the magnitudes of the first principal stress are also small. It can be seen from the results of the three simulation cases that, since the same external restraint condition as Case A was used in actual production, a high restrained stress was generated at Point A. The high restrained stress is the key factor leading to the cracking at Point A.
There are many factors that cause cracks during the welding process [
31]. Here, we do not discuss the cracking problem from the perspective of strength theory, but focus on the design and manufacturing factors to clarify the reasons resulting in cracking, and therefore, find feasible measures for crack prevention.
Since A6061 aluminum alloy belongs to ductile material, the resistance of this material to cold cracking induced by welding is relatively strong. However, if the structural design and fixture used in the welding process are not reasonable or the welding procedure is inappropriate, it is difficult to avoid cracking [
32]. In the current study, cold cracking occurred in the part which was close to the 18th welding line. Based on the simulated results, we can conclude that high restrained stress is the main factor resulting in cracking at Point A of the A6061 aluminum alloy structure. Meanwhile, we can see that the section change at Point A is very steep, which will result in a heavy stress concentration. Therefore, the change in the structural section is also an important factor that easily causes cracking. As mentioned above, the substructure shown in
Figure 1 is an extruded member. Therefore, it is inevitable that initial residual stress exists in this member. Due to the large stress concentration factor at Point A, it is easy to crack under the combined action of initial residual stress and the transient stress induced by the welding process.
During the welding process, there are two purposes to use external restraint. One is to position the parts to be joined, and the other is to control welding deformation. However, when a strong restraint is used, excessive restrained stress is generated, which will lead to cracking. Therefore, in actual welding production, a reasonable use of external constraints should balance the relationship between welding deformation control and cracking prevention. For the current A6061 aluminum alloy structure, cracking can be prevented by adjusting the external restraint intensity. The simulation results indicate that the transient welding stress in Case B is much lower than that in Case A. It can be inferred that if the location of external restraint used in Case A is changed into that in Case B, the cracking risk can be largely reduced.


