Article

Photocatalytic Dye Decomposition over CaMnO3−δ and Pr0.5Ca0.5MnO3: A Combined XPS and DFT Study

by
Majid Ebrahimizadeh Abrishami
1,2,
Mojtaba Mohammadi
3 and
Mohsen Sotoudeh
4,*
1
Institute of Materials Physics, University of Göttingen, Friedrich-Hund-Platz 1, 37077 Göttingen, Germany
2
Nano Research Center, Ferdowsi University of Mashhad, Mashhad 9177948974, Iran
3
Department of Physics, Ferdowsi University of Mashhad, Mashhad 9177948974, Iran
4
Institute of Theoretical Chemistry, Ulm University, Albert-Einstein-Allee 11, 89081 Ulm, Germany
*
Author to whom correspondence should be addressed.
Crystals 2022, 12(12), 1728; https://doi.org/10.3390/cryst12121728
Submission received: 29 September 2022 / Revised: 16 November 2022 / Accepted: 21 November 2022 / Published: 28 November 2022
(This article belongs to the Special Issue Feature Paper in "Materials for Energy Applications" 2022–2023)

Abstract

:
In the field of environmental sustainability, the development of highly efficient photocatalytic under a wide wavelength range with band engineering is regarded as a promising strategy to enhance photocatalytic dye degradation. Here, we report on CaMnO3−δ and Pr0.5Ca0.5MnO3 perovskite materials prepared by a sol-gel combustion method. From X-ray photoelectron spectroscopy (XPS), the particle surfaces of both compounds are oxygen deficient, while the surface hydroxyl and carbonyl groups’ adsorption on the surface of Pr0.5Ca0.5MnO3 particles is more pronounced. FT-FIR spectroscopy has been used to investigate the covalent bonds and oxygen vacancy characteristics. Photocatalytic activities were investigated by the degradation of methylene blue and methyl orange under UV light. It was observed that both dye molecules are more degraded over CaMnO3−δ. The underlying mechanisms behind the photoexcitation and degradation process are established via the Spin-polarized Density Functional Theory (DFT).

Graphical Abstract

1. Introduction

Today, the serious environmental problems due to the growth of fossil fuel consumption have attracted special attention to developing efficient and nontoxic materials to assist in solving these issues. Photocatalysis is a promising technology in the field of clean energy applications to prevent organic pollutants from potentially causing environmental degradation. Many efforts have been made on various materials to develop new semiconductor photocatalysts [1,2] and find out the photocatalytic mechanism. Among the studied materials, rare earth ABO3 perovskite compounds with unusual physical and chemical properties have shown photophysical properties due to the polaron formations inside the crystal lattice [3,4]. The effects of doping and nanosized crystalline are effective parameters in these physical and chemical properties. The perovskite structure consists of oxygen octahedra, where the B cation (Mn ion) is the atom in the center of the octahedron, and the A cation (Pr and Ca ions) is the atom outside the octahedron. The position of oxygen atoms around the transition metal cations B in the ABO3 perovskites determines the exciting properties. The transfer of electrons between the B-sites is not direct transfer but through the intervention of the oxygen atoms surrounding the transition metal atoms in the B-site [5,6]. The electronic and magnetic properties of the perovskite change by the distortion of the octahedral reflects the importance of the mixed-valence states of the transition metal at B-site and the corner-shared octahedral BO6 in these materials [7,8,9]. Moreover, the small ionic radii of the A cations cause BO6 octahedral tilting. This tilting turns the cubic lattice structure to the lower symmetry orthorhombic crystal structure [10,11]. In perovskite compounds, octahedral tilting influences the electronic structure, electron or hole transport, and dielectric properties [12,13].
The perovskite-like materials such as tantalate, titanate, ferrite, and manganites have exhibited visible light photocatalytic activity because of the exclusive electronic properties correlated with the crystal structures [14,15,16]. The optimized bandgap in such materials, the doping concentration of the divalent element, explains and enhances photocatalytic performance and the separation of charge carriers. These compounds represent the bandgap values of the produced visible-light absorption as well as the UV region [17]. The potentials of optimizing the bandgap and the lattice distortion to capture charge carriers presented in such materials affect the efficiency of photocatalysts [18]. A simple member of the manganite compounds, CaMnO3, represents the bandgap of about 1.6 eV between the O 2p valence band and Mn 3d conduction bands. The Mn 3d orbitals split into the triply degenerated Mn t2g and doubly degenerated Mn eg states originating from the crystal field splitting [6,19]. Hence, there are two relative electron transitions in the energy range of 1 eV to 6 eV. The UV transition at the higher energies of 4–5 eV corresponds to the transitions between the O 2p states and the minority-spin states, while the lower energies are assigned to the transitions between the O 2p and majority-spin states. These transitions are of interest to the polaron physics of manganites. In addition, manganese-containing compounds can be considered promising candidates for functional water oxidation [20,21,22,23] inspired by the natural photosynthesis process in which the Ca2Mn3O8, CaMn2O4, and CaMnO3 clusters are identified as the catalytic site for the four-electron involved water oxidation [24].
Doping CaMnO3 by the trivalent ions (Pr) inserts the extra electrons into the antibonding eg states of the Mn 3d orbitals. These electrons form polarons and cause octahedral distortion [10]. Therefore, octahedral distortion affects the conduction band distributions as well as the valance band top [25]. Oxygen vacancy is another approach to modifying the conduction band distribution of electronic states [26]. Water oxidation and O2 reduction depend on the photoinduced reactions and potential levels of the valence and conduction bands with respect to the oxidation and reduction of potential levels. Thus, doping and deficiencies in the lattice offer great potential for band structure engineering and consequently designing new photocatalysts. The photocatalytic properties and the relative mechanism for the transitions, particularly at lower energies (visible region), draw the attention to sunlight. The effects of UV transitions in perovskites corresponded to the transition between the O 2p states and minority-spin states of the conduction band are still missing. Here, oxygen deficiencies, as well as doping agents, have been used to prepare the CaMnO3 manganite structure with Mn3+ and Mn4+ coexistence to investigate the mechanism of the photocatalytic activities in the UV radiation region.
In this work, nanosized CaMnO3−δ (CMO) and Pr0.5Ca0.5MnO3 (PCMO) were characterized by FT-FIR spectroscopy and XPS and the photocatalytic activity in the UV region for the decomposition of methyl orange (MO) and methylene blue (MB) was investigated. To better understand the photocatalytic behavior of ABO3 perovskites, the band structures of the compounds were discussed concerning the photocatalytic activities. To shed light on the experimental finding, first-principle calculations based on the density functional theory (DFT) were carried out to assess the influences of oxygen vacancy on the electronic density of states (DoS).

2. Materials and Methods

2.1. Preparation of Samples

The CMO and PCMO nanoparticles were prepared by gel combustion method. Calcium nitrate tetrahydrate Ca(NO3)2·4H2O (99%), manganese nitrate tetrahydrate Mn(NO3)2·4H2O (99.5%), praseodymium nitrate hexahydrate Pr(NO3)3·6H2O (99.9%) and gelatin were used. In order to prepare the primary sol, appropriate amounts of nitrates were dissolved in distilled water, stirring at room temperature for 20 min. Then, the gelatin solution was added to the sol and stirred at 60 °C for 2 h. The final gel was obtained by heating the sol at 90 °C. Finally, the brownish gel was dried at 200 °C for 5 min. The nanoparticles were prepared after calcining the samples at 900 °C for 5 h. The preparation methods, as well as the structural analysis by X-ray diffraction and Rietveld refinement, have been published recently [27].

2.2. Characterizations and Photocatalysis Experiments

The structural, microstructural, electrocatalytic, and in situ investigations of CMO and PCMO nanopowders have been previously reported [27,28]. Here, the infrared optical density Od for both compounds was obtained in the 150–700 cm−1 using a far-infrared Fourier spectrometer (FT-FIR). The powders were pressed into pellets under a vacuum followed by finely milling and mixing with CsI in the ratio of 1:100 in weight.
X-ray Photoelectron Spectroscopy (XPS) was performed in a custom-designed system with an Al-Kα X-ray source (1486.6 eV), steps of 0.1 eV and 20 eV pass energy. Chemical compositions of particles have been investigated using core-level photoemission spectra from Ca 2p, Pr 3d, Mn 2p, and O 1s regions collected in normal emission at room temperature. The binding energies were referenced to Au-4f at 84 eV.
In order to collect the photoemission spectra, the monochromator and exit slit was set to cff = 2.25 and 111 μm, respectively. The step size for Ca 2p and O 1s spectra was 20 meV. All spectra were collected using pass energy of 20 eV and a dwell time of 100 ms. The intensities have been scaled and normalized with reference to impinging photon flux. A blend of linear and Shirley-type backgrounds was subtracted. Experiments have been conducted according to the protocol given in Ref. [29].
The photocatalytic reaction in the ultraviolet region was performed with a 200 W HBO Mercury short-arc lamp as an ultraviolet light source with a peak irradiance at 365 nm and intensity of 50 mW/cm2 at the sample position. The concentration of MB and MO dyes was chosen as 5 ppm. The amount of photocatalyst was 50 mg in 50 mL of deionized water. The solution was stirred in darkness for 30 min to complete the adsorption–desorption equilibrium between the dye and the catalyst. The solution temperature was kept at 25 °C throughout the experiment. After darkness, solutions were exposed to light. Aliquots were taken at the time interval of 20 min. The solution was then centrifuged, and its absorption spectrum was recorded by UV-Visible spectrometer.

2.3. Theoretical Method

Calculations were performed based on the Spin-polarized Density Functional Theory (DFT) [30]. The exchange-correlation functional is approximated with the HSE06 functional [31] to obtain a proper description of the Mn 3d orbitals, as implemented in the Vienna Ab initio Simulation Package (VASP) [32,33]. The typical value of 0.2 is employed as a mixing factor. We used 2 × 2 × 2 supercells of the primitive perovskite cell for CaMnO3, corresponding to 20 atoms. The total energy was sampled on a well-converged 4 × 4 × 4 k-point grid together with projector-augmented wave theory [34] and a 520 eV plane-wave cutoff. The total energy is converged within 1 × 10⁻⁵ eV per supercell. For Pr0.5Ca0.5MnO3, a larger supercell has been considered with the CE-type order, corresponding to 80 atoms, sampled on a 2 × 2 × 2 k-point grid. Oxygen vacancy in the perovskite is assessed in the low-vacancy limit, one O vacancy per supercell. The structures were allowed to relax until the convergence of the forces on the atom were lower than 1 × 10⁻² eV Å−1. The minimum distance between O vacancies considered as at least 10 Å minimized the fictitious interactions across periodic boundaries [6].

3. Results and Discussion

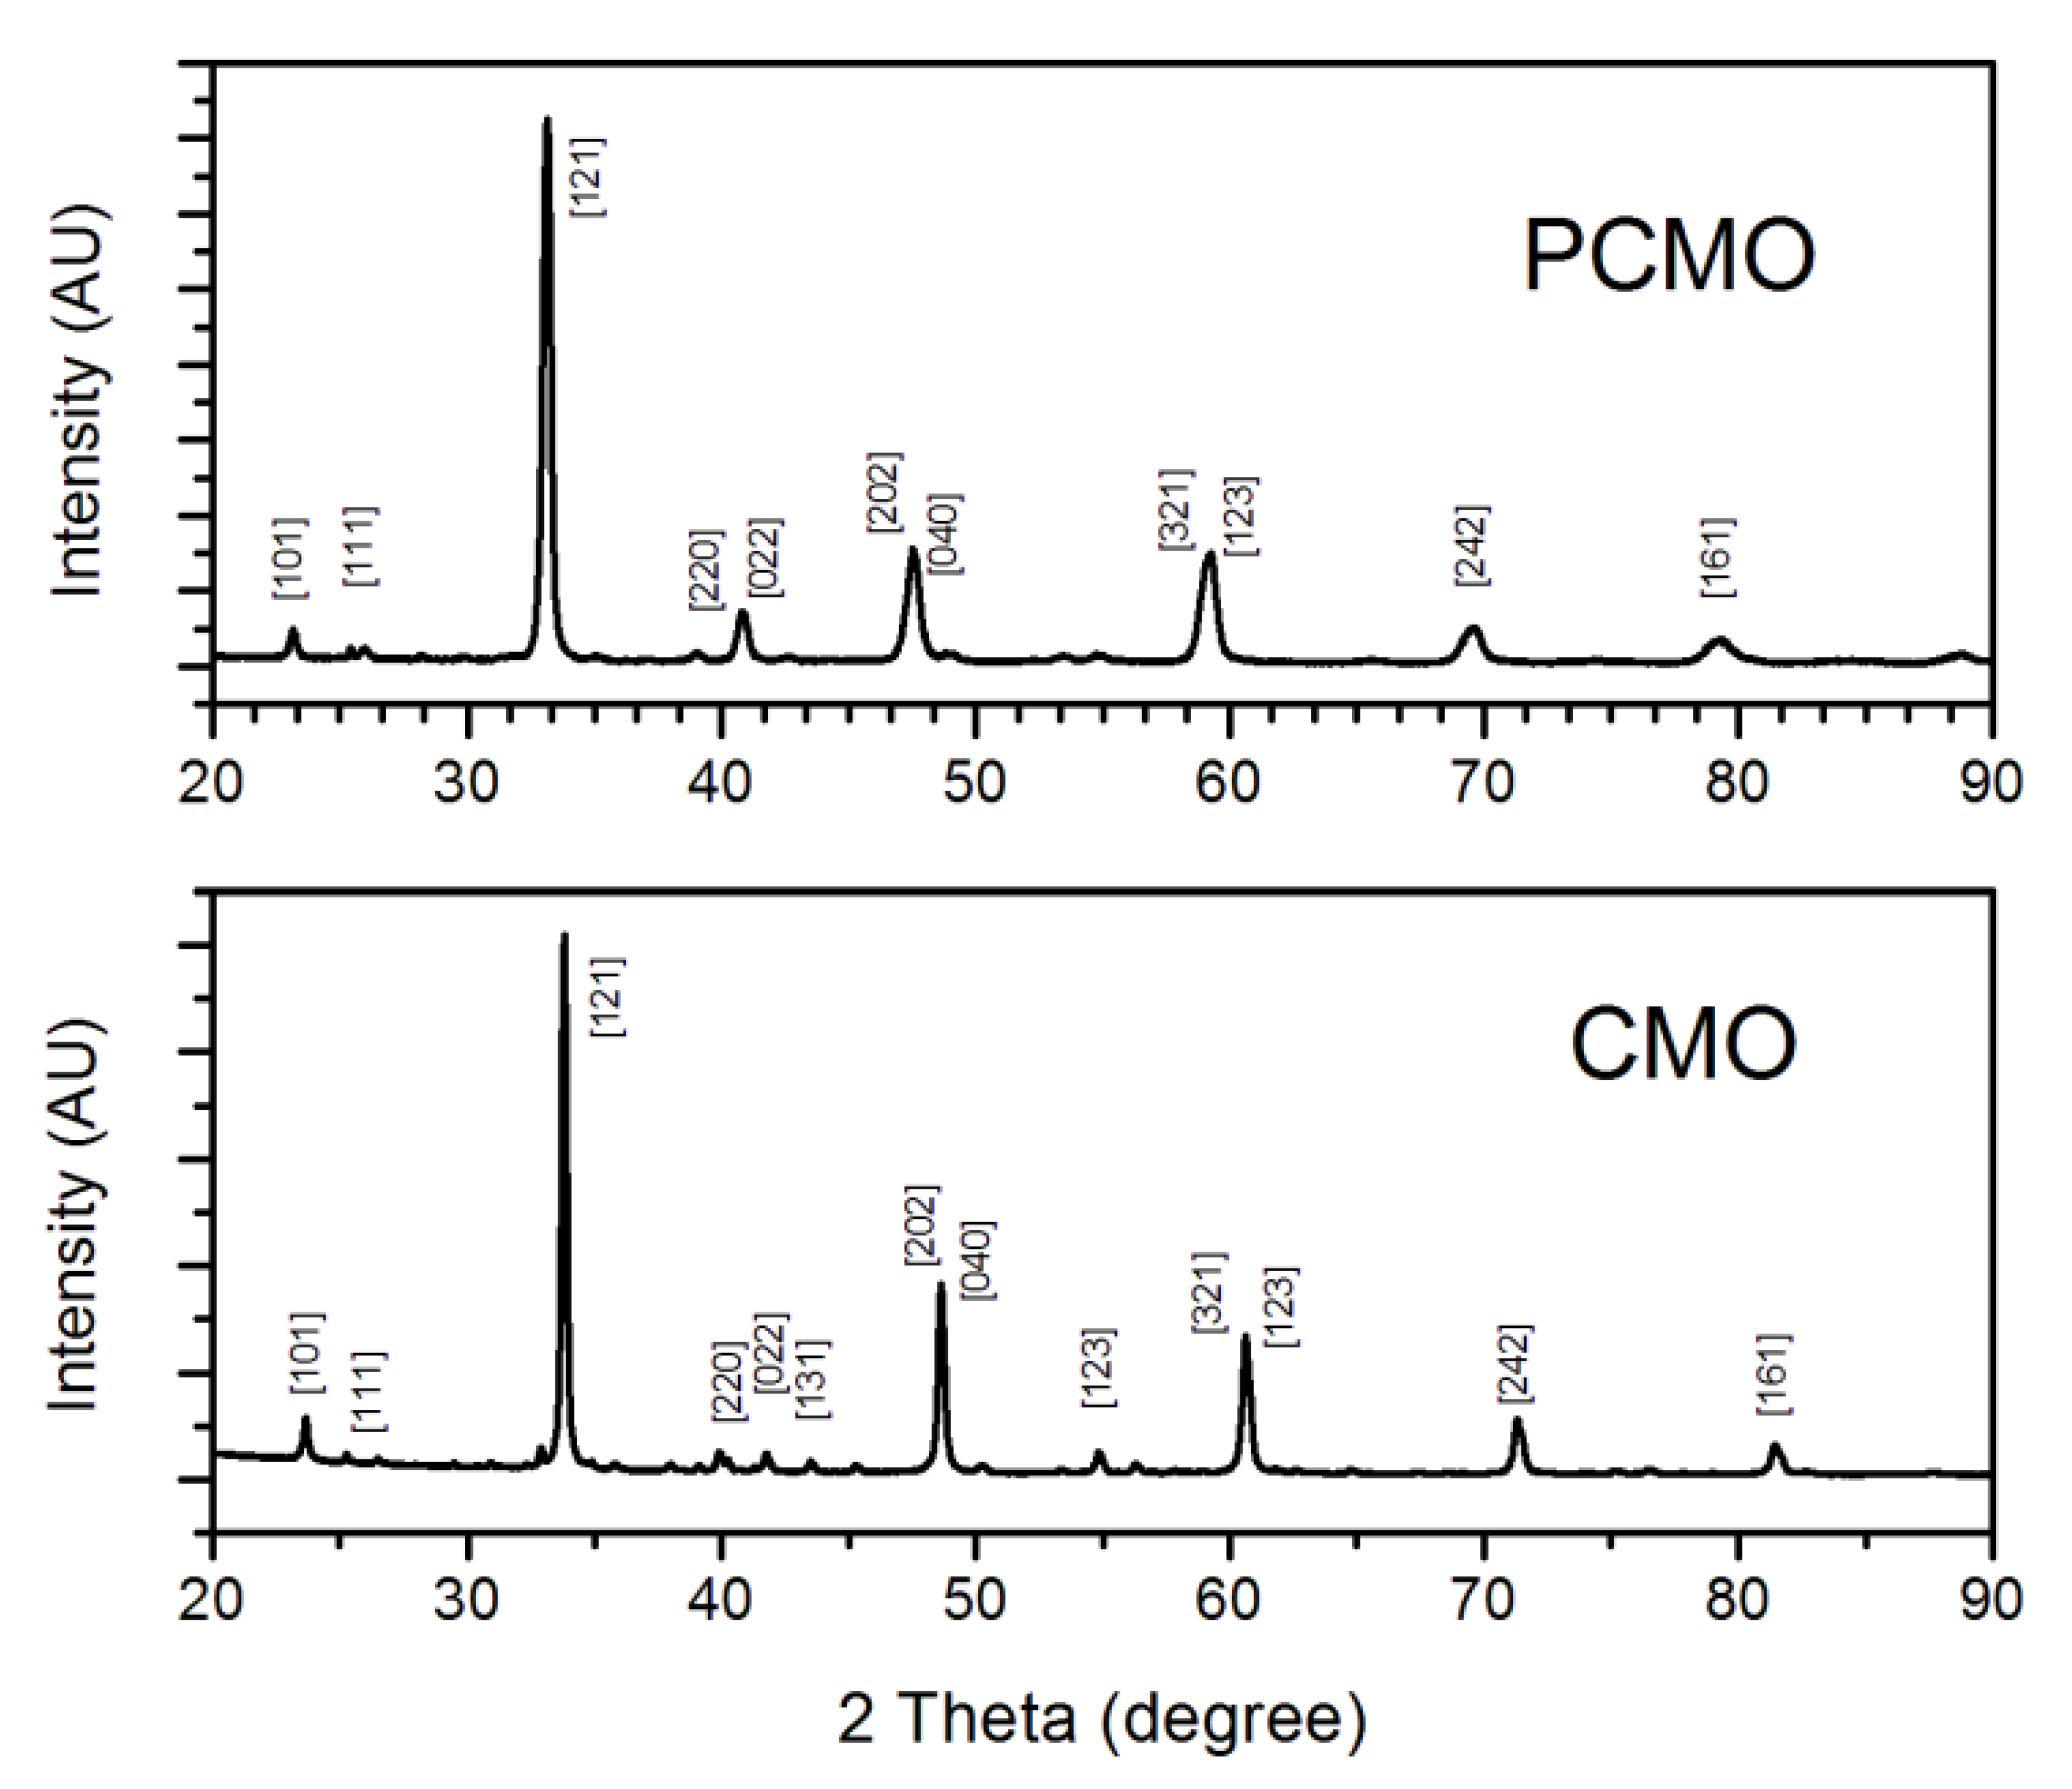
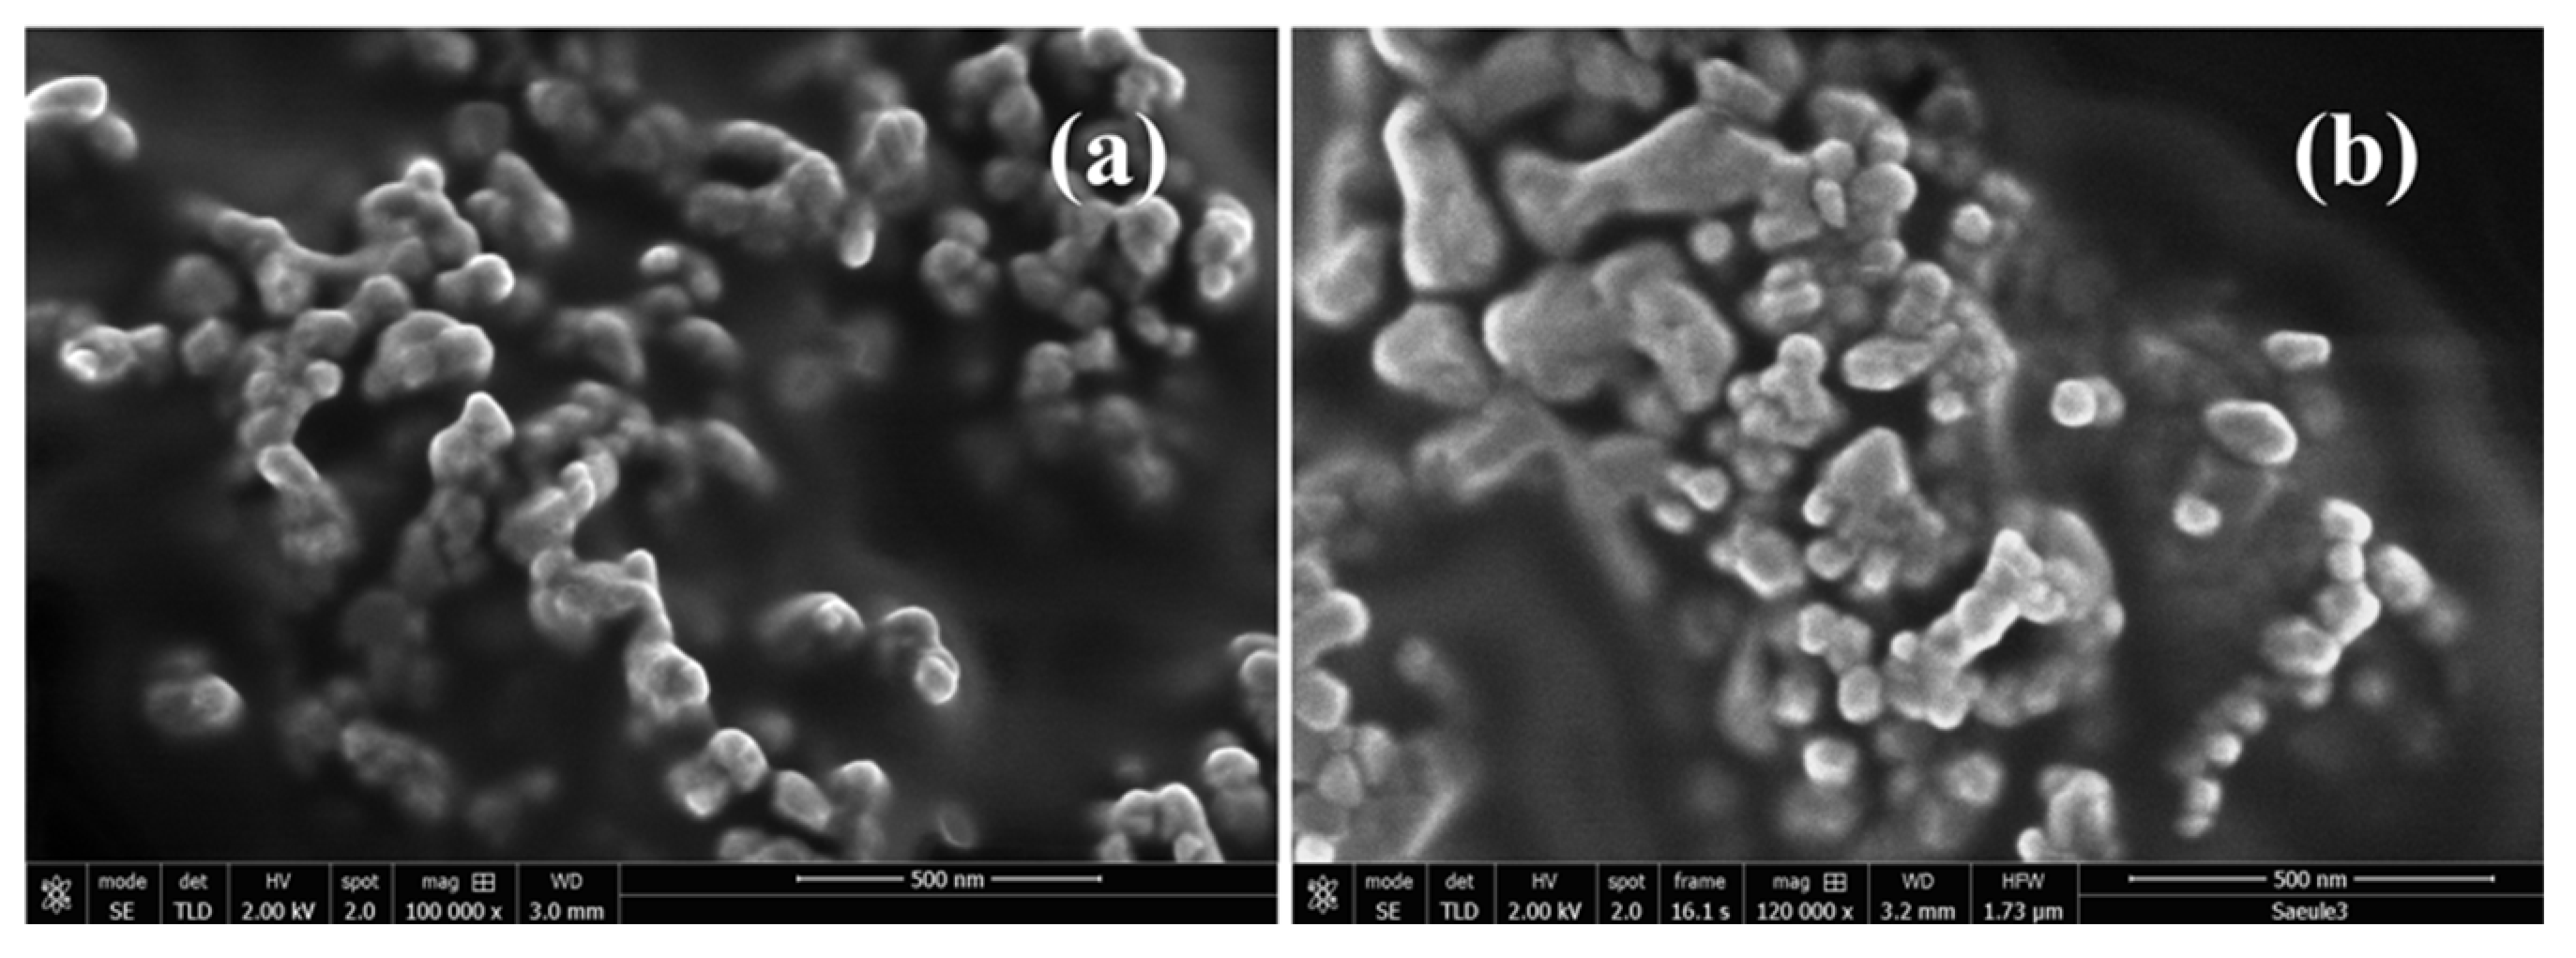
3.1. Structural and Microstructural Properties

The XRD patterns of the single CMO and PCMO are shown in Figure 1. We identified the orthorhombic space group of Pnma (no. 62) for the crystal structure. While the ionic radius of Pr3+ (1.13 Å) is close to that of Ca2+ (1.12 Å), the lattice constants enlarge with an increase in Pr content, as has already been published [27]. The lattice expansion is because of the Mn–O bond length increases caused by electron insertion into the antibonding Mn eg orbitals. The surface morphology has been investigated by scanning electron microscopy (SEM), and a representative SEM image for the micrographs of undoped and Pr-doped CaMnO3 is shown in Figure 2. The samples were composed of nanoparticles with an average particle size of 70 nm. Phase identification, lattice parameters, and microstructural analysis were published in previous work [27].

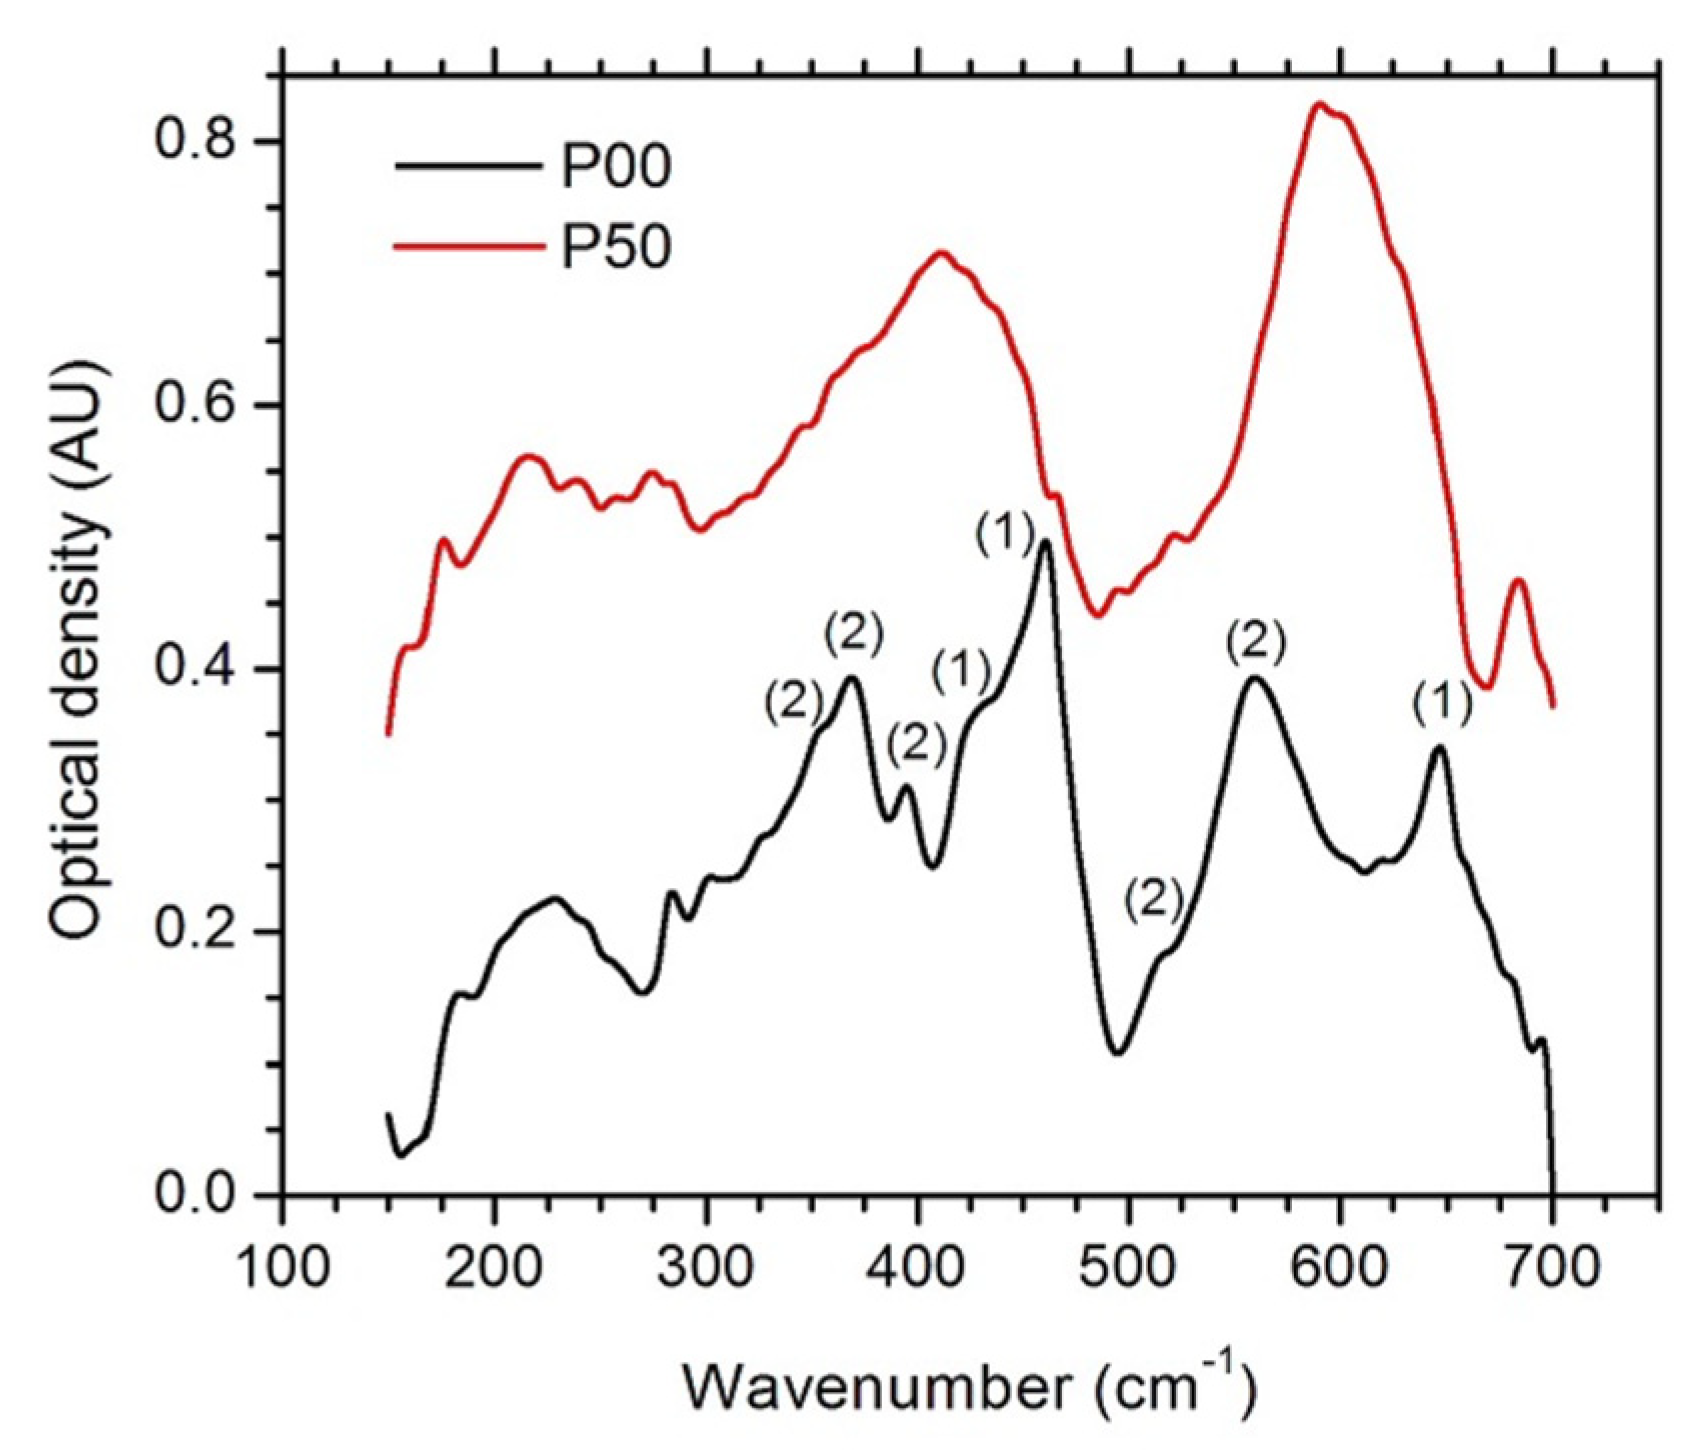
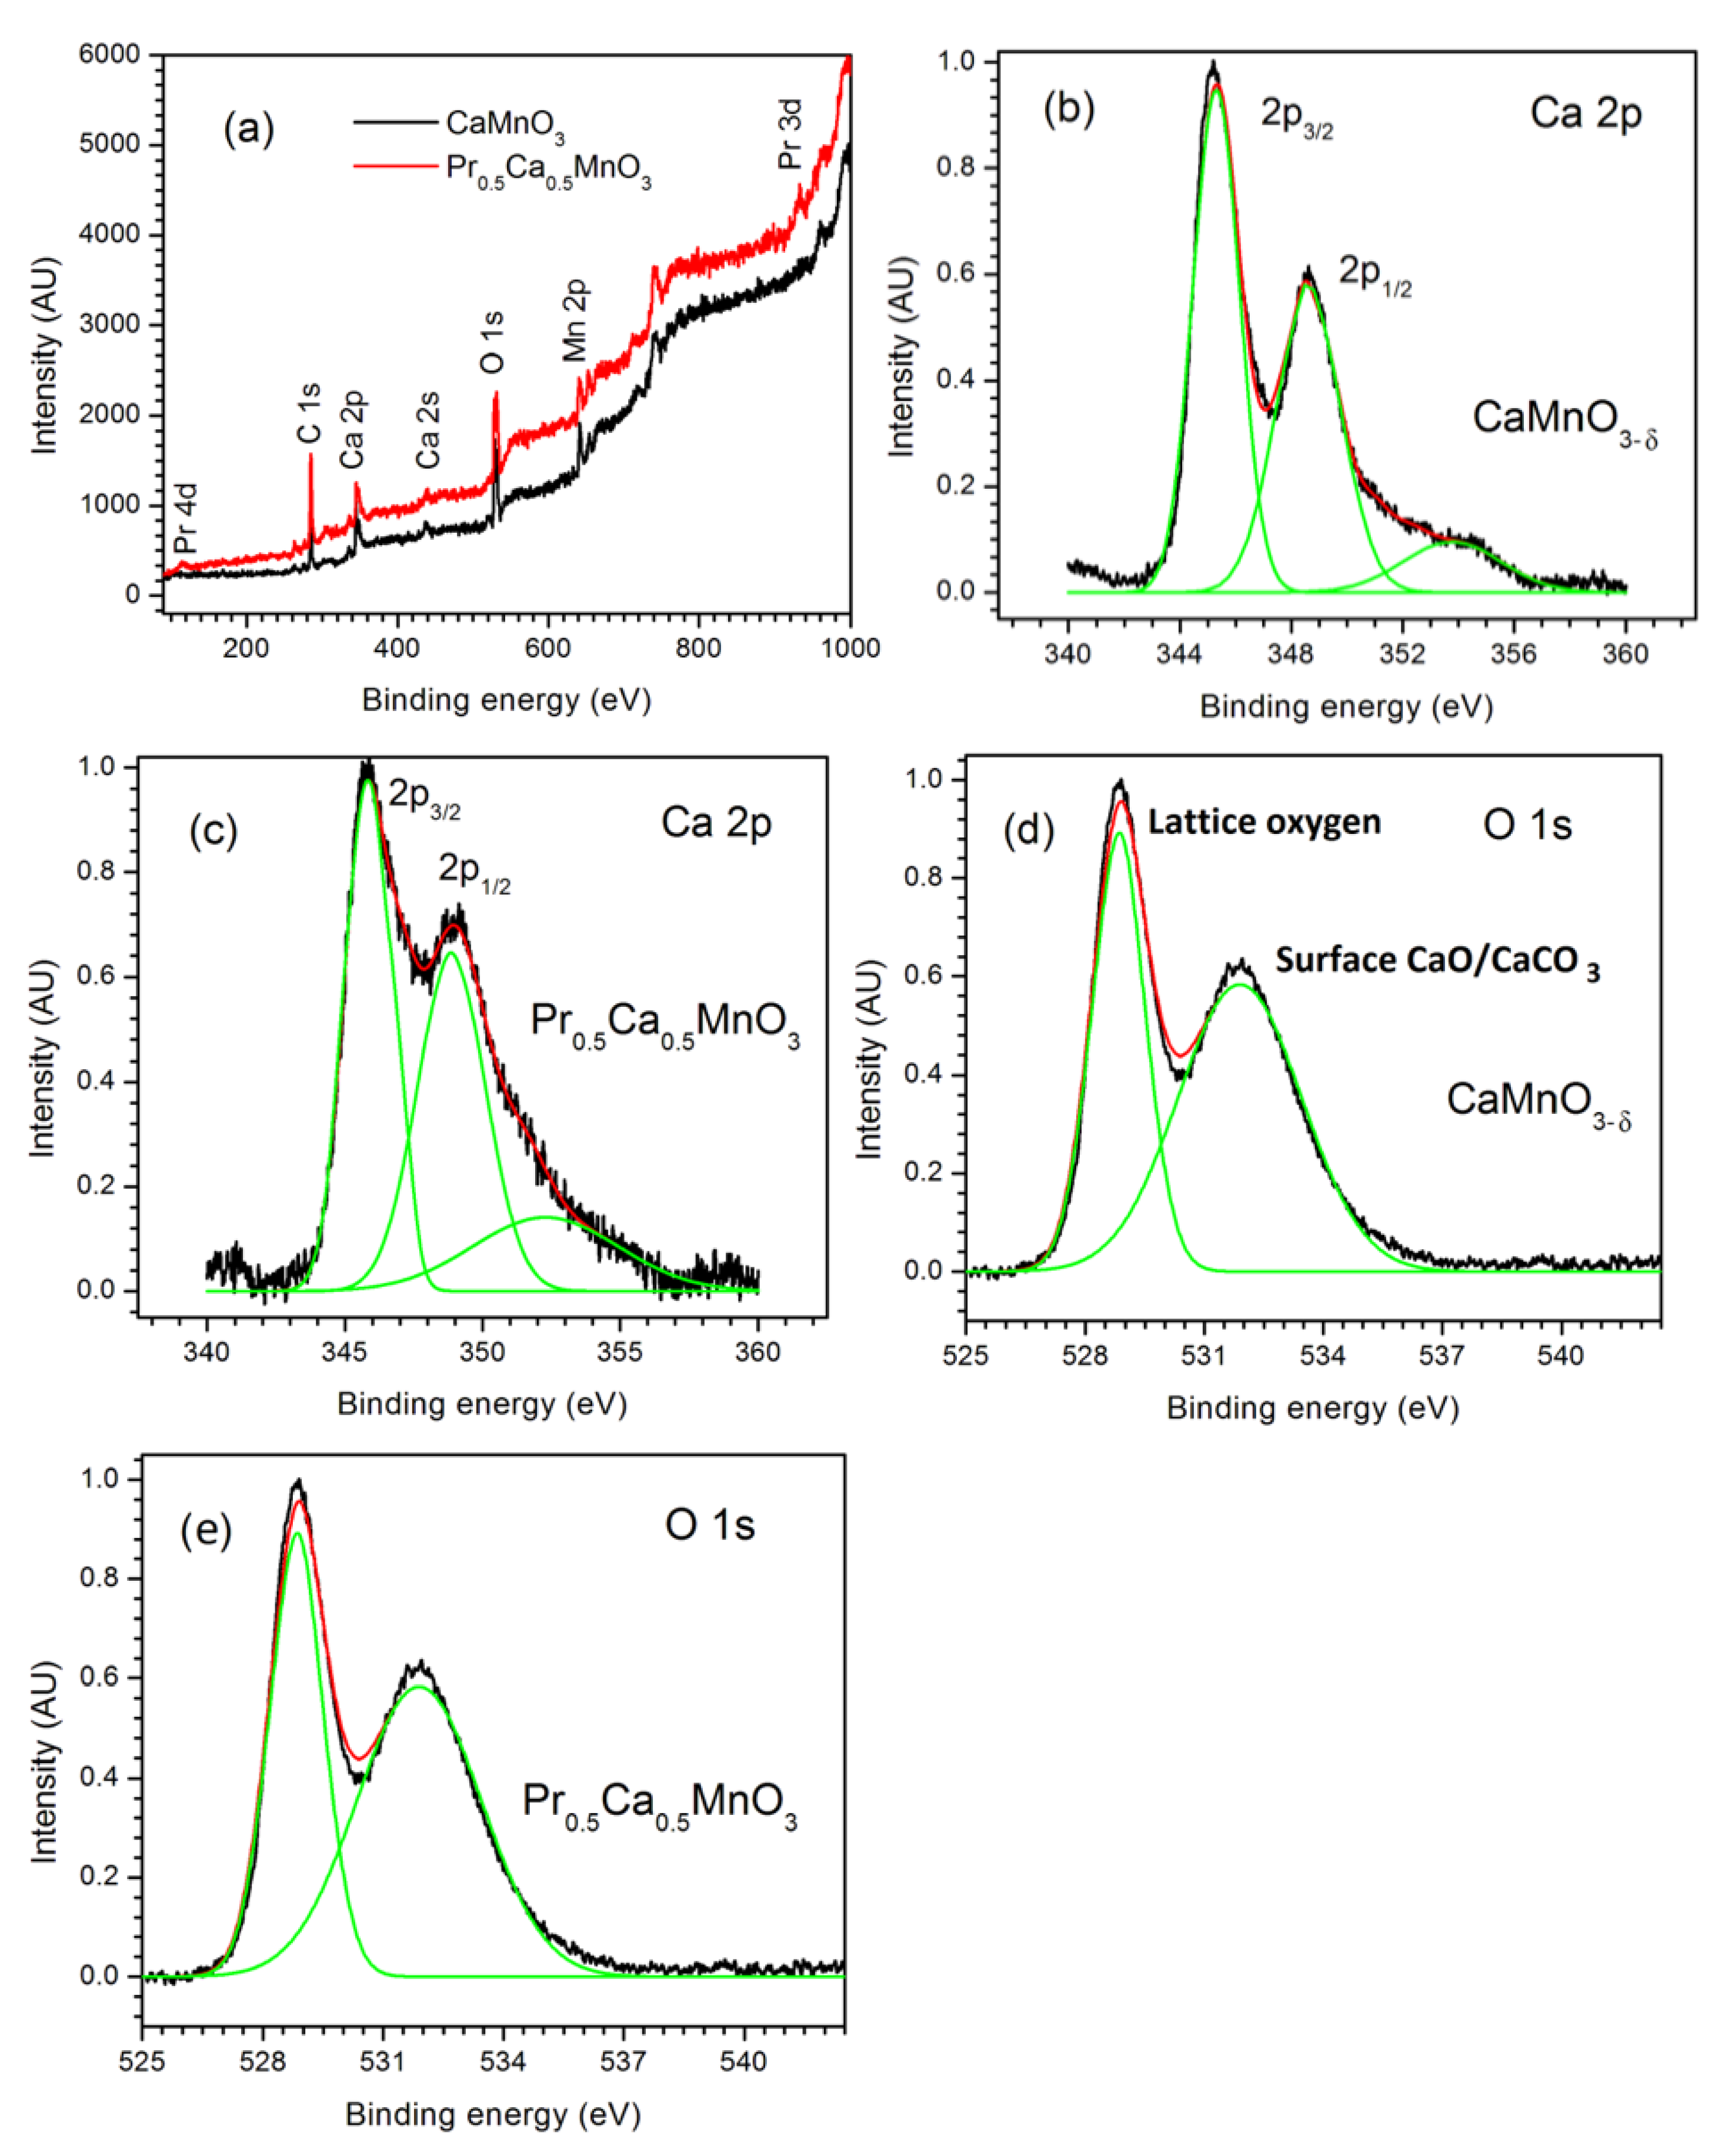
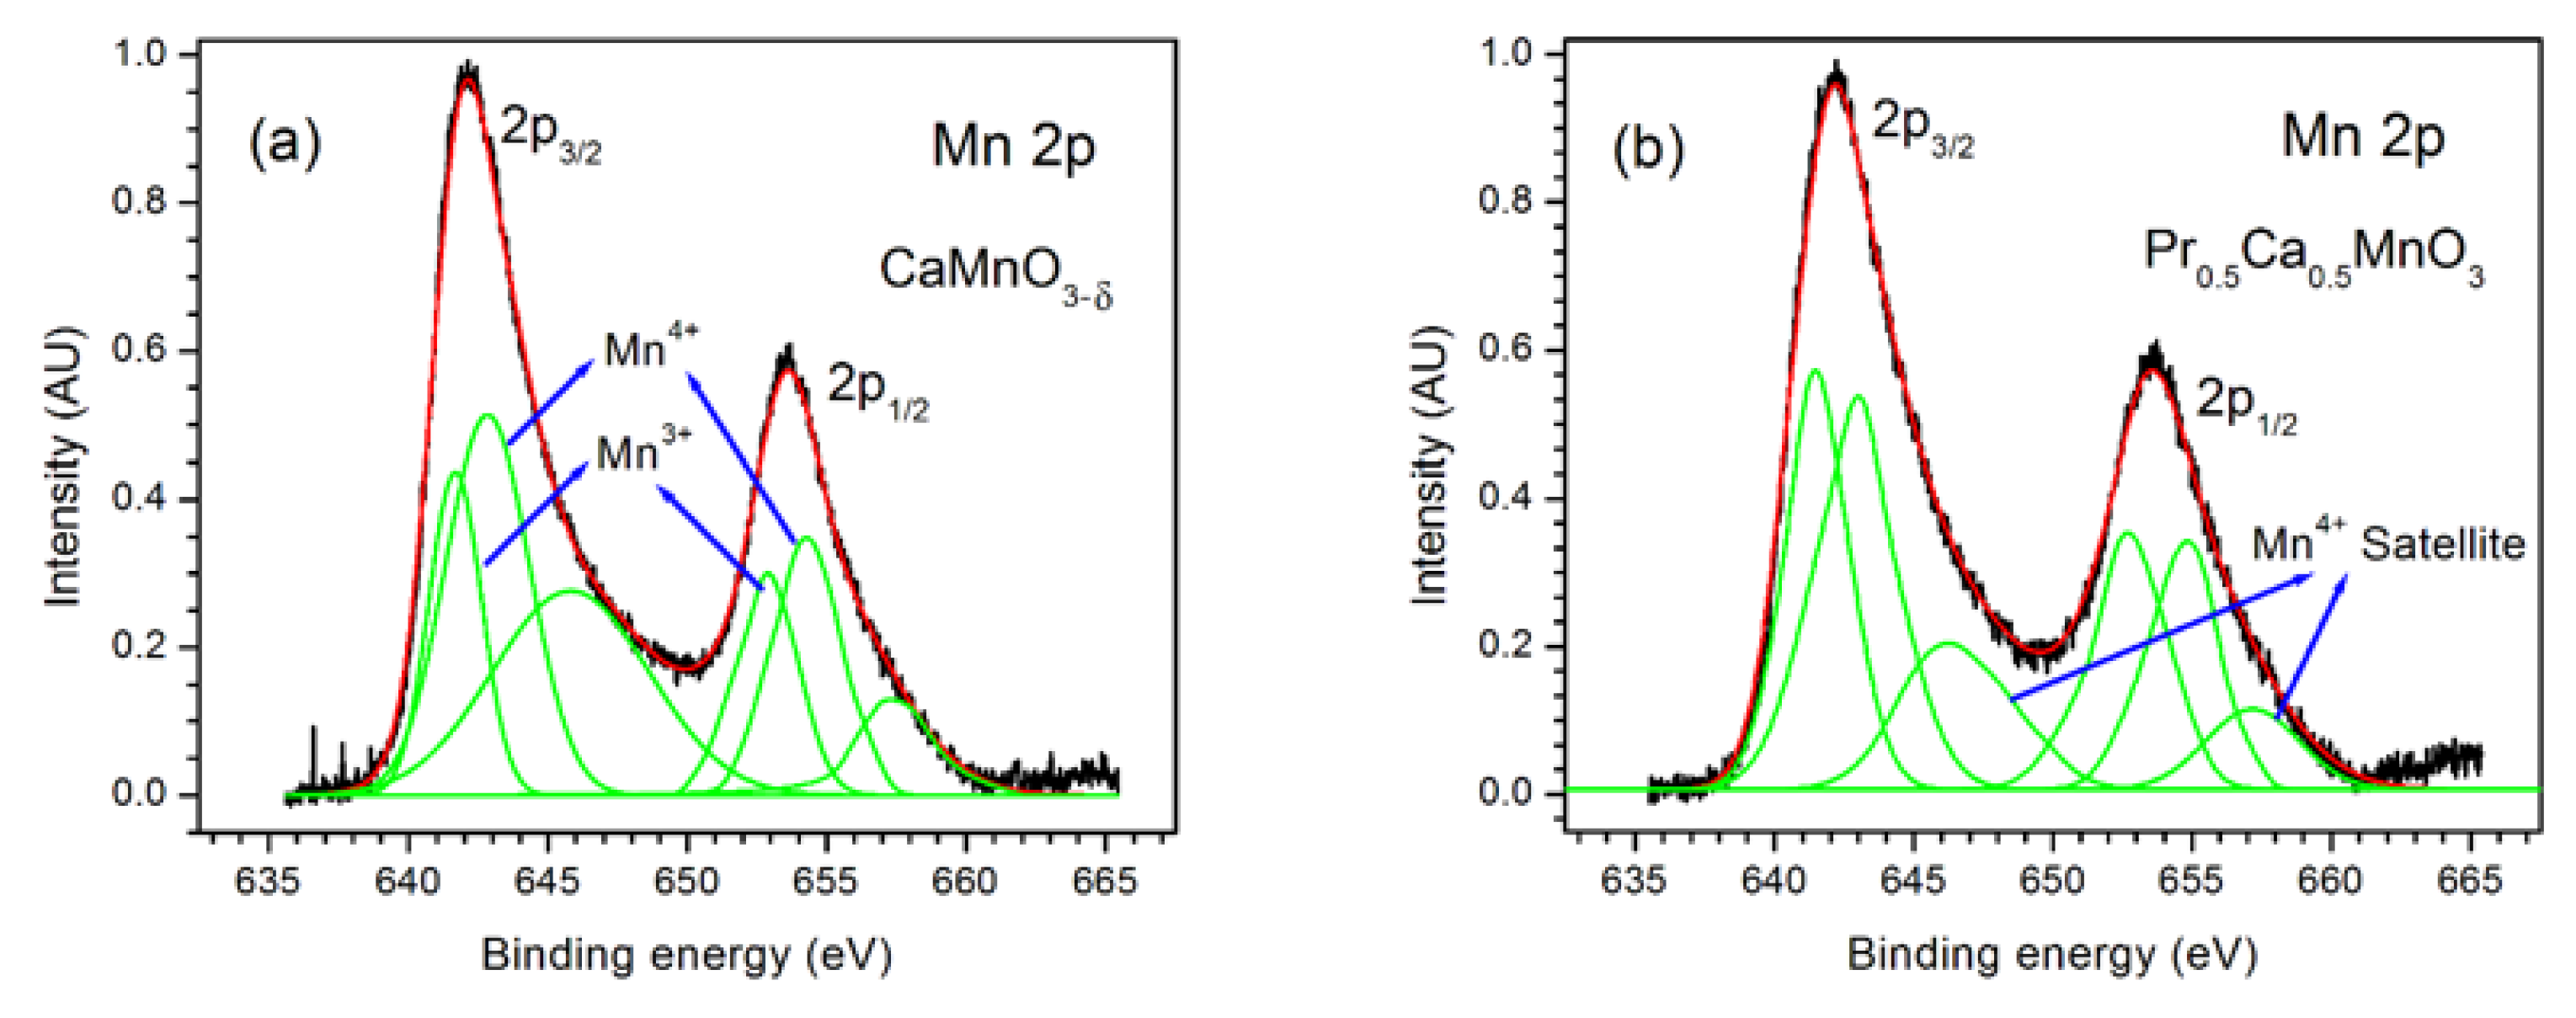
3.2. Spectroscopic Analysis

In our previous work [27], X-ray absorption spectroscopy of the Mn-L edge gave the Mn valence of the undoped calcium manganite about 2.95, confirming the oxygen deficiency in the structure, which is very common in Ca-rich manganites. The structural properties of the samples obtained by Rietveld refinement indicated that Mn–O bond length increases with the increase of eg electron occupation of the antibonding Mn (eg)–O (2p) levels. Here, FT-FIR spectroscopy has been used to investigate the covalent bond characteristics and the position of oxygen vacancies. The infrared optical densities of polycrystalline Ca1−xPrxMnO3 (x = 0.00 and 0.50) at 300 K are shown in Figure 3. The numerous peaks in the spectra relating to the infrared active transverse optical TO modes show strong deviations from a cubic symmetry to orthorhombic in both compounds. Two strong, broad peaks are contributing several smaller peaks at 414 cm−1 and 596 cm−1 have been observed for Pr0.5Ca0.5MnO3. This is due to the lifting of the eg degeneracy (Jahn–Teller distortion) because of the strong elongation of the Mn–O(1) bond and consequently splitting one IR absorption band into two adjacent bands [35]. The spectra shown in Figure 3 appear qualitatively similar in structure, exhibiting three main groups centered around 200, 400, and 600 cm−1. The low-energy modes are the bending band and are expected to be sensitive to the MnO6 octahedra tilting distortions. On the other hand, the high-energy modes (centered around 600 cm−1) are thought to involve mainly stretching vibrations of MnO6 octahedra. The frequencies of these modes are expected to be directly related to the interatomic distances of Mn–O bonds. Therefore, the structure of the bending band and Mn–O bonds in CMO with oxygen vacancies should appear significantly reduced compared to the fine structure of PCMO.
The phonon modes below 270 cm−1 for all samples correspond to mixed vibrations of Ca/Pr atoms and octahedral [35]. Because the strong orthorhombic lattice is strongly distorted, none of the modes observed above 280 cm−1 can be considered as purely bending or stretching, as these modes considerably depend on the changes of both the Mn–O–Mn bond angles and the Mn–O bond lengths [36]. The phonon modes between 280 and 350 cm−1 correspond to the motions in which the Mn displacements are comparable with O atoms. For higher frequencies, the displacements of Mn and Ca/Pr atoms and phonons involve mostly the motions of oxygen atoms [35,36]. As shown in Figure 3 for CaMnO3−δ, the peaks relating to the vibration of apical and in-plane oxygen are indexed with (1) and (2), respectively. For the modes at 354, 368, 396, 514, and 560 cm−1, the in-plane oxygen vibrations dominate. For those at 430, 460, and 640 cm−1, the motions of the oxygen atoms in apical sites play the main role [35]. The infrared absorption spectrum of polycrystalline CaMnO3 reported and thoroughly discussed by Fedorov et al. [35] is similar to our results for CaMnO3−δ with a significant difference. The absorption bands corresponding to the vibration of apical oxygen atoms are so close to the results reported, while the vibration of Mn–O(2) considerably shifts compared to the results obtained for CaMnO3 which was free from oxygen vacancies. This may be due to the fact the oxygen vacancies are more or less localized in in-plane sites and consequently can affect the ion conductivity and the photocatalytic properties.
Figure 4a shows the survey XPS spectra obtained for CaMnO3−δ and Pr0.5Ca0.5MnO3. As shown in this figure, no other impurity elements were observed. Figure 4b,c show the doublet XPS spectrum of Ca 2p at binding energies around 345.5 and 349 eV assigning to Ca 2p3/2 and Ca 2p1/2, respectively. Ca2+ exhibits a binding energy (BE) shift toward higher energies with increasing Pr content due to the changes in the nearest neighbors of Ca atoms and, consequently, the electronic structure of the Ca atoms. In the case of the Ca 2p3/2 component, it can be seen that the peak is broadened in Pr0.5Ca0.5MnO3 compared to undoped CaMnO3−δ. This can be due to the formation of CaCO3 and/or CaO at the oxide surface due to Ca segregation [37]. The narrow scan spectrum of the oxygen 1s core level of samples is shown in Figure 4d,e. The oxygen peaks corresponding to O 1s can be resolved into two components at around 529 and 532.1 eV. This doublet peak of O 1s agrees with the earlier reports on perovskite oxides [37,38,39]. This doublet peak corresponds to the chemical shifts in the oxygen core level arising out of two kinds of chemical bonding. The lower binding energy component is assigned to the oxygen in the perovskite lattice (metal-oxygen bonds). The next component at around 531.9 eV can be associated with CaO and/or CaCO3 formed at the surface due to Ca segregation. In PCMO, the peak at BE energies of 532 eV has a higher intensity than the 529 eV line compared to CMO, indicating that Pr substitution in Ca sites helps to more occurrence probability of surface Ca/Pr–O bonds and Ca segregation [37].
The mixed-valence of surface manganese in perovskite manganites can be determined by analyzing the manganese doublet spectra corresponding to the spin-orbit split of manganese 2p peaks (Mn 2p3/2 and Mn 2p1/2) around 642.1 eV and 653.5 eV, respectively (Figure 5). Quantitative deconvolution and curve fitting results for Mn 2p3/2 give evidence for the existence of mixed-valence states of manganese. Here, the higher binding energy component at 642.6 eV relates to Mn4+, and the other component at 641.5 eV is assigned to Mn3+ [40]. The mixed-valence Mn ratios of Mn4+/Mn3+ of all samples are approximately determined as 1.37 and 0.92 for CaMnO3−δ and Pr0.5Ca0.5MnO3, respectively. By comparing this ratio obtained by XPS from the surface of CaMnO3−δ nanoparticles from one side and Mn valence estimated from XAS [27], it is observed that the surface of particles is more oxygen-deficient than the bulk. However, the ratio of Mn4+/Mn3+ for both surface and bulk of Pr0.5Ca0.5MnO3 particles is near one, which is consistent with the Mn valence obtained by XAS. These shreds of evidence indicate that the surface of Pr0.5Ca0.5MnO3 particles is more stable than CaMnO3−δ, consistent with in-situ HRTEM investigations reported before [28]. The third peak in Figure 5 (green line) corresponds to the satellite structure observed in about 5 eV higher binding energy than the Mn 2p3/2 clearly associated with ligand 2p to Mn 3d charge transfer [41]. Note that the satellite component comes from Mn4+, as shown in Figure 5b. In the case that the interaction between the 2p core hole and the correlated 3d valence electrons is sufficiently strong, satellites are present in the photoemission spectra accompanying the main lines.

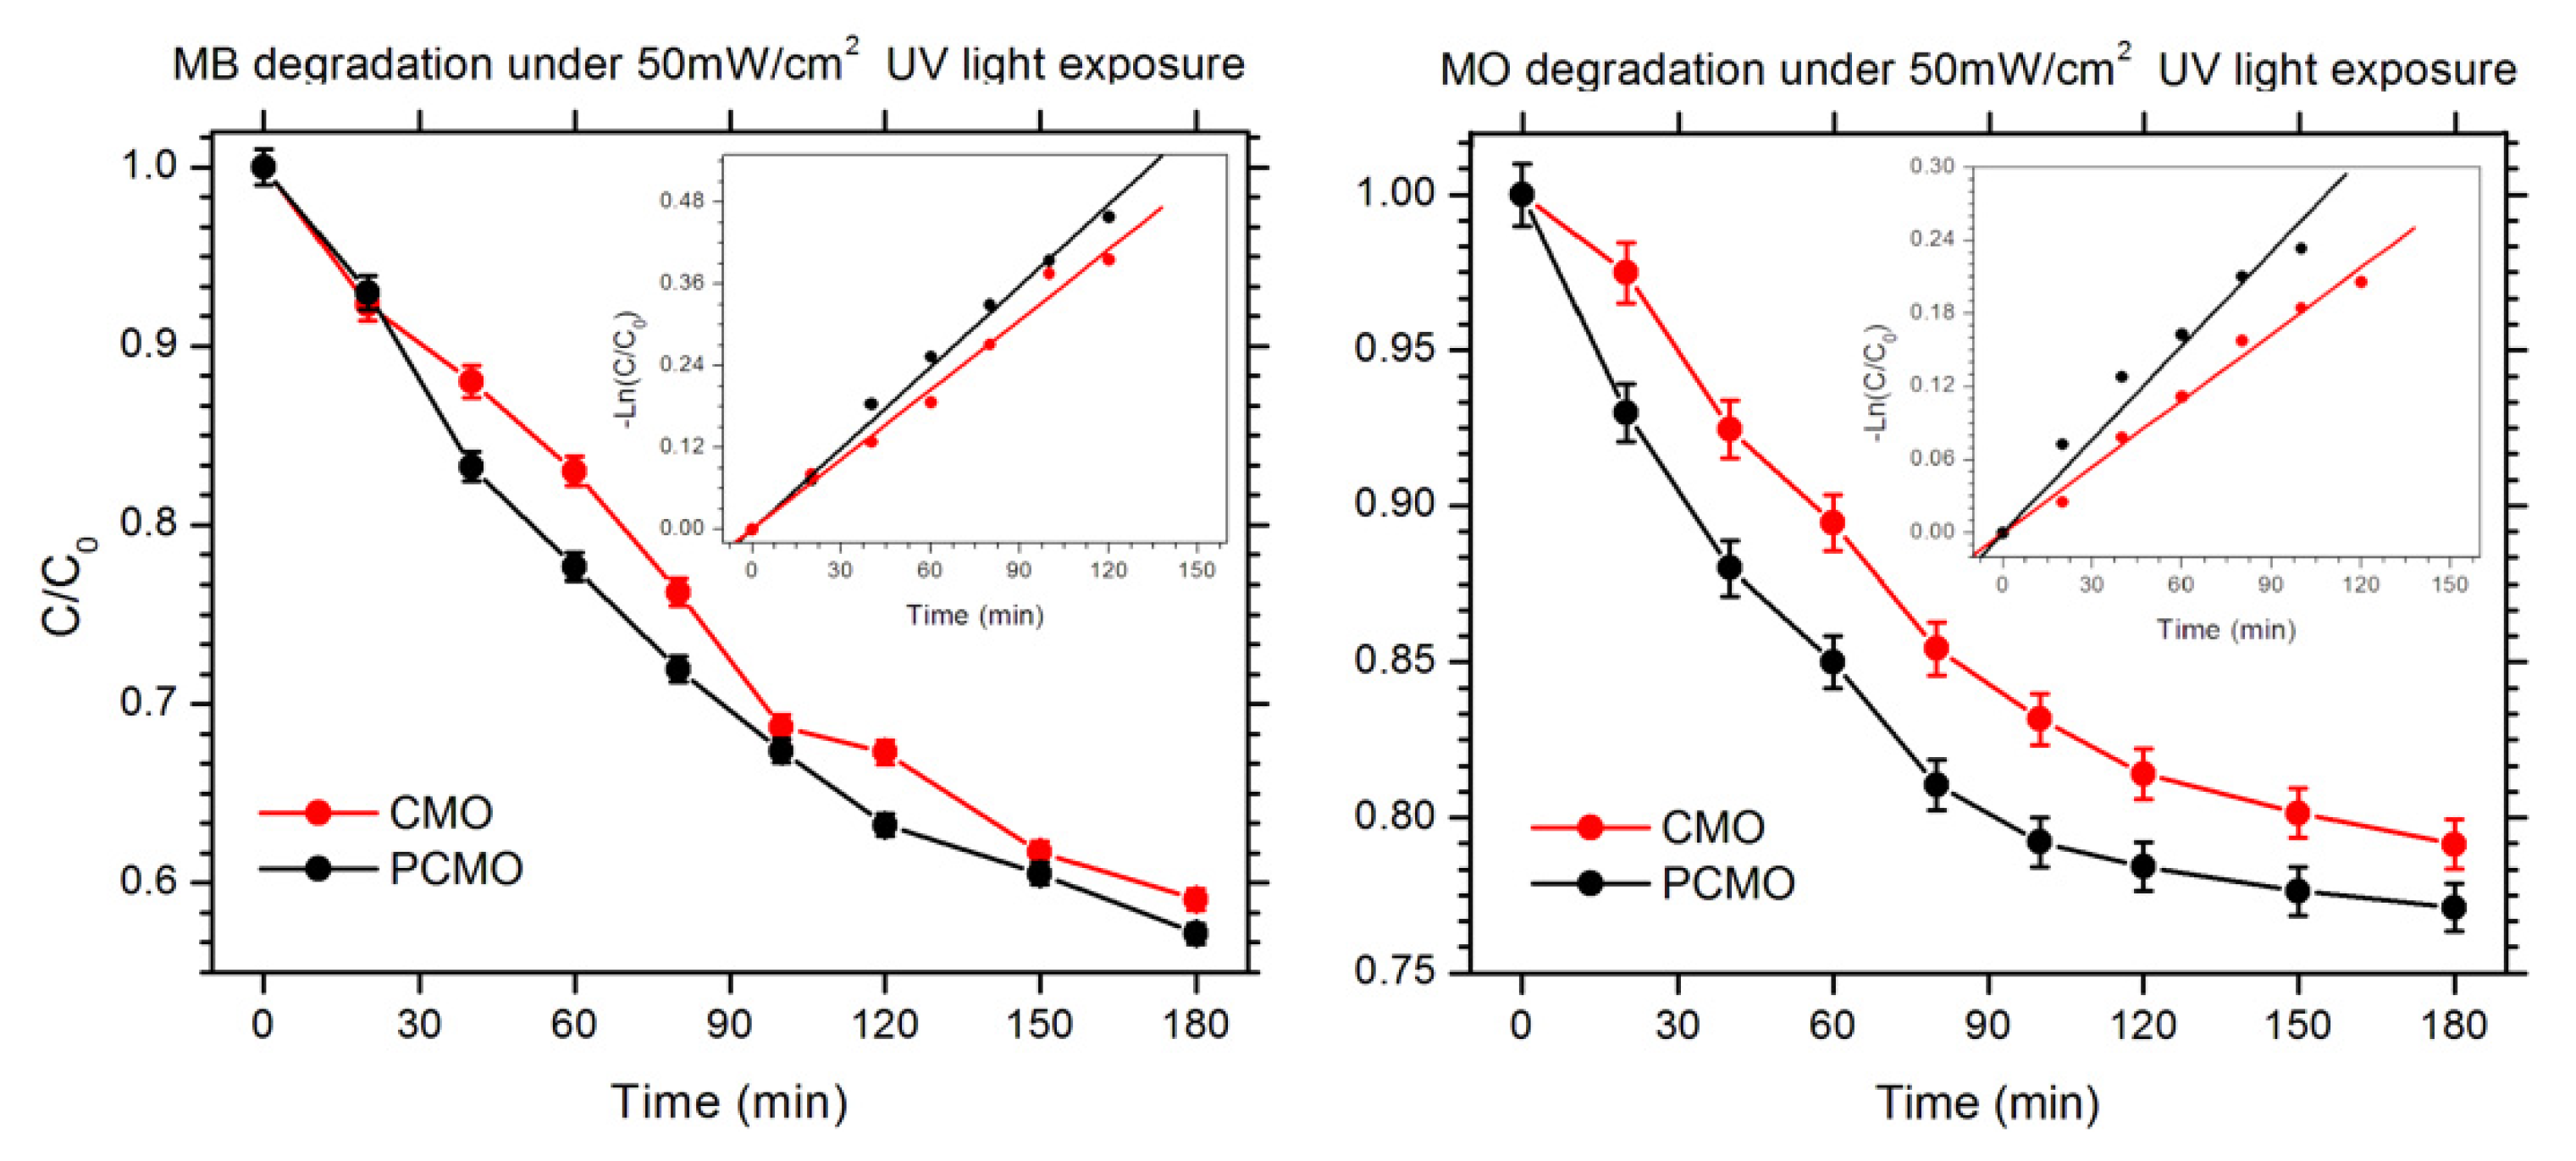
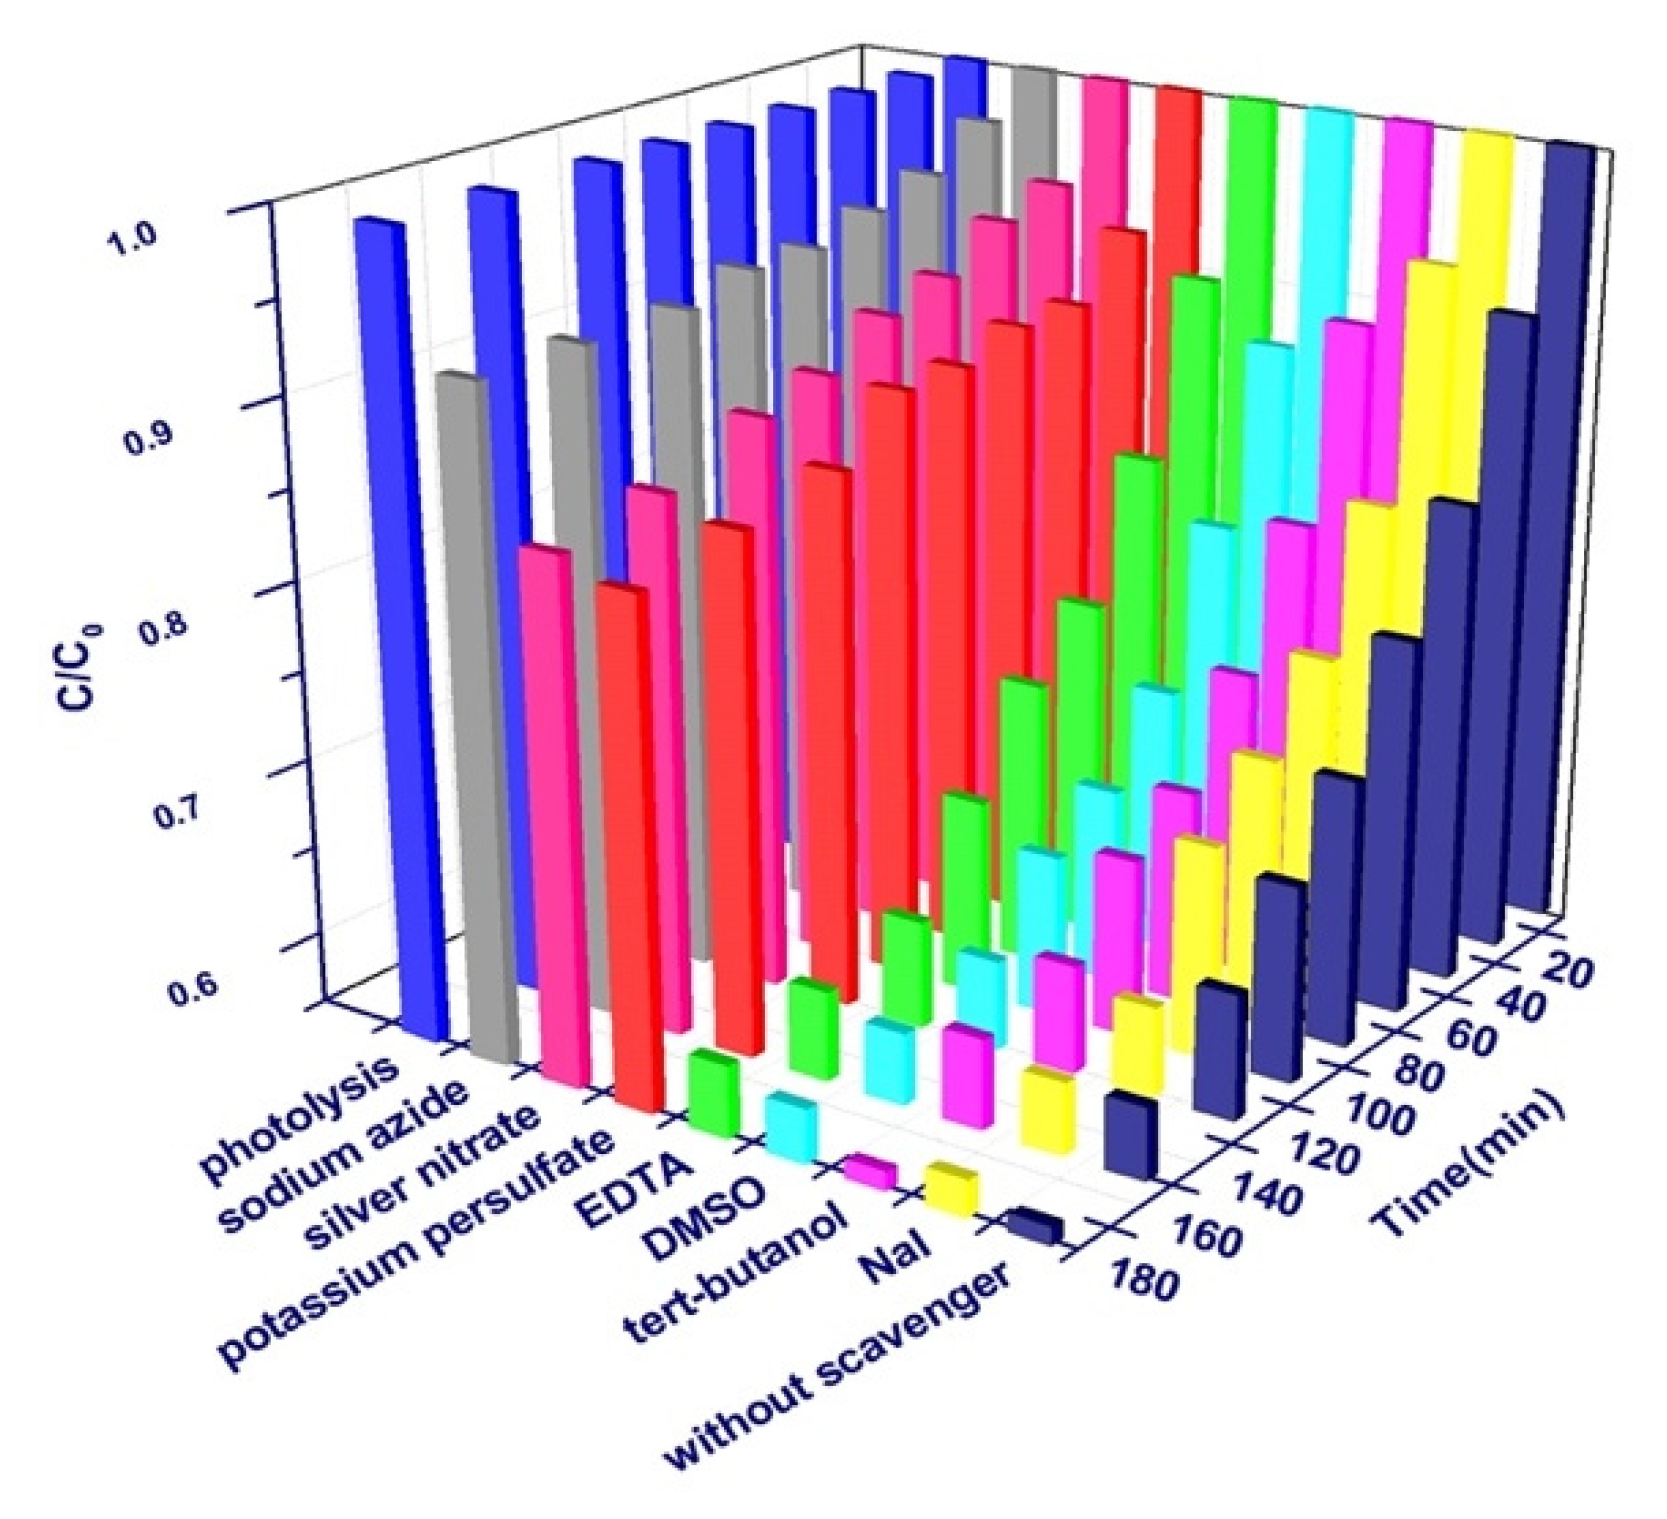
3.3. Photocatalytic Degradation Analysis

The photodegradation of MB and MO is given in Figure 6, which was carried out by degrading MB and MO in an aqueous solution under irradiation of a 200W HBO Mercury short-arc lamp as an ultraviolet light source. The decoloration rate of MB in the presence of CMO reached 43% at 180 min, which was close to 41% obtained for PCMO. However, the MO degradation performance of CMO and PCMO was limited to 23% and 21% within three hours, respectively.
Photocatalytic oxidation of organic pollutants follows Langmuir–Hinshelwood kinetics in which only the first-order form (−ln(C0/C) = kappt) is accounted for when the reactant concentration is very small [42]. In this equation, kapp is the apparent first-order reaction constant, and C0 and C are the reactant concentrations at the initial and later times, respectively. The photocatalytic activities of CMO and PCMO were evaluated by comparing the kapp obtained from the plots of −ln(C0/C) against irradiation time (insets of Figure 5) and listed in Table 1.
CMO and PCMO exhibited apparent rate constants of 3.98 × 10⁻³ min−1 and 3.42 × 10⁻³ min−1 for MB decomposition, respectively, showing higher activities than the values of 2.56 × 10⁻³ min−1 and 1.81 × 10⁻³ min−1 obtained for MO degradation. In addition, the photocatalytic activity of nanosized CMO is slightly better than PCMO.
Here, the main factors, including specific surface area, amount of chemisorbed oxygen at the surface of the particles, band structure, and electron-hole pair recombination rate, play significant roles in the photocatalytic activities of CMO and PCMO samples. The specific surface area has been obtained in our previous report [27] and given in Table 1. The higher specific surface area of CMO in comparison with PCMO, can provide a higher density of active sites [43,44]. In addition, the diffusion rate of the photogenerated electron-hole pair must be longer than the particle size to avoid recombination [45]. It should be noted that the recombination rate depends on the crystal phase and doping level. Nevertheless, enhanced photo-catalytic performance through the high surface-area-to-volume ratio of nanostructured PCMO can be achieved without detriment to the rates of charge carrier recombination in the composites. Consequently, the recombination rate of the carriers on the surface of the photocatalyst decreases with the decrease in particle size.
In addition to the surface area, the amount of chemisorbed oxygen usually associated with the mixed-valence states of the transition metal ion B is correlated with the photocatalytic activity [46,47,48]. It should be noted that the surface measured under UHV conditions can be restored by annealing at about 120 °C in 0.1 mbar O2.
Molecular oxygen has a great tendency to be adsorbed on a surface vacancy site, and consequently, a surface-adsorbed O ad-atom is formed. As shown in Figure 4b, the content of chemisorbed oxygen observed on the surface of PCMO particles is considerably higher than CMO, while the amount of oxygen vacancies created on the surface and bulk of CMO is much more pronounced. This may be due to the fact that in the ABO3 perovskites, the AO-terminated facets showed stronger binding to the adsorbed oxygen [49]. In addition, our FT-FIR results about CMO show that the oxygen vacancies are more or less localized in BO2 sites rather than AO. Thus, the amount of chemisorbed oxygen more constructively affects the photocatalytic activity of PCMO in comparison with CMO.
While all parameters play a role in photocatalytic activities, the activity can be described dominantly through the factors such as geometry and the electronic structure of the perovskites. The potential levels configuration of the reduced conduction band and the oxidized valence band have to be compared with the O2/O2 and the OH/H2O potential levels, respectively [50].
To clarify the photodegradation mechanism of MB by CMO under UV light, several scavengers were used. Generally, during the photodegradation of dyes, different reactive species, such as OH and O2, are generated in addition to the e/h+ pair. For example, the free electrons reduce the dissolved oxygen, resulting in the formation of superoxide ions, while the holes may react with H2O and OH to produce hydroxyl radicals [51]. The scavengers used in this work are EDTA for holes, K2S2O8 and AgNO3 as electron scavengers, sodium azide (NaN3) for singlet oxygen (1O2), DMSO for OHbulk, sodium iodide (NaI) for OHads, and tert-butanol as a free OH radical scavenger [52]. If the photodegradation of MB by the catalyst is performed because of any of the reactive species, the reaction is slowed down or inhibited in the presence of the corresponding scavenger [52]. For the sake of comparison, the MB degradation in the absence of a catalyst under light exposure was investigated for possible self-degradation of MB. Moreover, the MB degradation by CMO without using a scavenger was carried out. Figure 7 shows the variation of C/C0 for MB as a function of exposure time by adding different scavengers into the photocatalytic system. As this figure shows, no degradation in the absence of the photocatalyst for MB under light irradiation was observed. It means that MB is a photo-stable dye during our experiments. Moreover, this figure shows that the dye was degraded 43% within 180 min in the absence of any scavenger. Adding NaI, tert-butanol, DMSO, and EDTA had no considerable influence on the photodegradation process. Thus OH radicals and holes are not the main active species in MB photodegradation. As Figure 7 shows, the degradation efficiency of MB over CMO significantly decreases with the addition of NaN3, indicating that 1O2 is the main active species during the photocatalytic degradation process. Since the photocatalytic degradation efficiency decreases in the presents of K2S2O8 and AgNO3, electrons play a supplementary role. A possible mechanism for the degradation based on our radical scavenger results is as follows. Under light irradiation, electrons are excited from the valance band (VB) to the conduction band (CB) of CMO nanoparticles. Electrons react with dye and dissolved oxygen molecules. The excited electrons reduce the dissolved oxygen, resulting in the formation of singlet oxygen ions. These active singlet oxygen ions and electrons degrade MB dye, which was adsorbed on the surface of nanoparticles. Note that the interfacial modification and composition manipulation by coating provides an efficient way for stabilizing and improving photocatalytic activity [53,54].

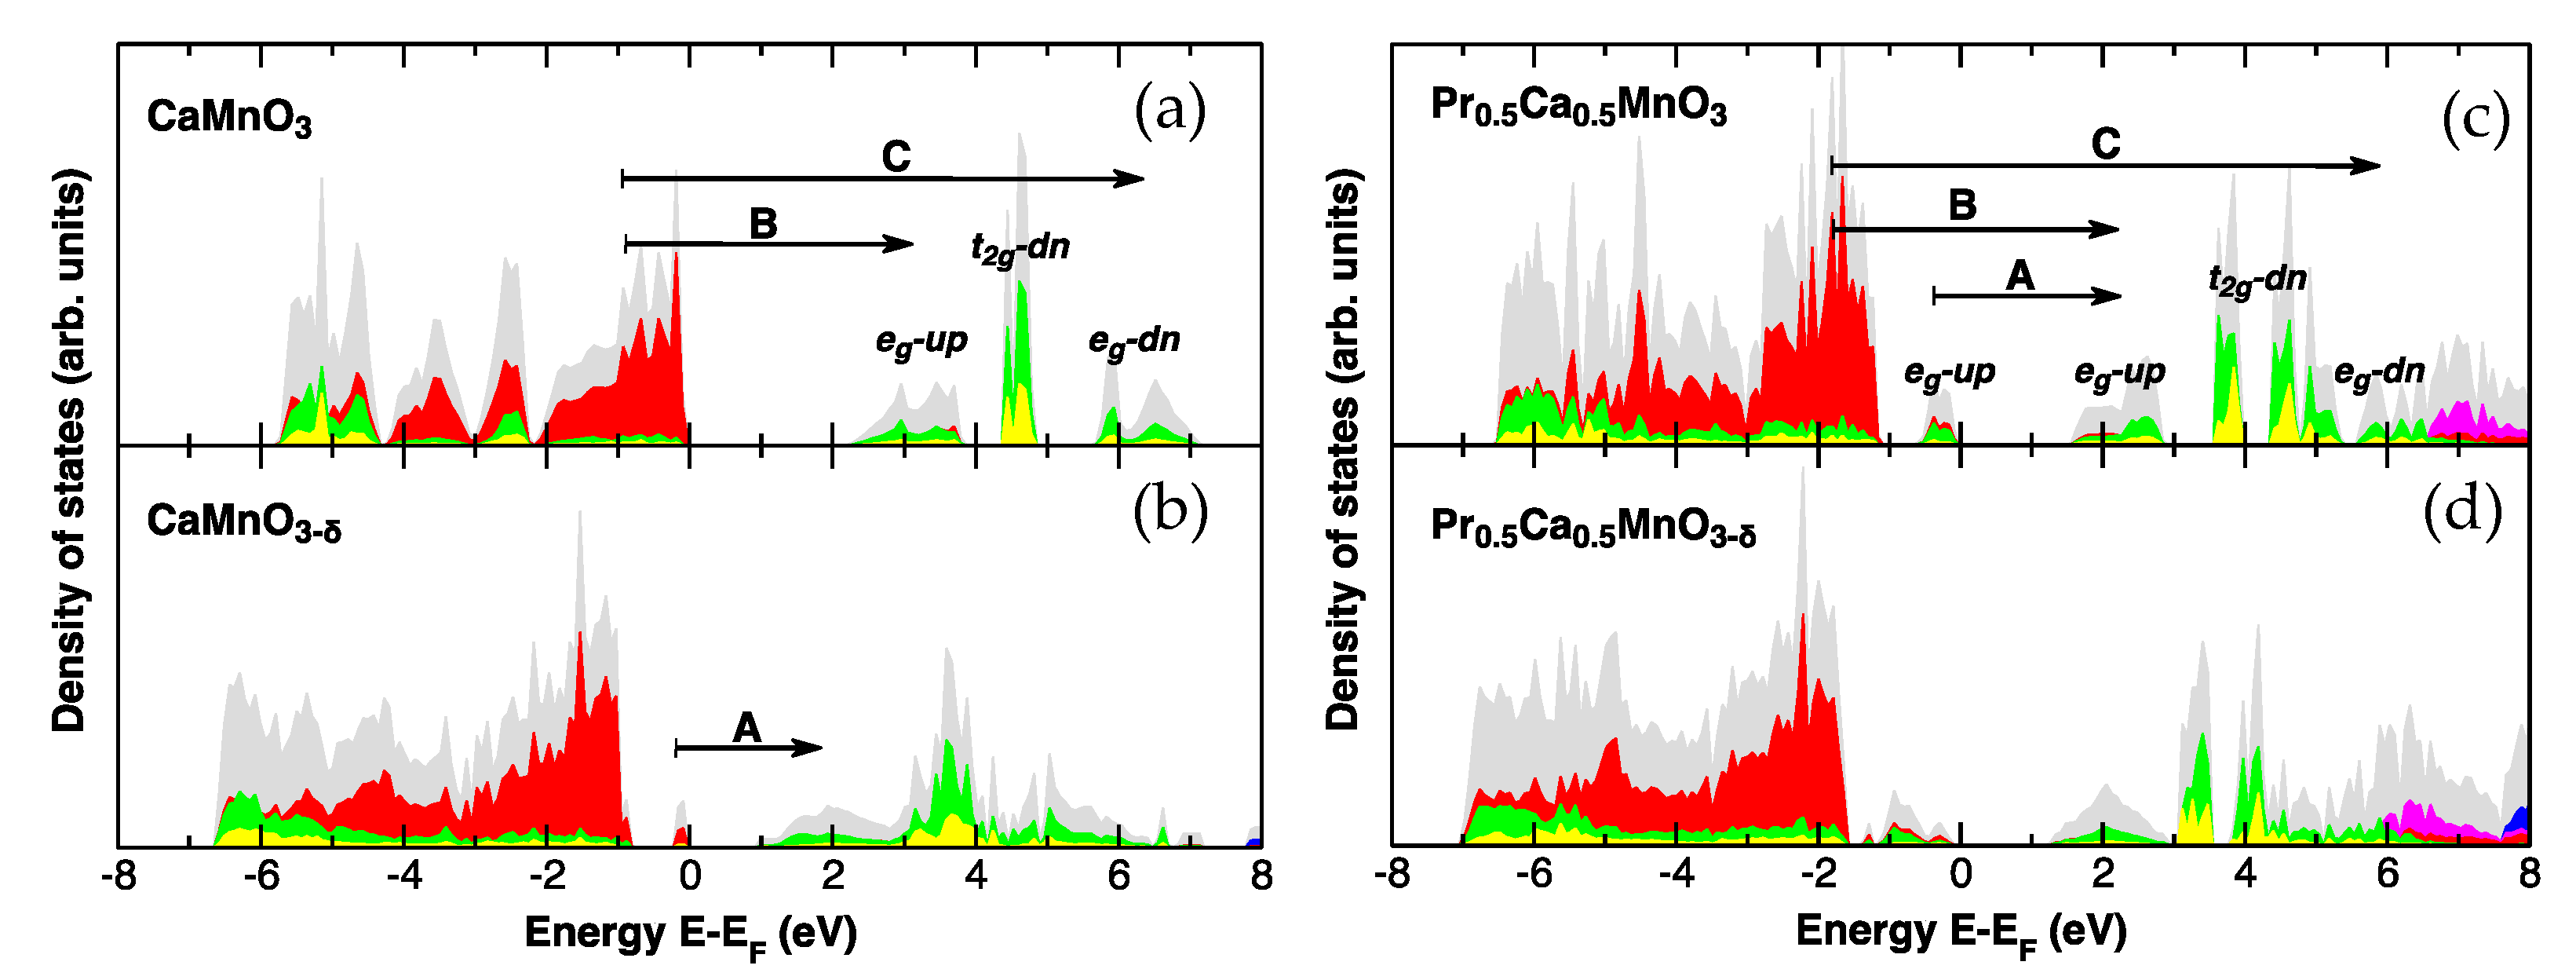
3.4. Electronic Structure of CaMnO3−δ and Pr1−xCaxMnO3

In order to obtain the potential levels of the conduction band Mn t2g↓ and eg↑, the theoretical calculation of the electronic band structures of CMO and PCMO was carried out with the HSE06 functional. CaMnO3 is the simple member of the Pr1−xCaxMnO3 manganite. This compound has an orthorhombic perovskite structure. Mn and O ions form a network of corner-sharing MnO6 octahedra with a formal valence of 4+ for the Mn cations. Thus, the Mn atoms have a 3d3 configuration. It means three electrons in the t2g orbitals and a strong crystal field splitting with the empty eg states. Ca donates its two valence electrons to the valence band of the O 2p character. In the CaMnO3, the size of the Ca ions is sufficiently small so that the MnO6 octahedra tilt increases the ionic attraction. The orientation of the tilt axis is determined by a bond angle force at the oxygen bridge.
The calculated DoS of stoichiometric CaMnO3 is shown in Figure 8a. The valance band is dominated by O p states (red) with the contribution of Mn d orbitals (green and yellow) at the bottom part of the valence band. Above the valence band, Mn d and Ca d states (blue) form the conduction band. The empty Mn d states are associated with different spin orientations according to their relative electron population, namely majority Mn eg states (yellow) from 2 eV to 4 eV and minority Mn t2g (green) and Mn eg stats (yellow) from 4 eV to 7 eV.
In CaMnO3, each O atom at apical and in-plane sites is surrounded by the two Mn atoms. The Mn–O bond lengths are similar in this structure, so O cages are not Jahn–Teller distorted.
The formation of an oxygen vacancy leaves two Mn ions under coordination, and as suggested by FT-FIR analysis, the O-vacancies are located at in-plane sites. The DoS for the supercell with the oxygen vacancy in the neutral charge state is shown in Figure 8b. As shown in this figure, the oxygen vacancy creates a deep level in the bandgap. This state is a vacancy-assisted polaron that originates from the majority spin direction of Mn eg states. The Fermi level shifts upward to the top part of the mid-gap states. More vacancy can separate more states from the bottom part of the Mn eg state in the conduction band to the top part of the valance band, as shown in Figure 8b.
In Pr0.5Ca0.5MnO3, which is oxygen stoichiometric as reported previously, each Mn ion is sixfold coordinated with O atoms which form an octahedron cage around the Mn ion. However, in the half-doped system, Pr0.5Ca0.5MnO3, the Zener polaron forms, which is characterized by an electron shared by two ferromagnetically coupled Mn neighbors. Characteristic of a Zener polaron are two neighboring Mn sites, both having a Jahn–Teller expansion along the axis of the pair. In Pr0.5Ca0.5MnO3, the lower Jahn–Teller band is itself split into two, of which only one is occupied. The origin of the splitting of the lower Jahn–Teller band is due to the formation of an antibond with the bridging oxygen ion [55,56].
The DoS for the half-doped system is shown in Figure 8c. The filled majority Mn eg states are located on top of the valence band, and the empty majority Mn eg states are located at the bottom part of the conduction band. The oxygen vacancy adds electrons in the unoccupied majority Mn eg states in the half-doped system and shifts them down to the top of the valence band. As shown in Figure 8d, the vacancy can separate more states from the majority Mn eg state in the conduction band.
As shown in Figure 8, photoexcited electrons can be placed in the Mn 3d t2g↓ conduction bands under UV light irradiation in both CaMnO3−δ and Pr0.5Ca0.5MnO3. The Mn 3d t2g↓ conduction band level is more negative than the O2/O2 reduction level, and the hybridized O 2p and Mn eg↑1valence band levels are more positive than H2O/OH oxidation level [51].
The calculated absorption spectra for CaMnO3 and Pr0.5Ca0.5MnO3 are shown in Figure 9. The Pr0.5Ca0.5MnO3 spectrum exhibits a considerable shift towards higher energies and a loss of absorption intensity between 2 eV and 4 eV compared to CaMnrO3. The intensity reduction in the Pr0.5Ca0.5MnO3 is attributed to the empty Mn eg states, which lower from CaMnO3 to Pr0.5Ca0.5MnO3. The Mn eg states become occupied by Pr doping, and they become unable to be used for optical excitation. Thus, this analysis sheds light on the experimentally obtained spectra of doped and undoped CaMnO3.

4. Conclusions

In this work, the photocatalytic dye decomposition over the perovskites CaMnO3−δ and Pr0.5Ca0.5MnO3 under UV irradiation has been studied. The kinetics of photocatalytic oxidation of organic pollutants showed that CaMnO3−δ was slightly more active than Pr0.5Ca0.5MnO3. The effects of surface oxygen vacancies and electronic structure on photocatalytic degradation have been investigated by XPS and DFT. The surface oxygen vacancies were found not to be a pivotal factor for improving the photocatalytic properties as long as the O-vacancies occupied the BO2 positions. The content of chemisorbed oxygen observed on the surface of PCMO particles is considerably higher than CMO, while the amount of oxygen vacancies created on the surface and bulk of CMO is much more pronounced. XPS studies showed the ratio of Mn4+/Mn3+ for both surface and bulk of Pr0.5Ca0.5MnO3 particles. Based on the theoretical calculation of the electronic structure, the photoexcitation of the electrons from the hybridized O 2p and Mn eg↑ valance band to the Mn eg↑ and Mn eg↓ were responsible for the O2 reduction under UV irradiation. This work may be useful for designing new Mn-based oxide photocatalysts.

Author Contributions

M.S. and M.E.A. designed the project and wrote the first version of the manuscript. M.E.A. and M.M. finished the experimental work. M.S. performed the DFT calculations. All authors have read and agreed to the published version of the manuscript.

Funding

This research received no external funding.

Institutional Review Board Statement

Not applicable.

Informed Consent Statement

Not applicable.

Data Availability Statement

The data that support the findings of this study are available from the corresponding author upon reasonable request.

Acknowledgments

We acknowledge the help of Joachim Bansmann in extracting the XPS measurements. We thank fruitful discussions with Julius Scholz and Christian Jooss. Financial support from the CRC 1073 (projects C03) and the CELEST (Center for Electrochemical Energy Storage Ulm-Karlsruhe) by the German Research Foundation (DFG) under Project ID 390874152 (POLiS Cluster of Excellence) are gratefully acknowledged. Computer time provided by the state of Baden-Wuerttemberg through bwHPC and the German Research Foundation (DFG) through grant no INST 40/575-1 FUGG (JUSTUS 2 cluster) is gratefully acknowledged.

Conflicts of Interest

The authors declare no conflict of interest.

References

  1. Yang, X.; Wang, D. Photocatalysis: From Fundamental Principles to Materials and Applications. ACS Appl. Energy Mater. 2018, 1, 6657–6693. [Google Scholar] [CrossRef]
  2. Likodimos, V. Advanced Photocatalytic Materials. Materials 2020, 13, 821. [Google Scholar] [CrossRef] [PubMed] [Green Version]
  3. Labhasetwar, N.; Saravanan, G.; Megarajan, S.K.; Manwar, N.; Khobragade, R.; Doggali, P.; Grasset, F. Perovskite-type catalytic materials for environmental applications. Sci. Technol. Adv. Mater. 2015, 16, 036002. [Google Scholar] [CrossRef] [PubMed]
  4. Dogan, F.; Lin, H.; Guilloux-Viry, M.; Peña, O. Focus on properties and applications of perovskites. Sci. Technol. Adv. Mater. 2015, 16, 020301. [Google Scholar] [CrossRef]
  5. Islam, M.S. Ionic transport in ABO3 perovskite oxides: A computer modelling tour. J. Mater. Chem. 2000, 10, 1027–1038. [Google Scholar] [CrossRef]
  6. Sotoudeh, M.; Rajpurohit, S.; Blöchl, P.; Mierwaldt, D.; Norpoth, J.; Roddatis, V.; Mildner, S.; Ifland, B.; Jooss, C. Electronic structure of Pr1−xCaxMnO3. Phys. Rev. B 2016, 95, 235150. [Google Scholar] [CrossRef] [Green Version]
  7. Benedetti, P.; Zeyher, R. Jahn-Teller distortion and electronic correlation effects in undoped manganese perovskites. Phys. Rev. B 1999, 59, 9923–9928. [Google Scholar] [CrossRef] [Green Version]
  8. Peña, M.A.; Fierro, J.L.G. Chemical Structures and Performance of Perovskite Oxides. Chem. Rev. 2001, 101, 1981–2018. [Google Scholar] [CrossRef] [PubMed]
  9. Long, Y.W.; Hayashi, N.; Saito, T.; Azuma, M.; Muranaka, S.; Shimakawa, Y. Temperature-induced A–B intersite charge transfer in an A-site-ordered LaCu3Fe4O12 perovskite. Nature 2009, 458, 60–63. [Google Scholar] [CrossRef] [PubMed]
  10. Wang, D.; Angel, R.J. Octahedral tilts, symmetry-adapted displacive modes and polyhedral volume ratios in perovskite structures. Acta Crystallogr. Sect. B Struct. Sci. 2011, 67, 302–314. [Google Scholar] [CrossRef] [PubMed]
  11. Levin, I.; Bendersky, L.A. Symmetry classification of the layered perovskite-derived AnBnX3n+2 structures. Acta Crystallogr. Sect. B Struct. Sci. 1999, 55, 853–866. [Google Scholar] [CrossRef] [PubMed]
  12. Ray, R.; Himanshu, A.; Sen, P.; Kumar, U.; Richter, M.; Sinha, T. Effects of octahedral tilting on the electronic structure and optical properties of d0 double perovskites A2ScSbO6 (A=Sr, Ca). J. Alloy. Compd. 2017, 705, 497–506. [Google Scholar] [CrossRef]
  13. Gao, Y.; Wang, J.; Wu, L.; Bao, S.; Shen, Y.; Lin, Y.; Nan, C. Tunable magnetic and electrical behaviors in perovskite oxides by oxygen octahedral tilting. Sci. China Mater. 2015, 58, 302–312. [Google Scholar] [CrossRef] [Green Version]
  14. Teh, Y.W.; Chee, M.K.T.; Kong, X.Y.; Yong, S.-T.; Chai, S.-P. An insight into perovskite-based photocatalysts for artificial photosynthesis. Sustain. Energy Fuels 2019, 4, 973–984. [Google Scholar] [CrossRef]
  15. Kanhere, P.; Chen, Z. A Review on Visible Light Active Perovskite-Based Photocatalysts. Molecules 2014, 19, 19995–20022. [Google Scholar] [CrossRef] [PubMed] [Green Version]
  16. Kumar, A.; Kumar, A.; Krishnan, V. Perovskite Oxide Based Materials for Energy and Environment-Oriented Photocatalysis. ACS Catal. 2020, 10, 10253–10315. [Google Scholar] [CrossRef]
  17. Lim, P.F.; Leong, K.H.; Sim, L.C.; Saravanan, P.; Aziz, A.A. Perovskite Oxide–Based Photocatalysts for Excellent Visible Light–Driven Photocatalysis and Energy Conversion. In Plant Nanobionics; Prasad, R., Ed.; Approaches in Nanoparticles, Biosynthesis, and Toxicity; Springer: Cham, Switzerland, 2019; Volume 2, pp. 35–54. [Google Scholar] [CrossRef]
  18. Husanu, M.-A.; Vistoli, L.; Verdi, C.; Sander, A.; Garcia, V.; Rault, J.; Bisti, F.; Lev, L.L.; Schmitt, T.; Giustino, F.; et al. Electron-polaron dichotomy of charge carriers in perovskite oxides. Commun. Phys. 2020, 3, 62. [Google Scholar] [CrossRef] [Green Version]
  19. Huang, C.; Fang, H.; Xu, Z.; Zheng, X.; Ruan, X. Evolutions of geometry and electronic state introduced by oxygen vacancy for CaMnO3 compound. Results Phys. 2019, 13, 102337. [Google Scholar] [CrossRef]
  20. Du, J.; Zhang, T.; Cheng, F.; Chu, W.; Wu, Z.; Chen, J. Nonstoichiometric Perovskite CaMnO3−δ for Oxygen Electrocatalysis with High Activity. Inorg. Chem. 2014, 53, 9106–9114. [Google Scholar] [CrossRef]
  21. Soleimani Varaki, M.; Jafari, A.; Ebrahimizadeh Abrishami, M. Laser-induced photocatalytic reduction of CO2 into methanol over perovskite LaMnO3. J. Laser Appl. 2020, 32, 042005. [Google Scholar] [CrossRef]
  22. Wang, T.; Qian, X.; Yue, D.; Yan, X.; Yamashita, H.; Zhao, Y. CaMnO3 perovskite nanocrystals for efficient peroxydisulfate activation. Chem. Eng. J. 2020, 398, 125638. [Google Scholar] [CrossRef]
  23. Zhang, G.; Dong, W.; Huang, X.; Zou, J. Oxygen vacancy induced enhancement of photochemical water oxidation on calcium manganese oxide catalyst. Catal. Commun. 2017, 89, 117–120. [Google Scholar] [CrossRef]
  24. Gagrani, A.; Sousa, S.; Monteiro, O.; Tsuzuki, T. Solid state synthesis and photocatalytic activity of bio-inspired calcium manganese oxide catalysts. J. Solid State Chem. 2020, 288, 121390. [Google Scholar] [CrossRef]
  25. Klarbring, J.; Simak, S. Nature of the octahedral tilting phase transitions in perovskites: A case study of CaMnO3. Phys. Rev. B 2018, 97, 024108. [Google Scholar] [CrossRef] [Green Version]
  26. Yu, X.; Li, F.; Huang, C.; Fang, H.; Xu, Z. Anisotropic electronic structure and geometry of CaMnO3 perovskite with oxygen nonstoichiometry. J. Mater. Res. Technol. 2020, 9, 6595–6601. [Google Scholar] [CrossRef]
  27. Abrishami, M.E.; Risch, M.; Scholz, J.; Roddatis, V.; Osterthun, N.; Jooss, C. Oxygen Evolution at Manganite Perovskite Ruddlesden-Popper Type Particles: Trends of Activity on Structure, Valence and Covalence. Materials 2016, 9, 921. [Google Scholar] [CrossRef] [Green Version]
  28. Mierwaldt, D.; Roddatis, V.; Risch, M.; Scholz, J.; Geppert, J.; Abrishami, M.E.; Jooss, C. Environmental TEM Investigation of Electrochemical Stability of Perovskite and Ruddlesden-Popper Type Manganite Oxygen Evolution Catalysts. Adv. Sustain. Syst. 2017, 1, 1700109. [Google Scholar] [CrossRef] [Green Version]
  29. Kohn, W.; Sham, L.J. Self-consistent equations including exchange and correlation effects. Phys. Rev. 1965, 140, A1133–A1138. [Google Scholar] [CrossRef] [Green Version]
  30. Perdew, J.P.; Burke, K.; Ernzerhof, M. Generalized gradient approximation made simple. Phys. Rev. Lett. 1996, 77, 3865. [Google Scholar] [CrossRef]
  31. Kresse, G.; Hafner, J. Ab initio molecular dynamics for liquid metals. Phys. Rev. B 1993, 47, 558–561. [Google Scholar] [CrossRef]
  32. Kresse, G.; Furthmüller, J. Efficient iterative schemes for ab initio total-energy calculations using a plane-wave basis set. Phys. Rev. B 1996, 54, 11169–11186. [Google Scholar] [CrossRef]
  33. Kresse, G.; Joubert, D. From ultrasoft pseudopotentials to the projector augmented-wave method. Phys. Rev. B 1999, 59, 1758–1775. [Google Scholar] [CrossRef]
  34. Fedorov, I.; Lorenzana, J.; Dore, P.; De Marzi, G.; Maselli, P.; Calvani, P.; Cheong, S.W.; Koval, S.; Migoni, R. Infrared-active phonons of LaMnO3 and CaMnO3. Phys. Rev. B 1999, 60, 11875–11878. [Google Scholar] [CrossRef]
  35. Sopracase, R.; Gruener, G.; Olive, E.; Soret, J.-C. Infrared study of the phonon modes in PrMnO3 and CaMnO3. Phys. B: Condens. Matter 2010, 405, 45–52. [Google Scholar] [CrossRef] [Green Version]
  36. Celorrio, V.; Calvillo, L.; Dann, E.; Granozzi, G.; Aguadero, A.; Kramer, D.; Russell, A.E.; Fermín, D.J. Oxygen reduction reaction at LaxCa1−xMnO3 nanostructures: Interplay between A-site segregation and B-site valency. Catal. Sci. Technol. 2016, 6, 7231–7238. [Google Scholar] [CrossRef] [Green Version]
  37. Joy, L.K.; Shanmukharao Samatham, S.; Thomas, S.; Ganesan, V.; Al-Harthi, S.; Liebig, A.; Albrecht, M.; Anantharaman, M.R. Colossal thermoelectric power in charge ordered lanthanum calcium manganites (La0.5Ca0.5MnO3). J. Appl. Phys. 2014, 116, 213701. [Google Scholar] [CrossRef] [Green Version]
  38. Machkova, M.; Brashkova, N.; Ivanov, P.; Carda, J.; Kozhukharov, V. Surface behavior of Sr-doped lanthanide perovskites. Appl. Surf. Sci. 1997, 119, 127–136. [Google Scholar] [CrossRef]
  39. Ivanov-Emin, B.N.; Nevskaya, N.A.; Zaitsev, B.E.; Ivanova, T. Synthesis and properties of calcium and strontium hydroxomanganates(III). Zh. Neorg. Khim. 1982, 27, 3101–3104. [Google Scholar]
  40. Nelson, A.J.; Reynolds, J.G.; Roos, J.W. Core-level satellites and outer core-level multiplet splitting in Mn model compounds. J. Vac. Sci. Technol. A Vac. Surf. Film. 2000, 18, 1072–1076. [Google Scholar] [CrossRef] [Green Version]
  41. Ollis, D.F. Kinetics of Photocatalyzed Reactions: Five Lessons Learned. Front. Chem. 2018, 6, 378. [Google Scholar] [CrossRef]
  42. Adhikari, S.P.; Lachgar, A. Effect of particle size on the photocatalytic activity of BiNbO4 under visible light irradiation. J. Physics: Conf. Ser. 2016, 758, 012017. [Google Scholar] [CrossRef] [Green Version]
  43. Liu, L.; Luo, C.; Xiong, J.; Yang, Z.; Zhang, Y.; Cai, Y.; Gu, H. Reduced graphene oxide (rGO) decorated TiO2 microspheres for visible-light photocatalytic reduction of Cr(VI). J. Alloy. Compd. 2017, 690, 771–776. [Google Scholar] [CrossRef]
  44. Lee, S.-Y.; Park, S.-J. TiO2 photocatalyst for water treatment applications. J. Ind. Eng. Chem. 2013, 19, 1761–1769. [Google Scholar] [CrossRef]
  45. Nolan, P.D.; Wheeler, M.C.; Davis, J.E.; Mullins, C.B. Mechanisms of Initial Dissociative Chemisorption of Oxygen on Transition-Metal Surfaces. Accounts Chem. Res. 1998, 31, 798–804. [Google Scholar] [CrossRef]
  46. Zhang, L.; Wang, S.; Lu, C. Detection of Oxygen Vacancies in Oxides by Defect-Dependent Cataluminescence. Anal. Chem. 2015, 87, 7313–7320. [Google Scholar] [CrossRef] [PubMed]
  47. Wu, S.; Yang, Y.; Lu, C.; Ma, Y.; Yuan, S.; Qian, G. Soot Oxidation over CeO2 or Ag/CeO2: Influences of Bulk Oxygen Vacancies and Surface Oxygen Vacancies on Activity and Stability of the Catalyst. Eur. J. Inorg. Chem. 2018, 2018, 2944–2951. [Google Scholar] [CrossRef]
  48. Kotomin, E.A.; Mastrikov, Y.A.; Heifets, E.; Maier, J. Adsorption of atomic and molecular oxygen on the LaMnO3(001) surface: Ab initio supercell calculations and thermodynamics. Phys. Chem. Chem. Phys. 2008, 10, 4644–4649. [Google Scholar] [CrossRef] [PubMed]
  49. Sang, Y.; Liu, H.; Umar, A. Photocatalysis from UV/Vis to Near-Infrared Light: Towards Full Solar-Light Spectrum Activity. ChemCatChem 2014, 7, 559–573. [Google Scholar] [CrossRef]
  50. Chabri, S.; Dhara, A.; Show, B.; Adak, D.; Sinha, A.; Mukherjee, N. Mesoporous CuO–ZnO p–n heterojunction based nanocomposites with high specific surface area for enhanced photocatalysis and electrochemical sensing. Catal. Sci. Technol. 2015, 6, 3238–3252. [Google Scholar] [CrossRef]
  51. Shafaee, M.; Goharshadi, E.K.; Mashreghi, M.; Sadeghinia, M. TiO2 nanoparticles and TiO2@graphene quantum dots nanocomposites as effective visible/solar light photocatalysts. J. Photochem. Photobiol. Chem. 2018, 357, 90–102. [Google Scholar] [CrossRef]
  52. Mohammadi, M.; Rezaee Roknabadi, M.; Behdani, M.; Kompany, A. Enhancement of visible and UV light photocatalytic activity of rGO-TiO2 nanocomposites: The effect of TiO2/Graphene oxide weight ratio. Ceram. Int. 2019, 45, 12625–12634. [Google Scholar] [CrossRef]
  53. Weng, B.; Yang, M.-Q.; Zhang, N.; Xu, Y.-J. Toward the enhanced photoactivity and photostability of ZnO nanospheres via intimate surface coating with reduced graphene oxide. J. Mater. Chem. A 2014, 2, 9380–9389. [Google Scholar] [CrossRef]
  54. Weng, B.; Lu, K.-Q.; Tang, Z.; Chen, H.M.; Xu, Y.-J. Stabilizing ultrasmall Au clusters for enhanced photoredox catalysis. Nat. Commun. 2018, 9, 1543. [Google Scholar] [CrossRef] [Green Version]
  55. Raiser, D.; Mildner, S.; Ifland, B.; Sotoudeh, M.; Blöchl, P.; Techert, S.; Jooss, C. Evolution of Hot Polaron States with a Nanosecond Lifetime in a Manganite Perovskite. Adv. Energy Mater. 2017, 7, 1602174. [Google Scholar] [CrossRef] [Green Version]
  56. Sotoudeh, M. First-principles calculations of polaronic correlations and reactivity of oxides: Manganites, water oxidation and Pd/rutile interface. Ph.D. Thesis, Fakultät für Physik (inkl. GAUSS), Georg-August-University Göttingen, Göttingen, Germany, 2019. [Google Scholar] [CrossRef]
Figure 1. XRD patterns of CaMnO3 (CMO) and Pr1-xCaxMnO3 (PCMO). The indices correspond to the space group Pnma.
Crystals 12 01728 g001
Figure 2. SEM micrographs of (a) CaMnO3 (CMO) and (b) Pr1-xCaxMnO3 (PCMO). The average particle size was 70 and 64 nm for CMO and PCMO, respectively.
Crystals 12 01728 g002
Figure 3. Optical density of polycrystalline CaMnO3−δ and Pr0.5Ca0.5MnO3. The indices (1) and (2) indicate the bands corresponding to the vibrations of apical and in-plane oxygens, respectively.
Crystals 12 01728 g003
Figure 4. XPS survey spectra (a), Ca 2p (b,c), and O 1s (d,e) photoemission spectra of CaMnO3−δ and Pr0.5Ca0.5MnO3 taken in normal emission using an Al Kα X-ray source. The peaks in the O 1s region were assigned to lattice oxygen and surface hydroxyl groups, carbonyl groups, and CaO/CaCO3.
Crystals 12 01728 g004
Figure 5. Energy spectroscopies of Mn 2p recorded for (a) CaMnO3−δ and (b) Pr0.5Ca0.5MnO3 nanoparticles. The peaks in the 2p3/2 region are assigned to the binding energies of Mn3+ and Mn4+.
Crystals 12 01728 g005
Figure 6. Photocatalytic decomposition of methylene blue (left) and methyl orange (right) over CMO and PCMO catalysts. The insets are the plots of Ln(C0/C) versus time. The slopes of these linear plots are used to obtain the values of kapp summarized in Table 1.
Crystals 12 01728 g006
Figure 7. Effect of different radical scavengers (3 mmol/L) on the photodegradation of MB (5 ppm) CMO (1 mg/mL). C/C0 ratio (C0 is the initial concentration) vs. irradiation time.
Crystals 12 01728 g007
Figure 8. Total and projected DoS of (a) CaMnO3, (b) CaMnO3 including O-vacancy, (c) Pr0.5Ca0.5MnO3, and (d) Pr0.5Ca0.5MnO3 including O-vacancy. The graph shows the total DoS (grey) and the projected DoS for O p (red), Mn t2g (green), Mn eg (yellow), Ca d (blue), and Pr f (magenta). The arrows indicate the dipole-allowed optical transitions within the Mn d orbitals (A) and from O p states to the majority (B) and minority (C) Mn eg states.
Crystals 12 01728 g008
Figure 9. Calculated absorption spectra for CaMnO3 (black) and Pr0.5Ca0.5MnO3 (red). The absorption edge from 2 eV to 4 eV is attributed to the occupation of the Mn eg states, which demonstrate the lowering of the absorption intensity due to doping in Pr0.5Ca0.5MnO3, while they are empty and thus visible in the spectrum of CaMnO3.
Crystals 12 01728 g009
Table 1. Apparent first-order reaction constants obtained for MO and MB, and the band structure parameters determined by ab initio studies.
MaterialParticle Size (nm) [27]Specific Surface Area (cm2/mg)kapp for MB
(10−3 min−1)
kapp for MO
(10−3 min−1)
CMO7081.633.982.56
PCMO6449.963.421.81
Publisher’s Note: MDPI stays neutral with regard to jurisdictional claims in published maps and institutional affiliations.

