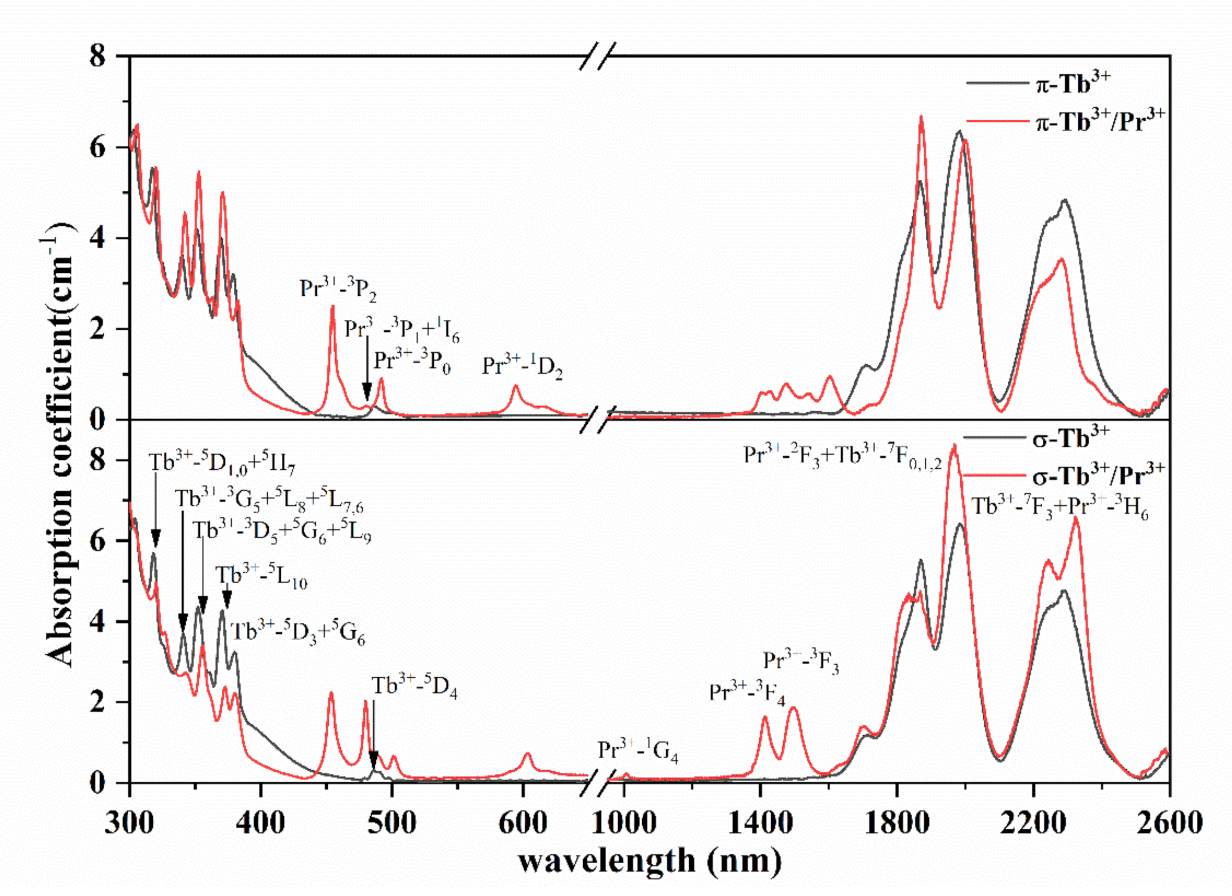
3.2. Absorption Spectra
The room-temperature polarized absorption spectra of the Tb
3+ single-doped and Tb
3+/Pr
3+ co-doped CYA crystals are shown in
Figure 4. There are eight distinct absorption bands related to transitions from the ground multiplet
7F
6 to the excited multiplets of the Tb
3+, which are also indicated in
Figure 4, as are the transitions of the Pr
3+ absorption band from its ground state
3H
4 to its excited state. In
Figure 4, one can see that the weak absorption peaks of Tb
3+ are located at 320 nm, 340 nm, 351 nm, 370 nm, 380 nm, and 487 nm, corresponding to the
7F
6→
5H
7 +
5D
0,1,
5L
6 +
5L
7,8 +
5G
3,
5L
9 +
5G
4 +
5D
2,
5L
10,
5D
3 +
5G
6, and
5D
4 transitions in the visible range, respectively. We can see two strong absorption peaks located around 1984 nm and 2293 nm in the near-infrared region, corresponding to transitions from
7F
6 to the higher multiplets
7F
J (J = 0,1,2,3), respectively. In those absorption bands, the weak peak around 487 nm in the
7F
6→
5D
4 transition is consistent with commercial semiconductor lasers, which are commonly used as the pump source of Tb
3+ lasers. The π and σ polarization absorption cross-sections of Tb
3+:CYA at 487 nm were 1.53 × 10
−22 cm
2 and 1.55 × 10
−22 cm
2, which are smaller than those of Tb
3+:YAlO
3 (3.0 × 10
−22 cm
2 @ 489 nm) but much larger than the value of Tb
3+:CaF
2 (0.6 × 10
−22 cm
2 @ 485 nm) [
14,
19]. The π and σ polarization absorption cross-sections of Tb
3+/Pr
3+:CYA at 492 nm and 489 nm were 5.23 × 10
−22 cm
2 and 4.04 × 10
−22 cm
2, respectively, which are much larger than that of Tb
3+:CYA. The full widths at half-maximum (FWHMs) of the Tb
3+:CYA crystal around 487 nm were measured to be 9.39 nm and 8.93 nm for σ and π polarization, respectively, which are larger than the values for Sr
3Tb
2(BO
3)
4 (8.5 nm at 486 nm) and Tb
3+:YAlO
3 (3.64 nm at 486 nm) [
13,
20]. The absorption cross-sections were strengthened, meaning that the co-doped Pr
3+ could be used to solve the problem of the weak absorption cross-section of the
7F
6→
5D
4 transition in Tb
3+.
3.3. Judd–Ofelt Analysis
The spectral characteristics of the Tb
3+:CYA and Tb
3+/Pr
3+:CYA crystals were analyzed by the Judd–Ofelt (J–O) theory. The calculation process of the J–O theory is similar to that described in Ref. [
20]. The mean wavelength (
) and the experimental and calculated line strengths for the Tb
3+:CYA and Tb
3+/Pr
3+:CYA crystals in both polarizations are listed in
Table 1 and
Table 2, respectively. In
Table 3, the calculated J–O intensity parameters of Tb
3+ in CYA and other crystals are listed. On account of the polarized absorption, the effective J–O intensity parameters can be obtained by Ω
eff = (
+
)/3. According to some previous works, Ω
2 is a covalency-dependent parameter, while Ω
4 and Ω
6 are structure-dependent ones, and the former depends on covalent bonding between coordination ions and rare-earth ions [
21,
22]. The Ω
eff,2 of Tb
3+ in the CYA crystal was much greater than that in CaF
2 and YAG, showing that a higher Ω
eff,2 value means a higher covalency of the metal–ligand bond, along with low symmetry of the coordination structure around Tb
3+. The value of Ω
eff,4/Ω
eff,6 was 1.61 and 1.94 in the Tb
3+:CYA and Tb
3+/Pr
3+:CYA crystals, respectively, which are higher than the values in LiYF
4, YAG, and CGA, but smaller than that in YAP.
The ED spontaneous transition rate (A
ED) was calculated on the basis of the obtained J–O parameters. The mean spontaneous transition rate (A) was obtained by A = (
+
)/3 with A =
+
. Then, the fluorescence branching ratio (
) and radiation lifetime (
) were assessed and tabulated, as shown in
Table 4 and
Table 5, respectively, indicating that the transition
5D
4→
7F
5 of Tb
3+ had the greatest
in both Tb
3+- and Tb
3+/Pr
3+-doped CYA crystals, with values of 64.7% and 64.8%, respectively. The
for the
5D
4 multiplets of the Tb
3+- and Tb
3+/Pr
3+-doped CYA crystals was calculated to be 1.805 ms and 1.86 ms, respectively—higher than the 1.7 ms recorded for Tb
3+:YAP [
19]. Compared with the Tb
3+:CYA, the value of Ω
2 was slightly larger in Tb
3+/Pr
3+:CYA, indicating a more disordered local symmetry of Tb
3+ in the co-doped crystal. This result was similar to that reported for a Tb
3+/Pr
3+:CaF
2 crystal by Liu [
14].
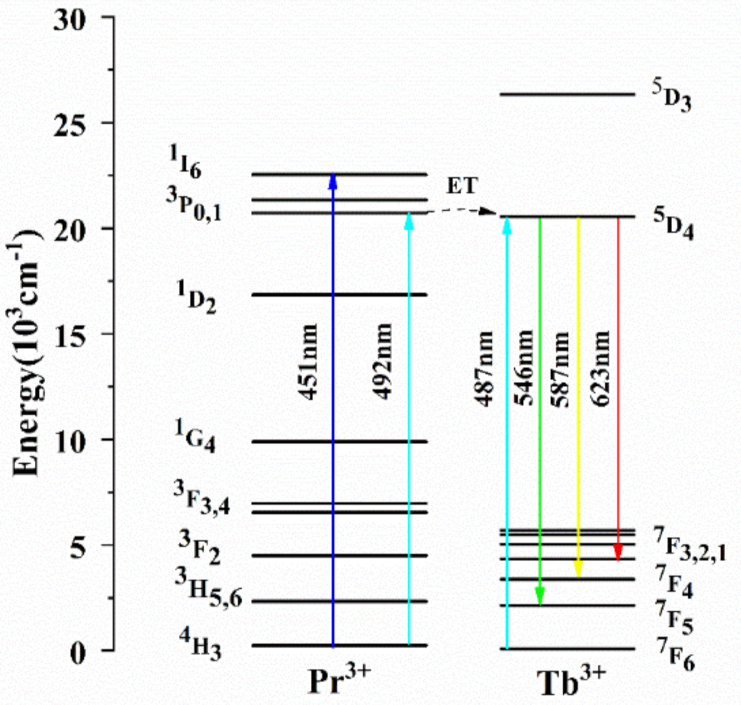
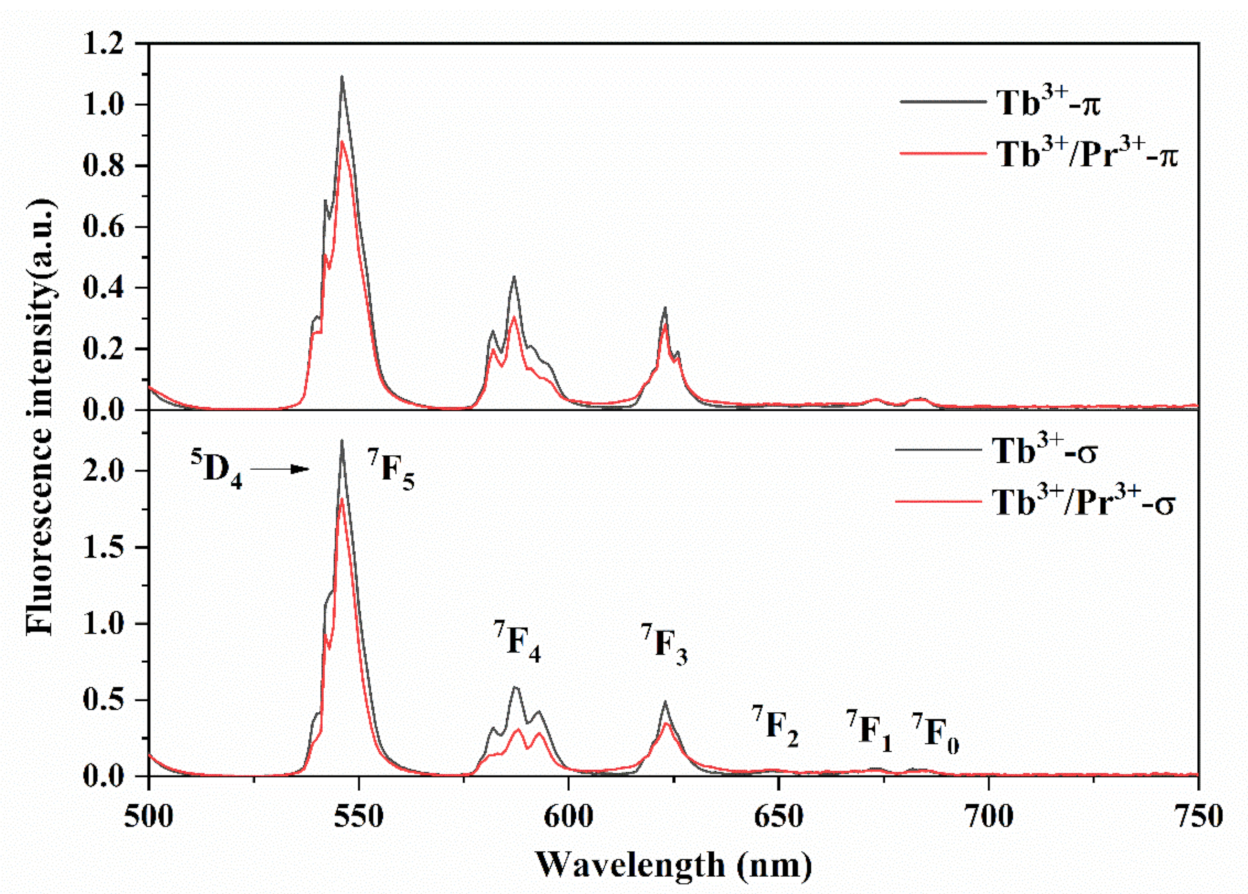
3.4. Fluorescence Spectra
The polarized fluorescence spectra of the Tb
3+:CYA and Tb
3+/Pr
3+:CYA crystals under the excitation of 487 nm and 492 nm, respectively, were recorded in the range of 500–725 nm, as shown in
Figure 5. According to the energy level structure of Tb
3+, the visual-range emission bands located around 546 nm, 587 nm, 623 nm, 648 nm, 673 nm, and 683 nm correspond to the transitions of
5D
4→
7F
J (J = 5, 4, 3, 2, 1, 0), respectively, as indicated in
Figure 5.
As shown in
Figure 5, the emission band shape of Tb
3+/Pr
3+:CYA was highly consistent with that of Tb
3+:CYA, due to the substantial coincidence of the fluorescence emission peaks of Tb
3+(
5D
4→) and Pr
3+(
3P
0→), and the emission of an ultralow concentration of Pr
3+ was compensated for by the high concentration of Tb
3+ [
25]. Meanwhile, the intensities of the Tb
3+/Pr
3+ co-doped sample were weaker than those of the single-doped one. In the Tb
3+/Pr
3+:CYA crystal, the adjacent energy positions of Tb
3+:
5D
4 and Pr
3+:
3P
0, provide possible paths for energy transfer. As a result of the huge concentration difference between Tb
3+ (13.87 at.%) and Pr
3+ (0.38 at.%), the energy transfer process of Tb
3+(
5D
4)→Pr
3+(
3P
0) was more efficient than the backward one, leading to a weaker fluorescence intensity than the single-doped sample.
Based on the following Füchtbauer–Ladenburg (F–L) formula [
18], the stimulated emission cross-sections for the
5D
4→
7F
J (J = 5, 4) translations can be obtained from polarized fluorescence spectra:
where λ, β, c, and I(λ) refer to the fluorescence wavelength, branching ratio, speed of light, and fluorescence intensity, respectively. The peak emission wavelengths, FWHMs, and emission cross-sections
of the transitions starting from the
5D
4 multiplets of the Tb
3+:CYA and Tb
3+/Pr
3+:CYA crystals are listed in
Table 6. According to
Table 6, the FWHMs of the 546 nm emission band in the Tb
3+:CYA and Tb
3+/Pr
3+:CYA crystals (π polarization) were 9.41 nm, 9.31 nm, respectively. The π and σ polarization emission cross-sections at 546 nm in the green light region were 7.57 × 10
−22 cm
2 and 8.82 × 10
−22 cm
2, respectively, for the Tb
3+:CYA crystal—slightly larger than the π and σ polarization emission cross-sections of the Pr
3+/Tb
3+:CYA crystal (6.99 × 10
−22 cm
2 and 8.55 × 10
−22 cm
2, respectively). These results were also greater than those for Tb
3+:CaF
2 (5.56 × 10
−22 cm
2) [
14] and Ba
3TbPO
4 (5.9 × 10
−22 cm
2) [
26]. The emission cross-sections of the
5D
4→
7F
4 transition for Tb
3+:CYA were calculated to be 0.44 × 10
−22 cm
2 (π) and 0.34 × 10
−22 cm
2 (σ), while the results for Tb
3+/Pr
3+:CYA were determined to be 0.35 × 10
−22 cm
2(π) and 0.21 × 10
−22 cm
2 (σ). The maximum emission cross-section of Tb
3+:CYA at 587 nm (0.44 × 10
−22 cm
2) was of the same order of magnitude as that of Tb
3+:STB crystal (0.61 × 10
−22 cm
2 E//Z) [
13].
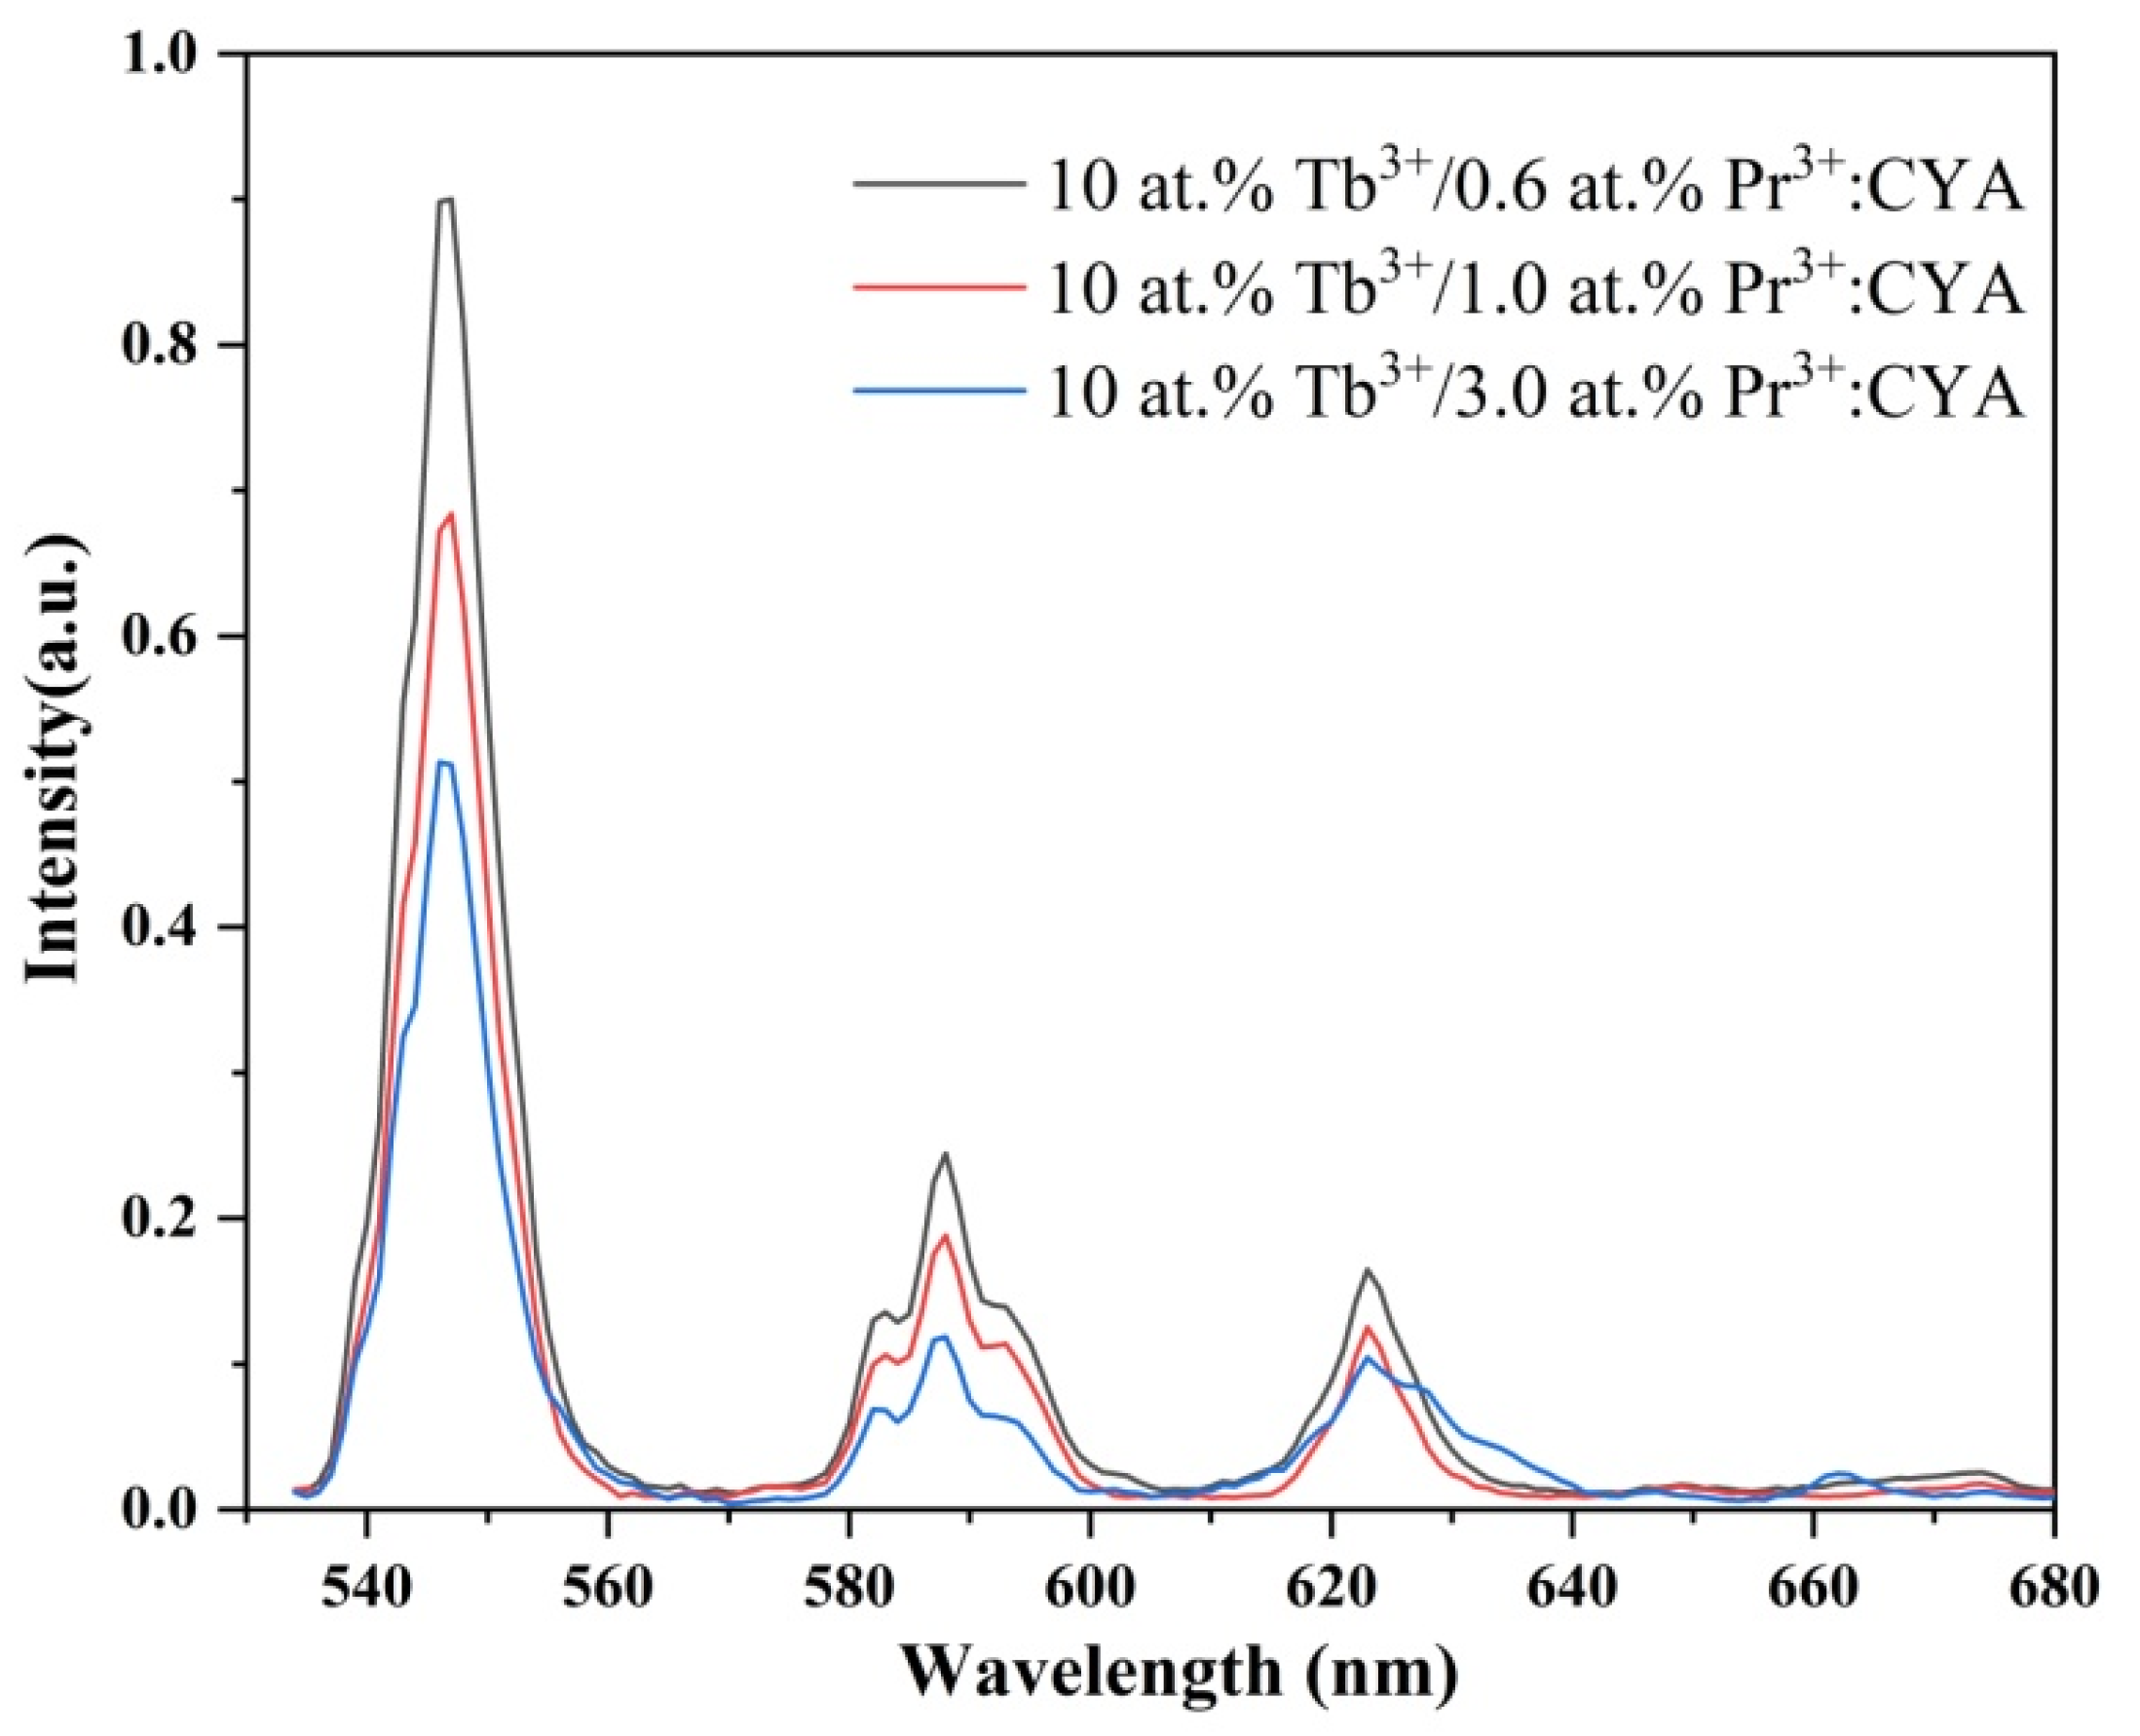
In order to explore effects of the doping concentration ratio of Tb
3+ and Pr
3+ on the energy transfer process between those two ions, we produced 10at.% Tb
3+/0.6at.% Pr
3+, 10at.% Tb
3+/1at.% Pr
3+, and 10at.% Tb
3+/3at.% Pr
3+ co-doped CYA single-crystal fibers through the micro-pulling-down method. The room-temperature fluorescence spectra in the 530–680 nm range were recorded, as shown in
Figure 6. Based on these results, the luminescence intensity of the main bands responsible for Tb
3+ ions decreased with the increase in the Pr
3+ ions. This phenomenon can be explained through the differences in the electron shell structures of Pr
3+ and Tb
3+. Non-radiative processes were the main energy transfer routes between Tb
3+ and Pr
3+. It is therefore assumed that non-radiative energy transfer is carried out with high energy levels from the Tb
3+ to the Pr
3+. For the co-doped samples, Tb
3+ is the dominant luminescence center, as its concentration is as high as 10 at.%. With the increase in the Pr
3+ concentration, the distance between Tb
3+ and Pr
3+ shortened accordingly, and the non-radiative processes between Tb
3+ and Pr
3+ intensified, causing a reduction in the luminescence intensity. Similar experimental results were observed in Tb
3+/Pr
3+ co-doped scintillation glass [
27]. The large distance between Tb
3+ and Pr
3+ might weaken the interaction between them. In the study of Chen et al., energy transfer from Tb
3+→Pr
3+, which involved two processes—Tb
3+:
5D
4 + Pr
3+:
3H
4→Tb
3+:
7F
6 + Pr
3+:
1I
6 and Tb
3+:
5D
4 + Pr
3+:
3H
4→Tb
3+:
7F
4 + Pr
3+:
3P
0—was achieved in 0.3 at.% Tb
3+/0.5 at.% Pr
3+:CYA phosphor [
28]. This result indicates that the dominant energy transfer channel in CYA is Tb
3+→Pr
3+, although the two ions are both at low doping levels.
The energy transfer processes between Tb
3+ and Pr
3+ are inefficient, and the metal-to-metal intervalence charge transfer (IVCT) processes between d0 electron-configured transition metal ions in oxide crystals and Pr
3+/Tb
3+ have been confirmed to be effective pathways to excite the Pr
3+/Tb
3+ [
29]. However, no IVCT process takes place in Tb
3+/Pr
3+:CYA. According to the experimental results of Liu et al., the effective absorption of 5 at.% Tb
3+:CYA was improved by co-doping with 5 at.% Pr
3+. Due to the concentration quenching of Pr
3+, the fluorescence intensity for the main Tb
3+ emission bands did not decrease, but the corresponding fluorescence lifetime reduced greatly [
14]. Thus, in our work, the problem of weak absorption of Tb
3+ around 487 nm was slightly improved by co-doping with Pr
3+. However, due to the inefficient energy transfer between Tb
3+ and Pr
3+ in compounds with no IVCT processes, the emission of Tb
3+ in the visible band was slightly weakened by co-doping with Pr
3+.
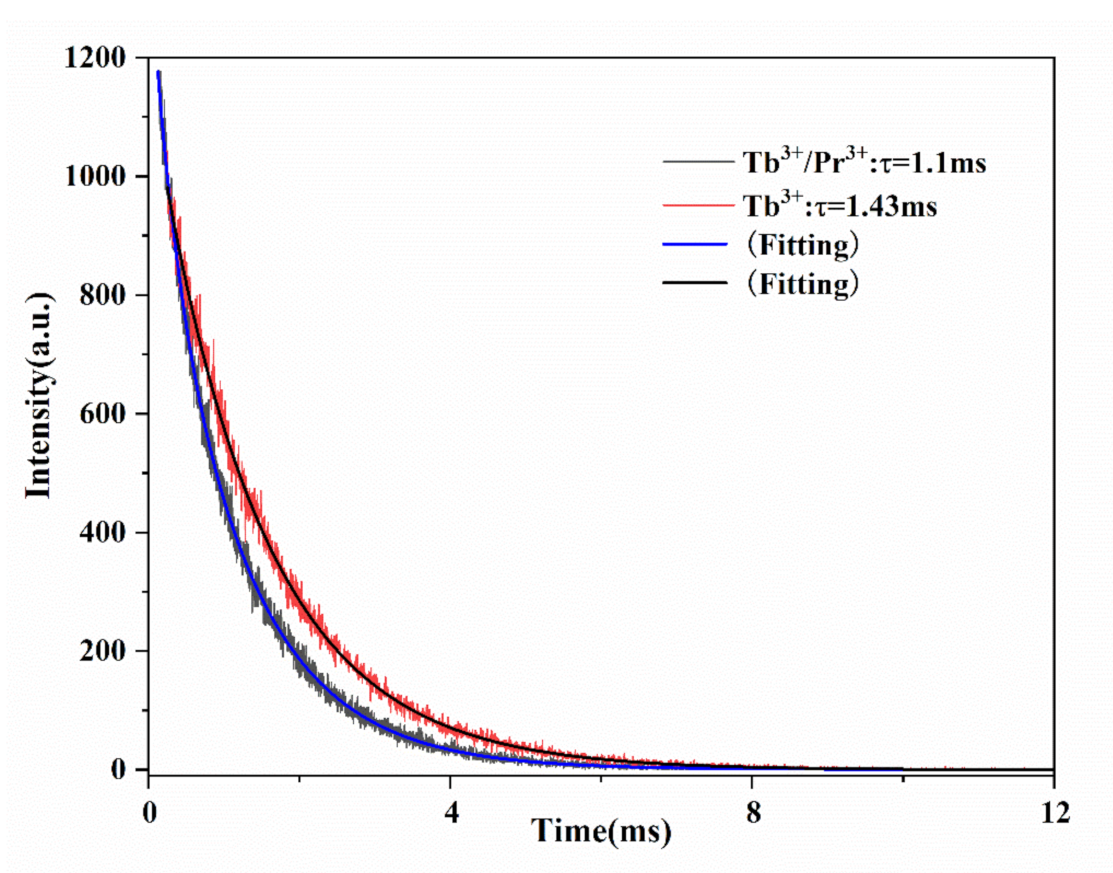
3.5. Fluorescence Lifetime
Figure 7 shows the fluorescence decay curves of the
5D
4→
7F
5 transitions in Tb
3+:CYA and Tb
3+/Pr
3+:CYA crystals excited at 487 nm and 492 nm, respectively. After being fitted, the fluorescence lifetime can be obtained through the following function [
30]:
where
refers to the fluorescence intensity as a function of time. The experimental lifetimes τ
f of the
5D
4→
7F
5 transitions for the Tb
3+:CYA and Tb
3+/Pr
3+:CYA crystals were calculated to be 1.43 ms and 1.1ms, respectively, and the quantum efficiency
(
) was estimated to be 79.2% and 59.14%, respectively. Compared with Tb
3+:CYA, the shorter fluorescence lifetime of
5D
4→
7F
5 in the Tb
3+/Pr
3+:CYA crystal may be attributed to the energy transfer process of Tb
3+(
5D
4)→Pr
3+(
3P
0). The energy transfer efficiency from Tb
3+(
5D
4) to Pr
3+(
3P
0) was calculated to be
η = 1 − (1.1/1.43) = 23.07%. The energy transfer process decreased the population of Tb
3+ in the
5D
4 state, which had a negative effect on the fluorescence and led to the weakening of the fluorescence lifetime of Tb
3+. Unfortunately, the energy transfer efficiency value was slightly too large; hence, the impact on the Tb
3+ fluorescence. Although the emission spectral intensity, emission cross-section, and fluorescence lifetime of Tb
3+ were decreased through co-doping with Pr
3+, the absorption cross-section around 487 nm was increased.
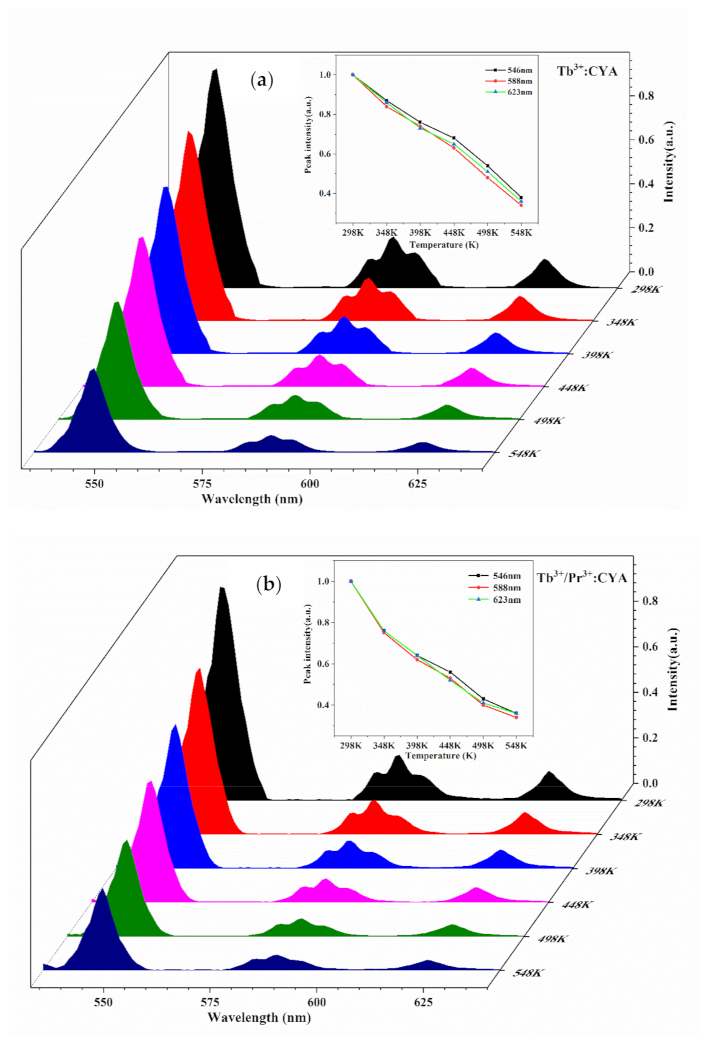
3.6. Effects of Temperature on Fluorescence Emission
Since the laser crystals suffer as a result of high temperatures during long-term operation, the exploration of the thermal stability of the optical properties of the crystals is an important task.
Figure 8 shows the relative peak intensity curves of the Tb
3+:CYA and Tb
3+/Pr
3+:CYA crystals under 487 nm and 492 nm excitation, respectively, with the increase in the temperature from 298 K to 548 K. The relative peak intensity of the two samples decreased almost linearly the increase in temperature. With the increase in the temperature from 298 to 398 K, the intensities of three bright lights at 546 nm (green), 588 nm (yellow), and 623 nm (red) dropped by 24%, 26%, and 27%, respectively, for Tb
3+:CYA and by 36%, 38%, and 36%, respectively, for Tb
3+/Pr
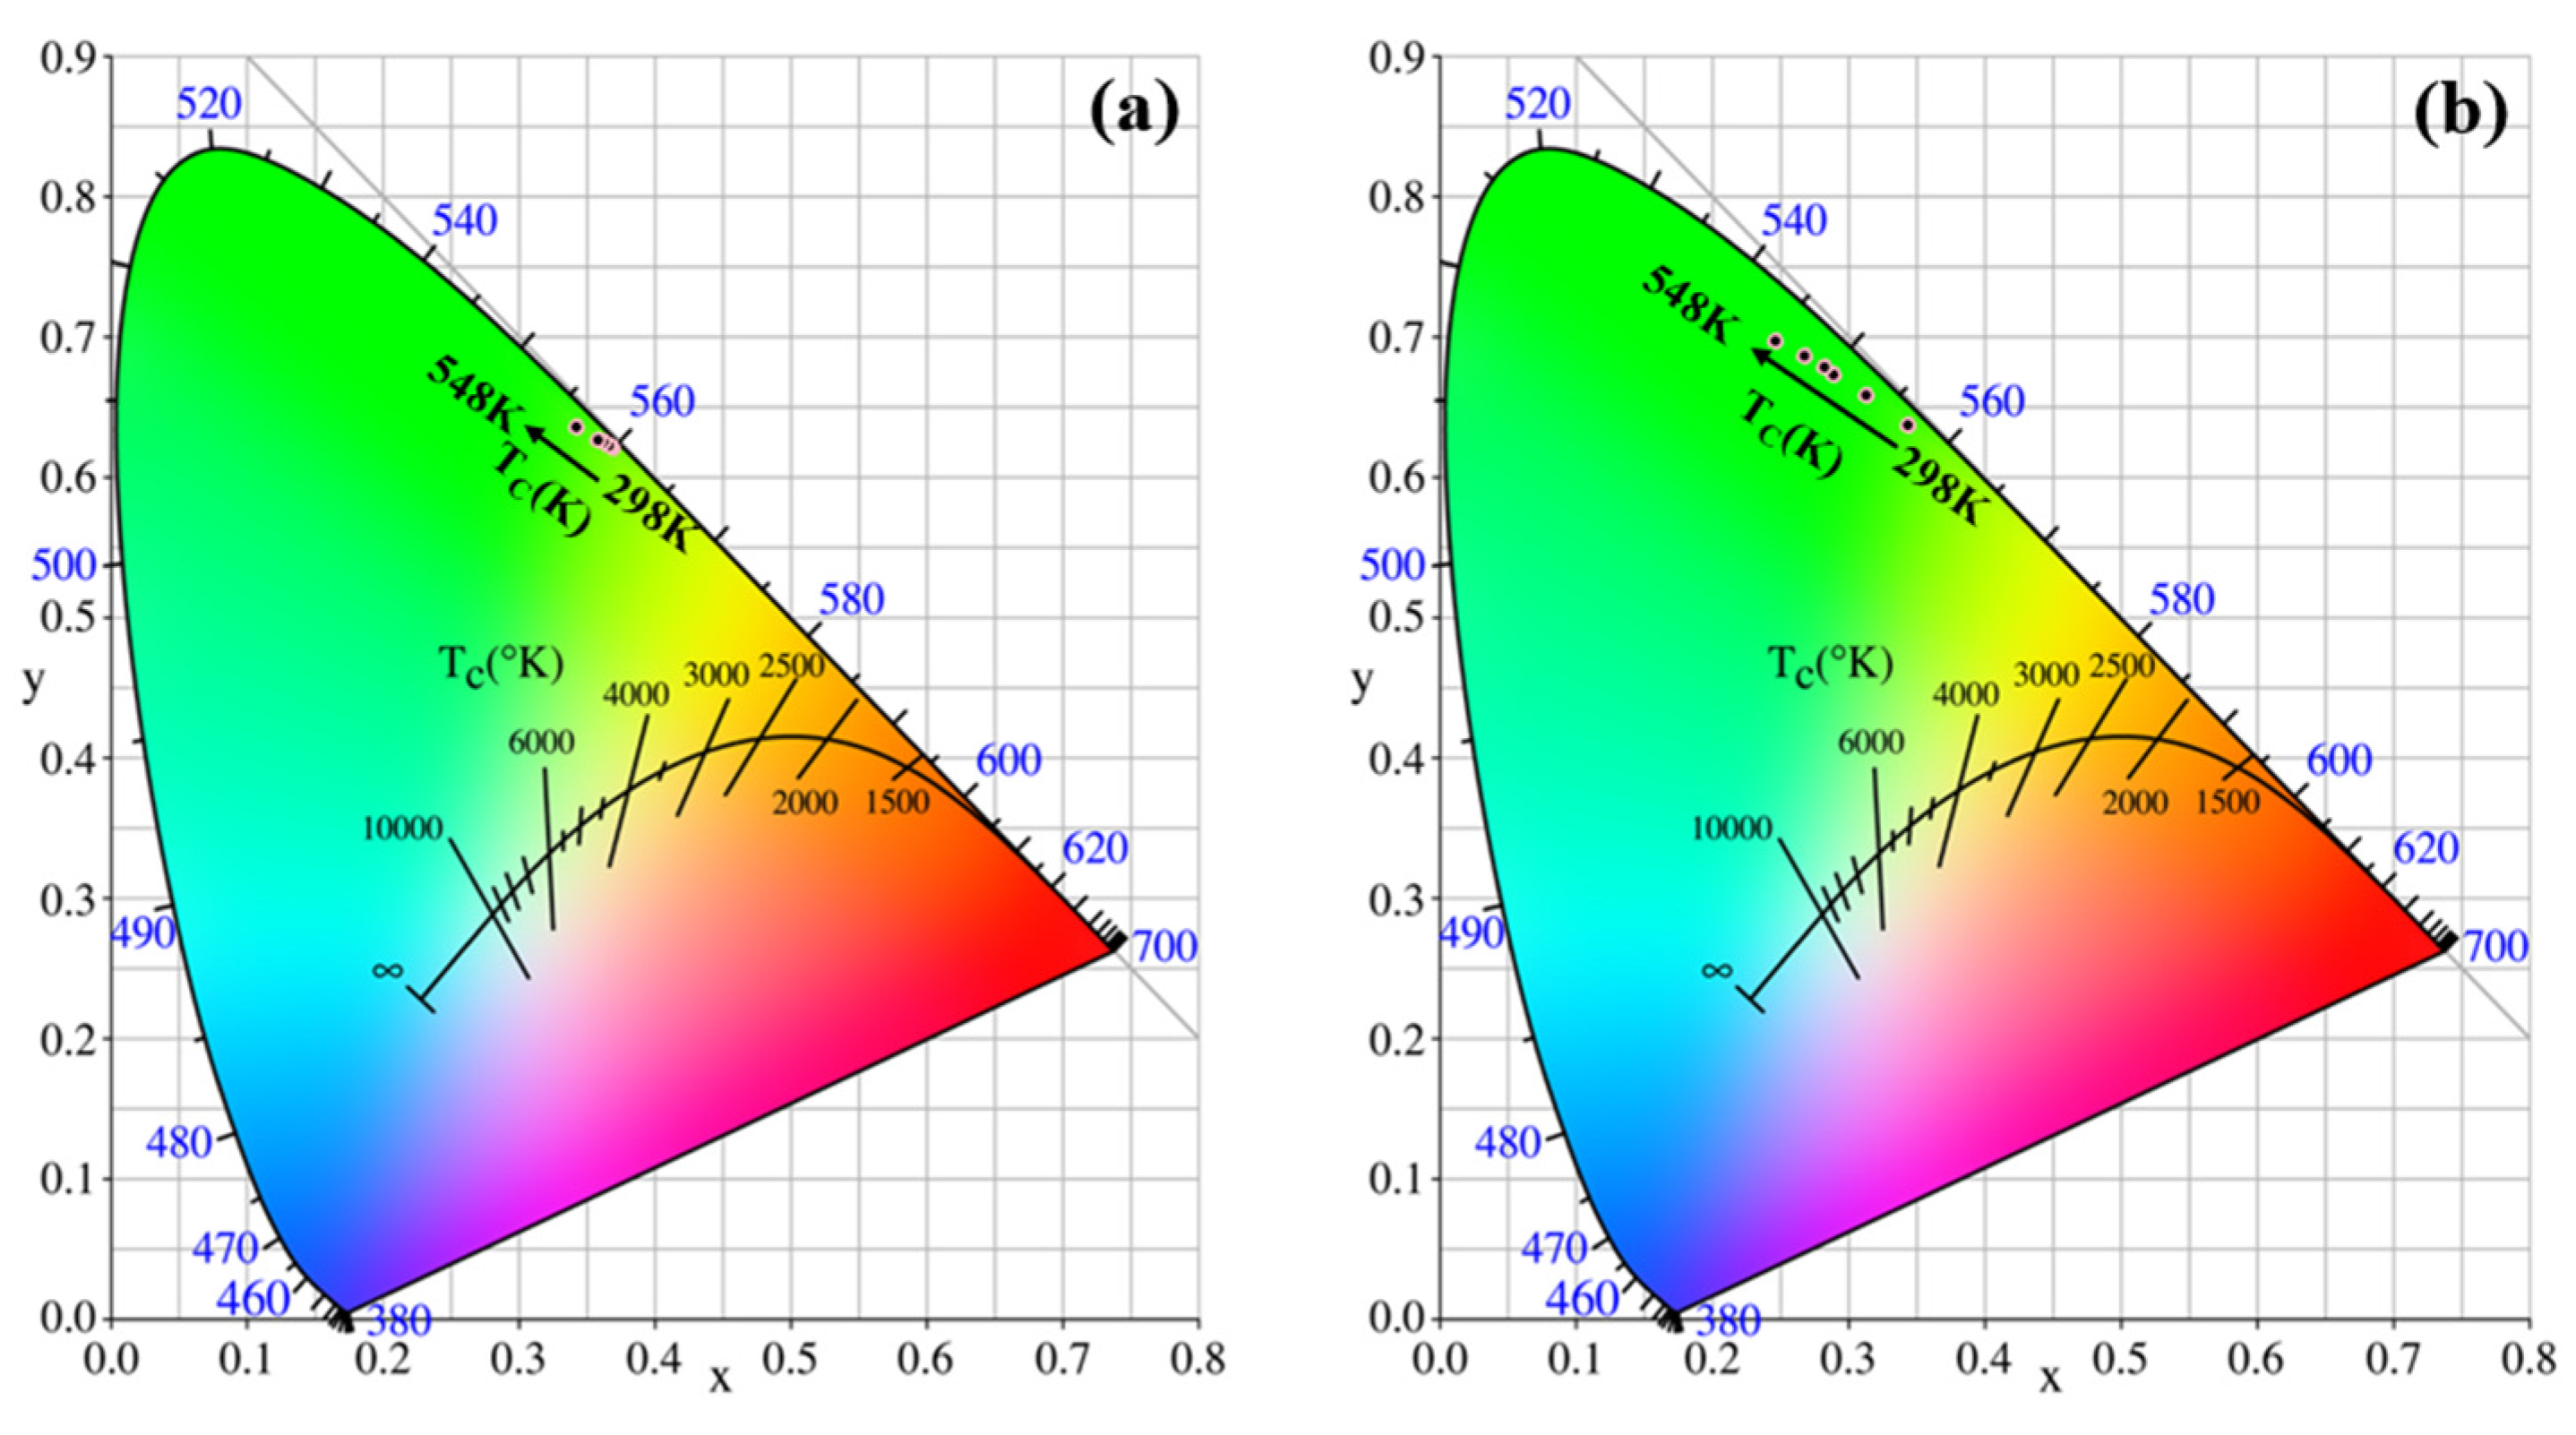
3+:CYA. Additionally, the chromaticity coordinates of the Tb
3+:CYA and Tb
3+/Pr
3+:CYA crystals at various temperatures under 487 nm and 492 nm excitation, respectively, are listed in
Table 7. The correlated color temperatures (CCTs) were calculated using McCamy’s empirical formula [
31]:
With the increase in temperature, the chromaticity coordinates of Tb
3+:CYA varied from (0.370, 0.621) at 298 K to (0.343, 0.636) at 548 K, and the values of Tb
3+/Pr
3+:CYA varied from (0.345, 0.638) at 298 K to (0.246, 0.698) at 548 K; the decrease in the x value and the increase in the y value of the CIE coordinates resulted in all of the coordinates (x,y) invariably being located in the green color region, as shown in
Figure 9. This was nothing like the occurrence in the Tb
3+/Pr
3+:Na
5Gd(WO
4)
4 phosphors, in which the most prominent transition was an 648 nm with (0.541, 0.378) coordinates in the orange–yellow region. This was most likely caused by the IVCT processes between Tb
3+ or Pr
3+ and transition metal ions (i.e., Ti
4+, V
5+, Nb
5+, Mo
6+, or W
6+) with d0 electrons configured in oxide crystals [
32]. The results indicated that the Tb
3+:CYA and Tb
3+/Pr
3+:CYA crystals possessed good thermal stability of their optical properties, as well as potential for green laser applications with a wide temperature range.


 and
and 


