Article

Synthesis and Computational and X-ray Structure of 2, 3, 5-Triphenyl Tetrazolium, 5-Ethyl-5-phenylbarbituric Acid Salt

1
Department of Pharmaceutical Chemistry, College of Pharmacy, King Saud University, P.O. Box 2457, Riyadh 11451, Saudi Arabia
2
Department of Medicinal Chemistry, Faculty of Pharmacy, Mansoura University, Mansoura 35516, Egypt
3
Department of Bioorganic Chemistry, Leibniz Institute of Plant Biochemistry, D-06120 Hall, Germany
*
Author to whom correspondence should be addressed.
Crystals 2022, 12(12), 1706; https://doi.org/10.3390/cryst12121706
Submission received: 10 October 2022 / Revised: 14 November 2022 / Accepted: 19 November 2022 / Published: 24 November 2022
(This article belongs to the Special Issue Computational and Experimental Approaches in Pharmaceutical Crystals)

Abstract

:
The title compound triphenyl tetrazolium (TPT) of phenobarbital, 5-Ethyl-5-phenylbarbituric acid triphenyl tetrazolium salt (4) was prepared by the reaction of 5-Ethyl-5-phenyl-2,4,6(1H, 3H, 5H)-pyrimidinetrione, monosodium salt (1) with triphenyl tetrazolium chloride (3) in deionized water at an ambient temperature through a cation exchange reaction. Colorless crystals of compound four suitable for an X-ray structural analysis were obtained by slow evaporation from acetonitrile. Compound four had crystallized in the monoclinic space group, P21/c, with a = 15.3678 (9) Å, b = 12.2710 (7) Å, c = 21.8514 (13) Å, β = 109.867 (2)°, V = 3875.5 (4) Å3, and Z = 4. A Through density functional theory (DFT) calculations, the probable molecular association structure in the phenobarbitone -triphenyl tetrazolium solution was studied. With the 6-311G-(d,p) basis set, the gas phase features of the phenobarbital-triphenyl tetrazolium clusters with a phenobarbitone dimer and water molecules, including an optimum structure and intermolecular hydrogen bonding, were investigated in detail. In addition, the positions and strengths of the intermolecular hydrogen bond interactions between the phenobarbitone and triphenyl tetrazolium molecules were analyzed using atoms in molecule (AIM) analysis, reduced density gradient (RDG) methods, the XRD method, and the non-covalent interaction (NCI) index method. In addition, the molecular electrostatic potential (MEP) surfaces were analyzed to determine the electrophilic and nucleophilic centers.

1. Introduction

Phenobarbital sodium (5-Ethyl-5-phenylbarbituric acid), or sodium salt, has the chemical structure C12H11N2NaO3, and its relative molecular mass 254.22. Sodium phenobarbital is available as 30, 60, 65, and 130 mg/mL injections and as a sterile powder in 120 mg ampules [1]. Phenobarbital, also known as phenobarbitone, is a medication recommended by the world Health Organization in developing countries for the treatment of certain types of epilepsy [2]. Phenobarbital is widely used in the treatment of partial and generalized tonic-colonic seizures in all age groups [3] and is considered a first-line drug for treating seizures and status epilepticus in newborns.
On the other hand, 2, 3, 5-triphenyltetrazolium chloride is a heterocyclic compound with a five-member ring which contains four nitrogen atoms; one of these atoms bears a positive charge. The use of 2,3,5-tetraphenyl tetrazolium salt for the extraction and spectrophotometric and potentiometric determination of various elements and ions has been reported [4]. Recently, triphenyl tetrazolium salt was used as an ion-pair reagent for PVC membrane sensors for many target analytes [5,6,7].
In this study, we hope to report herein the synthesis and X-ray structure of the tetraphenyl tetrazolium salt of phenobarbital.
Noncovalent interactions dominate the chemical interactions between a protein and a drug and a catalyst and its substrate, as well as within the self-assembly of nanomaterials [8,9] and even some chemical processes [10,11,12]. This class of interactions includes hydrogen bonding, dipole-dipole interactions, steric repulsion, and London dispersion throughout a broad range of binding energies [13]. The molecular structure is determined by covalent, noncovalent, and electrostatic interactions, the latter two of which drive a majority of biological reactions. Covalent bonds are easily identifiable in a three-dimensional molecule structure, while noncovalent interactions are obscured by the absence of bonds. Although there are numerous methods for viewing and analyzing covalent and electrostatic interactions, there is no corresponding approach for noncovalent interactions. This technique would be useful in many fields, including the study of self-assembled materials and the development of new medicines [14].
In this study, we provide a method for mapping and analyzing noncovalent interactions that requires only information on molecular geometry, complementing existing approaches for covalent and electrostatic interactions. On the basis of the aforementioned factors, one of the objectives of this work is to provide a fundamental understanding of the main interaction between phenobarbitone and triphenyl tetrazolium that may be used to predict the reactivity of and provide an understanding for this interaction. The optimal structures of phenobarbitone and triphenyl tetrazolium were determined using DFT calculations. Hydrogen bonding and intermolecular interactions were analyzed using the atoms in molecules (AIM), reduced density gradient (RDG), and non-covalent interaction (NCI) techniques.

2. Experimental

2.1. Chemistry

2.1.1. General

The melting point (uncorrected.) was determined using a Gallenkamp melting point apparatus. X-ray crystallography was measured on a Bruker APEX-II D8 venture diffractometer equipped with graphite monochromatic Mo Kα radiation, with λ = 0.71073 Å at 100 (2) K. The IR spectra were recorded with a Perkin-Elmer FTIR spectrometer. Bruker 500 and 700 MHz and 125 and 176 MHz instruments were used to record 1H NMR and 13 C NMR in DMSOd6, respectively, using TMS as an internal standard (with chemical shifts in δ ppm). The mass spectrum was measured on an Agilent Triple Quadrupole 6410 QQQ LC/MS equipped with an ESI (electrospray ionization) source.

2.1.2. 5-Ethyl-5-phenylbarbituric acid Triphenyl Tetrazolium Salt (4)

A solution of triphenyl tetrazolium chloride (3) (0.3348 g, 1 mmol) in deionized water (10 mL) was added to a solution of 5-Ethyl-5-phenylbarbituric acid sodium (phenobarbital sodium) (1) (0.2543g, 1mmol) in deionized water (10 mL). A gray precipitate was formed and filtered off and then washed with cold deionized water. The precipitate was dried under a vacuum to provide the title ion-pairs complex. Recrystallization from acetonitrile resulted in the title compound in a 74% yield (m.p 158 °C). IR (KBr, cm−1) ν: 3616, 3346.8 (NH), 3030 (O-H stretching), 1737 (C=O stretching), and 1484 (ArH) (Figure S1); 1H NMR (700 MHz, DMSO-d6) 7.20–8.27 (ArH-20 H), 2.16 (q, J = 7.2 Hz, 4H), and 0.72 (t, J = 7.1 Hz, 6H) (Figure S2); 13C NMR (176 MHz, DMSO- d6) δ 177.71, 164.96, 158.20, 141.06, 134.68, 134.02, 133.24, 130.85, 130.48, 128.91, 127.88, 127.72, 126.64, 126.48, 123.22, 59.34, 28.70, and 10.17 (Figure S3); for molecular formular of C43H40N8O7. ESI-MS: (m/z) 299.2 for [M+], and by a negative scan at (m/z) 230.9 for [M]- (Figure S4).

2.2. X-ray Crystallography

General

Single crystals of compound four were obtained by slow evaporation from acetonitrile. A suitable crystal was selected for X-ray diffraction analysis. The data were collected by a Bruker APEX-II D8 Venture diffractometer equipped with graphite monochromatic Mo Kα radiation, with λ = 0.71073 Å at 100 (2) K. Cell refinement and data reduction were completed by a Bruker SAINT, and the program used to solve the structure and refine the structure was SHELXS-97 [15]. The final refinement of the collected data was performed by full- matrix least-squares techniques with anisotropic thermal data for the non-hydrogen atoms on F2. All the hydrogen atoms were placed in calculated positions and constrained to ride on their parent atoms. Absorption correction by a multi-scan method was performed using SADABS software. The crystal data and refinement data are shown in Table 1.

2.3. Computational Study

The Gaussian 09W [16] software package was used to complete all quantum-chemical computations. To optimize the geometry of the ion pairs and calculate their energies, the B3LYP functional [17,18] method with the GD3 version of Grimme’s dispersion correction [19] was used in conjunction with the 6-311G-(d,p) [20] basis set. The geometries of the phenobarbitone, triphenyl tetrazolium, and phenobarbitone dimer, and those of the water and triphenyl tetrazolium complexes, were employed as starting points for constructing the basic structures of the complex of the formations ion pairs. Numerous configurations of the ion pairs were produced as a result of these interactions. One of the generated geometries was consistent with and was employed in the same-level vibrational frequency computations to describe all stationary locations as minima (no imaginary frequencies) and to evaluate their thermodynamic properties [21].
The proton affinities (PA) of the triphenyl tetrazolium and acid conjugated bases were calculated as the differences between the enthalpy values of the cations and acids and their corresponding phenobarbitone and anions, though with the sign reversed. The differences between the free energy of the ion pair and the sum of the free energies of the triphenyl tetrazolium, phenobarbitone, phenobarbitone ion and water molecules were used to compute the change in the Gibbs free energy G298 associated with ion pair formation (at the standard condition). The interaction energy Eint between the ions in the ion pair was calculated using the super molecule approach [19,22], that is, it was calculated as the difference in energy between the ion pair and the ions that comprised it. The Boys and Bernardi counterpoise methods [23] were used to the optimized structures of the ion pairs in order to determine the basis set superposition error (BSSE). When the BSSE was considered, the resultant interaction energy was slightly lower (by no more than 2%), but the relative order of the energies in the analyzed compounds’ series remained the same.
To find the hydrogen bonding interaction between the ion pairs, the following criteria were used: (i) the geometric properties of the H···O fragment [24], (ii) the predicted energy of hydrogen bonds using Espinosa’s equation [25,26], (iii) the topological parameters of the bond critical point at the H···O contacts [27,28], and (iv) the quantity of charges transferred from the electron donor to the electron acceptor [29]. Bader’s quantum theory of atoms in molecules (QTAIM) technique was used to analyze the topological electron density [30,31]. This approach has also been applied in number of studies aimed at elucidating noncovalent interactions in task-specific ILs [21,32]. Within the QTAIM framework, the interactions between atoms are intimately related to the topological properties of the electron density ρ(r), specifically, the set and types of critical points at which its gradient is zero. The bond critical point BCP (3, −1) and the bond path going through it are of particular importance in our research since they are required for the chemical bond or, in the general case, for the stabilization of the interatomic interaction between the two bonded atoms. As a result, the higher the ρ(r) value at the BCP, the greater the concentration of electronic charge in the surface at this point and the stronger the considered contact. In comparison to covalent bonding (where ρ(r) is ~10−1 au), the value of ρ(r) for hydrogen bonding [27] and the van der Waals interactions are fairly tiny, with 102 au for hydrogen bonding [27] and 10−3 au for the van der Waals interactions [33]. The (r) value of the interacting atoms at their BCP and the value of their Laplacian ∇2ρ(r), the total energy density H(r) [27], and the ratio of the absolute potential energy density to the kinetic energy density |V(r)|/G(r) [28] are the most frequently utilized parameters used to describe the nature and strength of bonding interactions.
The following topological characteristics are used to characterize the three types of bonding interactions: (i) 2∇2ρ(r) < 0, H(r) < 0, and |V(r)|/G(r) > 2 for shared interactions (covalent bonding); (ii) 2(r) > 0, H(r) > 0, and |V(r)|/G(r) < 1 for closed-shell interactions (van der Waals interactions and weak electrostatic H bonds); and (iii) 2∇2ρ(r) > 0, H(r) < 0, and 1 |V(r)|/G(r) < 2 for intermediate interactions (H bonding of partially covalent nature). Koch and Popelier [34,35] provided two quantitative criteria for hydrogen bonding interactions inside the QTAIM: the ρ(r) and 2∇2ρ(r) at the BCP, which are in the range of 0.002−0.035 au and 0.024−0.139 au, respectively. Ion pair optimized geometries were used to calculate all the wave functions in a single point method. The QTAIM computations were performed using AIMAll software (version 10.05.0483) [36].
GaussView 06 [37] was used to show the molecular structure and molecular electrostatic potential (MEP) surface. Mulliken atomic charge and local reactivity descriptors were derived using Mulliken population analysis by computing the single point energies of the N, (N − 1), and (N + 1) species of the molecule using the 6-311G (d, p) basis set. All DFT calculations were performed at the 5-AU molecule’s ground state energy level, with no constraints on the potential energy surface.

3. Results and Discussion

3.1. Chemistry

The reaction of 5-Ethyl-5-phenylbarbituric acid, or sodium salt (phenobarbital sodium) (1), and 5-Ethyl-5-phenylbarbituric acid (2) in water, in both ionized (1) and non-ionized forms (2), were formed in water at neutal conditions, where the pka of the phenobarbital sodium equalled 7.45 [38], with triphenyltetrazolium chloride (3) in deionized water at an ambient temperature, which afforded the title compound, triphenyltetrazolium salt of phenobarbital, 5-Ethyl-5-phenylbarbituric acid triphenyltetrazolium (4), at a 71% yield through a cation exchange reaction (Scheme 1).

3.2. X-ray Crystallography

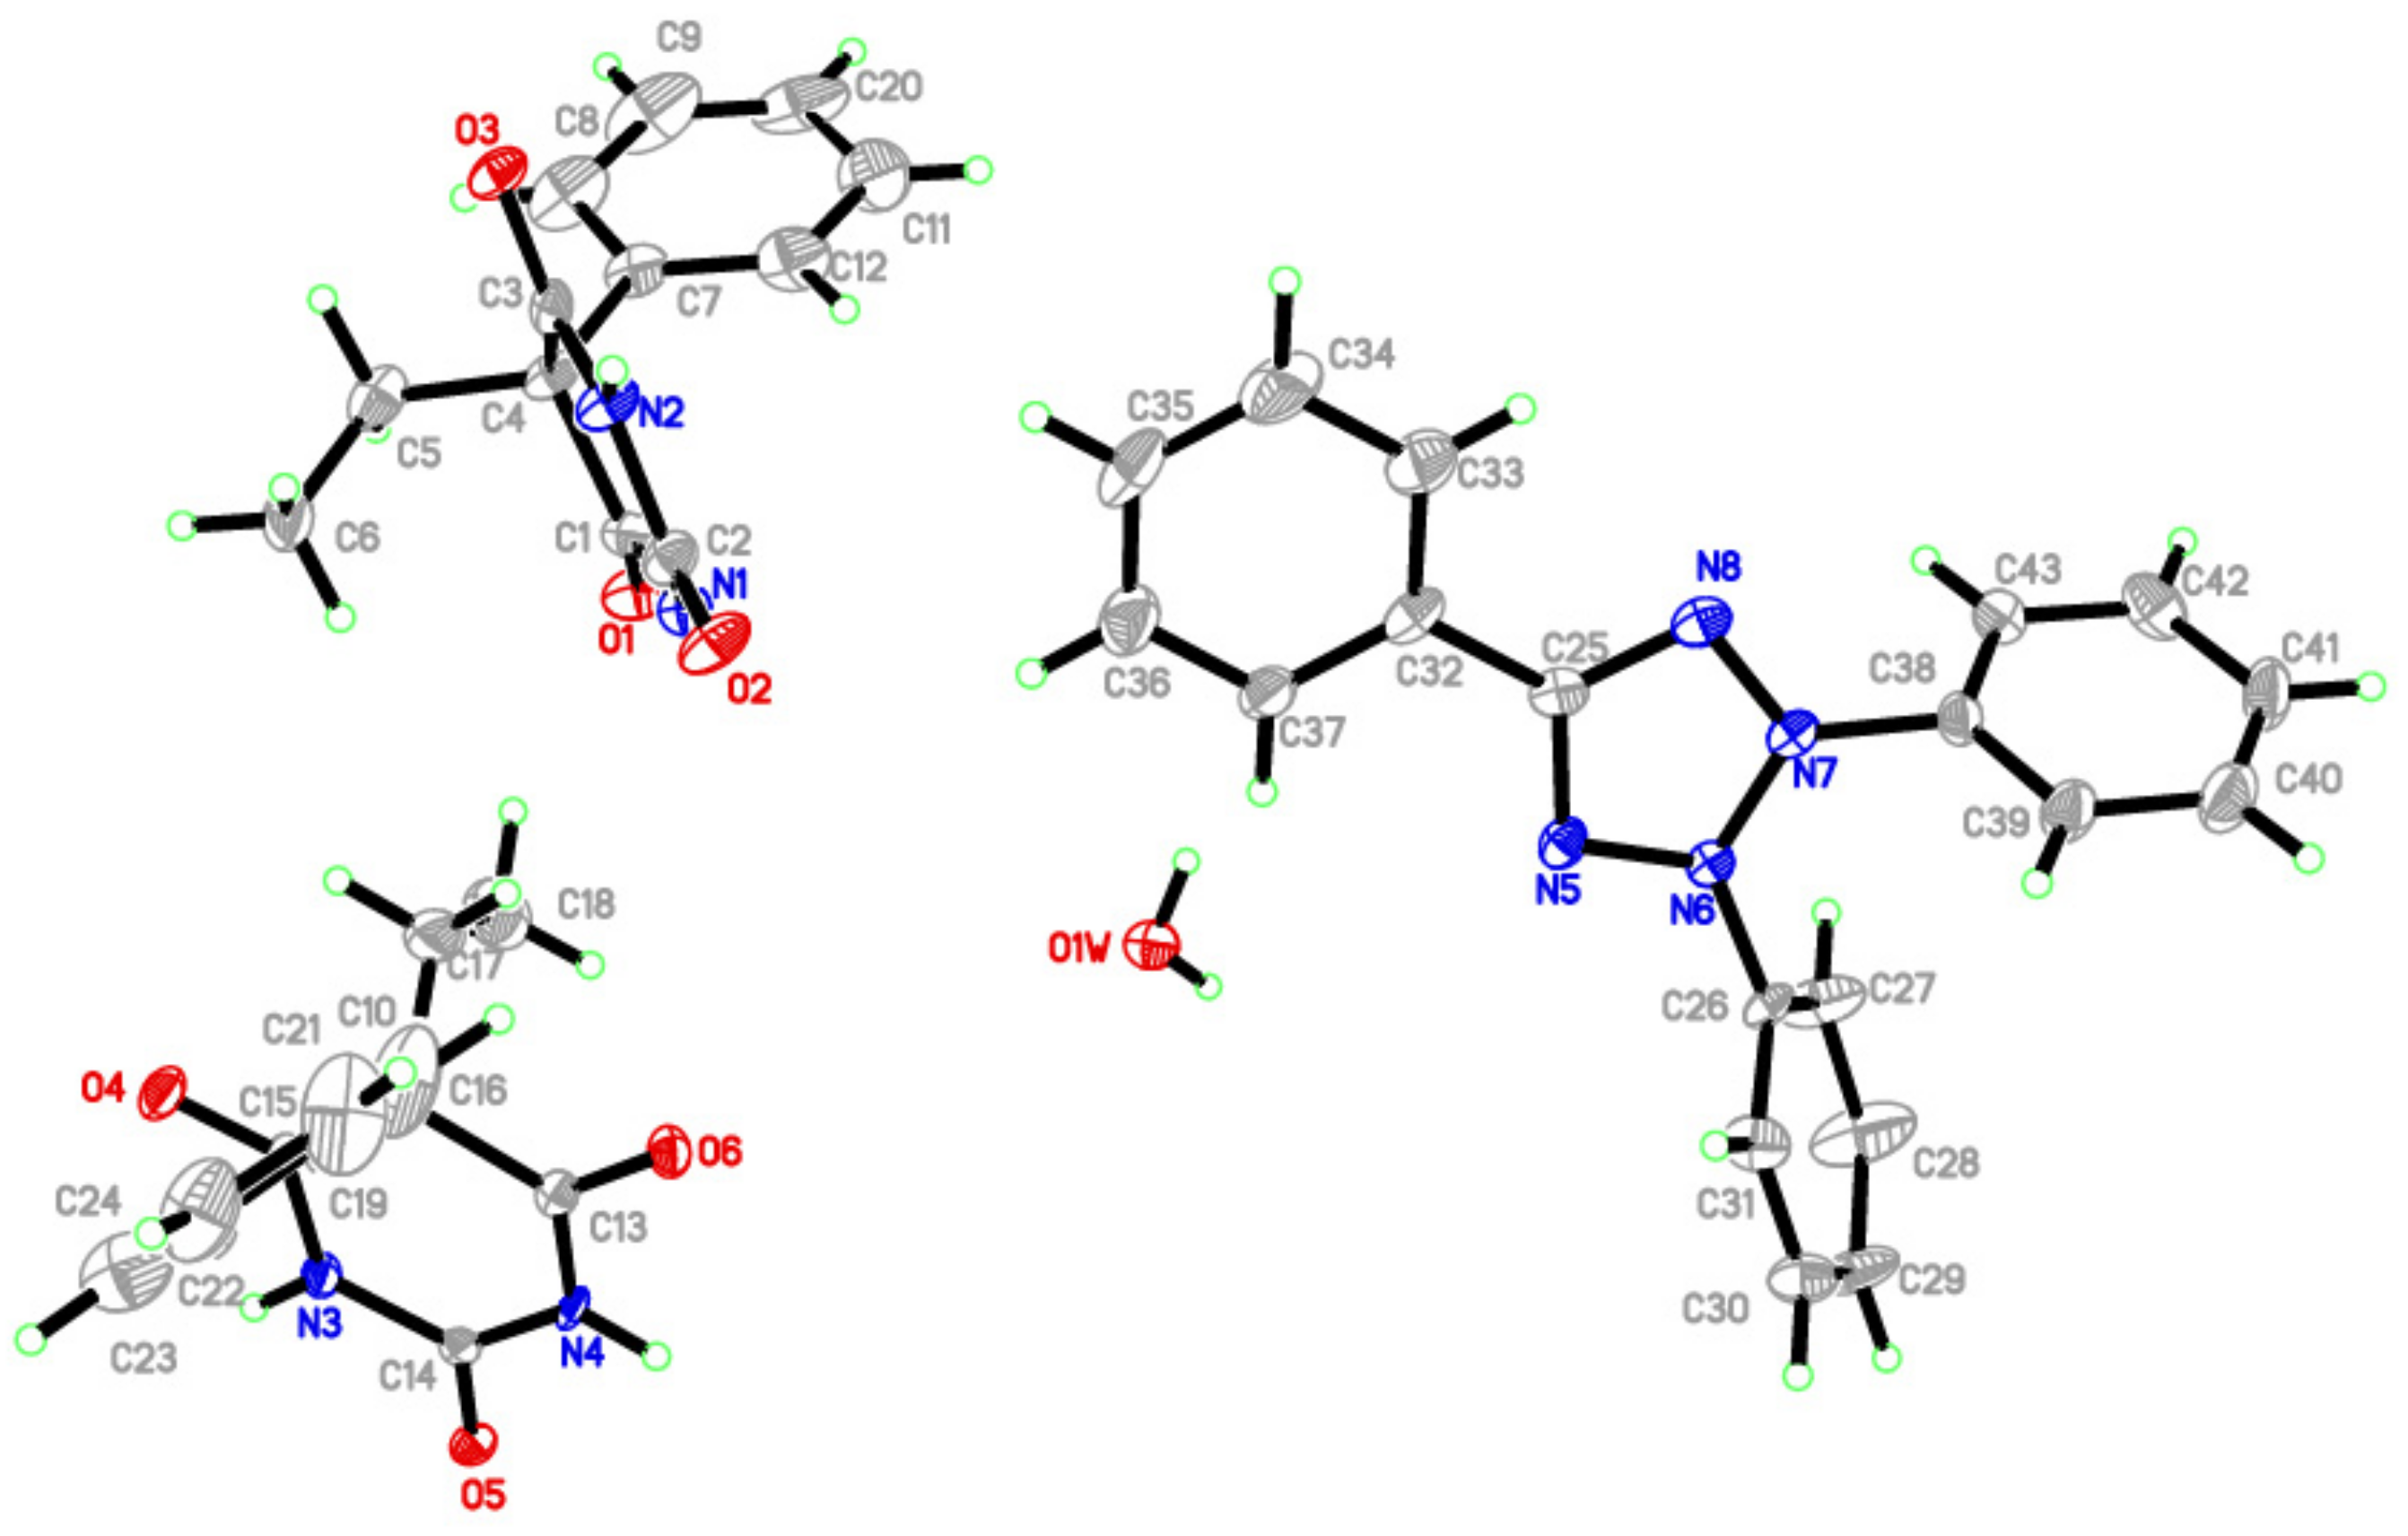
The title compound (5-Ethyl-5-phenylbarbituric acid triphenyl tetrazolium salt (4)) was crystallized as the salt of one anion-cation in the presence of one neutral phenobarbital molecule and one water solvent molecule in an asymmetric unit (Figure 1). Comparison with other crystal structures of 2,3,5-triphenyltetrazolium salts revealed that the internal dimensions of the [TPT]+ cation are largely insensitive to the local environment [39]. The five atoms in the tetrazolium ring (N5-N6-N7-N8-C25) were coplanar, and N5-N6 and N7–N8 were almost equivalent (1.314 and 1.317 Å) (Table 2). The N6–N7 bond (1.328 Å) was longer than the former two bonds. This may be ascribed to the repulsion between the relevant phenyl groups. The torsion angles of the phenyl rings were 116.63, 117.72, and 171.35°. In the phenobarbital molecules, the C–N and C=O bond lengths in the two barbituric rings did not vary significantly between the structures (Table 2).
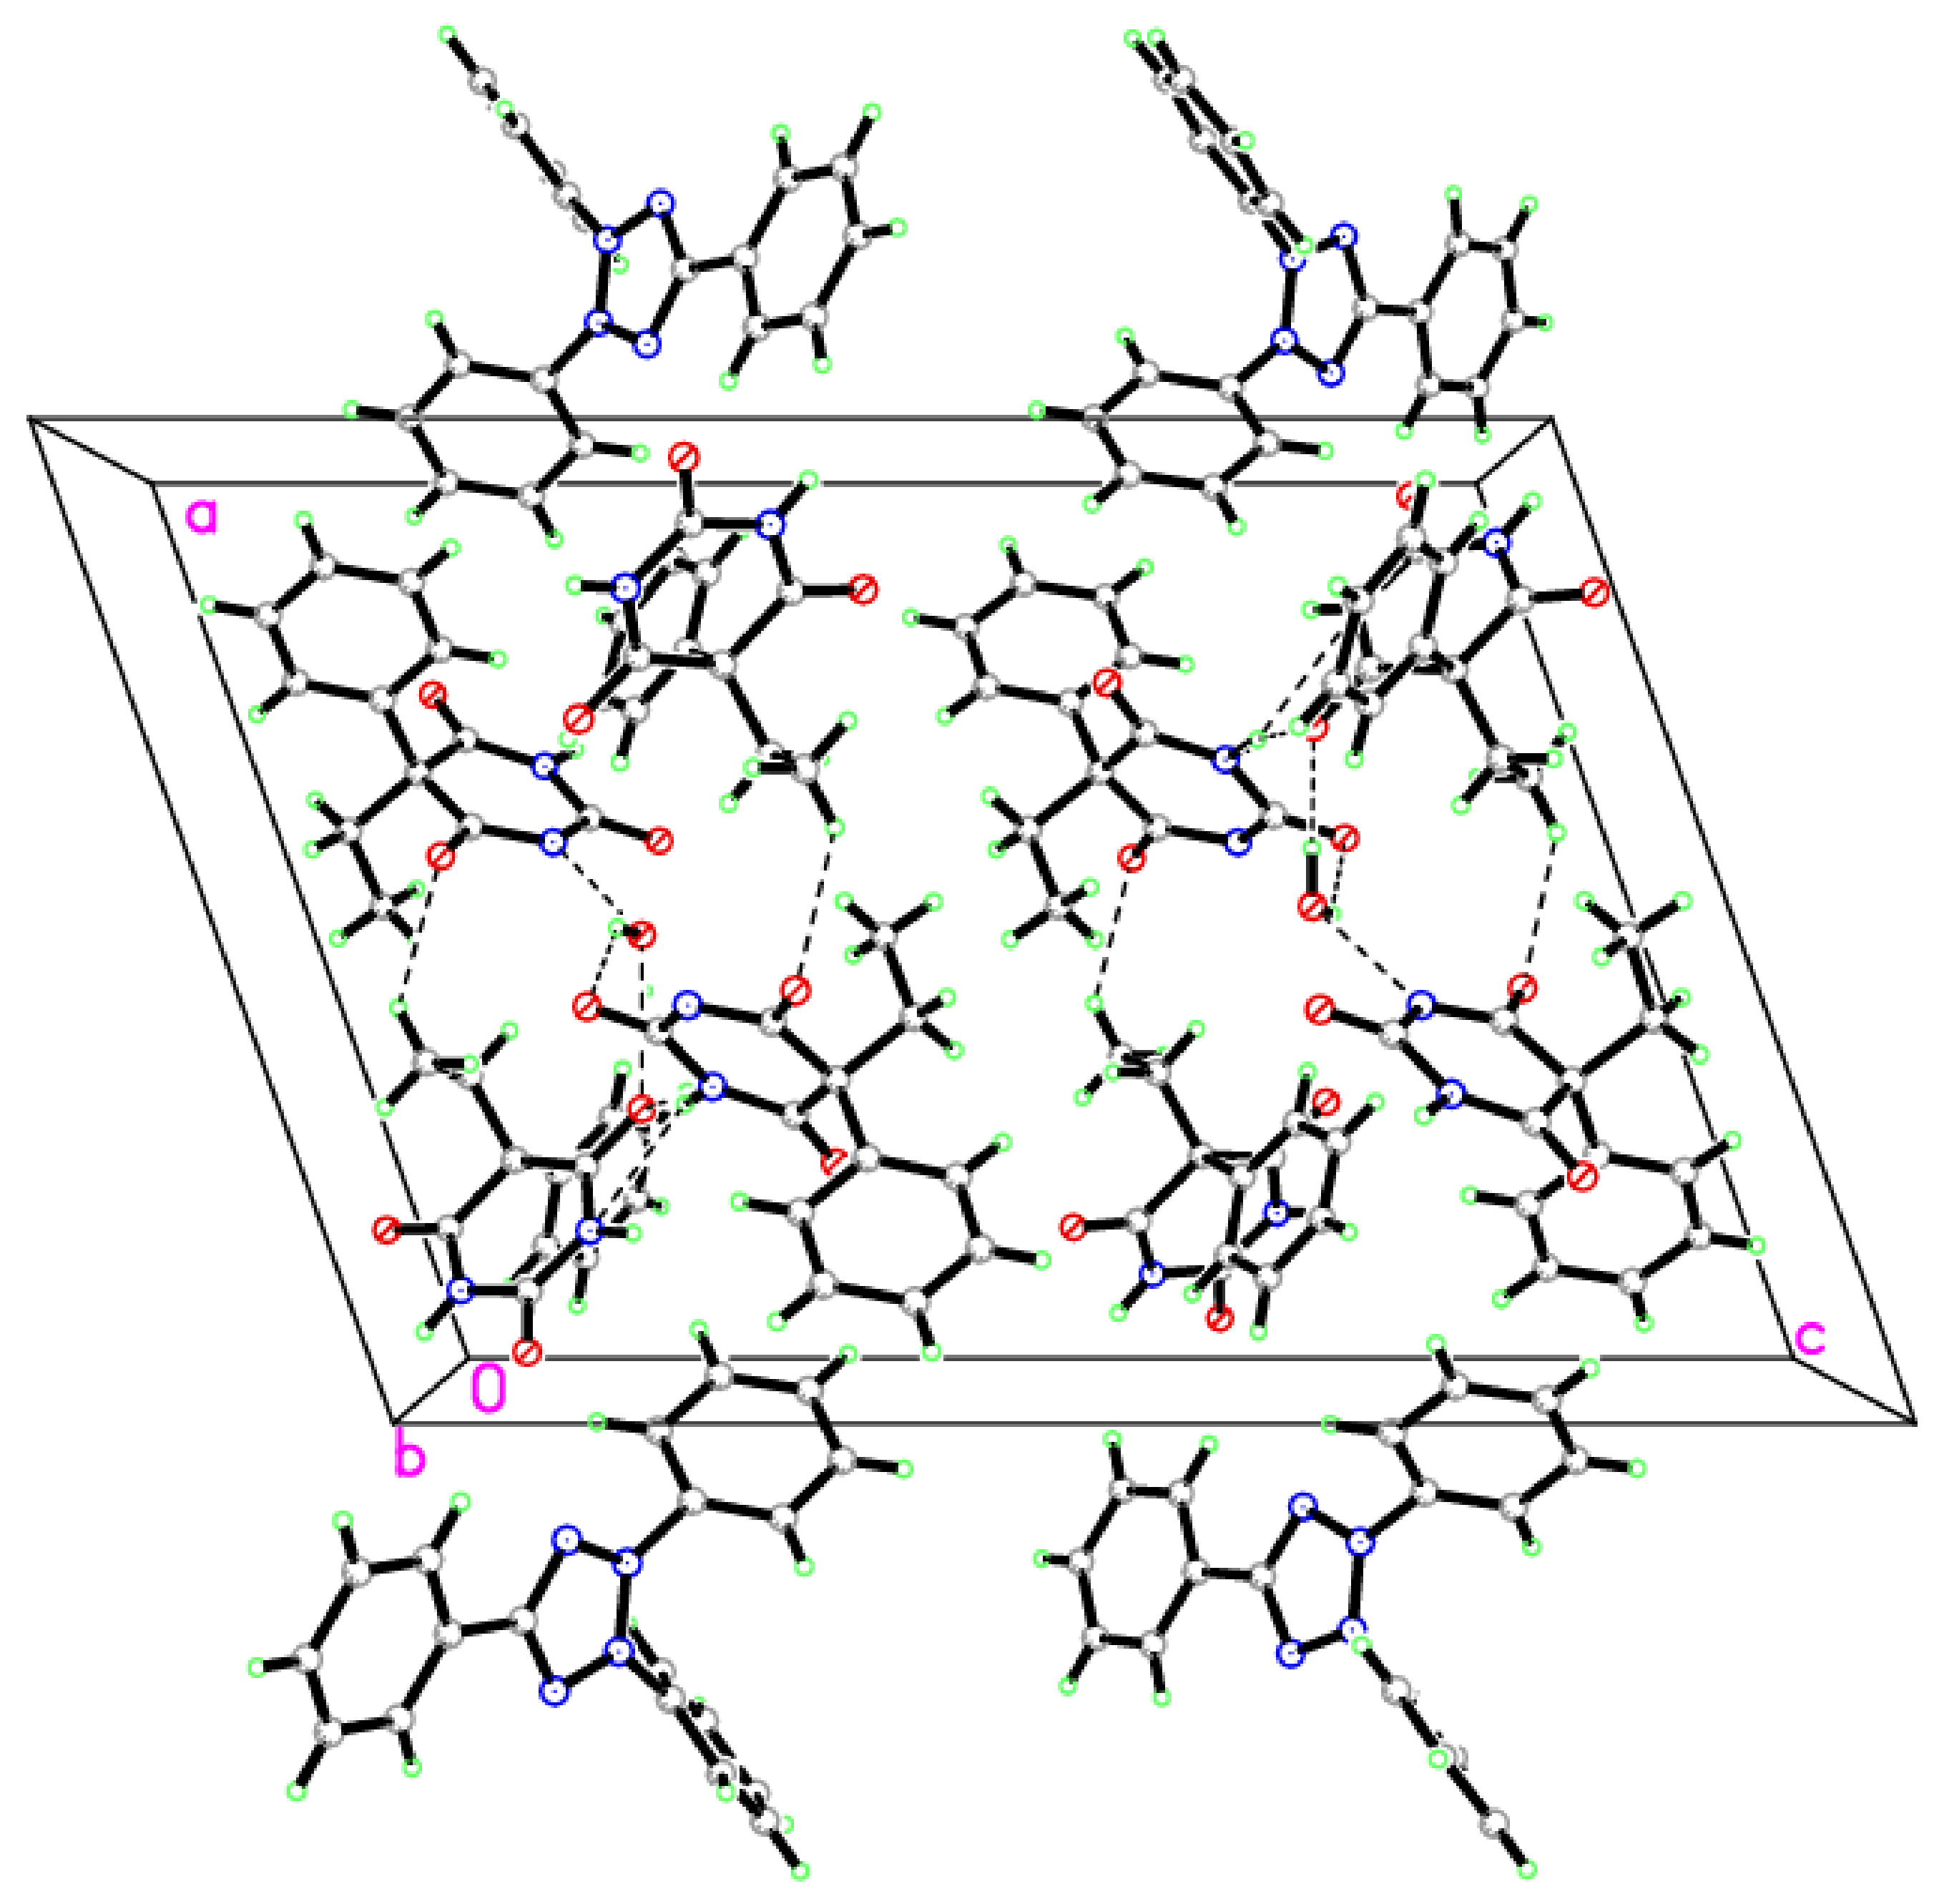
This crystal structure had two types of hydrogen bonds that stabilized the structure: the first type involved ten intermolecular H bonds (between separate molecules), and the second type involved one intramolecular H bond (between parts of the same molecule). These hydrogen bonds were detected in a three-dimensional framework structure, forming a chain extending along the a-axis (Table 3) (the Cambridge Crystallographic Data Center (CCDC) CCDC:1436012).
The cation TPT and the anion PBT were linked by two hydrogen bonds (Figure 2), where the carbonyl groups in the anion PBT interacted as donor groups with the hydrogen atoms C27 and C34 of the cation as acceptors. While the cation (TPT) and the neutral PBT were connected by two hydrogen bonds, the carbonyl group of the neutral PBT interacted as a donor, with the hydrogen atoms of C28 and C29 as acceptors, forming three hydrogen bonds. On the other hand, the anion PBT and the neutral PBT interacted through four hydrogen bonds. The first two hydrogen bonds existed between the carbonyl groups (O5 and O6) in the anion PBT as donors, with the hydrogen atoms (N2 and C20) in the neutral PBT as acceptors. The other hydrogen bonds were between the carbonyl groups (O1) and the amine (N4) in the neutral PBT, with the hydrogen atoms (N2 and C18) in the anion PBT as acceptors.
In the anion PBT molecule, a hydrogen bond was formed by the intramolecular interaction between N4 and O6. In addition, the water molecules interacted with the anion in O6 and N4 as acceptors. Finally, the bond in the anion molecule was an intermolecular bond between H3 and O5.

3.3. Computational Study

3.3.1. Molecular Geometry

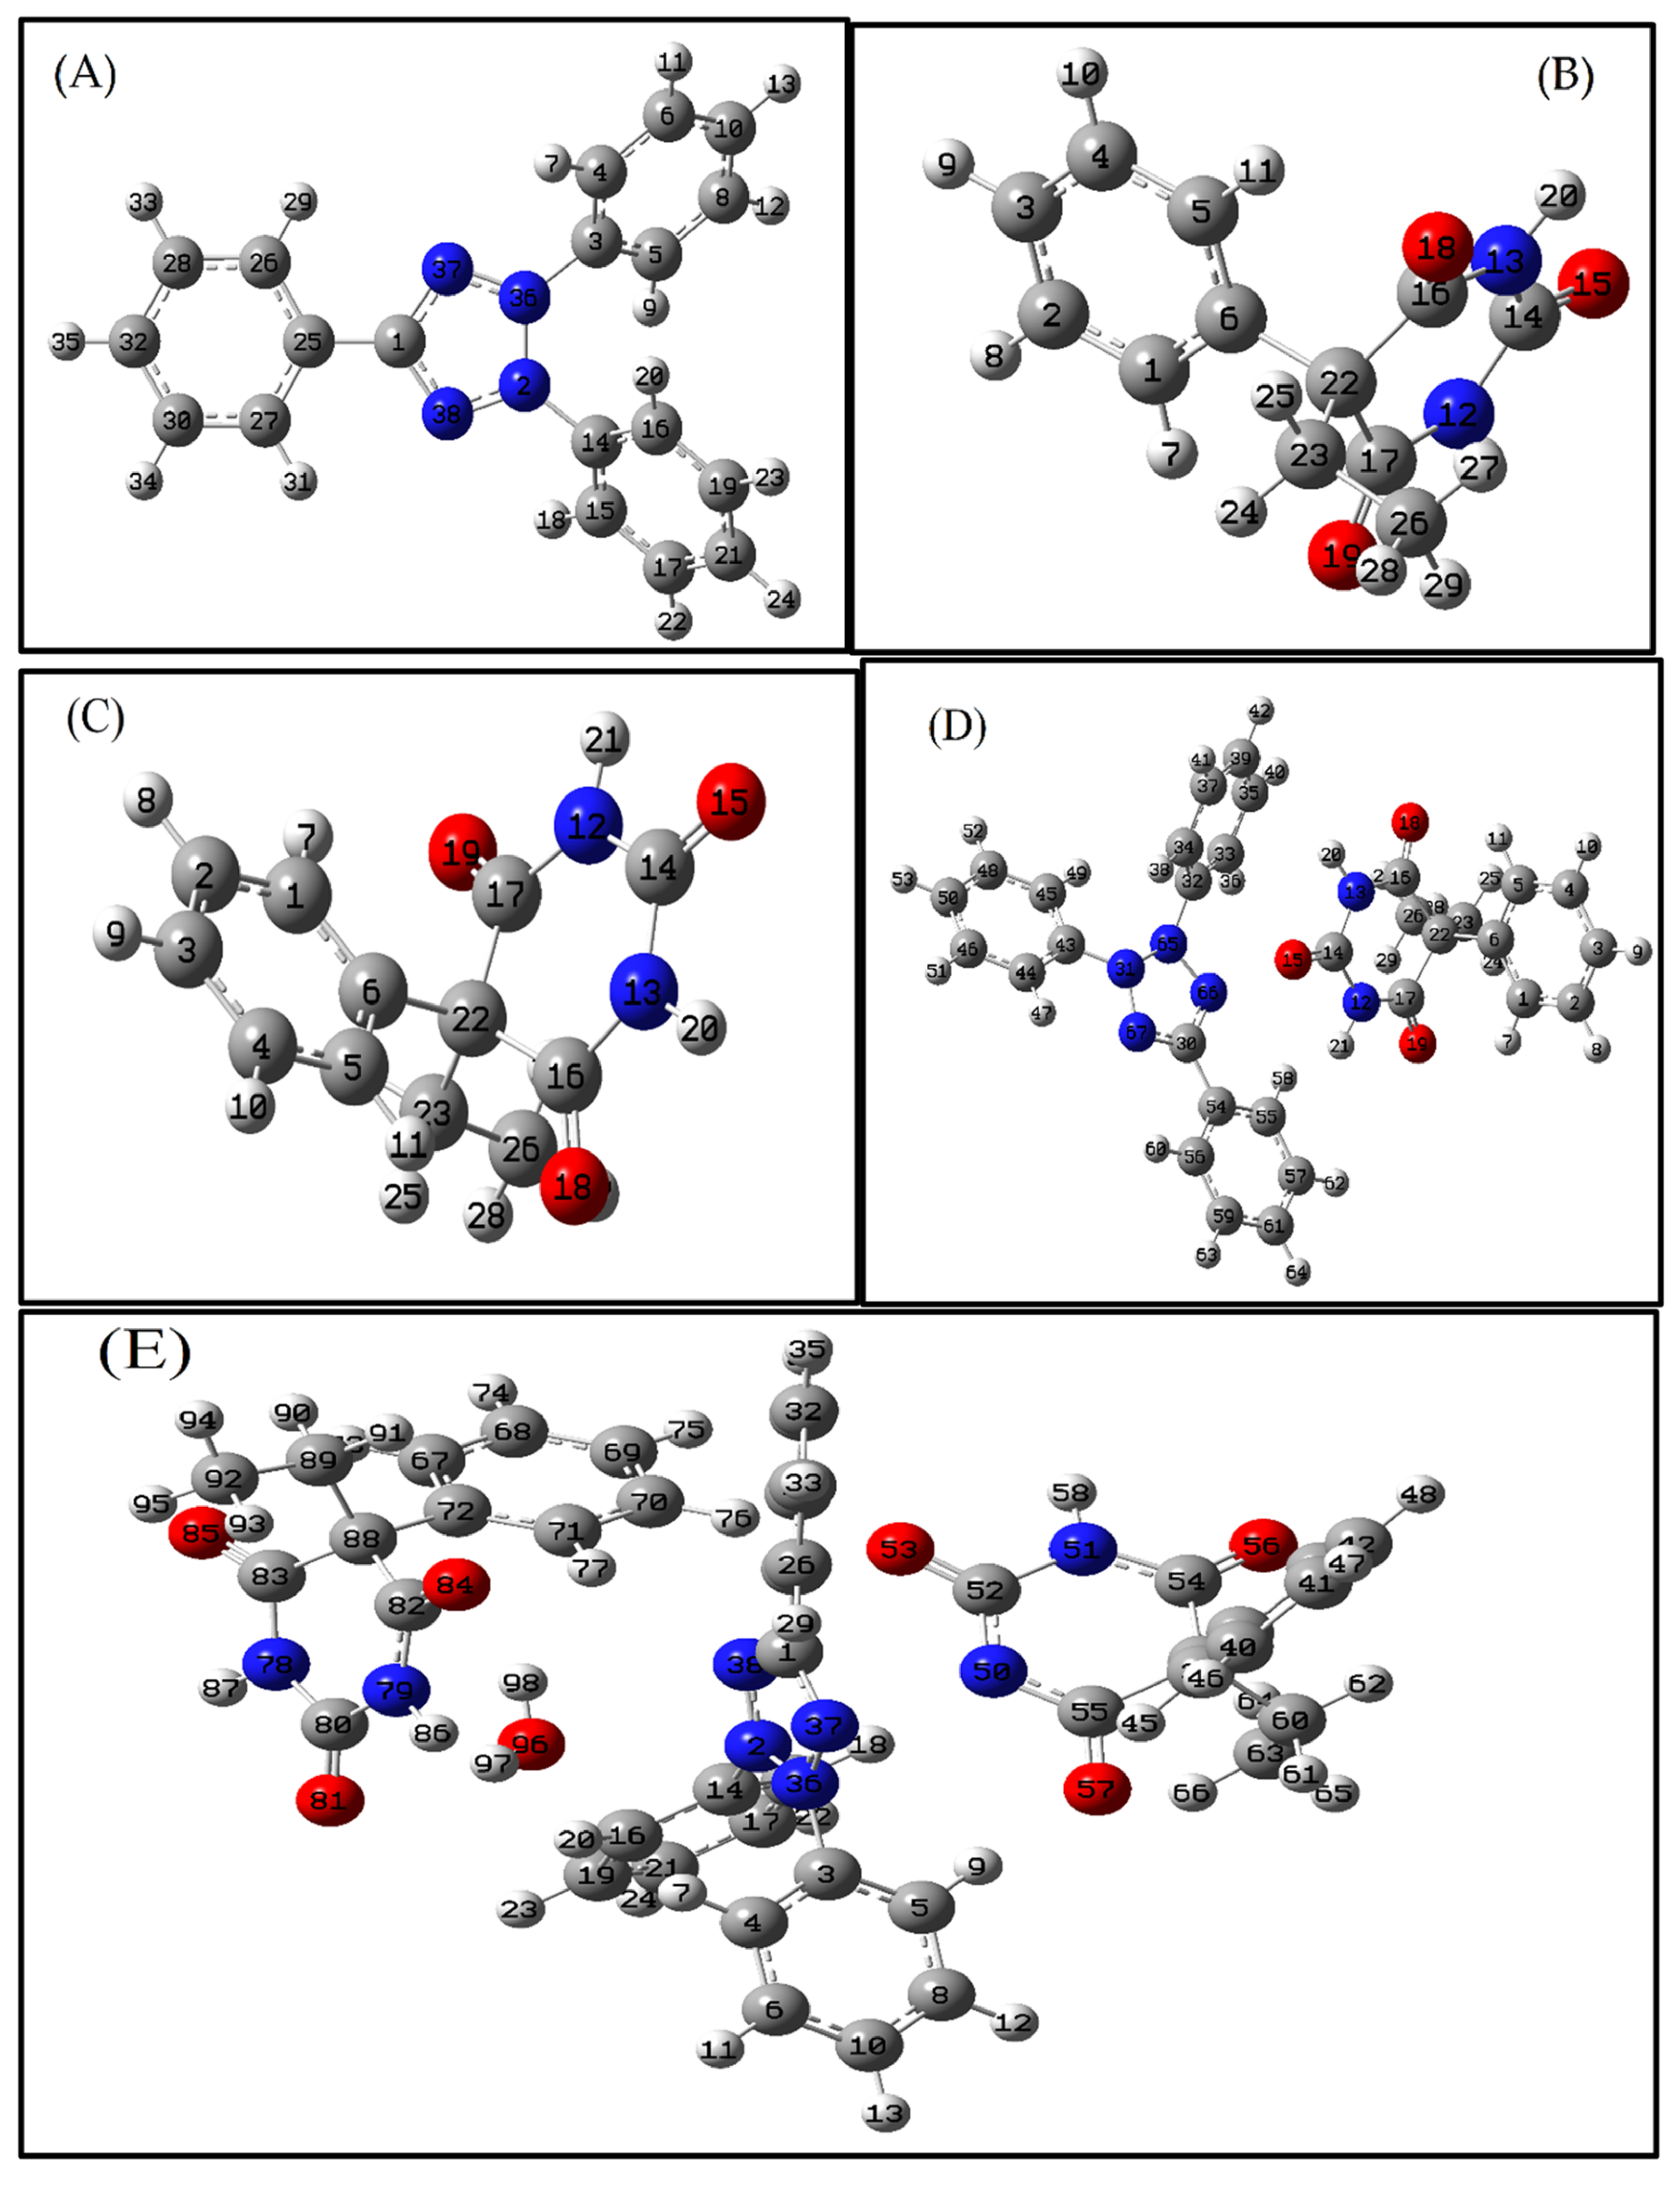
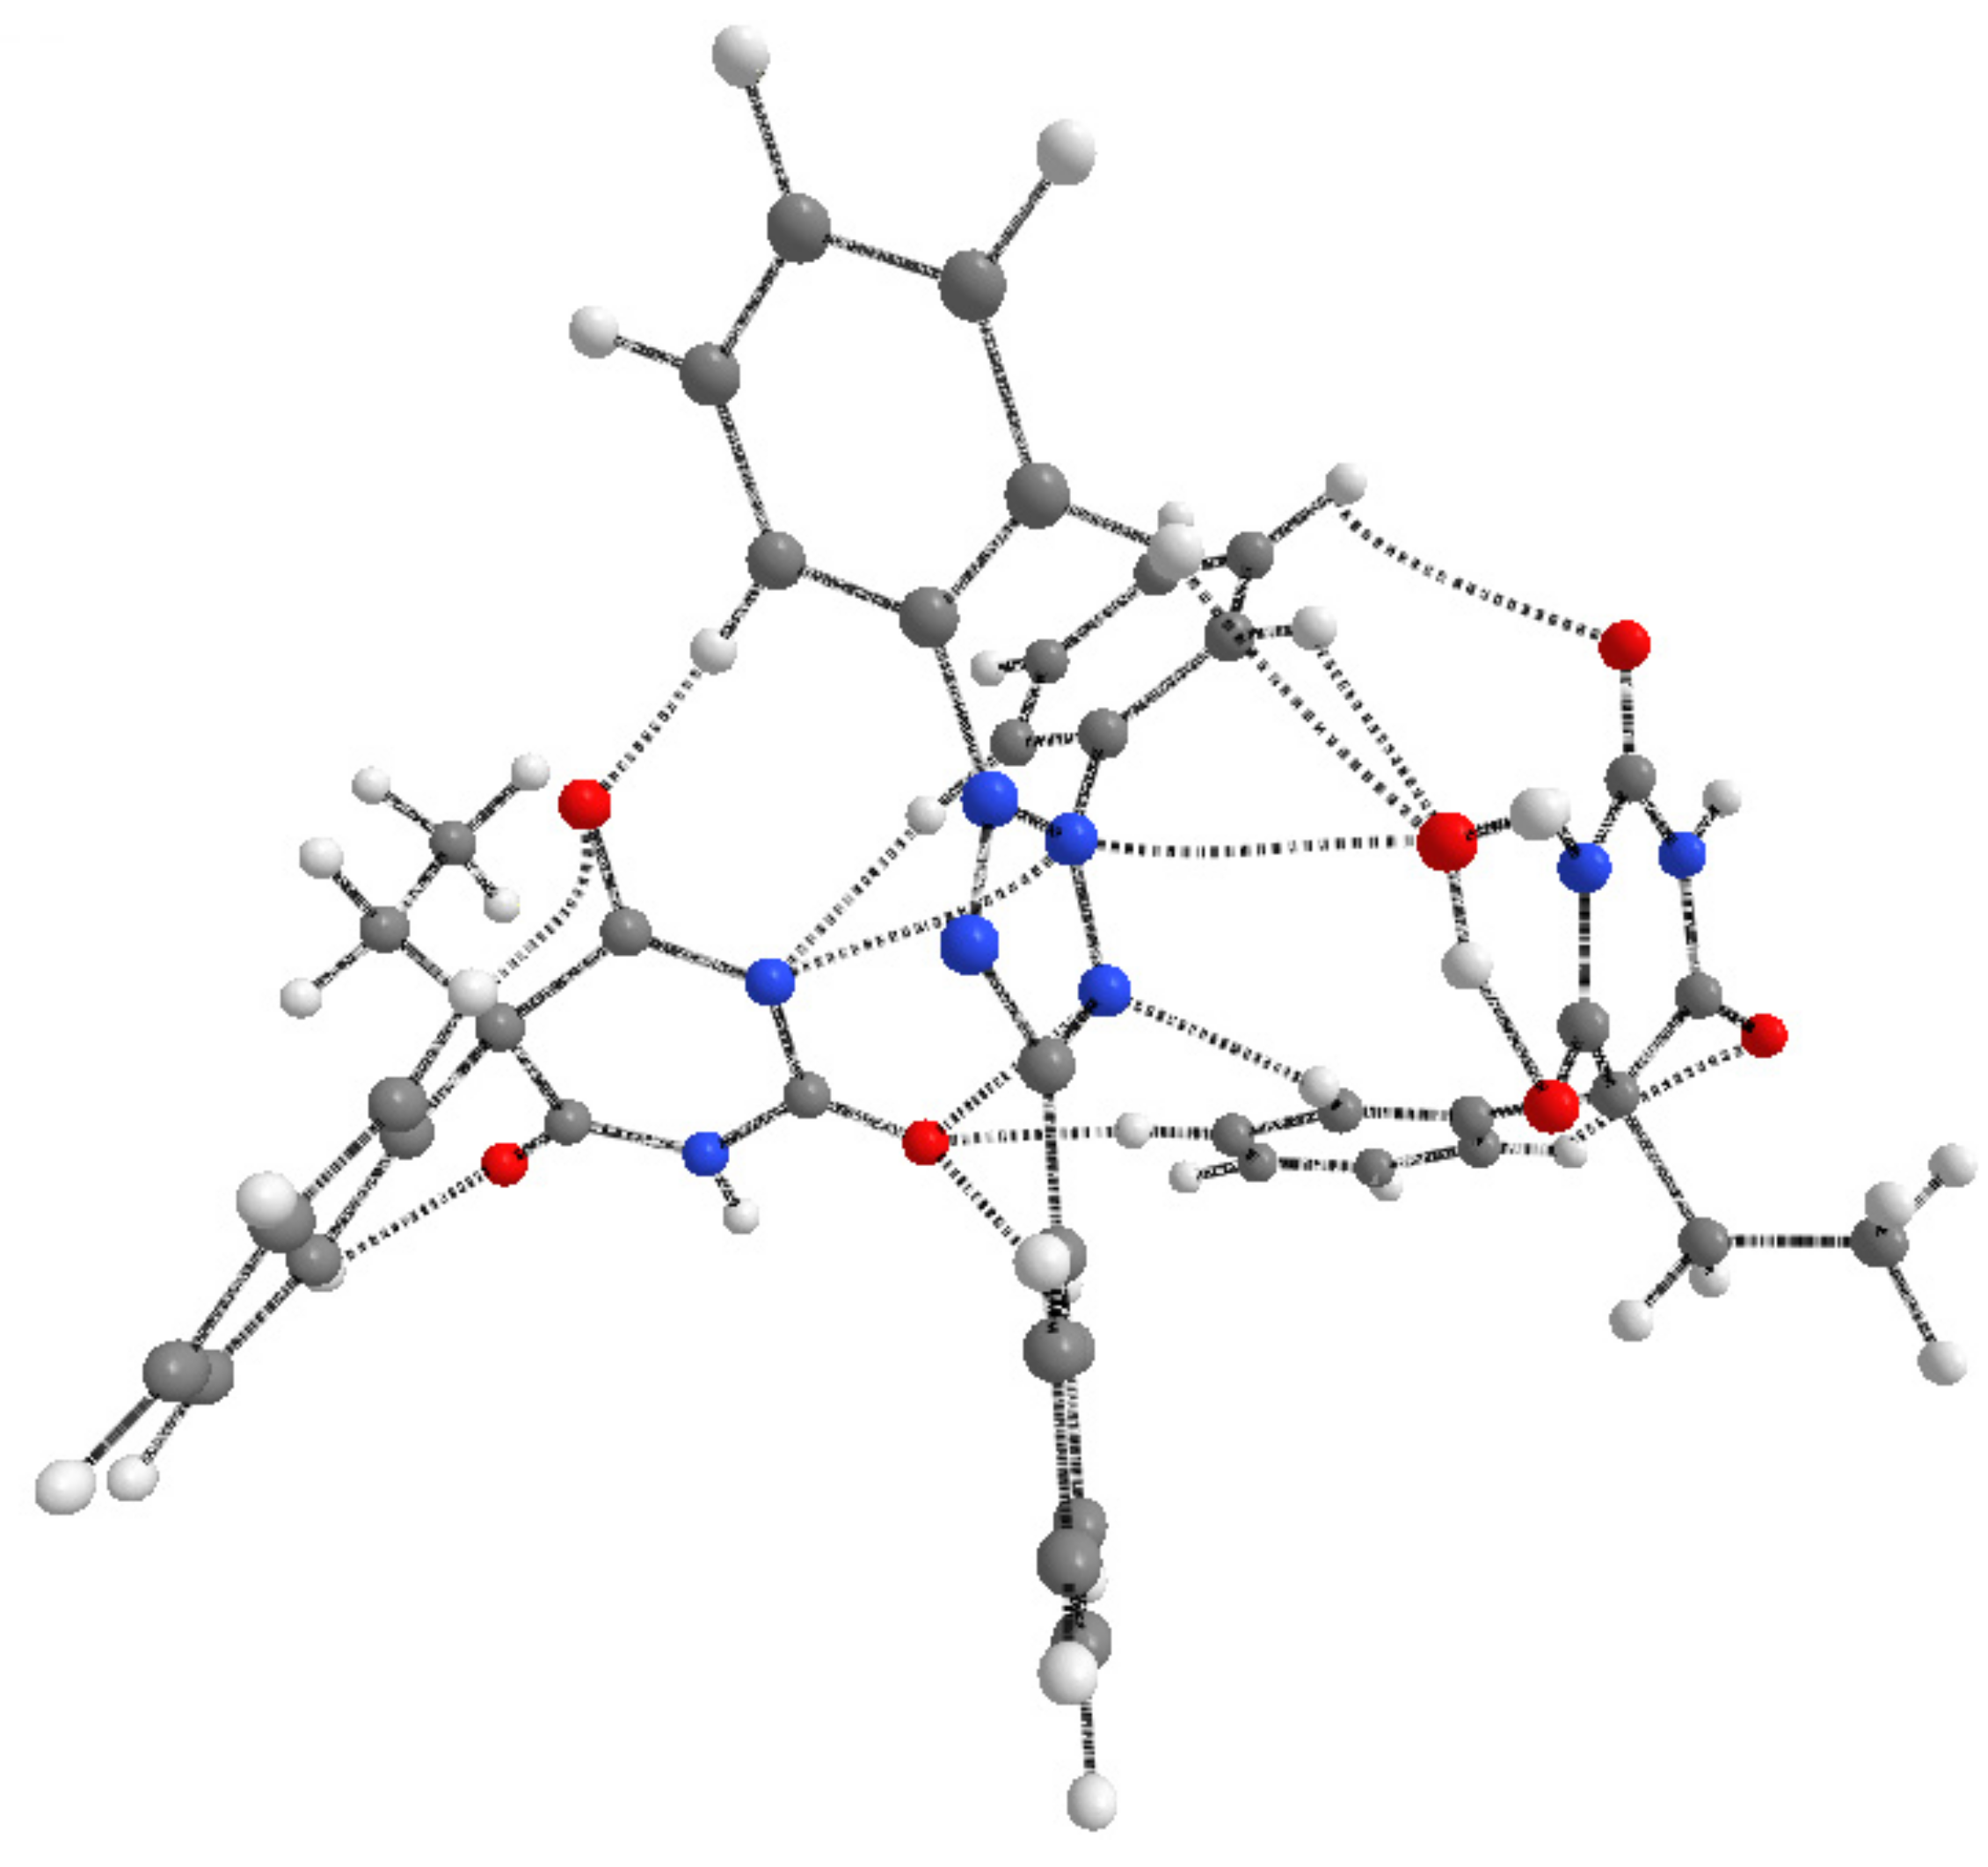
The geometries depicted in Figure 3 were selected to best reflect the energetically favored ion pair combinations and their thermodynamic stability and to maximize the hydrogen bond interaction, as well as to agree with the experimental crystal geometries. Additionally, all phenobarbitones were optimized for both protonated and deprotonated structures. Figure 3 shows the optimized geometries of the molecules. All these geometries were the local minima on the potential energy surface. The mean absolute errors for the (21) bond distances and the (36) bond angles are listed in Table 4. The MAE values ranged from 0.0213 to 0.0003 for the complex bond distances. The complex bond angles had MAE values of below 2.455°. B3LYP was utilized to obtain these MAE values.

3.3.2. Interaction Energies (IE)

To obtain the most stable configurations and binding energies of structures, the DFT approach at the B3LYP level using the 6-311G(d,p) basis set has been widely used. Phenobarbitone, water, triphenyl tetrazolium, and the phenobarbitone dimer, water, and triphenyl tetrazolium were investigated as a complex in this research. The complexes (molar ratio of 1:1) in the gas phase have complexation energy (raw), BSSE energy, complexation energy (corrected), and Gibbs free energy changes (ΔG) of −104.59 kcal/mole, 0.0234, −89.88, and −11.814 kcal/mol, respectively. The phenobarbitone dimer, water, and triphenyl tetrazolium complex has the lowest complexation energy, indicating that it is the most stable phenobarbitone dimer, water, and triphenyl tetrazolium complex yet discovered. It also has a negative ΔG value, indicating that it is simple to generate spontaneously, and this result agreed with the experimental method.
To obtain the most stable configurations and binding energies of the structures, the DFT approach at the B3LYP level using the 6-311G(d,p) basis set was used. Before investigating the complexation energy of the different crystal systems, the optimization of the complex structures at different ratios of TPT-PBT -(PBT-1) was studied, resulting in three equilibrium structures without imaginary frequencies (frequencies of less than zero): TPT:PBT (1:1), TPT: (neutral-PBT and anion-PBT) (1:2), and TPT: (neutral-PBT and anion-PBT): H2O (1:2: H2O).
The complexation energies and BSSE energies of the complexes of (TPT–PBT) (molar ratio of 1:1), (TPT–PBT–PBT–1) (molar ratio of 1:2) and (TPT–PBT–(PBT–1)–H2O (molar ratio of 1:2:H2O) were calculated. The complexes of the phenobarbitone dimers with and without a water molecule in the gas phase had complexation energies of −89.88 and −75.85 kcal/mol, respectively, and (corrected) BSSE energies of 0.0234 and 0.0104, respectively, while the complexes of those with a molar ratio of 1:1 in the gas phase had a complexation energy and a (corrected) BSSE energy of −1.02 kcal/mol and 0.0044, respectively (Table 5). Consequently, these complexation energy results for the complex of the phenobarbitone dimer and water molecules are lower than those for the complexes with a phenobarbitone dimer without water molecules and a single phenobarbitone, indicating that it is more stable than the other complexes. Moreover, the complexation energies of these complexes have negative values, indicating that they can be easily formed spontaneously and that the results are consistent with the experimental method. The results of the complexation energy tests are consistent with the results of the XRD crystallography tests on the real crystal.

3.3.3. Non-Covalent Interaction (NCI) Index

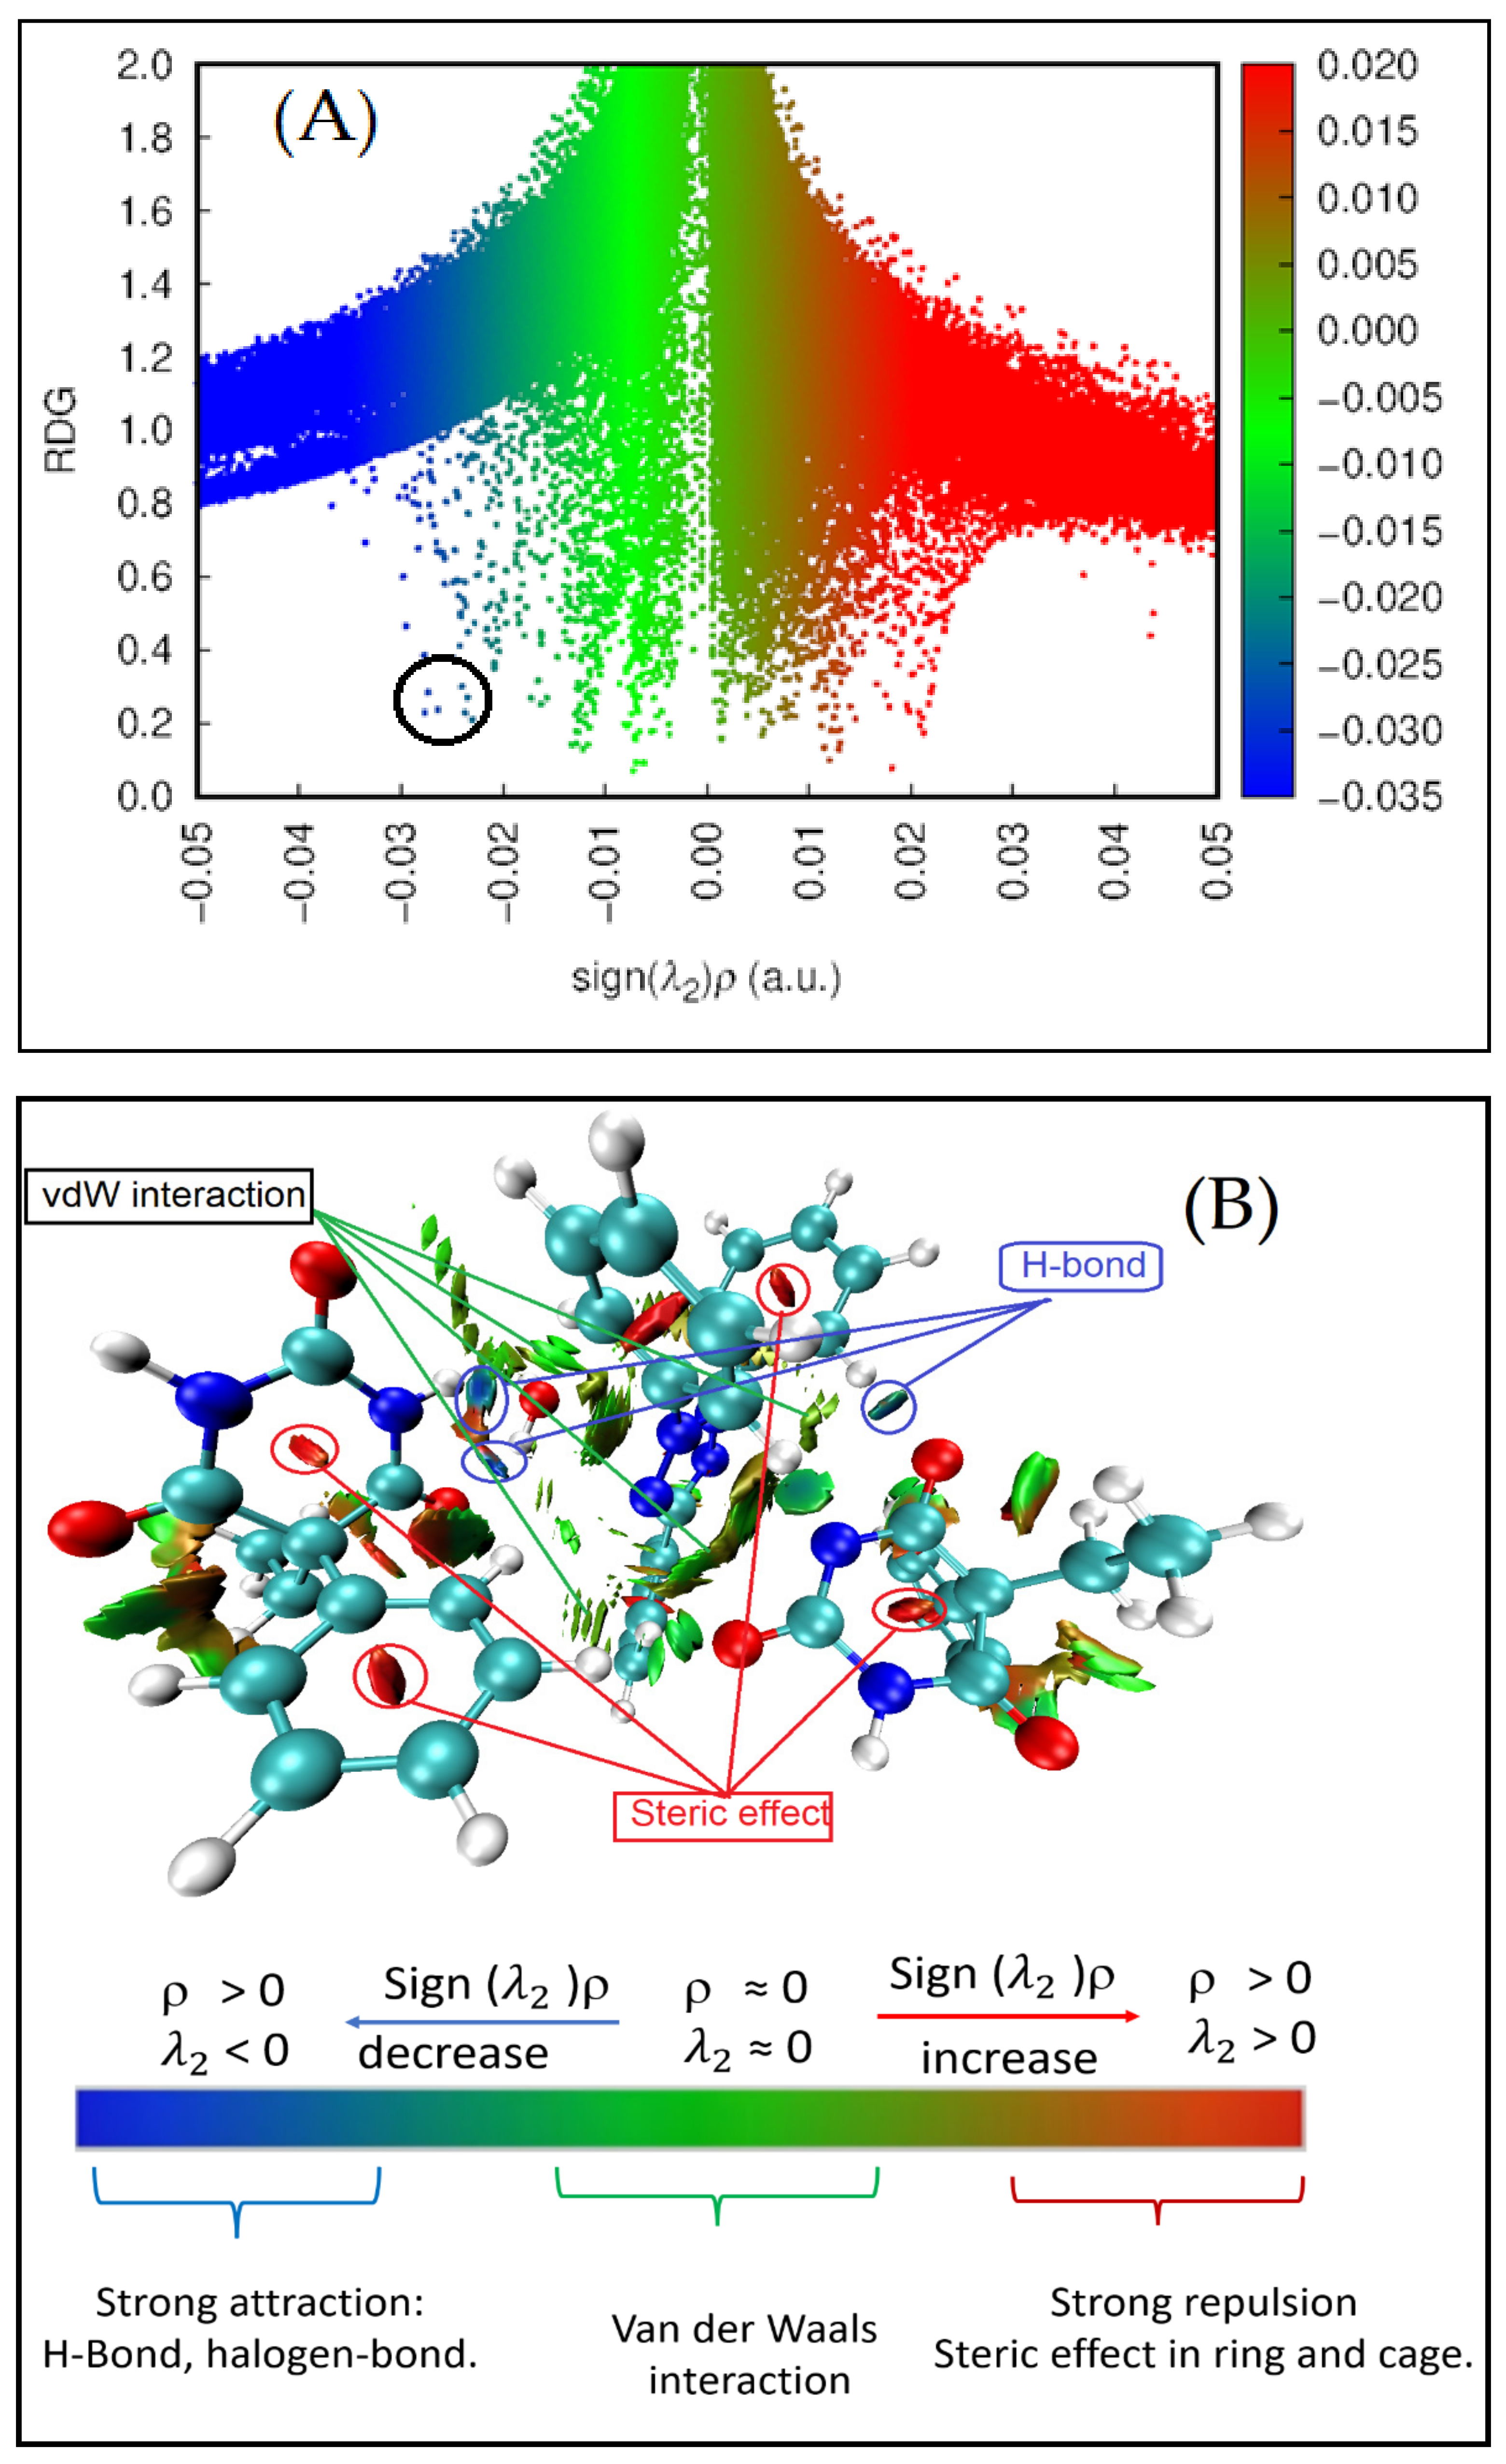
As with the AIM method, the reduced density gradient (RDG) is another effective technique for accounting for non-covalent interactions. Non-covalent interactions between molecules can be visualized using RDG scatter plots and non-covalent interaction (NCI) plots [11,37]. In this method, RDG is plotted against electron density and multiplied by the sign of the second eigenvalue (sign(λ2)ρ) [11], and both the inter- and intramolecular weak interactions may be as shown in Figure 4. On the negative scale (blue color), the RDG dispersed spots represent the H bonding interactions, while the spikes (green color) and positive scale of (sign(λ2)ρ) reflect the van der Waals interactions and the steric repulsions, respectively.
As seen in Figure 4A, the H bond of the studied complex can be shown at (0.025 a.u.). Therefore, the RDG area, which is shown by black circles, corresponds to the complexes O84⋯H98, O96⋯H86, and O57⋯H9.
In addition, as seen in Figure 4B, the NCI plot shows the H bonds, van der Waals interaction, and steric effect of the studied complex. The blue circles represent non-covalent bonds (H bonds), which suggests three H bonds. It is worth noting that the ions in the complex comprise aromatic moieties that appear to be involved in the van der Waals interaction with the strong RDG spikes, which are shown with a green color between the ions in Figure 4B. The steric effect, which is responsible for repulsion between ions, is represented by the red circle in Figure 4B.

3.3.4. Quantum Theory of Atoms in Molecules (QTAIM)

The quantum theory of atoms in molecules, developed by the late Prof. R. F. W. Bader, has been extensively employed in several studies to determine the topological features of various forms of π-hole interactions [29,30]. AIM analysis was completed on all compounds using the DFT:B3LYP/6-311G(d,p) basis set to gain a better understanding of the noncovalent H⋯O bonds.
The classification of the bonds between molecules in the complex at the bond critical points (BCP) 121, 138, 156, 163, 174, 177, 187, 191, 197, 204, 207, 209, and 225 was determined in accordance with Koch and Popelier [33,34], based on the findings of the topological analysis of the electron density for the complex depicted in Table 6 and Figure 5. Because their Laplacian ∇2ρ(r) values are positive and in the range of (0.0112–0.1025 a.u.), and their total energy density H(r) values are positive and in the range of (0.0006–0.002 a.u.), as well as, the values of the ratios of absolute potential energy density to kinetic energy density |V(r)|/G(r) in the interval (0.7356–0.957) are less than 1. Therefore, all bonds are closed-shell interactions (van der Waals interactions or weak H bonds). Moreover, the bonds at the BCP were separated into two parts based on the value of the ρ(r) and ∇2ρ(r): the first part, at BCP 163, 207, and 225, was characterized as van der Waals interactions since the (ρ(r)) was less than (0.002 a.u.) and the ∇2ρ(r) was also less than (0.024 a.u.), which is within the limits of van der Waals interactions. The second part, at the bond critical points (BCP) 121, 138, 156, 174, 177, 187, 191, 197, 204, and 209, were classified as hydrogen bond interactions because the (ρ(r)) value and the Laplacian ∇2ρ(r) at those bond critical points were in the ranges of (0.0056–0.0285 a.u.) and (0.0214–0.1025 a.u.), respectively, which is typical for H bond interactions.

3.4. MESP Analysis

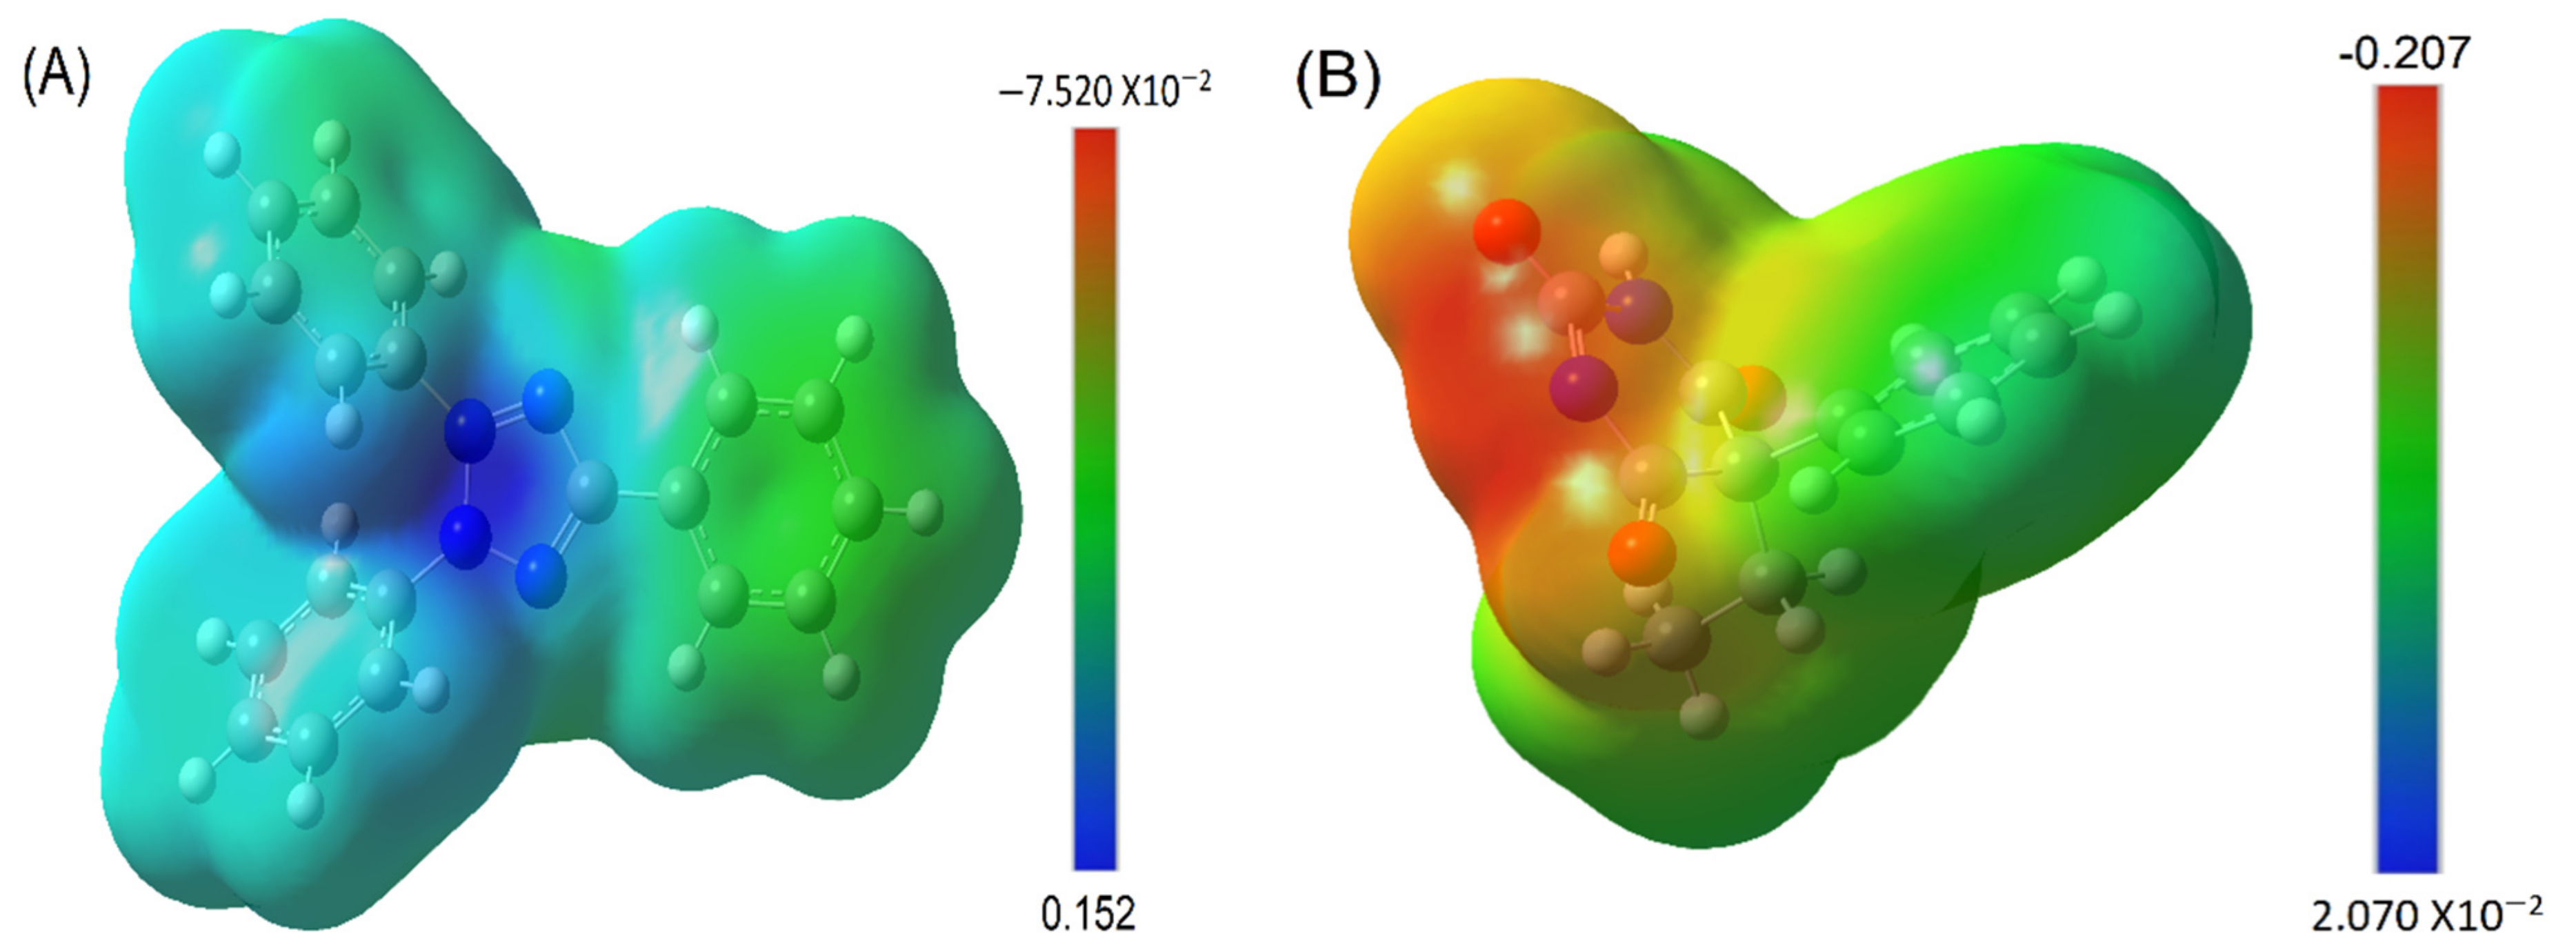
The molecular electrostatic potential (MEP) surfaces [20,31] are the best graphical representations of the electrostatic potential across the surface of a molecule for the purpose of identifying the electrophilic and nucleophilic centers. The MEP surfaces are color-coded, with blue and red representing the most positive and negative regions, respectively, and with green representing the neutral region. As seen in Figure 6, the MEP maps of phenobarbitone, water, triphenyl tetrazolium, and the complex of phenobarbitone dimer, water, and triphenyl tetrazolium complex are depicted in the gas phase. The MEP plot of the acceptor (triphenyl tetrazolium) is characterized by a positive zone (blue) in the center (surface map value of 0.152 au), which is regarded as an electrophile. The negative area originates from the C=O (−0.04088 and −0.207 au,) groups of phenobarbitone, respectively. With regards to the phenobarbitone primary negative area (red), which is located on the O15, O18, and O19 atoms (−0.0406, −0.0337, and −0.0336 au, respectively), it can be called an n-donor (nucleophile). Following the creation of a complex between the donor and acceptor, the C=O values are increased and the N2 atom of triphenyl tetrazolium is decreased to obtain a lower value. These results imply an n-electron transfer from the donor’s N2 to the phenobarbitone’s C=O groups. The PCM model’s surface map values likewise produced close results. As a result, the ESP map surfaces exhibited excellent agreement with the experimental results.

3.5. Reactivity Descriptors

Numerous reactivity descriptors, including ionization potential (Ip), electron affinity (A), chemical potential (μ), hardness (η), electrophilicity index (ω), and softness (σ), were estimated from the HOMO(N), HOMO (N + 1), and HOMO (N − 1) surfaces, providing insight into the reactivity of the chemical reactions. Equations are used to describe these characteristics. Table 7 summarizes the electrical interactions of triphenyl tetrazolium and phenobarbitone with the generated CT complex characteristics. The electrical properties of the phenobarbitone and triphenyl tetrazolium molecules are deduced from this table. When determining a molecule’s HOMO−LUMO energies, a high EHOMO indicates a good electron donor, whereas a low ELUMO indicates a good electron acceptor. Because phenobarbitone has a lower ELUMO than triphenyl tetrazolium in gas and PCM analysis, it is regarded as an electron acceptor; yet, because triphenyl tetrazolium has a higher EHOMO than phenobarbitone, it is considered an electron donor. Additionally, the chemical potential is an index of potential that specifies the direction of electron flow between molecules. Electrons flow from a structure with the highest chemical potential to one with the lowest chemical potential. With regards to this interpretation, triphenyl tetrazolium possesses a stronger chemical potential than phenobarbitone. Additionally, the electrophilicity of phenobarbitone is greater than that of triphenyl tetrazolium, indicating that phenobarbitone is the better electrophile and should be considered an e-acceptor, while triphenyl tetrazolium is an e-donor. Additionally, the softness values and these results established that triphenyl tetrazolium is an electron donor in gas and PCM analyses, whereas phenobarbitone is an electron acceptor.
Figure 6 shows that HOMO is localized only on phenobarbitone, while LUMO is localized on the triphenyl tetrazolium moiety. The electron affinity (EA) and ionization potential (IP) can be calculated using Koopman’s theorem [10]: EA = −ELUMO and IP = −EHOMO. Table 7 provides an overview of some of the parameters calculated using DFT. The EHOMO of the complex has a value of 7.37 eV, which is comparable to the EHOMO of the donor phenobarbitone, which has a value of 9.08 eV. On the other hand, the ELUMO of the complex has a value of 1.34 eV, which is closely related to the ELUMO of the acceptor triphenyl tetrazolium (−0.05 eV). The HOMOs and LUMOs follow the same trend in other donor acceptor systems [4]. The HOMO-LUMO plots and the energy gap show the charge transfer between phenobarbitone and triphenyl tetrazolium within the complex.

4. Conclusions

In conclusion, the title compound four was prepared efficiently by the reaction of phenobarbital sodium (1) with triphenyl tetrazolium chloride (3) in deionized water at an ambient temperature. The structure of compound four was established on the basis of its X-ray single crystal analysis. In the present study, a TPT, a PBT, and their complex were described, and their geometric structures and electrical characteristics were fully examined using experimental- and DFT-level theoretical calculations. This demonstrated that the estimated geometric characteristics, such as bond length and angle, were in excellent agreement with the XRD crystallography results. The HOMO and LUMO tests were used to determine the drug’s energy gap, chemical activity, and charge transfer. MEP testing has also been shown to identify electrophilicity and nucleophilicity zones. NCI analysis identifies van der Walls interactions and weak interactions. All these analyses provided results which concluded that the complex, with a ratio of 1:2 (TPT: PBT), was more stable, and this suggestion agreed with the XRD results. In addition, the complex interacted through charge transfer interaction.

Supplementary Materials

The following supporting information can be downloaded at: https://www.mdpi.com/article/10.3390/cryst12121706/s1, Figure S1. FTIR spectrum of the complex of (TPT-PBT-PBT-1-H2O). Figure S2. 1H-NMR spectra of the complex (TPT-PBT-PBT-1-H2O). Figure S3: 13C-NMR spectra of the complex (TPT-PBT-PBT-1-H2O). Figure S4. (a) Mass spectra of the complex of TPT-PBT (positive scan). (b) Mass spectra for the complex of TPT-PBT (negative scan)..

Author Contributions

Conceptualization G.A.E.M.; methodology, G.A.E.M. and E.A.A. software, A.H.B.; validation, G.A.E.M., formal analysis, H.A.G.; investigation, H.A.G. and A.H.B.; resources G.A.E.M.; writing—original draft preparation, G.A.E.M., A.H.B., H.A.G., H.H., R.A.-S. and E.A.A.; writing—review and editing, G.A.E.M., A.H.B., H.A.G., H.H., R.A.-S. and E.A.A. All authors have read and agreed to the published version of the manuscript.

Funding

This research was funded by the Researchers Supporting Project, King Saud University, through grant no. RSP-2021-45.

Data Availability Statement

Not applicable.

Acknowledgments

The authors wish to thank Researchers Supporting Project No. RSP-2021/45 at King Saud University, Riyadh, Saudi Arabia, for the financial support.

Conflicts of Interest

The authors have declared that there is no conflict of interest.

References

  1. Gennaro, A.R. Remington: The Science and Practice of Pharmacy, 19th ed.; Easton, P.A., Ed.; Mack Publishing Co.: London, UK, 1995; Volume II, pp. 1164–1165. [Google Scholar]
  2. Schmidt, D.; Ilse, E.; Ferdinand, H. The influence of seizure type on the efficacy of plasma concentrations of phenytoin, phenobarbital, and carbamazepine. Arch. Neurol. 1986, 43, 263–265. [Google Scholar] [CrossRef] [PubMed]
  3. Ilangaratne, N.B.; Nilanka, N.M.; Gail, S.B.; Josemir, W.S. Phenobarbital: Missing in action. Bull. World Health Organ. 2012, 90, 871−871a. [Google Scholar] [CrossRef] [PubMed]
  4. Gavazov, K.B.; Atanas, N.; Vanya, D.L. The use of tetrazolium salts in inorganic analysis. Russ. Chem. Rev. 2007, 76, 169–179. [Google Scholar] [CrossRef]
  5. Abbas, M.N.; Mostafa, G.A.E. New triiodomercurate-modified carbon paste electrode for the potentiometric determination of mercury. Anal. Chim. Acta 2003, 478, 329–335. [Google Scholar] [CrossRef]
  6. Hassanien, M.M.; Abou-El-Sherbini, K.S.; Mostafa, G.A.E. A novel tetrachlorothallate(III)-PVC membrane sensor for the potentiometric determination of thallium (III). Talanta 2003, 59, 383–392. [Google Scholar] [CrossRef]
  7. Mostafa, G.A.E. PVC matrix membrane sensor for potentiometric determination of triphenyl tetrazolium chloride and ascorbic acid. Ann. Di Chim. 2007, 97, 1247–1256. [Google Scholar] [CrossRef]
  8. Fenniri, H.; Mathivanan, P.; Vidale, K.L.; Sherman, D.M.; Hallenga, K.; Wood, K.V.; Stowell, J.G. Helical rosette nanotubes: Design, self-assembly, and characterization. J. Am. Chem. Soc. 2001, 123, 3854–3855. [Google Scholar] [CrossRef]
  9. Kruse, P.; Johnson, E.R.; DiLabio, G.A.; Wolkow, R.A. Patterning of vinylferrocene on H−Si (100) via self-directed growth of molecular lines and STM-induced decomposition. Nano Lett. 2002, 2, 807–810. [Google Scholar] [CrossRef]
  10. Sheiko, S.S.; Sun, F.C.; Randall, A.; Shirvanyants, D.; Rubinstein, M.; Lee, H.-i.; Matyjaszewski, K. Adsorption-induced scission of carbon–carbon bonds. Nature 2006, 440, 191–194. [Google Scholar] [CrossRef] [Green Version]
  11. Johnson, E.R.; Keinan, S.; Mori-Sánchez, P.; Contreras-García, J.; Cohen, A.J.; Yang, W. Revealing noncovalent interactions. J. Am. Chem. Soc. 2010, 132, 6498–6506. [Google Scholar] [CrossRef]
  12. DiLabio, G.A.; Piva, P.G.; Kruse, P.; Wolkow, R.A. Dispersion interactions enable the self-directed growth of linear alkane nanostructures covalently bound to silicon. J. Am. Chem. Soc. 2004, 126, 16048–16050. [Google Scholar] [CrossRef] [PubMed]
  13. Kollman, P.A. Noncovalent interactions. Acc. Chem. Res. 1977, 10, 365–371. [Google Scholar] [CrossRef]
  14. Keinan, S.; Ratner, M.A.; Marks, T.J. Molecular zippers–designing a supramolecular system. Chem. Phys. Lett. 2004, 392, 291–296. [Google Scholar] [CrossRef]
  15. Sheldrick, G.M. A short history of SHELX. Acta Crystallogr. Sect. A Found. Crystallogr. 2007, 64, 112–122. [Google Scholar] [CrossRef] [PubMed] [Green Version]
  16. Becke, A. Density-functional thermochemistry. III. The role of exact exchange. J. Chem. Phys. 1993, 98, 5648. [Google Scholar] [CrossRef] [Green Version]
  17. Lee, C.; Yang, W.; Parr, R.G. Development of the Colle-Salvetti correlation-energy formula into a functional of the electron density. Phys. Rev. B 1988, 37, 785. [Google Scholar] [CrossRef] [Green Version]
  18. Ghabbour, H.A.; Bakheit, A.H.; Ezzeldin, E.; Mostafa, G.A.E. Synthesis Characterization and X-ray Structure of 2-(2,6-Dichlorophenylamino)-2-imidazoline Tetraphenylborate: Computational Study. Appl. Sci. 2022, 12, 3568. [Google Scholar] [CrossRef]
  19. Ditchfield, R.; Hehre, W.J.; Pople, J.A. Self-consistent molecular-orbital methods. IX. An extended Gaussian-type basis for molecular-orbital studies of organic molecules. J. Chem. Phys. 1971, 54, 724–728. [Google Scholar] [CrossRef]
  20. Mostafa, G.A.E.; Bakheit, A.; AlMasoud, N.; AlRabiah, H. Charge Transfer Complexes of Ketotifen with 2,3-Dichloro-5,6-dicyano-p-benzoquinone and 7,7,8,8-Tetracyanoquodimethane: Spectroscopic Characterization Studies. Molecules 2021, 26, 2039. [Google Scholar] [CrossRef]
  21. Solovyov, S.A. Categorical foundations of variety-based topology and topological systems. Fuzzy Sets Syst. 2012, 192, 176–200. [Google Scholar] [CrossRef]
  22. Boys, S.F.; Bernardi, F. The calculation of small molecular interactions by the differences of separate total energies. Some procedures with reduced errors. Mol. Phys. 1970, 19, 553–566. [Google Scholar] [CrossRef]
  23. Grabowski, S.J. Theoretical studies of strong hydrogen bonds. Annu. Rep. Sect. C Phys. Chem. 2006, 102, 131–165. [Google Scholar] [CrossRef]
  24. Espinosa, E.; Molins, E.; Lecomte, C. Hydrogen bond strengths revealed by topological analyses of experimentally observed electron densities. Chem. Phys. Lett. 1998, 285, 170–173. [Google Scholar] [CrossRef]
  25. Espinosa, E.; Alkorta, I.; Rozas, I.; Elguero, J.; Molins, E. About the evaluation of the local kinetic, potential and total energy densities in closed-shell interactions. Chem. Phys. Lett. 2001, 336, 457–461. [Google Scholar] [CrossRef]
  26. Bader, R.F.; Essén, H. The characterization of atomic interactions. J. Chem. Phys. 1984, 80, 1943–1960. [Google Scholar] [CrossRef]
  27. Espinosa, E.; Alkorta, I.; Elguero, J.; Molins, E. From weak to strong interactions: A comprehensive analysis of the topological and energetic properties of the electron density distribution involving X–H⋯ F–Y systems. J. Chem. Phys. 2002, 117, 5529–5542. [Google Scholar] [CrossRef]
  28. Weinhold, F. Nature of H-bonding in clusters, liquids, and enzymes: An ab initio, natural bond orbital perspective. J. Mol. Struct. THEOCHEM 1997, 398, 181–197. [Google Scholar] [CrossRef]
  29. Bader, R.F. Atoms in molecules. Acc. Chem. Res. 1985, 18, 9–15. [Google Scholar] [CrossRef]
  30. Bader, R.F. A quantum theory of molecular structure and its applications. Chem. Rev. 1991, 91, 893–928. [Google Scholar] [CrossRef]
  31. Abuelizz, H.A.; Taie, H.A.A.; Bakheit, A.H.; Marzouk, M.; Abdellatif, M.M.; Al-Salahi, R. Biological Evaluation of 4-(1H-triazol-1-yl)benzoic Acid Hybrids as Antioxidant Agents: In Vitro Screening and DFT Study. Appl. Sci. 2021, 11, 11642. [Google Scholar] [CrossRef]
  32. Pakiari, A.; Fakhraee, S. Electron density analysis of weak van der Waals complexes. J. Theor. Comput. Chem. 2006, 5, 621–631. [Google Scholar] [CrossRef]
  33. Koch, U.; Popelier, P.L. Characterization of CHO hydrogen bonds on the basis of the charge density. J. Phys. Chem. 1995, 99, 9747–9754. [Google Scholar] [CrossRef]
  34. Popelier, P. Characterization of a dihydrogen bond on the basis of the electron density. J. Phys. Chem. A 1998, 102, 1873–1878. [Google Scholar] [CrossRef]
  35. Keith, T.A. AIMAll (Version 10.05. 04, Professional); TK Gristmill Software: Overland Park, KS, USA, 1997. [Google Scholar]
  36. Dennington, R.; Keith, T.A.; Millam, J.M. GaussView, Version 6.1; Semichem Inc.: Shawnee Mission, KS, USA, 2016. [Google Scholar]
  37. Contreras-García, J.; Johnson, E.R.; Keinan, S.; Chaudret, R.; Piquemal, J.-P.; Beratan, D.N.; Yang, W. NCIPLOT: A program for plotting noncovalent interaction regions. J. Chem. Theory Comput. 2011, 7, 625–632. [Google Scholar] [CrossRef]
  38. Moffat, A.C.; Osselton, M.D.; Brian, W.; Clarke, E.G.C. Clarke’s analysis of drugs and poisons. In Pharmaceuticals, Body Fluids and Postmortem Materials; Pharmaceutical Press: London, UK, 2004; Volume 1, p. 1431. [Google Scholar]
  39. Gjikaj, M.; Xie, T.; Brockner, W. Uncommon compounds in antimony pentachloride-ionic liquid systems: Synthesis, crystal structure and vibrational Spectra of the Complexes [TPT][SbCl6] and [Cl-EMIm][SbCl6]. Z. Für Anorg. Und Allg. Chem. 2009, 635, 1036–1040. [Google Scholar] [CrossRef]
Scheme 1. Synthesis of the triphenyl tetrazolium salt of phenobarbital (4).
Crystals 12 01706 sch001
Figure 1. View of the tetrazolium cation and phenobarbital anion, in addition to one neutral phenobarbital and water molecules, in the asymmetric unit. The ellipsoids are drawn at the 50% probability level, with the H atoms represented by circles of arbitrary size.
Crystals 12 01706 g001
Figure 2. Crystal packing of the titled compound showing the intermolecular hydrogen bonds as dashed lines.
Crystals 12 01706 g002
Figure 3. B3LYP/6-311G(d,p)-optimized geometries of the molecules: (A) triphenyl tetrazolium; (B,C) deprotonated and protonated phenobarbitone, respectively; (D) phenobarbitone and triphenyl tetrazolium complex; and (E) phenobarbitone dimer, water, and triphenyl tetrazolium complex.
Crystals 12 01706 g003
Figure 4. (A) RDG scatter plots and (B) non-covalent interaction (NCI) plots of the complex (TPT–PBT–(PBT−1)–H2O).
Crystals 12 01706 g004
Figure 5. Topological atoms in molecules (AIM) graph of the phenobarbitone-triphenyl tetrazolium complex.
Crystals 12 01706 g005
Figure 6. MESP analysis of the electrophilic sites for: (A) triphenyl tetrazolium, (B) phenobarbitone anion, (C) phenobarbitone, (D) water molecules, and (E,F) the complex of phenobarbitone dimer and water, with triphenyl tetrazolium both without and with PCM, respectively, superimposed on the isodensity surface of the structures (isovalue of 0.002), computed at the B3LYP/6-311G(d,p) level.
Crystals 12 01706 g006aCrystals 12 01706 g006b
Table 1. X-ray crystallographic data for compound four.
Crystal Data
Chemical formulaC43H40N8O7
Molecular weight780.83
Crystal system, space groupMonoclinic, P21/c
Temperature (K)100
a, b, and c (Å)15.3678 (9), 12.2710 (7), and 21.8514 (13)
α, β, and γ (°)90.00, 109.867 (2), and 90.00
V3)3875.5 (4)
Z4
Radiation typeMo Kα
µ (mm−1)0.09
Crystal size (mm)0.36 × 0.14 × 0.05
Data collection
DiffractometerBruker APEX-II D8 venture diffractometer
Absorption correctionMulti-scan SADABS Bruker 2014
Tmin and Tmax0.873 and 0.891
No. of measured, independent, and observed [I > 2σ(I)] reflections68448, 6820, and 4452
Rint0.156
Refinement
R[F2 > 2σ(F2)], wR(F2), and S0.086, 0.216, and 1.07
No. of reflections6820
No. of parameters536
No. of restraints0
H atom treatmentH atoms treated by a mixture of independent and constrained refinement
Δρmax and Δρmin (e Å−3)1.00 and −0.59
Table 2. Selected geometric parameters (Å and °).
O4—C151.221 (6)N7—C381.460 (6)
O5—C141.242 (5)N8—C251.342 (6)
O6—C131.256 (5)N3—C151.367 (6)
O1—C11.212 (5)N3—C141.400 (5)
O2—C21.217 (6)N4—C141.334 (5)
O3—C31.218 (5)N4—C131.328 (6)
N5—N61.314 (5)N1—C11.374 (6)
N5—C251.346 (6)N1—C21.371 (6)
N6—C261.445 (6)N2—C31.366 (6)
N6—N71.328 (6)N2—C21.383 (7)
N7—N81.317 (6)
N6—N5—C25103.5 (4)O6—C13—N4120.2 (4)
N5—N6—C26123.8 (4)O6—C13—C16116.7 (4)
N7—N6—C26126.0 (4)N4—C13—C16123.1 (4)
N5—N6—N7110.2 (4)N3—C14—N4121.3 (4)
N6—N7—C38124.7 (4)O5—C14—N4122.4 (4)
N8—N7—C38125.2 (4)O5—C14—N3116.3 (4)
N6—N7—N8110.2 (4)O4—C15—C16122.9 (4)
N7—N8—C25103.5 (4)O4—C15—N3120.6 (4)
C14—N3—C15125.2 (4)N3—C15—C16116.6 (4)
C13—N4—C14120.4 (4)O1—C1—N1120.4 (4)
C1—N1—C2125.6 (4)O1—C1—C4121.2 (4)
C2—N2—C3126.7 (4)N1—C1—C4118.4 (3)
N5—C25—N8112.6 (4)N1—C2—N2116.6 (4)
N8—C25—C32124.5 (4)O2—C2—N2122.1 (4)
N5—C25—C32122.9 (4)O2—C2—N1121.3 (4)
N6—C26—C31118.0 (4)N2—C3—C4117.8 (4)
N6—C26—C27118.8 (4)O3—C3—N2121.0 (4)
N7—C38—C39118.2 (4)N7—C38—C43117.9 (4)
Table 3. Hydrogen bond geometry (Å and °).
D—H···AD—HH···AD···AD—H···A
O1W—H1OW···O2i0.85 (8)2.33 (9)3.017 (5)139 (7)
O1W—H2OW···O6ii0.90 (8)1.85 (8)2.733 (6)167 (6)
N2—H1N2···O6iii0.91 (7)1.94 (7)2.827 (5)163 (5)
N2—H1N2···N4iii0.91 (7)2.60 (6)3.361 (5)141 (6)
N3—H3A···O5iv0.86001.93002.793 (5)179.00
C18—H18A···O10.96002.57003.319 (7)135.00
C20—H20A···O5v0.93002.51003.348 (8)150.00
C27—H27A···O4ii0.93002.54003.253 (7)133.00
C28—H28A···O1vi0.93002.48003.109 (7)125.00
C29—H29A···O1vi0.93002.57003.151 (6)121.00
C34—H34A···O5iii0.93002.59003.307 (7)134.00
Symmetry codes: (i) x, y − 1, z; (ii) −x + 1, y−1/2, −z−1/2; (iii) −x + 1, y + 1/2, −z − 1/2; (iv) −x + 2, −y + 1, −z; (v) x − 1, y, z; and (vi) x, −y + 1/2, z − 1/2.
Table 4. The geometric characteristics calculated for the phenobarbitone dimer, water, and triphenyl tetrazolium complex using DFT and B3LYP/6-311G(d,p). Distances are expressed in Å and bond angles are expressed in degrees.
Bond DistanceExp.DFT-B3LYPBond DistanceExp.DFT-B3LYP
O4—C151.221 (6)1.2185N7—C381.460 (6)1.4461
O5—C141.242 (5)1.2297N8—C251.342 (6)1.3431
O6—C131.256 (5)1.2402N3—C151.367 (6)1.3686
O1—C11.212 (5)1.2083N3—C141.400 (5)1.4181
O2—C21.217 (6)1.2078N4—C141.334 (5)1.3506
O3—C31.218 (5)1.2194N4—C131.328 (6)1.3493
N5—N61.314 (5)1.3029N1—C11.374 (6)1.3909
N5—C251.346 (6)1.3457N1—C21.371 (6)1.3859
N6—C261.445 (6)1.4402N2—C31.366 (6)1.3761
N6—N71.328 (6)1.3436N2—C21.383 (7)1.3899
N7—N81.317 (6)1.3068
Bond AngleExp.DFT-B3LYPBond AngleExp.DFT-B3LYP
N6—N5—C25103.5 (4)104.5042O6—C13—N4120.2 (4)121.1666
N5—N6—C26123.8 (4)124.0503O6—C13—C16116.7 (4)117.3011
N7—N6—C26126.0 (4)126.336N4—C13—C16123.1 (4)121.4691
N5—N6—N7110.2 (4)109.5968N3—C14—N4121.3 (4)118.9716
N6—N7—C38124.7 (4)124.0266O5—C14—N4122.4 (4)124.4207
N8—N7—C38125.2 (4)126.336O5—C14—N3116.3 (4)116.5377
N6—N7—N8110.2 (4)109.8148O4—C15—C16122.9 (4)123.6163
N7—N8—C25103.5 (4)104.491O4—C15—N3120.6 (4)121.6167
C14—N3—C15125.2 (4)126.8903N3—C15—C16116.6 (4)114.7192
C13—N4—C14120.4 (4)121.1432O1—C1—N1120.4 (4)120.4475
C1—N1—C2125.6 (4)127.2581O1—C1—C4121.2 (4)122.1526
C2—N2—C3126.7 (4)127.2992N1—C1—C4118.4 (3)117.3323
N5—C25—N8112.6 (4)111.5839N1—C2—N2116.6 (4)114.1451
N8—C25—C32124.5 (4)124.1659O2—C2—N2122.1 (4)123.1933
N5—C25—C32122.9 (4)124.1751O2—C2—N1121.3 (4)122.6287
N6—C26—C31118.0 (4)117.1484N2—C3—C4117.8 (4)116.1018
N6—C26—C27118.8 (4)119.8471O3—C3—N2121.0 (4)120.4432
N7—C38—C39118.2 (4)117.7853N7—C38—C43117.9 (4)118.9108
Table 5. Interaction energies with the ∆E-corrected and ∆EBSSE, respectively, in kcal mol−1 at the B3LYP/6-311G(d,p) level of theory.
Complexes∆ECorrected (kcal/mol)∆EBSSE
TPT–PBT−1.020.0044
TPT–PBT–(PBT−1)–H2O−89.880.0234
TPT–PBT–PBT−1−75.850.0104
Table 6. AIM parameters of the chosen H bonds at the bond critical points (BCPs) for the interaction between the phenobarbitone and triphenyl tetrazolium complexes.
BCPBondBond Lengthρ(r) (a.u.)K(r) (a.u.)V(r) (a.u.)H(r) (a.u.)2ρ(r)
(a.u.)
G(r) (a.u.) V r G r H r   ρ r
12131(H) -- 53(O)2.310590.0124−0.0016−0.0080.00160.04460.00960.83730.129
13853(O) -- 76(H)2.302550.0116−0.0016−0.00760.00160.04340.00920.82390.138
15653(O) -- 38(N)3.132780.0071−0.0007−0.00430.00070.0230.0050.85360.099
16377(H) -- 38(N)2.727300.0062−0.0008−0.00320.00080.01930.0040.8010.129
17484(O) -- 98(H)1.917500.0285−0.0011−0.02350.00110.10250.02460.9570.039
17750(N) -- 2(N)3.244890.0073−0.0007−0.00440.00070.0230.00510.87020.096
18750(N) -- 18(H)2.257730.0172−0.0017−0.01020.00170.05410.01190.85840.099
1912(N) -- 96(O)3.230420.0056−0.0007−0.00410.00070.02140.00470.86170.125
19796(O) -- 86(H)2.018020.0239−0.00138−0.0190.001380.08690.02030.935960.058
20457(O) -- 9(H)2.006900.024−0.002−0.01790.0020.08760.01990.89830.083
20796(O) -- 7(H)3.037560.0029−0.0006−0.00160.00060.01120.00220.73560.207
20996(O) -- 20(H)2.581440.0079−0.001−0.00490.0010.02740.00590.83680.127
22581(O) -- 23(H)2.948300.0039−0.0007−0.00220.00070.01460.0030.76220.179
Table 7. Calculated HOMO(N), HOMO (N + 1), and HOMO (N − 1) energy bands, as well as the chemical potential (μ), electronegativity (χ), global hardness (η), global softness (S), and global electrophilicity indexes (ω) for tetrahydrofuran (IE in eV) and its derivatives at the B3LYP/6-311G(d,p) level.
CompoundsE(N)HOMO
(N)
HOMO
(N + 1)
HOMO
(N − 1)
VerticalEAVerticalIPχμηS (eV−1)ω
Triphenyltetrazolium−25910.0−3.271.28−9.93−0.054.822.39−2.394.870.210.58
Phenobarbitone−21767.7−7.231.75−11.51−0.069.084.51−4.519.150.111.11
Phenobarbitoneanion−21748.4−7.35−1.86−12.023.889.866.87−6.875.990.173.94
Water−2080.2−8.105.58−22.71−3.1612.464.65−4.6515.630.060.69
Complex−71508.1−5.85−0.02−9.0341.347.374.36−4.366.020.171.57
Publisher’s Note: MDPI stays neutral with regard to jurisdictional claims in published maps and institutional affiliations.