


Microstructure Evolution of AZ91 Magnesium Alloy Welded Joint under Magnetic Field and NiCl2 Activated Flux

Abstract
:1. Introduction
2. Materials and Methods
3. Results and Discussion
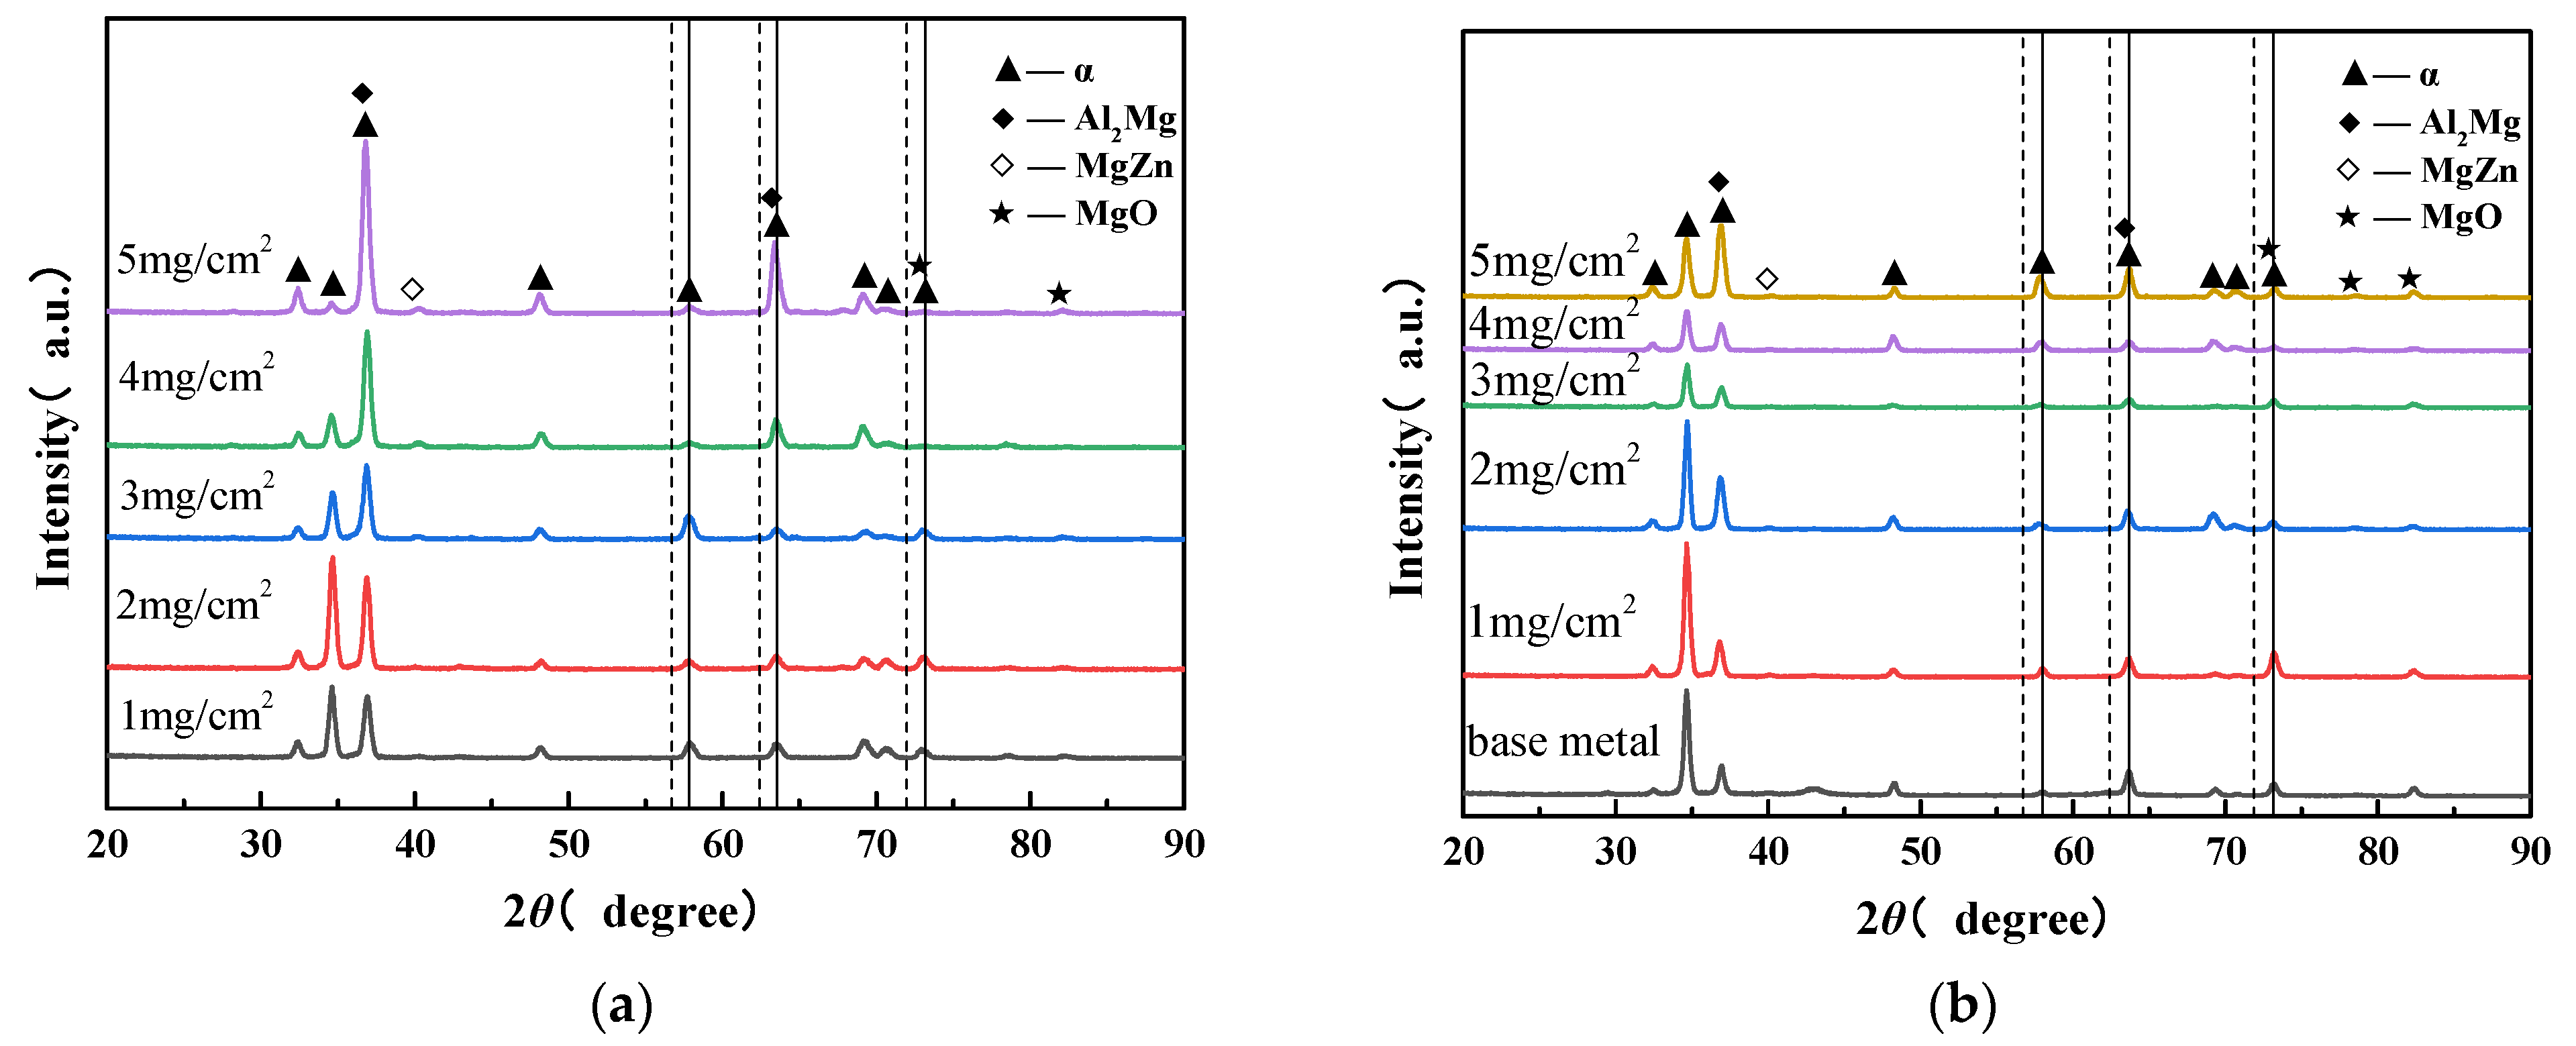
3.1. Phase Composition Analysis
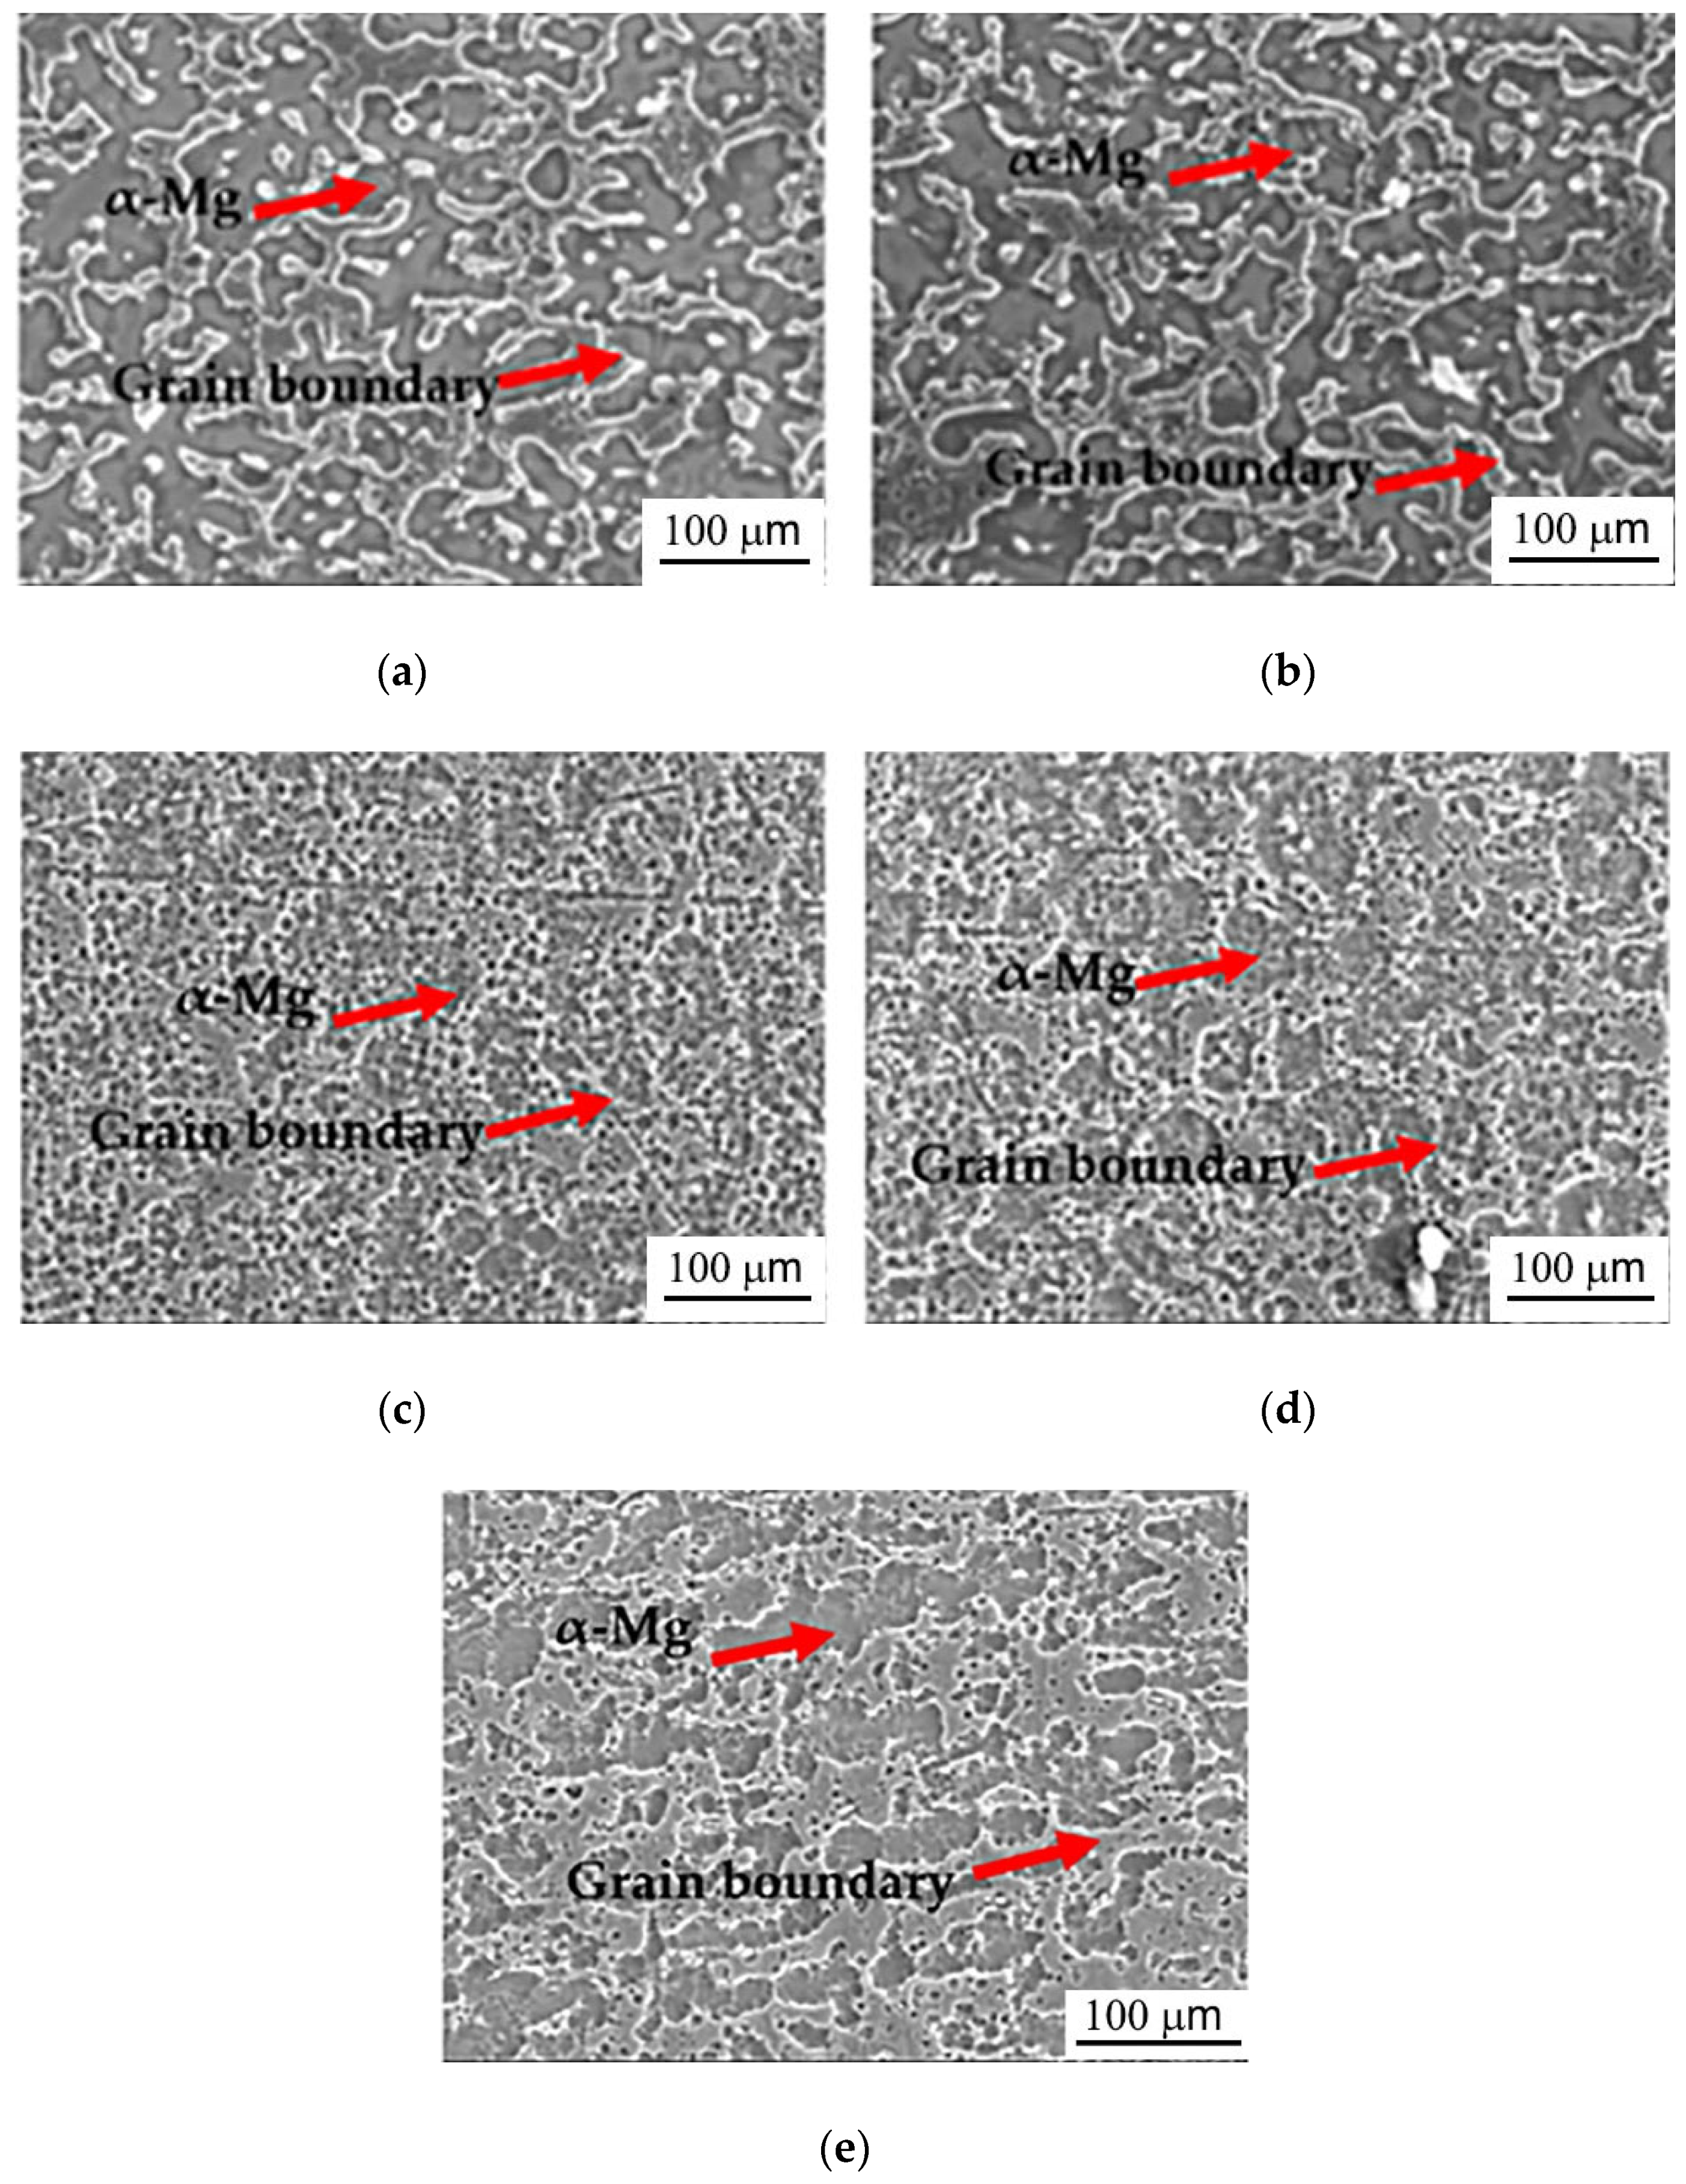
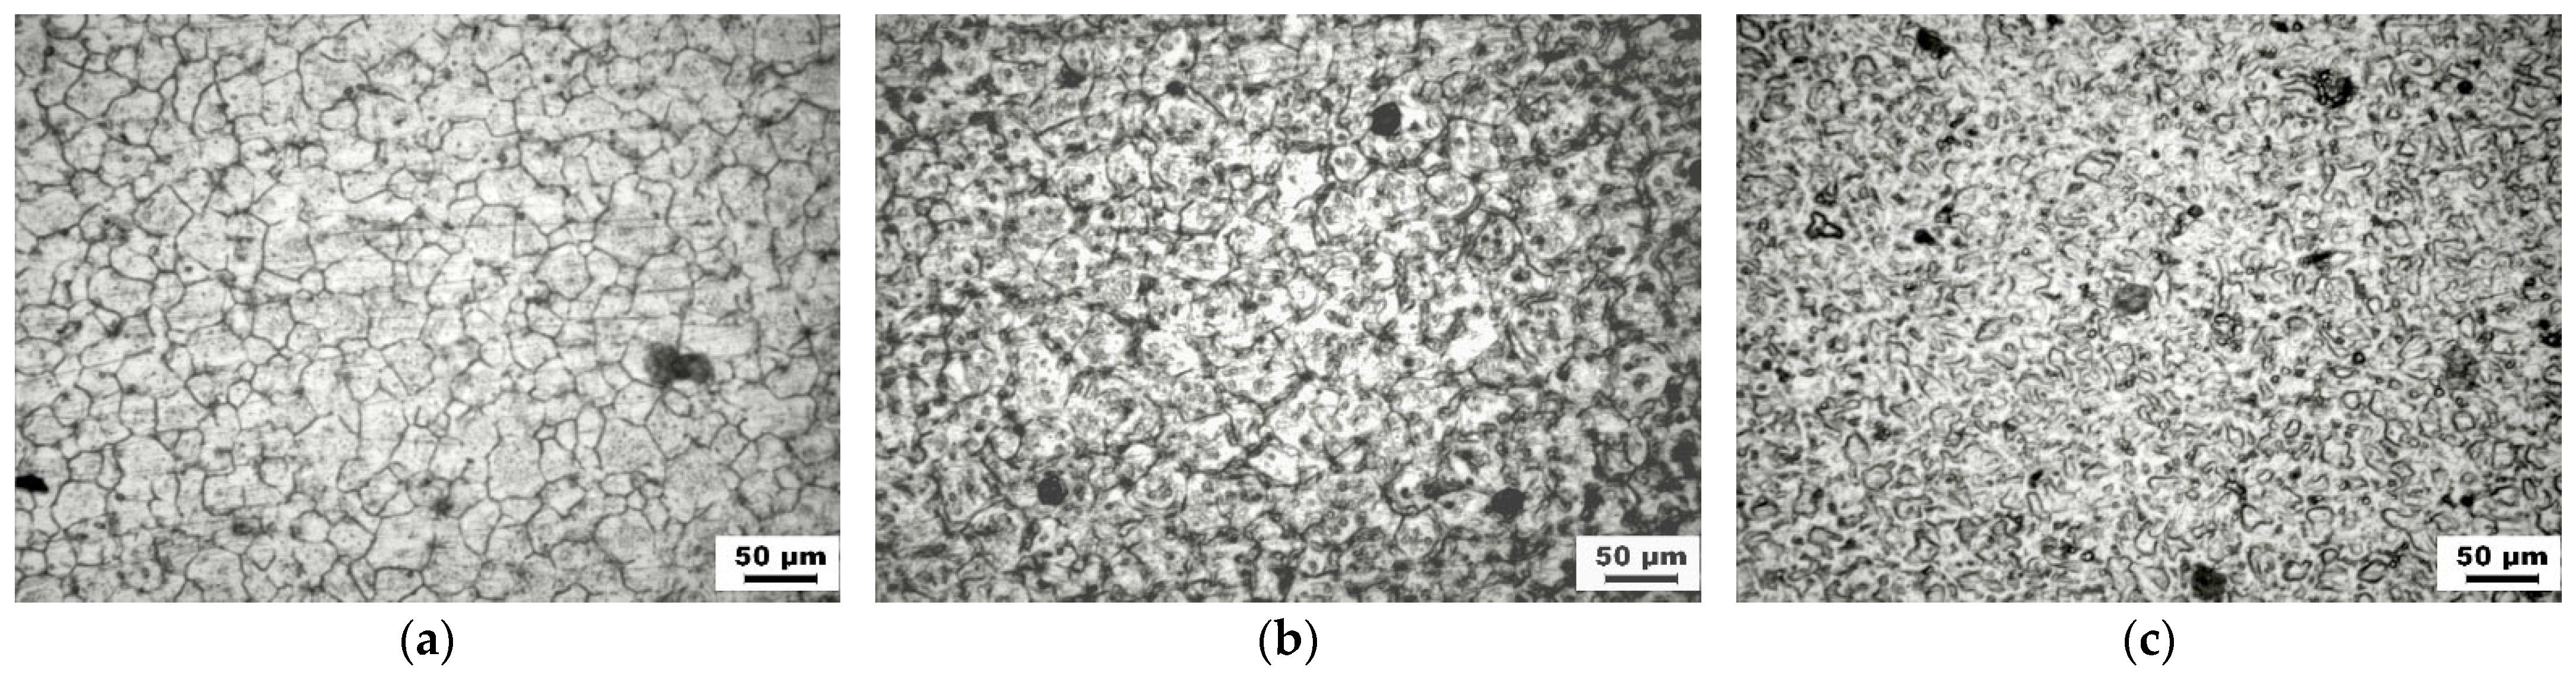
3.2. Microstructure Analysis
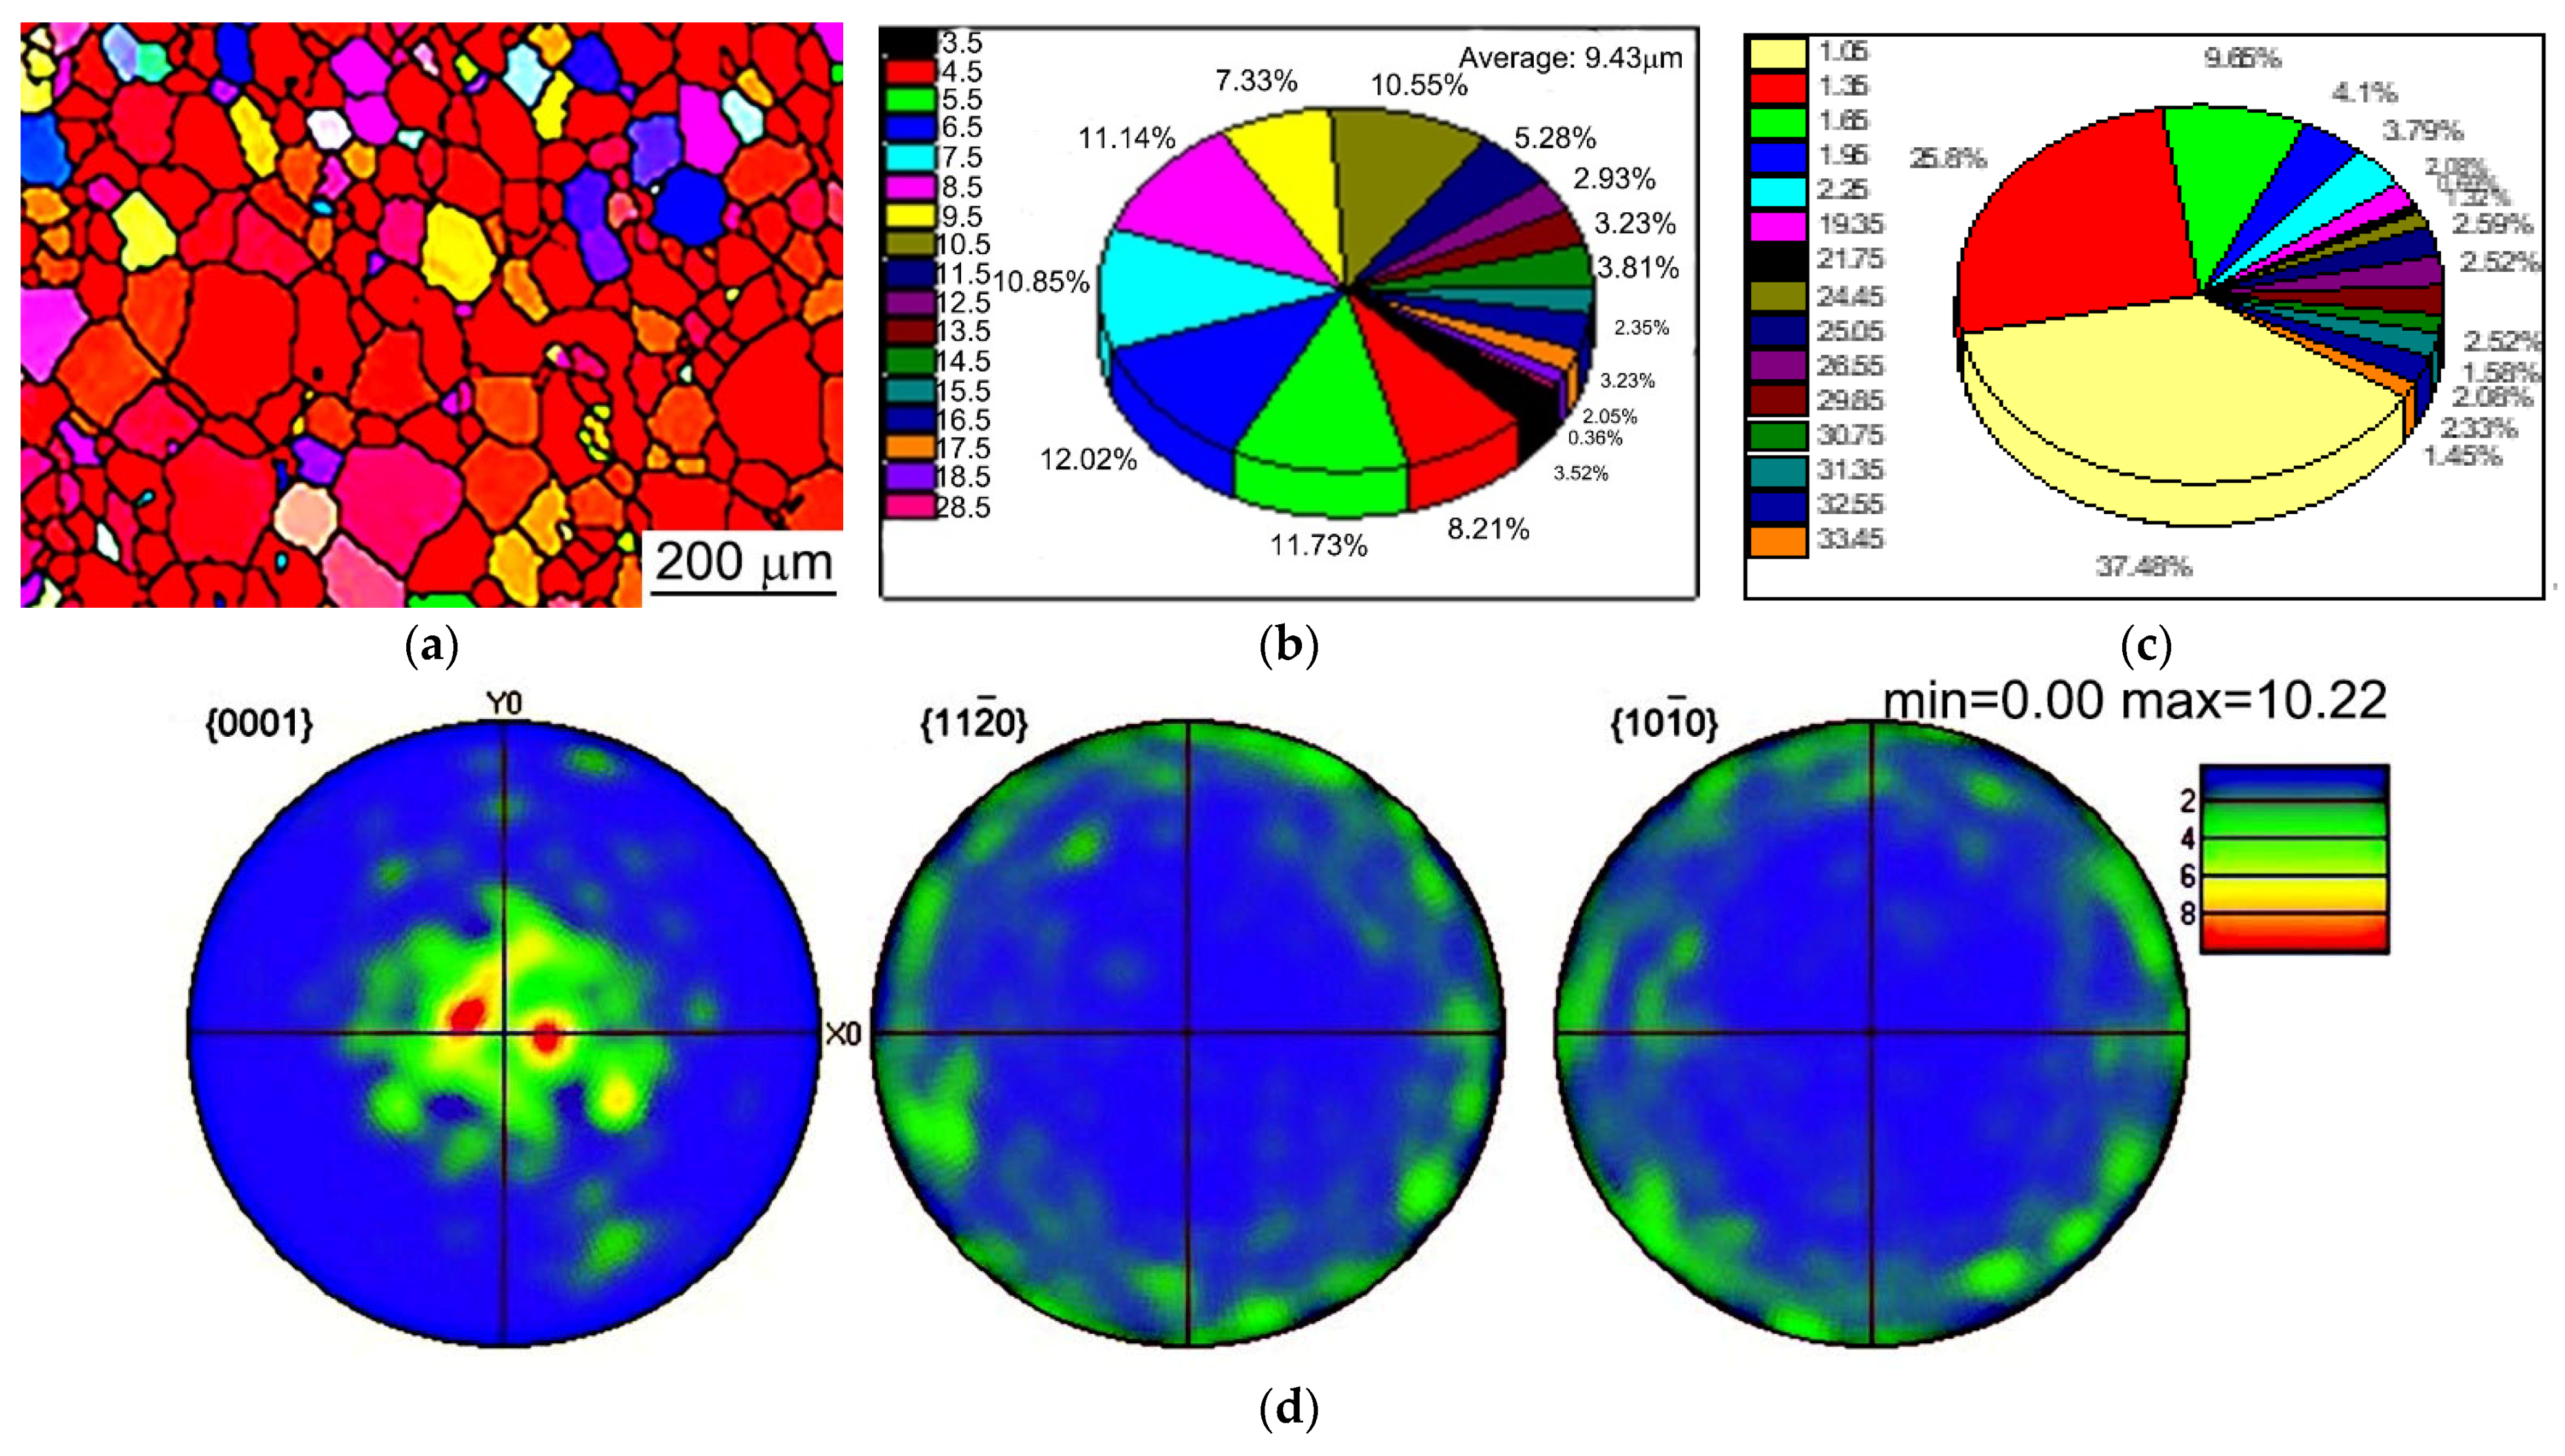
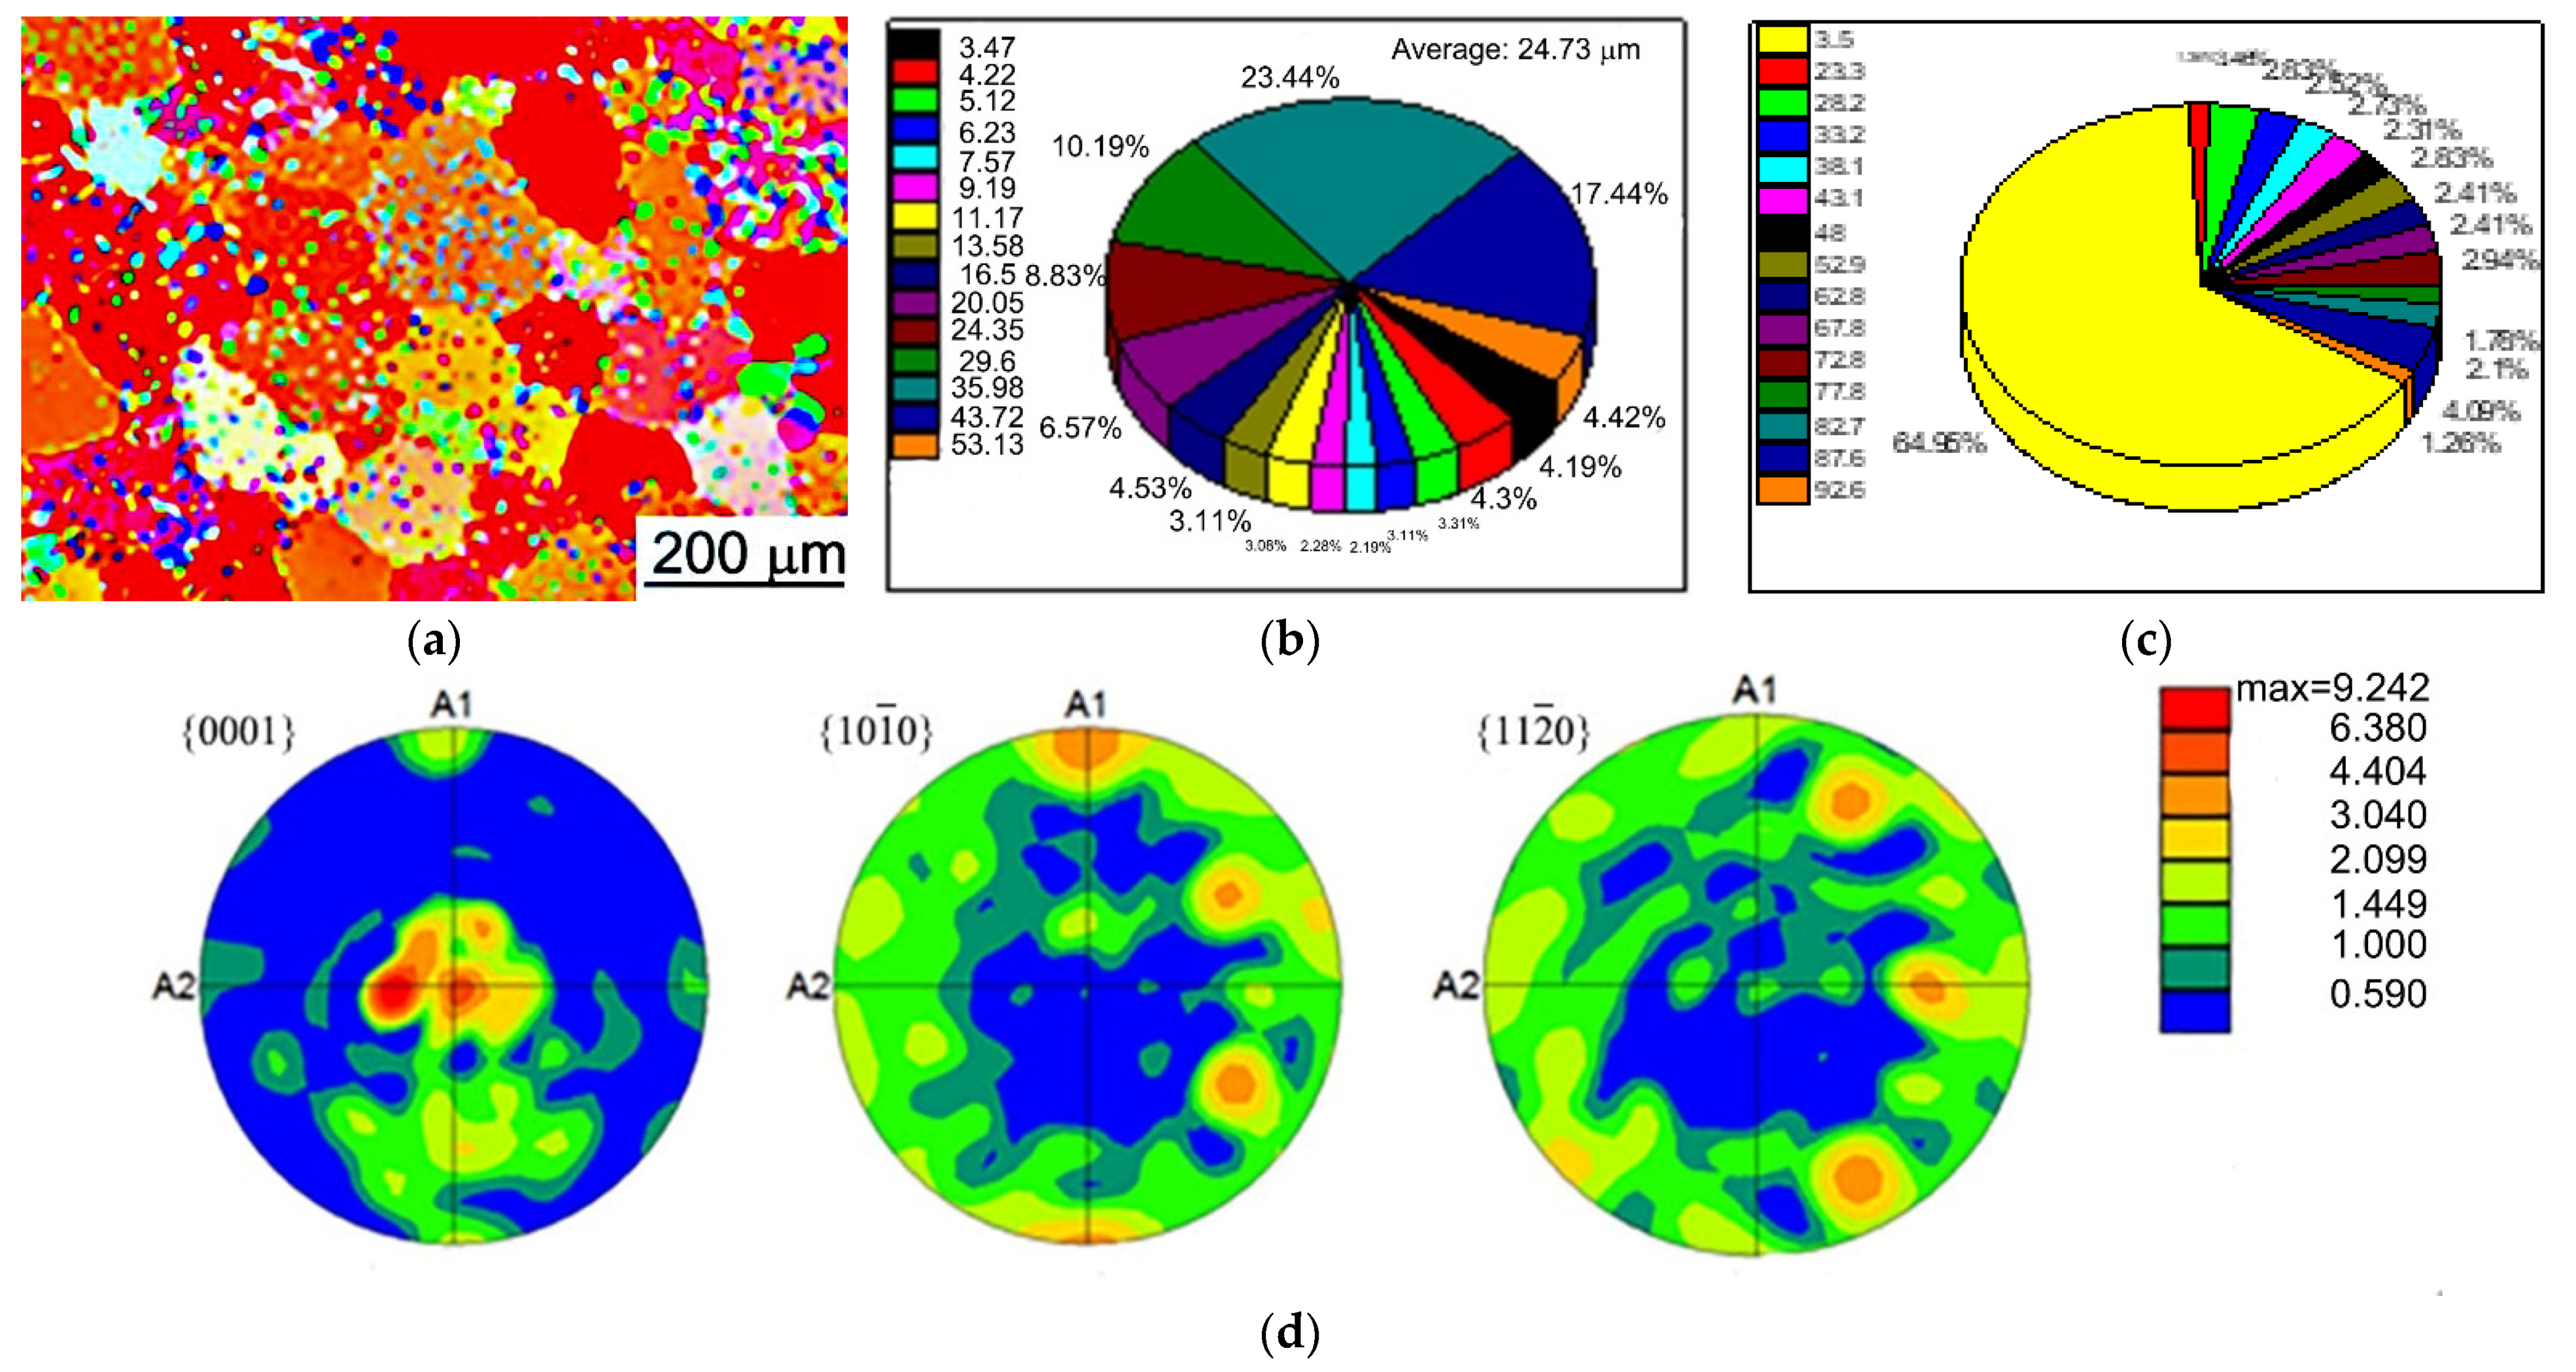
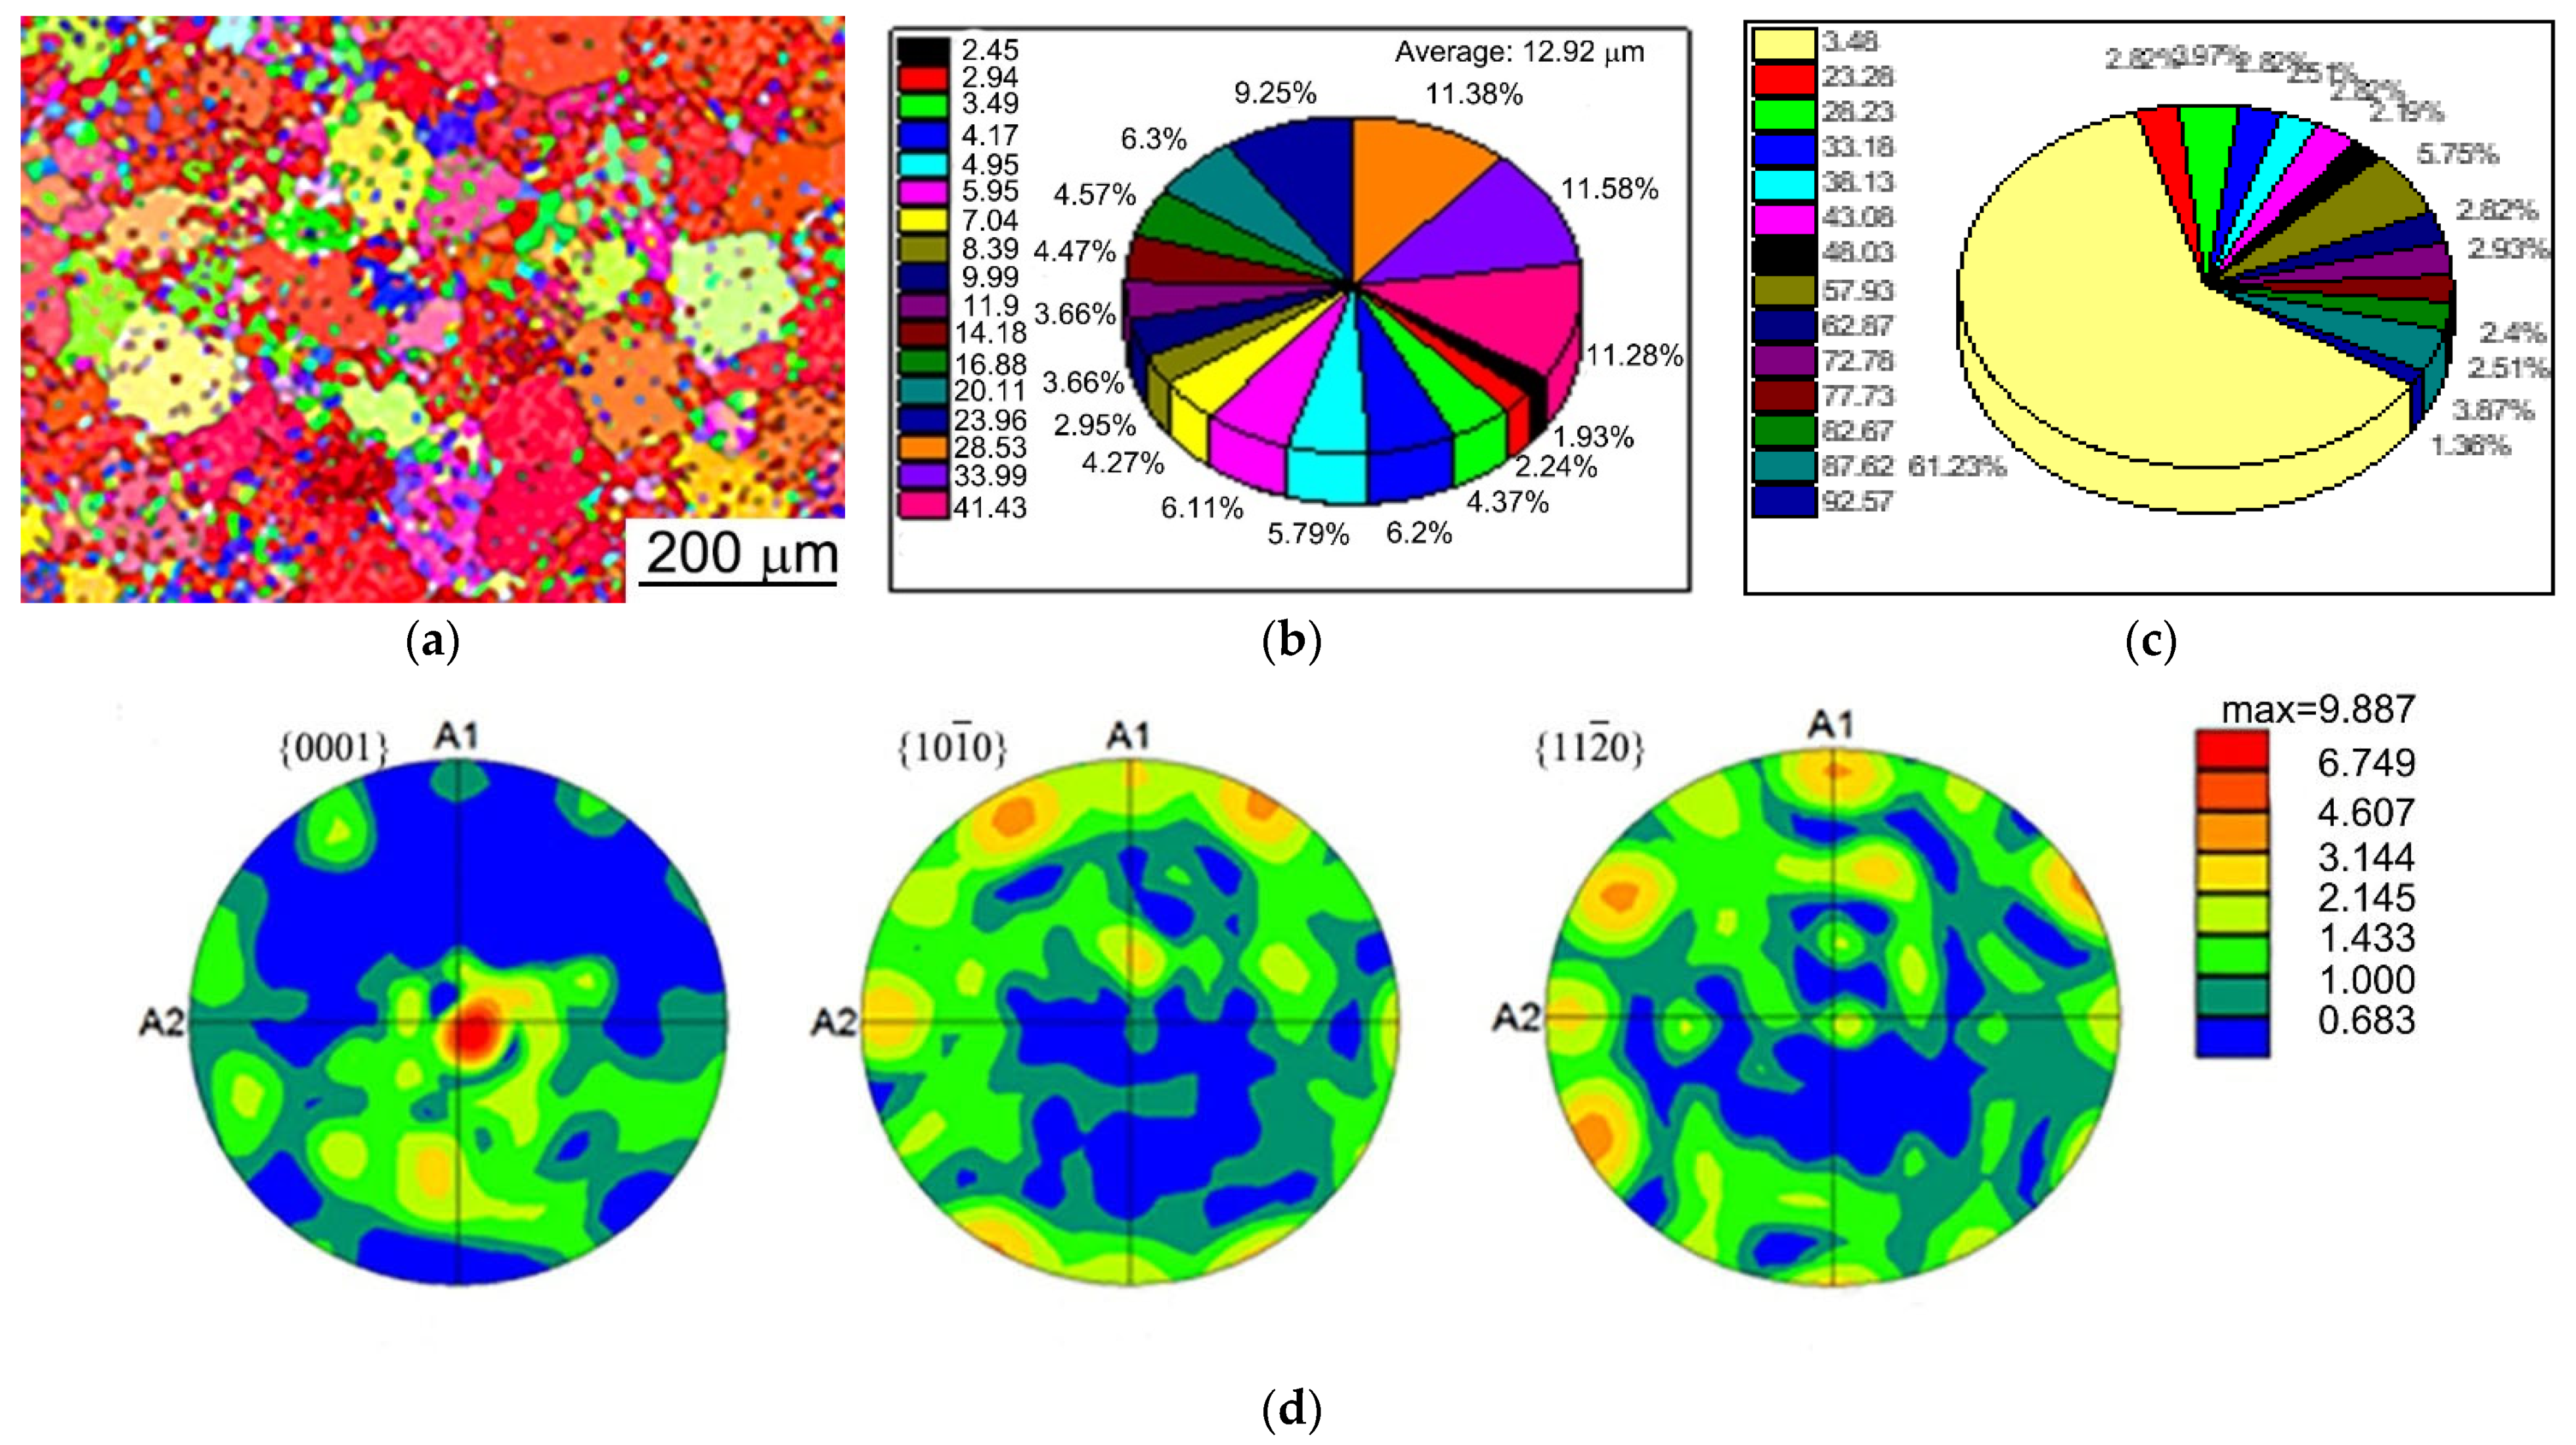
3.3. Change of Grain Size and Orientation of Weld Metal with and without Magnetic Field
4. Conclusions
- The phase composition of the welded joint was not changed under the introduction of magnetic field and activated flux, no new phase was formed. However, the growth patterns of grain in the weld seam and HAZ were different.
- Under the combined action of the magnetic field and activated flux, the grain size of the weld seam was refined. When the coating amount of activated flux was 3 mg/cm2, the finest grain in the weld seam was obtained, which was 12.92 μm. However, the grain size of the weld seam was larger than the base metal.
- The crystallographic characteristics of grain boundaries in the weld seam and base metal both were LAGBs. The misorientation angle and interfacial energy increased with the increase of the coating amount of activated flux. Therefore, more unstable grain boundaries were obtained. The microstructure of the weld seam was messier than the base metal.
- Under the combined action of magnetic field and activated flux, the crystallization nucleation condition of the molten pool was changed, which promoted the formation of twins and made the crystal selectively grow parallel with the (0001) basal plane.
Author Contributions
Funding
Data Availability Statement
Conflicts of Interest
References
- Wendt, A.; Weiss, K.; Ben-Dov, A.; Bamberger, M.; Bronfin, B. Magnesium Castings in Aeronautics Applications Special Requirements. In Essential Reading in Magnesium Technology; Springer: Cham, Switzerland, 2016; Volume 7, pp. 65–69. [Google Scholar]
- Muttana, S.B.; Aggarwal, D. Prospects of magnesium for automotive lightweighting applications—part II. Auto. Tech. Reviw 2015, 4, 18–23. [Google Scholar] [CrossRef]
- Ramalingam, V.V.; Ramasamy, P.; Kovukkal, M.D.; Myilsamy, G. Research and development in magnesium alloys for industrial and biomedical applications: A review. Met. Mater. Int. 2020, 26, 409–430. [Google Scholar] [CrossRef]
- Li, Y.; Cheng, P.Y.; Hua, L. Current application of magnesium alloy in automotive industry and 3C product fields. Jiangxi Nonf. Met. 2007, 21, 30–33. [Google Scholar]
- Lu, C.F.; Li, Y.J.; Zhang, K.; Li, X.G.; Ma, M.L.; Shi, G.L.; Yuan, J.W. Effect of welding current on microstructure and properties of TIG welded EW75 magnesium alloy. Mater. Sci. Forum. 2016, 3960, 142–148. [Google Scholar] [CrossRef]
- Yang, S.Y.; Zhang, B.L. Experimental study of electron beam welding of magnesium alloys Electron beam welding properties of pure magnesium and AZ31 magnesium alloys. Rare Met. 2011, 30, 364–369. [Google Scholar] [CrossRef]
- Asahina, T.; Tokisue, H. Electron beam weldability of pure magnesium and AZ31 magnesium alloy. Mater. Trans. 2001, 42, 2345–2353. [Google Scholar] [CrossRef]
- Zhang, X.B.; Zhan, Y.C. Pulsed Nd: YAG laser spot welding of an AZ31 magnesium alloy. Int. J. Adv. Manuf. Technol. 2019, 104, 3053–3063. [Google Scholar] [CrossRef]
- Shahnam, A.; Karimzadeh, F.; Golozar, M.A.; Hosseini, S.N. Microstructure evolution of ultra-fine- grained AZ31B magnesium alloy produced by submerged friction stir processing. J. Mater. Eng. Perform. 2019, 28, 4593–4601. [Google Scholar] [CrossRef]
- Mironov, S.; Sato, Y.S.; Kokawa, H. Influence of welding temperature on material flow during friction stir welding of AZ31 magnesium alloy. Metall. Mater. Trans. A 2019, 50, 2798–2806. [Google Scholar] [CrossRef]
- Hu, Y.B.; Zhao, C.; Deng, J. Research status and prospects of magnesium alloys welding technology. Hot Work. Technol. 2010, 39, 124–128. [Google Scholar]
- Maduraimuthu, V.; Vasudevan, M.; Parameswaran, P. Studies on improvement of toughness in modified 9Cr-1Mo steel A-TIG weld joint. Trans. Indian Inst. Met. 2015, 68, 181–189. [Google Scholar] [CrossRef]
- Gao, X.G.; Dong, J.H.; Han, X. Effect of RE2O3 (RE = La, Ce) fluxes on A-TIG welding of Ti6Al4V. Int. Adv. Manuf. Technol. 2017, 91, 1181–1188. [Google Scholar] [CrossRef]
- Liu, H.L.; Wu, T.M. Effects of activating flux on weld bead geometry of inconel 718 alloy TIG welds. Mater. Manuf. Process. 2012, 27, 1457–1461. [Google Scholar]
- Maduraimuthu, V.; Vasudevan, M.; Muthupandi, V.; Bhaduri, A.K.; Jayakumar, T. Effect of activated flux on the microstructure, mechanical properties, and residual stressed of modified 9Cr-1Mo steel weld joints. Metall. Mater. Trans. B 2012, 43, 123–132. [Google Scholar] [CrossRef]
- Mary, M. Theoretical and experimental assessment of chloride effects in the A-TIG welding of magnesium. Weld. World 2002, 46, 7–21. [Google Scholar] [CrossRef]
- Liu, L.M.; Zhang, Z.D.; Song, G.; Wang, L. Mechanisum and microstructure of oxide fluxes for gas tungsten arc welding of magnesium alloy. Metall. Mat. Trans. A 2007, 38, 649–658. [Google Scholar] [CrossRef]
- Zhang, Z.D.; Liu, L.M.; Sun, H.; Wang, L. AC TIG welding with single-component oxide activating flux for AZ31B magnesium alloys. J. Master. Sci. 2008, 43, 1382–1388. [Google Scholar] [CrossRef]
- Huang, Y.; Fan, D.; Lin, T.; Shao, F. Effects of activating fluxes on DCSP A-TIG weld penetration of magnesium alloy. Trans. China Weld. Inst. 2007, 28, 21–24. [Google Scholar]
- Shen, J.; Wang, L.Z.; Peng, D.; Wang, D. Effects of CaF2 coating on the microstructures and mechanical properties of tungsten inert gas welded AZ31 magnesium alloy joints. Metall. Mat. Trans. A 2012, 43, 4397–4405. [Google Scholar] [CrossRef]
- Liu, Z.J.; Lu, L.; Su, Y.H. Weld penetration increasing mechanism of magnesium alloy with oxide activating fluxes. J. Shenyang Univ. Technol. 2015, 37, 138–147. [Google Scholar]
- Qin, B.; Yin, F.C.; Zeng, C.Z.; Xie, J.C.; Shen, J. Microstructure and mechanical proerties of TIG/A-TIG welded AZ61/ZK60 magnesium alloy joints. Trans. Nonferrous Met. Soc. 2019, 29, 1864–1872. [Google Scholar] [CrossRef]
- Shen, J.; Zhai, D.J.; Liu, K.; Cao, Z.M. Effects of welding current on properties of A-TIG welded AZ31 magnesium alloy joints with TiO2 coating. Trans. Nonferrous Met. Soc. China 2014, 24, 2507–2515. [Google Scholar] [CrossRef]
- Li, S.Z. Effects of the Welding Parameters and Hot Treatment on the Microstructures and Mechanical Properties of Tungsten Inert Gas Welded AZ31B Magnesium Alloy Joints. Master’s Thesis, Chongqing University Chongqing, Chongqing, China, 2013. [Google Scholar]
- Zhou, M.B.; Shen, J.; Hu, D.; Gao, R.H.; Li, S.Z. Effects of heat treatment on the activated flux TIG-welded AZ31 magnesium alloy joints. Int. J. Adv. Manuf. Technol. 2017, 92, 3983–3990. [Google Scholar] [CrossRef]
- Shen, J.; Liu, K.; Li, Y.; Li, S.Z.; Wen, L.B. Particles and microstructures and mechanical properties of nanoparticles strengthening A-TIG(NSA-TIG) welded magnesium alloy joints. Sci. Technol. Weld. Join. 2013, 18, 404–413. [Google Scholar] [CrossRef]
- Liu, X.G.; Guan, Z.Q.; Zhang, H.X.; Chang, Y.L. Research status and future prospects of magnesium control TIG welding technology. Hot Work. Technol. 2019, 48, 1–5. [Google Scholar]
- Huang, M.Q.; Zhou, Q.; Liu, F.; Huang, J.J. Effect of DC magnetic field on solidifield structure and mechanical properties of AZ91D magnesium alloy. Spec. Cast. Nonferr. Alloy 2016, 36, 320–323. [Google Scholar]
- Demchenko, V.L.; Yurhenko, M.V. Structure and properties of the welded joints of single-type polyethylenes formed under the action of constant magnetic fields. Mater. Sci. 2017, 53, 186–193. [Google Scholar] [CrossRef]
- Hu, S.P.; Chen, L.P.; Zhou, Q.; Wang, J.; Zhang, L.; Wu, H. Effects of compound magnetic field of pulsed and alternate field on solidified structure and mechanical properties of AZ31 magnesium alloy. Spec. Cast. Nonferr. Alloy 2018, 38, 303–308. [Google Scholar]
- Su, Y.H.; Jiang, H.W.; Wu, D.; Liu, Z.J. Optimum design of magnesium alloy welding parameters with GTAW under magnetic field. Trans. China Weld. Inst. 2012, 33, 85–88. [Google Scholar]
- Su, Y.H.; Jiang, H.W.; Qin, H.; Liu, Z.J. Forming characteristics, microstructure and properties of magnesium alloy during TIG welding under magnetic field. Trans. China Weld. Inst. 2013, 34, 85–88. [Google Scholar]
- Su, Y.H.; Liu, Z.J.; Liu, D. Effect of magnetic field frequency on microstructure and properties of AZ31 magnesium alloy welded joint with GTAW. Adv. Mater. Res. 2011, 1335, 882–885. [Google Scholar] [CrossRef]
- Zhang, G.Q.; Ren, Y.L.; Su, Y.H. Research for microstructure and mechanical properties of AZ91 magnesium alloy welded joint with magnetic field and activated flux. Mater. Res. Express 2020, 7, 056511. [Google Scholar]
- Patterson, A. The Scherrer Formula for X-Ray Particle Size Determination. Phys. Rev. 1939, 56, 978–982. [Google Scholar] [CrossRef]
- Li, S.B.; Yang, J.T.; Du, W.B. A review on thermal conductivity of magnesium and its alloys. J. Magnes. Alloy. 2020, 8, 78–90. [Google Scholar] [CrossRef]
- Wang, X.W.; Wang, C.J.; Liu, Y. An energy based modeling for the acoustic softening effect on the Hall-Petch behavior of pure titanium in ultrasonic vibration assisted micro-tension. Int. J. Plast. 2020, 136, 102879. [Google Scholar] [CrossRef]
- Hu, G.Y.; Cai, X.; Rong, Y.H. Fundamentals of Materials Science; Shanghai Jiaotong University Press: Shanghai, China, 2010. [Google Scholar]
- Mao, W.P.; Yang, P.; Chen, L. Material Texture Analysis Principle and Detection Technology; Metallurgical Industry Press: Beijing, China, 2008. [Google Scholar]
- Zhang, X.Y.; Tu, J.; Liu, Q. High-resolution electron microscopy study of the {10-11} twin boundary and twinning dislocation analysis in deformed polycrystalline cobalt. Scr. Mater. 2012, 67, 991–994. [Google Scholar] [CrossRef]
- Zhang, X.Y.; Zhu, Y.T.; Liu, Q. Deformation twinning in polycrystalline Co during room temperature dynamic plastic deformation. Scr. Mater. 2010, 63, 387–390. [Google Scholar] [CrossRef]


| Al | Zn | Mn | Si | Cu | Fe | Mg |
|---|---|---|---|---|---|---|
| 8.3–9.7 | 0.35–1 | 0.15–0.5 | <0.01 | <0.03 | <0.005 | Balance |
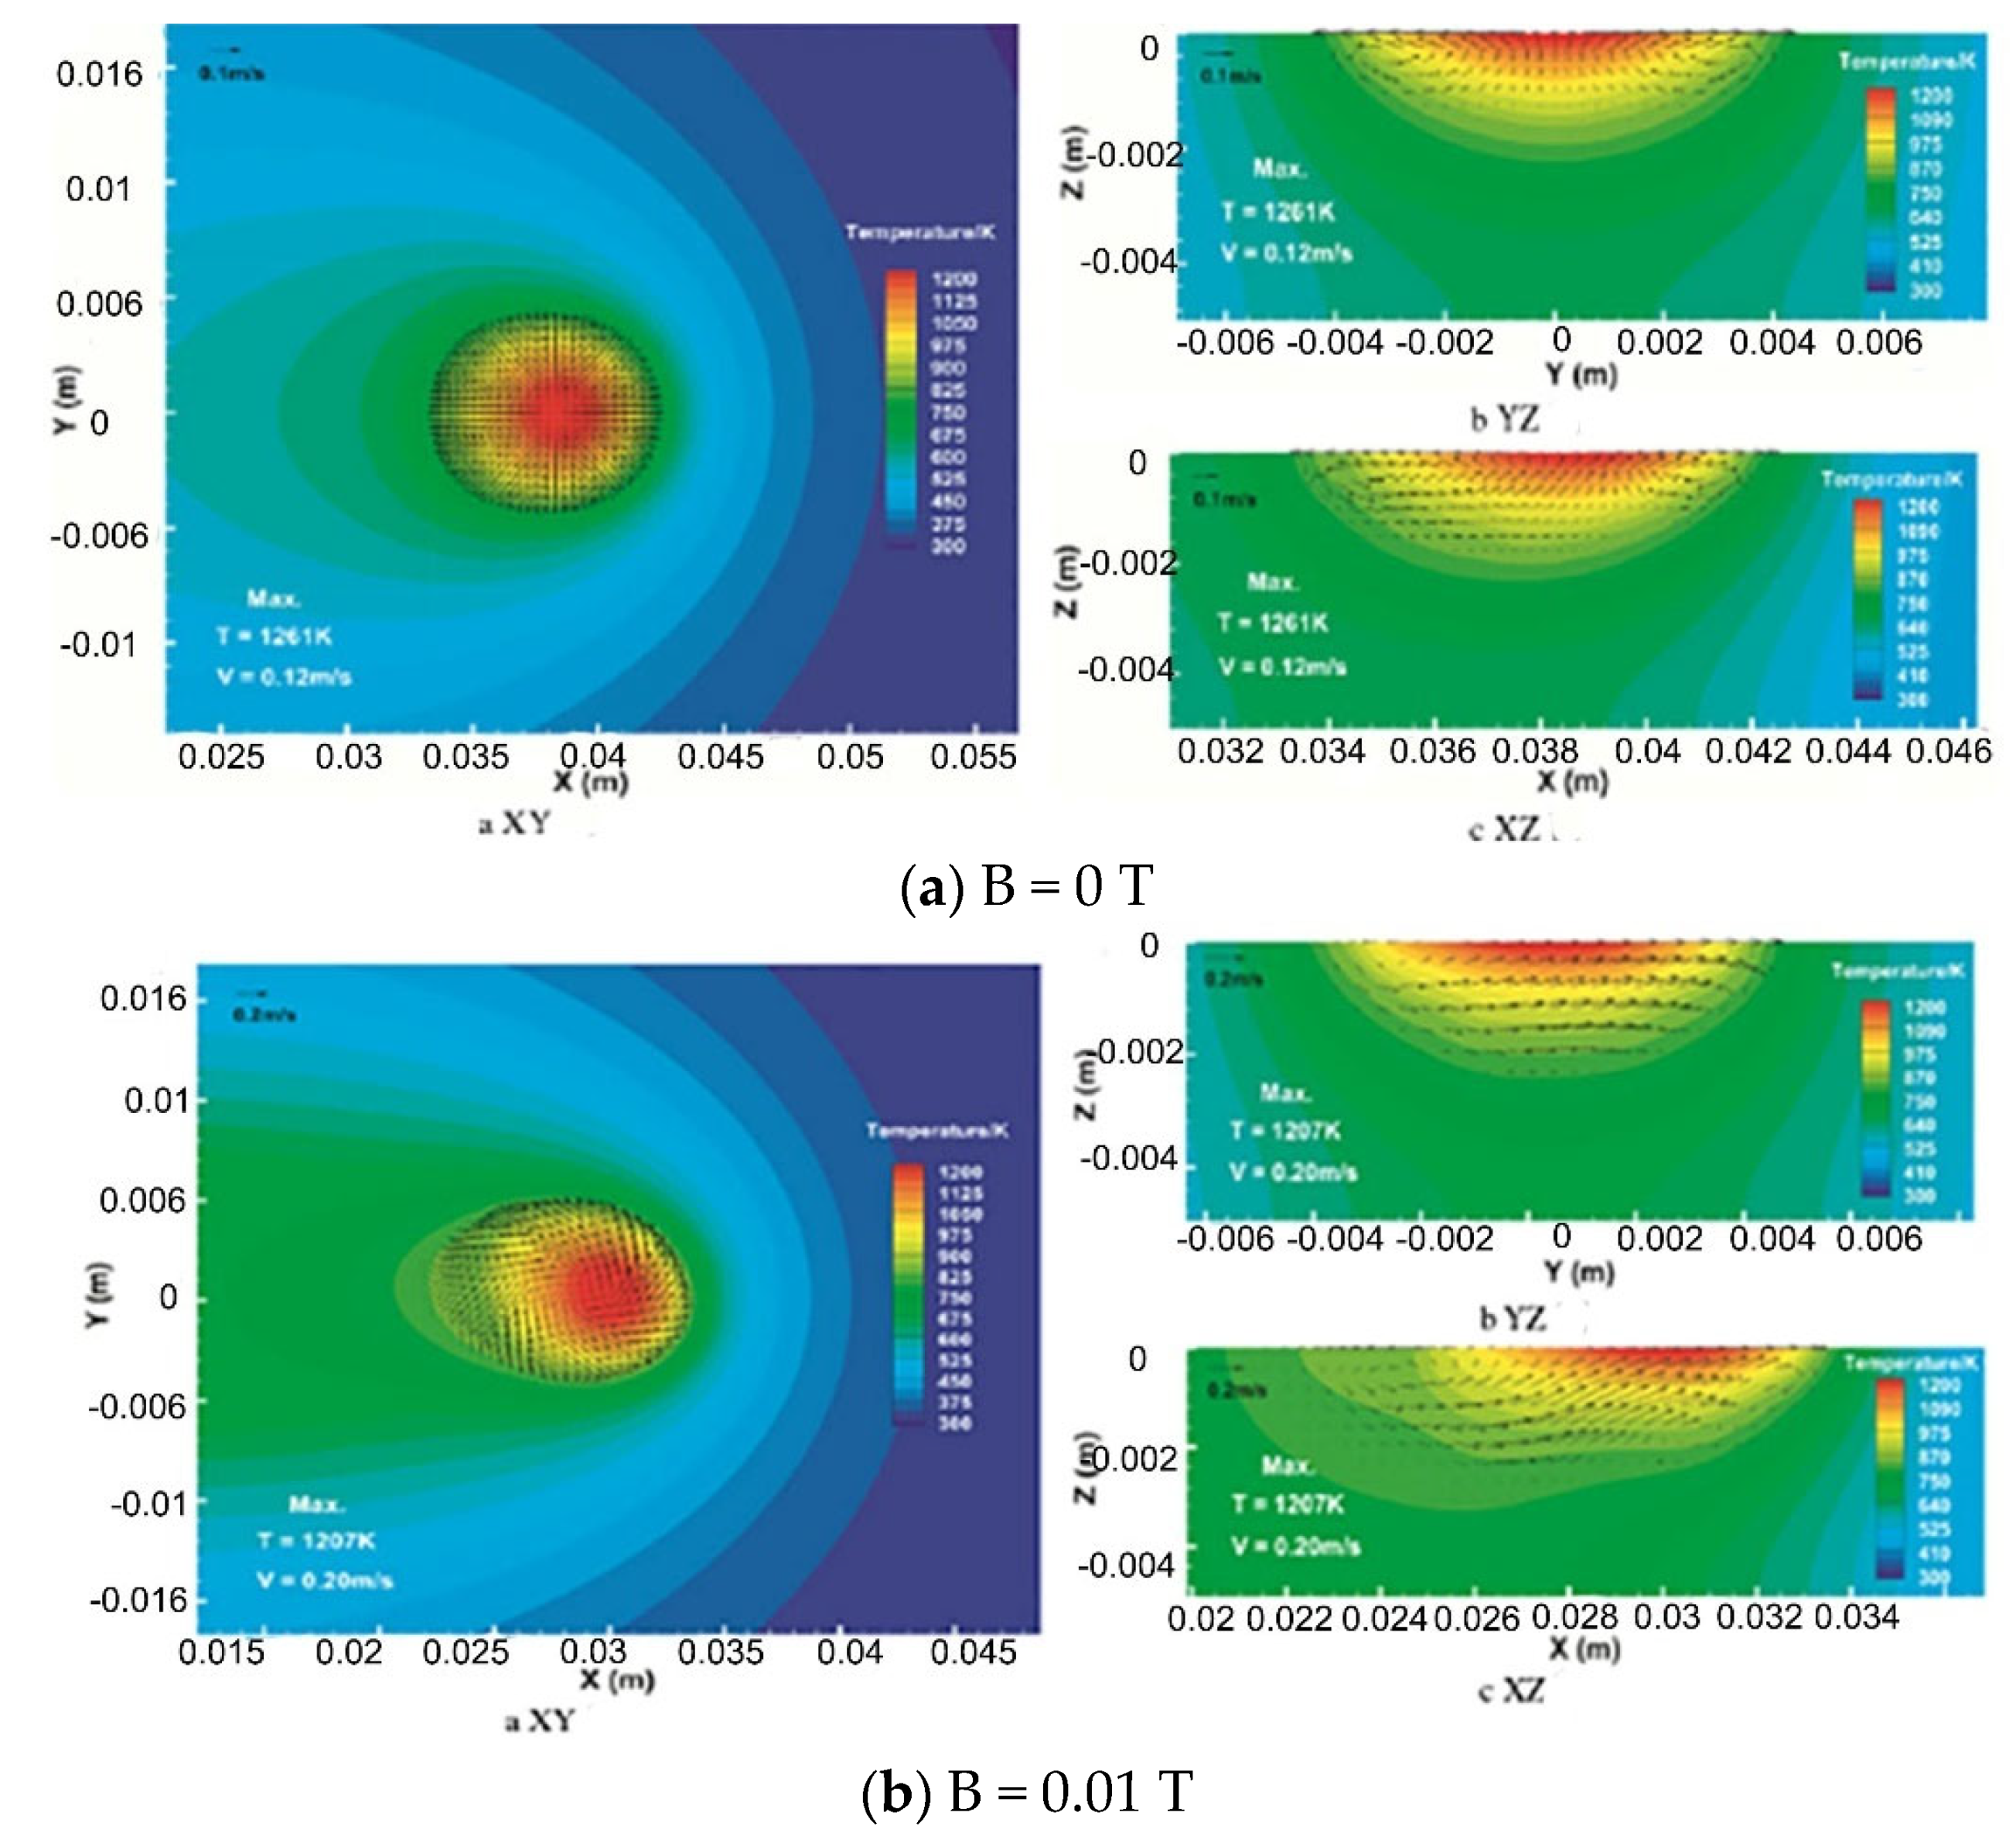
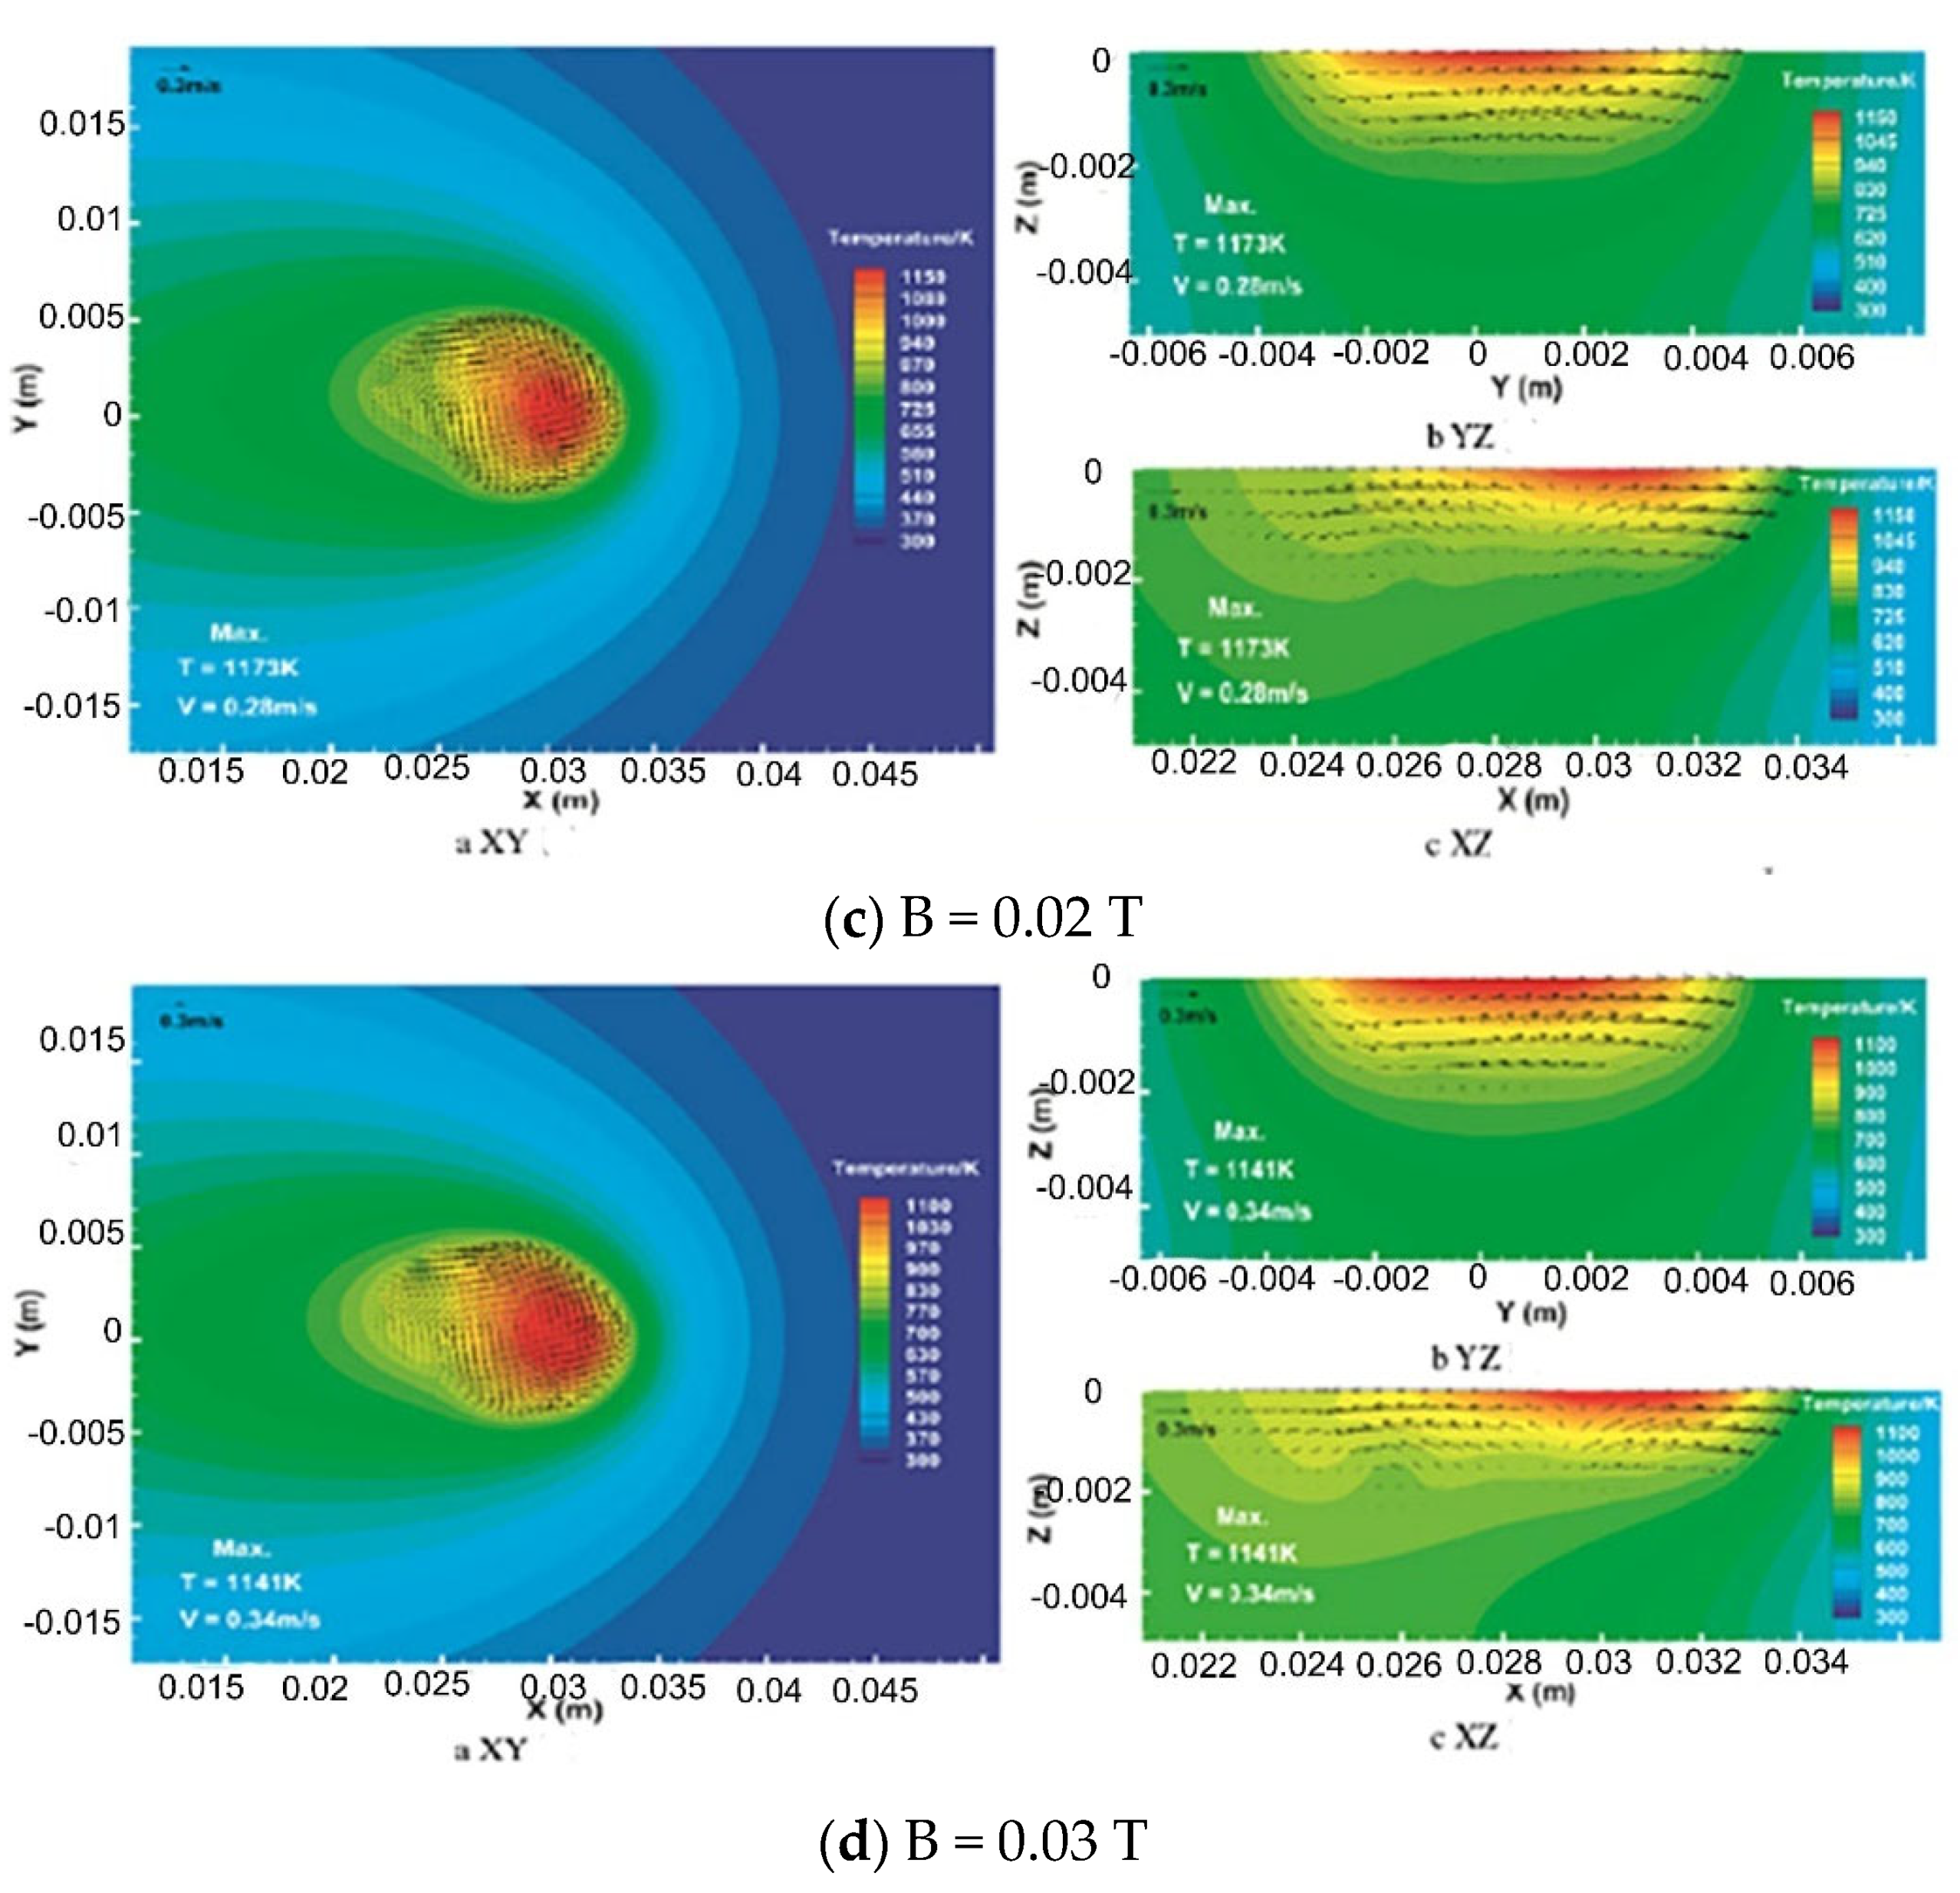
| Number | Magnetic Field Intensity B/T | Maximum Temperature T/K | Maximum Flow Rate υ/m·s−1 | Movement Form |
|---|---|---|---|---|
| 1 | 0 | 1261 | 0.12 | The center moves freely around in an axisymmetric shape |
| 2 | 0.01 | 1207 | 0.2 | Directional rotary motion, non axisymmetric, with vortex at the tail |
| 3 | 0.02 | 1173 | 0.28 | Directional rotary motion, in non axisymmetric form, with vortex trailing behind |
| 4 | 0.03 | 1141 | 0.34 | Directional rotary motion, in non axisymmetric form, with vortex trailing behind |
Publisher’s Note: MDPI stays neutral with regard to jurisdictional claims in published maps and institutional affiliations. |
© 2022 by the authors. Licensee MDPI, Basel, Switzerland. This article is an open access article distributed under the terms and conditions of the Creative Commons Attribution (CC BY) license (https://creativecommons.org/licenses/by/4.0/).
Share and Cite
Zhang, G.; Ren, Y.; Su, Y. Microstructure Evolution of AZ91 Magnesium Alloy Welded Joint under Magnetic Field and NiCl2 Activated Flux. Crystals 2022, 12, 1389. https://doi.org/10.3390/cryst12101389
Zhang G, Ren Y, Su Y. Microstructure Evolution of AZ91 Magnesium Alloy Welded Joint under Magnetic Field and NiCl2 Activated Flux. Crystals. 2022; 12(10):1389. https://doi.org/10.3390/cryst12101389
Chicago/Turabian StyleZhang, Guiqing, Yinglei Ren, and Yunhai Su. 2022. "Microstructure Evolution of AZ91 Magnesium Alloy Welded Joint under Magnetic Field and NiCl2 Activated Flux" Crystals 12, no. 10: 1389. https://doi.org/10.3390/cryst12101389
APA StyleZhang, G., Ren, Y., & Su, Y. (2022). Microstructure Evolution of AZ91 Magnesium Alloy Welded Joint under Magnetic Field and NiCl2 Activated Flux. Crystals, 12(10), 1389. https://doi.org/10.3390/cryst12101389